Movatterモバイル変換


[0]ホーム

URL:


Skip to main page content
U.S. flag

An official website of the United States government

Dot gov

The .gov means it’s official.
Federal government websites often end in .gov or .mil. Before sharing sensitive information, make sure you’re on a federal government site.

Https

The site is secure.
Thehttps:// ensures that you are connecting to the official website and that any information you provide is encrypted and transmitted securely.

NIH NLM Logo
Log inShow account info
Access keysNCBI HomepageMyNCBI HomepageMain ContentMain Navigation
pubmed logo
Advanced Clipboard
User Guide

Full text links

Silverchair Information Systems full text link Silverchair Information Systems Free PMC article
Full text links

Actions

Share

.2009 Aug;37(14):4873-86.
doi: 10.1093/nar/gkp471. Epub 2009 Jun 22.

Stochastic noise in splicing machinery

Affiliations

Stochastic noise in splicing machinery

Eugene Melamud et al. Nucleic Acids Res.2009 Aug.

Abstract

The number of known alternative human isoforms has been increasing steadily with the amount of available transcription data. To date, over 100 000 isoforms have been detected in EST libraries, and at least 75% of human genes have at least one alternative isoform. In this paper, we propose that most alternative splicing events are the result of noise in the splicing process. We show that the number of isoforms and their abundance can be predicted by a simple stochastic noise model that takes into account two factors: the number of introns in a gene and the expression level of a gene. The results strongly support the hypothesis that most alternative splicing is a consequence of stochastic noise in the splicing machinery, and has no functional significance. The results are also consistent with error rates tuned to ensure that an adequate level of functional product is produced and to reduce the toxic effect of accumulation of misfolding proteins. Based on simulation of sampling of virtual cDNA libraries, we estimate that error rates range from 1 to 10% depending on the number of introns and the expression level of a gene.


Figures

Figure 1.
Figure 1.
Example analysis of EST sequences. In this hypothetical example, the major isoform of a gene has six introns and seven ESTs have been observed in a library. Three of the ESTs sequences (EST3, EST4, EST5) contain alternative introns—introns that differ at the 3′ and/or 5′ end from corresponding intron in the major isoform. The fractional abundance of alternative transcripts is 42% (3 out of 7). The number of isoforms for this gene is 3 (major isoform, EST3 isoform and EST5 isoforms). EST4 is not counted as an additional isoform because it has the same pattern as EST3. There are a total of 13 detected splicing reactions (count of all introns from all ESTs) and 3 of these splicing reactions are classified as alternative. The implied error rate for this gene is 0.23 (3 out of 13 splicing reactions).
Figure 2.
Figure 2.
Isoform distribution. (A) Distribution of number of alternative isoforms per gene derived from all 8674 Human Unigene EST libraries (15 342 genes ∼5 313 000 EST sequences). The first bar contains the 2013 genes (13%) with no observed alternative isoforms. The median number of isoforms per gene is 4. (B) Fractional abundance of alternative transcripts. For each gene in the CGAP set with a least one minor isoform (1269 out of 14 397 genes). EST sequences of a gene were compared to the major isoform to identify alternative splicing events (see Methods section). We then calculate the fractional abundance of alternative transcripts as the total number of ESTs with one or more alternative introns divided by the total number of ESTs. The median fractional abundance of alternative transcripts is ∼9%.
Figure 3.
Figure 3.
Increase in observed number of isoforms as a function of number of introns and EST observations. Genes from the CGAP set were divided into a 10 × 10 matrix, according to the number of sampled introns in the major isoform and the number of observed ESTs per gene (each group contains ∼140 genes). The mean number of observed isoforms was calculated for each matrix element. As can be seen in the plot, the number of isoforms increases as a function of both the number of introns per gene and the number of sampled ESTs per gene.
Figure 4.
Figure 4.
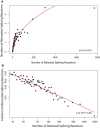
Dependence of alternative splicing events on number of splicing reactions. The number of detected splicing reactions is the number of all introns that have been observed in all EST sequences of a gene. The number of alternative splicing reactions is a count of introns that differ in 5′ and/or 3′ splice site from the corresponding intron in the major isoform. (A) Mean number of splicing reactions versus mean number of alternative splicing reactions. The increase in number of alternative splicing reactions is nonlinear. (B) Ratio of alternative splicing events to number of splicing reactions, as a function of number of reactions plotted on log–log scale. Genes with many splicing reactions make fewer mistakes, producing a decreased fraction of alternative introns. (Genes in the CGAP subset were divided into ∼100 equal-size groups based on number of splicing reactions.).
Figure 5.
Figure 5.
Binary isoforms. Simulation and sampling of the isoform composition of a gene with 10 virtual transcripts and 6 introns. Exons are shown as rectangles. Alternative splicing events are indicated by red intron bridges. The binary intron representation is shown above each bridge, with the symbol ‘1’ indicating an alternative splicing event, and the symbol ‘0’ representing a major splicing event. In the set of 10 there are total of six alternative transcripts (those with at least one ‘1': transcripts 2, 4, 5, 7, 8 and 9) with five unique alternative isoforms (one pattern occurs twice, in transcripts 4 and 5). In this example, we assume that partial message sequencing only included the colored exons. With this particular sequencing, three alternative transcripts are selected (4, 5 and 7), containing two of the five unique alternative isoforms (represented by the patterns 01 and 010). If an EST sequence contains zero introns, it is truncated to a null string, illustrated with transcripts 6, 8 and 10.
Figure 6.
Figure 6.
Model 1. Simulation of sampling in a virtual cDNA library with 1000 cells. Transcripts generated with a constant error rate. Red points—simulation result with error rate of 1%. Black points—observed data in the CGAP Library Subset. (A) Fraction of alternative splicing reactions produced by the model compared to observed value. (B) Number of detected alternative isoforms per gene distribution. (C) Increase in number of detected alternative isoforms as a function of number of detected splicing reactions. (D) Fractional abundance of alternative transcripts. With the exception of the number of isoforms per gene (B), this model is a poor fit to observed data.
Figure 7.
Figure 7.
Model 2. Simulation of sampling in a virtual cDNA library with 1000 cells. The error rate varies with the number of introns in a gene, and transcripts are generated with an error rate determined by Equation (3) withα = 0.25. Red points—predicted data. Black points—observed data in the CGAP Library Subset. (A) Fraction of alternative splicing reactions produced by the model compared to observed value. (B) Number of detected alternative isoforms per gene distribution. (C) Increase in number of detected alternative isoforms as a function of number of detected splicing reactions. (D) Fractional abundance of alternative transcripts. Model 2 produces a better fit to the observed data at a low number of splicing reactions, but fails for high (>100) numbers of splicing reactions.
Figure 8.
Figure 8.
Model 3. Simulation of sampling in a virtual cDNA library with 1000 cells. The error rate varies with the number of introns and the expression level of a gene, and transcripts generated with error rates determined by Equation (5) with parameter valuesα = 0.3 andβ = 0.015. Simulation in red, observed data in black (CGAP Subset). (A) Fraction of alternative splicing reactions produced by the model compared to observed value. (B) Number of detected alternative isoforms per gene distribution. (C) Increase in number of detected alternative isoforms as a function of number of detected splicing reactions. (D) Fractional abundance of alternative transcripts. Model 3 correctly reproduces the decrease in error rates with increasing number of splicing reactions, number isoforms per gene and fractional abundance of alternative transcripts. It slightly over-predicts the increase in number of isoforms for genes with high (>100) numbers of splicing reactions, but otherwise provides an excellent fit to the trends in the experimental data.
Figure 9.
Figure 9.
Variation in average error rate per splicing reaction as a function of transcript abundance, for genes with different numbers of introns. Data produced by Model 3, withα = 0.3 andβ = 0.015. At low abundance levels, genes with few introns are predicted to have high average error rates (∼7%), while genes with many introns have low values (∼1%), reflecting the greater number of splicing reactions per transcript. At high abundance levels, all error rates are predicted to be low (<1%) because of selection against producing a large number of nonfunctional transcripts.
Figure 10.
Figure 10.
Predicted exon splicing enhancer (ESE) sites as a function of the number of splicing reactions. Genes from the ‘complete set’ were divided into 10 equal-size groups based on number of detected splicing reactions per gene. For each gene, we calculated the number of ESE motifs present in internal exons of the mRNA sequence of the major isoform, normalized by length of mRNA sequence (red bars). To make sure that signal is not due to compositional biases, we also calculate the number of candidate ESE motifs in shuffled mRNA sequences (gray bars). As a source of ESE data, we used 238 candidate nucleotide motifs from the RESCUE-ESE program (36). The number of putative motifs rises steadily with increase in number of splicing reactions, consistent with the reduced error rates, as expected from Models 2 and 3.
See this image and copyright information in PMC

Similar articles

See all similar articles

Cited by

See all "Cited by" articles

References

    1. Mironov AA, Fickett JW, Gelfand MS. Frequent alternative splicing of human genes. Genome Res. 1999;9:1288. - PMC - PubMed
    1. Modrek B, Lee C. A genomic view of alternative splicing. Nat. Genet. 2002;30:13. - PubMed
    1. Pan Q, Shai O, Lee LJ, Frey BJ, Blencowe BJ. Deep surveying of alternative splicing complexity in the human transcriptome by high-throughput sequencing. Nat. Genet. 2008;40:1413. - PubMed
    1. Kriventseva EV, Koch I, Apweiler R, Vingron M, Bork P, Gelfand MS, Sunyaev S. Increase of functional diversity by alternative splicing. Trends Genet. 2003;19:124. - PubMed
    1. Sorek R, Shamir R, Ast G. How prevalent is functional alternative splicing in the human genome? Trends Genet. 2004;20:68. - PubMed

Publication types

MeSH terms

Substances

Related information

Grants and funding

LinkOut - more resources

Full text links
Silverchair Information Systems full text link Silverchair Information Systems Free PMC article
Cite
Send To

NCBI Literature Resources

MeSHPMCBookshelfDisclaimer

The PubMed wordmark and PubMed logo are registered trademarks of the U.S. Department of Health and Human Services (HHS). Unauthorized use of these marks is strictly prohibited.


[8]ページ先頭

©2009-2025 Movatter.jp