Movatterモバイル変換


[0]ホーム

URL:


Skip to main page content
U.S. flag

An official website of the United States government

Dot gov

The .gov means it’s official.
Federal government websites often end in .gov or .mil. Before sharing sensitive information, make sure you’re on a federal government site.

Https

The site is secure.
Thehttps:// ensures that you are connecting to the official website and that any information you provide is encrypted and transmitted securely.

NIH NLM Logo
Log inShow account info
Access keysNCBI HomepageMyNCBI HomepageMain ContentMain Navigation
pubmed logo
Advanced Clipboard
User Guide

Full text links

Nature Publishing Group full text link Nature Publishing Group Free PMC article
Full text links

Actions

Share

.2009 Jun;12(6):767-76.
doi: 10.1038/nn.2315. Epub 2009 May 17.

Synaptotagmin-IV modulates synaptic function and long-term potentiation by regulating BDNF release

Affiliations

Synaptotagmin-IV modulates synaptic function and long-term potentiation by regulating BDNF release

Camin Dean et al. Nat Neurosci.2009 Jun.

Abstract

Synaptotagmin-IV (syt-IV) is a membrane trafficking protein that influences learning and memory, but its localization and role in synaptic function remain unclear. We found that syt-IV localized to brain-derived neurotrophic factor (BDNF)-containing vesicles in hippocampal neurons. Syt-IV/BDNF-harboring vesicles underwent exocytosis in both axons and dendrites, and syt-IV inhibited BDNF release at both sites. Knockout of syt-IV increased, and overexpression decreased, the rate of synaptic vesicle exocytosis from presynaptic terminals indirectly via changes in postsynaptic release of BDNF. Thus, postsynaptic syt-IV regulates the trans-synaptic action of BDNF to control presynaptic vesicle dynamics. Furthermore, selective loss of presynaptic syt-IV increased spontaneous quantal release, whereas a loss of postsynaptic syt-IV increased quantal amplitude. Finally, syt-IV knockout mice showed enhanced long-term potentiation (LTP), which depended entirely on disinhibition of BDNF release. Thus, regulation of BDNF secretion by syt-IV emerges as a mechanism for maintaining synaptic strength in a useful range during LTP.


Figures
Figure 1
Figure 1. Syt-IV is targeted to BDNF-containing vesicles
(a) Hippocampal neurons transfected with BDNF-GFP and immunostained for syt-IV. Endogenous syt-IV colocalizes with BDNF-GFP in transfected neurons. (b) Syt-IV colocalizes with endogenous BDNF in immunostained hippocampal neuron cultures. 66 ± 3% of detectable endogenous BDNF signal colocalized with syt-IV, and 68 ± 4% of syt-IV signal colocalized with BDNF. (c) High magnification images of syt-IV/BDNF and syt-IV/synaptophysin immunostained neurons, for comparison of colocalization of syt-IV with BDNF-containing vesicles versus synaptic vesicles, marked with synaptophysin. (d) Axon (top panel), axonal growth cone (arrow in middle panel) and dendrites (bottom panel) of neurons co-transfected with mCherry-syt-IV and BDNF-GFP. Scale bar is 10 μm in all panels.
Figure 2
Figure 2. Activity-induced syt-IV and BDNF colocalize and traffic together
(a) Syt-IV signal in TRPV1/GAP-43 transfected hippocampal neurons, identified by GFP fluorescence, without capsaicin treatment. (b) Following treatment with 50 nM capsaicin for 16 hours, the syt-IV signal in axons (arrow) and dendrites of transfected cells increased; note that gain settings for this image were set slightly lower than for controls in panel a, due to saturating syt-IV signal. (c) BDNF is concomitantly upregulated in capsaicin treated TRPV1-transfected cells (dendrites of a transfected cell are shown). (d) Activity-induced syt-IV and BDNF traffic together and colocalize in neuronal processes of TRPV1-transfected, capsaicin-treated cells. Syt-IV and BDNF vesicles in an axon of a capsaicin treated TRPV1 expressing cell are shown. Syt-IV and BDNF were increased 4.96 ± 0.18 fold and 3.81 ± 0.15 fold, respectively, in capsaicin treated TRPV1-expressing cells. In these cells 75 ± 4% of detectable BDNF signal colocalized with syt-IV, and 82 ± 5% of syt-IV signal colocalized with BDNF. Scale bar is 10 μm in all panels.
Figure 3
Figure 3. Syt-IV regulates BDNF release
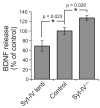
BDNF release, assayed byin situ ELISA, from hippocampal neurons over-expressing syt-IV, and from syt-IV knockout neurons compared to controls. For comparison of conditions, BDNF release was expressed relative to control (either GFP-expressing, or wild-type), which was normalized to 100%. Over-expression of syt-IV decreased BDNF release, and knockout of syt-IV increased BDNF release, compared to controls (n = 5 different neuronal cultures for each condition, 3-4 duplicate wells for each culture; error bars indicate SEM. Significance was determined by paired Student’s t-tests where * = p < 0.05, and one-way ANOVA where p = 0.003).
Figure 4
Figure 4. Depolarization induces syt-IV vesicle recycling in axons and dendrites
(a) Immunofluorescence image of GFP antibodies taken up during depolarization with 45 mM KCl for 5 minutes, marking sites of syt-IV vesicle recycling. Neurons treated with 5 mM KCl, and with 5 mM KCl in the absence of calcium failed to take up antibody and served as controls. Scale bar is 10 μm. (b) Immunofluorescence image of antibodies to the lumenal domain of syt-I that have been taken up during activity. (c) Total GFP fluorescence in transfected cells, pseudocolored cyan. (d) Enlarged images of the indicated rectangular area in panels a-c showing sites of syt-IV vesicle recycling, syt-I vesicle recycling, and merged images. (e) pHluorin-syt-IV assay schematic. During exocytosis, the vesicle lumen pH is neutralized, resulting in an increase in GFP fluorescence. Vesicles are then re-acidified following endocytosis, which results in a concomitant decrease in GFP fluorescence. (f) pHluorin-syt-IV exocytotic events (white arrows) in a dendrite and an axon following depolarization at time zero. Scale bar is 5 μm. (g) Sample traces and average fluorescence change of small, fast pHluorin events in dendrites. (h) Fluorescence traces of large pHluorin events in dendrites. (i) Fluorescence traces of axonal pHluorin events (n=35 events of each type; 10 different cells from 3 different cultures/transfections for each event type; error bars indicate SEM).
Figure 5
Figure 5. Syt-IV inhibits regulated release of BDNF
(a) BDNF-pHluorin fluorescence decreased in dendrites (white arrows), and increased in axons (yellow arrows) following depolarization at t = 30 seconds. Scale bar is 5 μm in all panels. (b) Individual events in dendrites and axons. (c) Sample and average traces of BDNF-pHluorin fluorescence decrease events in dendrites in control and syt-IV-over-expressing neurons. Arrows indicate addition of 45 mM KCl. These events were occasionally preceded by brief spikes of increased fluorescence (asterisks). Average traces were normalized to puncta fluorescence intensity prior to depolarization, which was not significantly different in control versus syt-IV over-expressing neurons (control = 537 ± 52 a.u., syt-IV over-expressing = 343 ± 29 a.u.). (d) Sample and average traces of BDNF-pHluorin fluorescence increase events in axons of control and syt-IV-over-expressing neurons. These events exhibited either fast-decaying (asterisks) or slow-decaying kinetics of fluorescence recovery to baseline. Average traces include all axonal events, and are normalized to background fluorescence prior to depolarization. n = 120 events of each type for axons and dendrites; 10 cells, 4 cultures/transfections; error bars indicate SEM. (e) BDNF-pHluorin fluorescence decrease events in dendrites during depolarization in the absence and presence of bafilomycin. (f) BDNF-pHluorin fluorescence increase events in axons during depolarization in the absence and presence of bafilomycin. (g) Quantitation of the fraction of events exhibiting no change in fluorescence, an increase in fluorescence (in axons), or a decrease in fluorescence (in dendrites) in BDNF-pHluorin and BDNF-pHluorin/mCherry-syt-IV transfected cells (n = 10 cells; 3 cultures/transfections; error bars indicate SEM).
Figure 6
Figure 6. Syt-IV levels affect synaptic vesicle exocytosis
(a) Western blots of syt-IV in control and activity-induced (treatment with 50 μm forskolin for four hours) conditions, and in control versus syt-IV over-expressing neurons. 12 μg of protein was loaded per lane for control versus forskolin, and 8 μg for control versus syt-IV over-expressing. Anti-tubulin served as a load control. (b) FM4-64 dye-loaded boutons in a culture over-expressing syt-IV/GFP via lentiviral infection. Scale bar is 5 μm. (c) Normalized FM dye destaining rates in control, syt-IV over-expressing and syt-IV-/- neurons. Arrow indicates addition of 45 mM KCl to depolarize neurons. Exponential fits yielded τ(sec) = 34.0 ± 2.6 (syt-IV lentivirus), 18.4 ± 1.4 (GFP lentivirus), 17.4 ± 0.8 (wt), and 9.8 ± 0.7 (syt-IV-/-). (d) Normalized destaining rates in syt-IV over-expressing and wt neurons treated with 25 nM BDNF for 1 hour, compared to traces from panel c. τ(sec) = 14.2 ± 3.0 (syt-IV lentivirus + 25 nM BDNF), 9.2 ± 0.8 (wt + 25 nM BDNF). (e) Normalized FM dye destaining rates in syt-IV over-expressing and wt neurons treated with 50 nM BDNF for 1 hour, compared to traces from panel c. τ(sec) = 10.4 ± 1.0 (syt-IV lentivirus + 50 nM BDNF), 8.7 ± 0.7 (wt + 50 nM BDNF). For all panels, n = 12-16 coverslips; 3-4 cultures, 10 boutons per coverslip for each condition; error bars indicate SEM.
Figure 7
Figure 7. Syt-IV modulates presynaptic function via regulation of post-synaptic BDNF release
(a) Co-culture assay in which 5% of neurons are DiO-labelled wild-type, and 95% are unlabelled syt-IV-/- neurons. (b) Co-culture in which 5% of neurons are DiO-labelled syt-IV-/-, and 95% are wild-type. (c) Images of co-cultured wild-type and DiO-labelled syt-IV-/- neurons (left panel), and a DiO-labeled neuron stained with FM4-64, indicating boutons selected for analysis (right panel, arrowheads). Scale bar is 5 μm. (d) Normalized FM dye destaining rates in the indicated conditions. τ(sec) = 10.4 ± 0.7 (wt pre/syt-IV-/- post) and 16.0 ± 0.6 (syt-IV-/- pre/wt post). τ(sec) = 17.4 ± 0.8 (wt) and 9.8 ± 0.7 (syt-IV-/- ) as indicated in Figure 6. (e) Normalized destaining rates following 30-60 min incubation with 4 μg/ml TrkB-IgG scavenger. τ(sec) = 14.8 ± 1.4 (wt TrkB-IgG), 14.4 ± 1.3 (syt-IV-/- TrkB-IgG), 15.3 ± 1.4 (wt pre/syt-IV-/- post TrkB-IgG), and 14.7 ± 1.3 (syt-IV-/- pre/wt post TrkB-IgG), (n = 20 coverslips; 4 cultures, 2-5 boutons per coverslip for each condition; error bars indicate SEM). (f) mEPSCs recorded from syt-IV-/- and wt littermate neurons. (g) mEPSC frequency. (h) mEPSC amplitude (n = 20 cells; 4 cultures, 2-3 coverslips for each condition; error bars indicate SEM). Significance, determined by a Student’s t-test is shown relative to wild-type. One-way ANOVA p values for mEPSC frequency/amplitude were 1.2/ 0.006 (wt versus wt pre/sytIV-/- post), 0.043/ 0.702 (wt versus sytIV-/- pre/wt post), 0.606/ 0.004 (sytIV-/- versus sytIV-/- pre/wt post) and 0.033/ 0.178 (sytIV-/- versus wt pre/sytIV-/- post).
Figure 8
Figure 8. Syt-IV knockouts have enhanced LTP due to excess BDNF release
(a) Hippocampal slice with voltage-sensitive dye optical signals from each of 464 photodiodes overlayed. CA1, CA3, subiculum (SB), entorhinal cortex (EC), and stimulating electrode (arrow) are indicated. A recording electrode was placed in the CA1 region. (b) Optical signal of the voltage sensitive dye and fEPSP slope versus stimulation intensity, showing an increase in both optical signal and fEPSP slope with increasing stimulation current. (c) fEPSP and optical signals before and after theta burst stimulation (TBS). (d) LTP measured as the increase in voltage-sensitive dye optical signal and fEPSP slope. The optical signal reliably reports LTP over the course of at least one hour. (e) Color-coded amplitude map of the optical signal detected in wild-type and syt-IV knockout hippocampal slices pre and one hour post TBS, normalized to maximum amplitude in each case. Right panels are LTP maps generated by subtracting the optical signal pre TBS from the optical signal one hour post TBS, and normalized to maximum amplitude increase for comparison between syt-IV knockout and wild-type. (f) Average LTP maps (n = 5 slices each for wild-type and syt-IV knockout). (g) Time course of LTP (n = 7 slices each for wild-type and syt-IV knockout, from 4 mice of each genotype; error bars indicate SEM). For BDNF blockade experiments, slices were incubated in 4 μg/ml TrkB-IgG scavenger for 2-3 hours prior to voltage imaging experiments. The stimulation current was 25 μA for all LTP experiments.
See this image and copyright information in PMC

Similar articles

See all similar articles

Cited by

See all "Cited by" articles

References

    1. Chapman ER. How Does Synaptotagmin Trigger Neurotransmitter Release? Annu Rev Biochem. 2008;77:615–41. - PubMed
    1. Koh TW, Bellen HJ. Synaptotagmin I, a Ca2+ sensor for neurotransmitter release. Trends Neurosci. 2003;26:413–422. - PubMed
    1. Bhalla A, Tucker WC, Chapman ER. Synaptotagmin isoforms couple distinct ranges of Ca2+, Ba2+, and Sr2+ concentration to SNARE-mediated membrane fusion. Mol Biol Cell. 2005;16:4755–4764. - PMC - PubMed
    1. Hui E, et al. Three distinct kinetic groupings of the synaptotagmin family: candidate sensors for rapid and delayed exocytosis. Proc Natl Acad Sci U S A. 2005;102:5210–5214. - PMC - PubMed
    1. Bhalla A, Chicka MC, Chapman ER. Analysis of the synaptotagmin family during reconstituted membrane fusion: Uncovering a class of inhibitory isoforms. J Biol Chem. 2008;283:21799–807. - PMC - PubMed

Publication types

MeSH terms

Substances

Related information

Grants and funding

LinkOut - more resources

Full text links
Nature Publishing Group full text link Nature Publishing Group Free PMC article
Cite
Send To

NCBI Literature Resources

MeSHPMCBookshelfDisclaimer

The PubMed wordmark and PubMed logo are registered trademarks of the U.S. Department of Health and Human Services (HHS). Unauthorized use of these marks is strictly prohibited.


[8]ページ先頭

©2009-2025 Movatter.jp