Movatterモバイル変換


[0]ホーム

URL:


Skip to main page content
U.S. flag

An official website of the United States government

Dot gov

The .gov means it’s official.
Federal government websites often end in .gov or .mil. Before sharing sensitive information, make sure you’re on a federal government site.

Https

The site is secure.
Thehttps:// ensures that you are connecting to the official website and that any information you provide is encrypted and transmitted securely.

NIH NLM Logo
Log inShow account info
Access keysNCBI HomepageMyNCBI HomepageMain ContentMain Navigation
pubmed logo
Advanced Clipboard
User Guide

Full text links

Nature Publishing Group full text link Nature Publishing Group Free PMC article
Full text links

Actions

Share

doi: 10.1038/msb.2009.10. Epub 2009 Mar 24.

A systems approach to prion disease

Affiliations

A systems approach to prion disease

Daehee Hwang et al. Mol Syst Biol.2009.

Abstract

Prions cause transmissible neurodegenerative diseases and replicate by conformational conversion of normal benign forms of prion protein (PrP(C)) to disease-causing PrP(Sc) isoforms. A systems approach to disease postulates that disease arises from perturbation of biological networks in the relevant organ. We tracked global gene expression in the brains of eight distinct mouse strain-prion strain combinations throughout the progression of the disease to capture the effects of prion strain, host genetics, and PrP concentration on disease incubation time. Subtractive analyses exploiting various aspects of prion biology and infection identified a core of 333 differentially expressed genes (DEGs) that appeared central to prion disease. DEGs were mapped into functional pathways and networks reflecting defined neuropathological events and PrP(Sc) replication and accumulation, enabling the identification of novel modules and modules that may be involved in genetic effects on incubation time and in prion strain specificity. Our systems analysis provides a comprehensive basis for developing models for prion replication and disease, and suggests some possible therapeutic approaches.


Conflict of interest statement

The authors declare that they have no conflict of interest.

Figures

Figure 1
Figure 1
Strategies for identification of 333 core differentially expressed genes (DEGs) and their functional analysis in mouse prion diseases. Two prion strains (RML and 301V) were used for inoculating mice from six different genetic backgrounds (B6, B6.I, FVB, Tg4053, 0/+, and 0/0) to generate eight prion–mouse combinations. From the list of 7400 DEGs identified from at least one of the five combinations with normal levels of prion protein (1X), 333 DEGs shared by all five were selected through novel statistical methods to represent perturbed networks essential to prion pathophysiology. Venn diagram shows the overlap of the 333 DEGs with DEGs from Tg4053-RML (mice expressing eight times of normal prion protein levels) and from 0/+-RML (mice expressing one-half of normal prion protein levels). Among 333 DEGs, 161 genes were mapped to networks through protein–protein interaction network or metabolic pathways. Also, by comparison of 333 DEGs with previous prion microarray studies, we identified 178 DEGs that have not been reported in connection with prion disease.
Figure 2
Figure 2
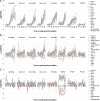
Expression profiles of genes shared among comparison of five mouse–prion combinations or unique to Tg4053-RML. Dynamic gene expression profiles in all eight mouse strain–prion strain combinations are shown for three cases in the order of B6-RML, B6-301V, B6.I-RML, B6.I-301V, FVB-RML, Tg4053-RML, 0/+-RML, and 0/0-RML: (A) top 20 genes with highest statistical significance for involvement in prion pathology among 333 differentially expressed genes (DEGs) shared by five combinations, B6-RML, B6-301V, B6.I-RML, B6.I-301V, and FVB-RML; (B) bottom 20 genes with lowest statistical significance for involvement in prion pathology among 333 shared DEGs; and (C) top 20 DEGs with highest statistical significance for involvement in prion pathology among RML-infected Tg4053 mice.
Figure 3
Figure 3
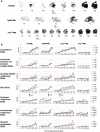
Time course histoblots and profiles of selected DEGs in three mouse strains with varying PrPC concentration. (A) Histoblots are shown for dynamic patterns of accumulation of proteinase K-resistant PrPSc in brains of RML-infected mice with wild-type PrPC concentration (FVB), half of wild-type PrPC concentration (0/+), and approximately eight times of wild-type PrPC concentration (Tg4053). (B) Expression profiles of shared DEGs representing key network modules are shown for FVB, Tg4053, and 0/+ mice. No significant changes were detected for these genes in mice lacking the Prnp gene (0/0). Percentage of the incubation times (incubation time is defined in this paper as the time period from prion inoculation to end point) for the time points when gene expression changes start to occur are indicated with arrows in histoblot series (A) and gene expression profiles (B).
Figure 4
Figure 4
Dynamic PrP replication and accumulation network. Hypothetical networks of proteins and metabolites that are potentially involved in PrP replication and accumulation were constructed starting from the list of 333 shared DEGs and protein–protein interaction/metabolic pathway information from public databases. Relative changes of the transcripts for the corresponding proteins are represented in color changes: red—upregulation, green—downregulation, yellow—no change. Data for the transcriptional changes are from BL6 mice infected with RML prions, at 6 weeks (A), 10 weeks (B), 14 weeks (C), 18 weeks (D), 20 weeks (E), and 22 weeks (F) after inoculation. See main text for detailed description of modules 1 through 6. Ch: cholesterol; ECM: extracellular matrix; PM: plasma membrane. Large nodes indicate DEGs whose expression change patterns are shared by five prion–mouse combinations (B6-RML, B6-301V, B6.I-RML, B6.I-301V, and FVB-RML); asterisks indicate DEGs whose prion-related changes are unique in this study; genes in blue are also DEGs in RML-infected 0/+ mice; genes in bold are also DEGs in RML-infected Tg4053 mice; genes with solid underline were changed only in mice with short incubation times; genes with dotted underline were changed only in RML-infected mice. Source data is available for this figure atwww.nature.com/msb
Figure 5
Figure 5
Microglial and astrocyte activation network. Hypothetical networks of proteins and metabolites that are potentially involved in activation of microglia and astrocytes were constructed starting from the list of 333 shared DEGs and protein–protein interaction information from public databases. Modules A–F denote distinct functional modules within the network: (A) Complement activation, (B) pattern recognition receptors, (C) cytokines and chemokines, (D) growth factors, (E) reactive astrogliosis, and (F) leukocyte extravasation. Relative changes of the transcripts for the corresponding proteins are represented in color changes: red—upregulation, green—downregulation, yellow—no change. Data for differential expression are from BL6 mice infected with RML prions. The temporal expression changes at six time points (10, 14, 16, 18, 20, and 22 weeks) are represented by the circular heatmaps of the network nodes: the center color of each node indicates the differential expression at 10 weeks, while the outer circle colors represent expression changes at increasing time points. Large nodes indicate DEGs whose expression change patterns are shared by five prion-mouse combinations; asterisks indicate DEGs whose prion-related changes are unique in this study; genes in blue are also DEGs in RML-infected 0/+ mice; genes in bold are also DEGs in RML-infected Tg4053 mice; genes with solid underline were changed only in mice with short incubation times. Source data is available for this figure atwww.nature.com/msb
Figure 6
Figure 6
Novel functional modules with dynamic gene expression changes potentially linked to prion pathophysiology: (A) androgen metabolism, (B) iron metabolism, (C) arachidonate/phospholipid metabolism. Hypothetical networks of proteins and metabolites that are potentially involved in three novel functional modules were constructed based on genes selected from the list of 333 shared DEGs and metabolic pathway information from literature. The temporal expression changes at six time points (10, 14, 16, 18, 20, and 22 weeks after inoculating BL6 mice with RML prions) are represented by the circular heatmaps of the network nodes: the center color of each node indicates the differential expression at 10 weeks, whereas the outer circle colors represent expression changes at increasing time points. Large nodes indicate DEGs whose expression change patterns are shared by five mouse-prion combinations; asterisks indicate DEGs whose prion-related changes are unique in this study. See text for detailed description of the three pathways.
Figure 7
Figure 7
Expression profiles of DEGs changing predominantly in three short incubation time combinations or in two RML-infected mice. (A) Top 10 genes that show selective changes in short incubation time combinations, B6-RML, B6.I-301V, and FVB-RML as compared with long incubation time combinations (B6-301V and B6.I-RML). The changes of these genes in 0/+ is also shown as another example of mouse–prion combination with long incubation time; (B) top 10 genes that show selective changes in RML-infected combinations, B6-RML and B6.I-RML as compared with 301V-infected combinations, B6-301V and B6.I-301V.
See this image and copyright information in PMC

Comment in

Similar articles

See all similar articles

Cited by

See all "Cited by" articles

References

    1. Baranano DE, Rao M, Ferris CD, Snyder SH (2002) Biliverdin reductase: a major physiologic cytoprotectant. Proc Natl Acad Sci USA 99: 16093–16098 - PMC - PubMed
    1. Basu S, Mohan ML, Luo X, Kundu B, Kong Q, Singh N (2007) Modulation of proteinase K-resistant prion protein in cells and infectious brain homogenate by redox iron: implications for prion replication and disease pathogenesis. Mol Biol Cell 18: 3302–3312 - PMC - PubMed
    1. Baumann F, Tolnay M, Brabeck C, Pahnke J, Kloz U, Niemann HH, Heikenwalder M, Rulicke T, Burkle A, Aguzzi A (2007) Lethal recessive myelin toxicity of prion protein lacking its central domain. EMBO J 26: 538–547 - PMC - PubMed
    1. Ben-Zaken O, Tzaban S, Tal Y, Horonchik L, Esko JD, Vlodavsky I, Taraboulos A (2003) Cellular heparan sulfate participates in the metabolism of prions. J Biol Chem 278: 40041–40049 - PubMed
    1. Berriz GF, King OD, Bryant B, Sander C, Roth FP (2003) Characterizing gene sets with FuncAssociate. Bioinformatics 19: 2502–2504 - PubMed

Publication types

MeSH terms

Substances

Related information

Grants and funding

LinkOut - more resources

Full text links
Nature Publishing Group full text link Nature Publishing Group Free PMC article
Cite
Send To

NCBI Literature Resources

MeSHPMCBookshelfDisclaimer

The PubMed wordmark and PubMed logo are registered trademarks of the U.S. Department of Health and Human Services (HHS). Unauthorized use of these marks is strictly prohibited.


[8]ページ先頭

©2009-2025 Movatter.jp