The contribution of single synapses to sensory representation in vivo
- PMID:18703744
- PMCID: PMC2771362
- DOI: 10.1126/science.1158391
The contribution of single synapses to sensory representation in vivo
Abstract
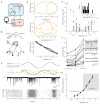
The extent to which synaptic activity can signal a sensory stimulus limits the information available to a neuron. We determined the contribution of individual synapses to sensory representation by recording excitatory postsynaptic currents (EPSCs) in cerebellar granule cells during a time-varying, quantifiable vestibular stimulus. Vestibular-sensitive synapses faithfully reported direction and velocity, rather than position or acceleration of whole-body motion, via bidirectional modulation of EPSC frequency. The lack of short-term synaptic dynamics ensured a highly linear relationship between velocity and charge transfer, and as few as 100 synapses provided resolution approaching psychophysical limits. This indicates that highly accurate stimulus representation can be achieved by small networks and even within single neurons.
Figures


Similar articles
- Synaptic diversity enables temporal coding of coincident multisensory inputs in single neurons.Chabrol FP, Arenz A, Wiechert MT, Margrie TW, DiGregorio DA.Chabrol FP, et al.Nat Neurosci. 2015 May;18(5):718-27. doi: 10.1038/nn.3974. Epub 2015 Mar 30.Nat Neurosci. 2015.PMID:25821914Free PMC article.
- Increased neurotransmitter release during long-term potentiation at mossy fibre-granule cell synapses in rat cerebellum.Sola E, Prestori F, Rossi P, Taglietti V, D'Angelo E.Sola E, et al.J Physiol. 2004 Jun 15;557(Pt 3):843-61. doi: 10.1113/jphysiol.2003.060285. Epub 2004 Apr 16.J Physiol. 2004.PMID:15090602Free PMC article.
- Properties of transmission at a giant glutamatergic synapse in cerebellum: the mossy fiber-unipolar brush cell synapse.Rossi DJ, Alford S, Mugnaini E, Slater NT.Rossi DJ, et al.J Neurophysiol. 1995 Jul;74(1):24-42. doi: 10.1152/jn.1995.74.1.24.J Neurophysiol. 1995.PMID:7472327
- Sensory representations in cerebellar granule cells.Arenz A, Bracey EF, Margrie TW.Arenz A, et al.Curr Opin Neurobiol. 2009 Aug;19(4):445-51. doi: 10.1016/j.conb.2009.07.003. Epub 2009 Aug 3.Curr Opin Neurobiol. 2009.PMID:19651506Review.
- The Cerebellar Mossy Fiber Synapse as a Model for High-Frequency Transmission in the Mammalian CNS.Delvendahl I, Hallermann S.Delvendahl I, et al.Trends Neurosci. 2016 Nov;39(11):722-737. doi: 10.1016/j.tins.2016.09.006. Epub 2016 Oct 19.Trends Neurosci. 2016.PMID:27771145Review.
Cited by
- Event time representation in cerebellar mossy fibres arising from the lateral reticular nucleus.Xu W, Jones S, Edgley SA.Xu W, et al.J Physiol. 2013 Feb 15;591(4):1045-62. doi: 10.1113/jphysiol.2012.244723. Epub 2012 Nov 26.J Physiol. 2013.PMID:23184515Free PMC article.
- Neuronal arithmetic.Silver RA.Silver RA.Nat Rev Neurosci. 2010 Jul;11(7):474-89. doi: 10.1038/nrn2864.Nat Rev Neurosci. 2010.PMID:20531421Free PMC article.Review.
- The synaptic representation of sound source location in auditory cortex.Chadderton P, Agapiou JP, McAlpine D, Margrie TW.Chadderton P, et al.J Neurosci. 2009 Nov 11;29(45):14127-35. doi: 10.1523/JNEUROSCI.2061-09.2009.J Neurosci. 2009.PMID:19906961Free PMC article.
- A biomimetic adaptive algorithm and low-power architecture for implantable neural decoders.Rapoport BI, Wattanapanitch W, Penagos HL, Musallam S, Andersen RA, Sarpeshkar R.Rapoport BI, et al.Annu Int Conf IEEE Eng Med Biol Soc. 2009;2009:4214-7. doi: 10.1109/IEMBS.2009.5333793.Annu Int Conf IEEE Eng Med Biol Soc. 2009.PMID:19964345Free PMC article.
- Chronic Ethanol Exposure Enhances Facial Stimulation-Evoked Mossy Fiber-Granule Cell Synaptic Transmissionvia GluN2A Receptors in the Mouse Cerebellar Cortex.Li BX, Dong GH, Li HL, Zhang JS, Bing YH, Chu CP, Cui SB, Qiu DL.Li BX, et al.Front Syst Neurosci. 2021 Aug 2;15:657884. doi: 10.3389/fnsys.2021.657884. eCollection 2021.Front Syst Neurosci. 2021.PMID:34408633Free PMC article.
References
Publication types
MeSH terms
Grants and funding
LinkOut - more resources
Full Text Sources
Other Literature Sources
