Dopamine D2 receptors form higher order oligomers at physiological expression levels
- PMID:18668123
- PMCID: PMC2529367
- DOI: 10.1038/emboj.2008.153
Dopamine D2 receptors form higher order oligomers at physiological expression levels
Abstract
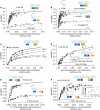
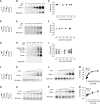
G-protein-coupled receptors are generally thought to be organized as dimers; whether they form higher order oligomers is a topic of much controversy. We combined bioluminescence/fluorescence complementation and energy transfer to demonstrate that at least four dopamine D2 receptors are located in close molecular proximity in living mammalian cells, consistent with their organization as higher order oligomers at the plasma membrane. This implies the existence of multiple receptor interfaces. In addition to the symmetrical interface in the fourth transmembrane segment (TM4) we identified previously by cysteine (Cys) crosslinking, we now show that a patch of residues at the extracellular end of TM1 forms a second symmetrical interface. Crosslinking of D2 receptor with Cys substituted simultaneously into both TM1 and TM4 led to higher order species, consistent with our novel biophysical results. Remarkably, the rate and extent of crosslinking at both interfaces were unaltered over a 100-fold range of receptor expression. Thus, at physiological levels of expression, the receptor is organized in the plasma membrane into a higher order oligomeric structure.
Figures


Similar articles
- The first transmembrane segment of the dopamine D2 receptor: accessibility in the binding-site crevice and position in the transmembrane bundle.Shi L, Simpson MM, Ballesteros JA, Javitch JA.Shi L, et al.Biochemistry. 2001 Oct 16;40(41):12339-48. doi: 10.1021/bi011204a.Biochemistry. 2001.PMID:11591153
- The fourth transmembrane segment of the dopamine D2 receptor: accessibility in the binding-site crevice and position in the transmembrane bundle.Javitch JA, Shi L, Simpson MM, Chen J, Chiappa V, Visiers I, Weinstein H, Ballesteros JA.Javitch JA, et al.Biochemistry. 2000 Oct 10;39(40):12190-9. doi: 10.1021/bi001069m.Biochemistry. 2000.PMID:11015197
- The fourth transmembrane segment forms the interface of the dopamine D2 receptor homodimer.Guo W, Shi L, Javitch JA.Guo W, et al.J Biol Chem. 2003 Feb 14;278(7):4385-8. doi: 10.1074/jbc.C200679200. Epub 2002 Dec 19.J Biol Chem. 2003.PMID:12496294
- Adenosine A2A and dopamine D2 heteromeric receptor complexes and their function.Fuxe K, Ferré S, Canals M, Torvinen M, Terasmaa A, Marcellino D, Goldberg SR, Staines W, Jacobsen KX, Lluis C, Woods AS, Agnati LF, Franco R.Fuxe K, et al.J Mol Neurosci. 2005;26(2-3):209-20. doi: 10.1385/JMN:26:2-3:209.J Mol Neurosci. 2005.PMID:16012194Review.
- Oligomers of D2 dopamine receptors: evidence from ligand binding.Strange PG.Strange PG.J Mol Neurosci. 2005;26(2-3):155-60. doi: 10.1385/JMN:26:2-3:155.J Mol Neurosci. 2005.PMID:16012188Review.
Cited by
- Heterodimerization between the lutropin and follitropin receptors is associated with an attenuation of hormone-dependent signaling.Feng X, Zhang M, Guan R, Segaloff DL.Feng X, et al.Endocrinology. 2013 Oct;154(10):3925-30. doi: 10.1210/en.2013-1407. Epub 2013 Jul 3.Endocrinology. 2013.PMID:23825122Free PMC article.
- BRET and Time-resolved FRET strategy to study GPCR oligomerization: from cell lines toward native tissues.Cottet M, Faklaris O, Maurel D, Scholler P, Doumazane E, Trinquet E, Pin JP, Durroux T.Cottet M, et al.Front Endocrinol (Lausanne). 2012 Jul 23;3:92. doi: 10.3389/fendo.2012.00092. eCollection 2012.Front Endocrinol (Lausanne). 2012.PMID:22837753Free PMC article.
- Mathematical models for quantitative assessment of bioluminescence resonance energy transfer: application to seven transmembrane receptors oligomerization.Drinovec L, Kubale V, Nøhr Larsen J, Vrecl M.Drinovec L, et al.Front Endocrinol (Lausanne). 2012 Aug 28;3:104. doi: 10.3389/fendo.2012.00104. eCollection 2012.Front Endocrinol (Lausanne). 2012.PMID:22973259Free PMC article.
- Ligand-specific interactions modulate kinetic, energetic, and mechanical properties of the human β2 adrenergic receptor.Zocher M, Fung JJ, Kobilka BK, Müller DJ.Zocher M, et al.Structure. 2012 Aug 8;20(8):1391-402. doi: 10.1016/j.str.2012.05.010. Epub 2012 Jun 28.Structure. 2012.PMID:22748765Free PMC article.
- Oligomeric size of the m2 muscarinic receptor in live cells as determined by quantitative fluorescence resonance energy transfer.Pisterzi LF, Jansma DB, Georgiou J, Woodside MJ, Chou JT, Angers S, Raicu V, Wells JW.Pisterzi LF, et al.J Biol Chem. 2010 May 28;285(22):16723-38. doi: 10.1074/jbc.M109.069443. Epub 2010 Mar 19.J Biol Chem. 2010.PMID:20304928Free PMC article.
References
- Ballesteros JA, Weinstein H (1995) Integrated methods for the construction of three-dimensional models and computational probing of structure–function relations in G protein-coupled receptors. Methods Neurosci 25: 366–428
- Baneres JL, Parello J (2003) Structure-based analysis of GPCR function: evidence for a novel pentameric assembly between the dimeric leukotriene B-4 receptor BLT1 and the G-protein. J Mol Biol 329: 815–829 - PubMed
- Bartfai T, Benovic JL, Bockaert J, Bond RA, Bouvier M, Christopoulos A, Civelli O, Devi LA, George SR, Inui A, Kobilka B, Leurs R, Neubig R, Pin JP, Quirion R, Roques BP, Sakmar TP, Seifert R, Stenkamp RE, Strange PG (2004) The state of GPCR research in 2004. Nat Rev Drug Discov 3: 574–626 - PubMed
- Bayburt TH, Leitz AJ, Xie G, Oprian DD, Sligar SG (2007) Transducin activation by nanoscale lipid bilayers containing one and two rhodopsins. J Biol Chem 282: 14875–14881 - PubMed
- Brock C, Oueslati N, Soler S, Boudier L, Rondard P, Pin JP (2007) Activation of a dimeric metabotropic glutamate receptor by intersubunit rearrangement. J Biol Chem 282: 33000–33008 - PubMed
Publication types
MeSH terms
Substances
Related information
Grants and funding
LinkOut - more resources
Full Text Sources
Other Literature Sources
Molecular Biology Databases
Research Materials
