Movatterモバイル変換


[0]ホーム

URL:


Skip to main page content
U.S. flag

An official website of the United States government

Dot gov

The .gov means it’s official.
Federal government websites often end in .gov or .mil. Before sharing sensitive information, make sure you’re on a federal government site.

Https

The site is secure.
Thehttps:// ensures that you are connecting to the official website and that any information you provide is encrypted and transmitted securely.

NIH NLM Logo
Log inShow account info
Access keysNCBI HomepageMyNCBI HomepageMain ContentMain Navigation
pubmed logo
Advanced Clipboard
User Guide

Full text links

Elsevier Science full text link Elsevier Science Free PMC article
Full text links

Actions

.2008 Jan;82(1):236-50.
doi: 10.1016/j.ajhg.2007.09.019.

Two sources of the Russian patrilineal heritage in their Eurasian context

Affiliations

Two sources of the Russian patrilineal heritage in their Eurasian context

Oleg Balanovsky et al. Am J Hum Genet.2008 Jan.

Abstract

Progress in the mapping of population genetic substructure provides a core source of data for the reconstruction of the demographic history of our species and for the discovery of common signals relevant to disease research: These two aspects of enquiry overlap in their empirical data content and are especially informative at continental and subcontinental levels. In the present study of the variation of the Y chromosome pool of ethnic Russians, we show that the patrilineages within the pre-Ivan the Terrible historic borders of Russia have two main distinct sources. One of these antedates the linguistic split between West and East Slavonic-speaking people and is common for the two groups; the other is genetically highlighted by the pre-eminence of haplogroup (hg) N3 and is most parsimoniously explained by extensive assimilation of (or language change in) northeastern indigenous Finno-Ugric tribes. Although hg N3 is common for both East European and Siberian Y chromosomes, other typically Siberian or Mongolian hgs (Q and C) have negligible influence within the studied Russian Y chromosome pool. The distribution of all frequent Y chromosome haplogroups (which account for 95% of the Y chromosomal spectrum in Russians) follows a similar north-south clinal pattern among autosomal markers, apparent from synthetic maps. Multidimensional scaling (MDS) plots comparing intra ethnic and interethnic variation of Y chromosome in Europe show that although well detectable, intraethnic variation signals do not cross interethnic borders, except between Poles, Ukrainians, and central-southern Russians, thereby revealing their overwhelmingly shared patrilineal ancestry.


Figures

Figure 1
Figure 1
East Europe in the 12th Century Black labels mark Russian princedoms which transformed later into the Grand Duchy of Moscow. The map is used by permission of Vladimir Nikolaev (www.ostu.ru/personal/nikolaev). Asterisks designate locations of the present-day populations studied here. Black asterisks mark Russian populations, whereas red and green asterisks mark Ukrainian and Belorussian populations (used for comparative analysis), respectively. Numbers in black asterisks refer to Table 1, except for three northern Russian populations (1–3), established after 12th century and not placed on this map.
Figure 2
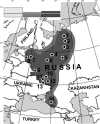
Figure 2
Location of the Studied Populations The reliability map inventing areas where concentration of the studied Russian populations is high enough to support correct cartographic interpolation was constructed by software described in . Areas that surrounded the studied populations were estimated as more reliable, considering cumulative distance to all studied locations. Dark gray and gray zones correspond to 99% and 95% confidence space, respectively. The area with 95% probability of correct cartographic interpolation is marked by the gray line in maps at Figures 3 and 4. Numbers of populations refer to Table 1.
Figure 3
Figure 3
Distribution of Y Chromosomal Haplogroups R1a, R1b, N3, and N2 in Europe Panels are described as follows: (A), frequency distribution map of haplogroup R1a; (B), frequency distribution map of haplogroup R1b; (C), frequency distribution map of haplogroup N3; and (D), frequency distribution map of haplogroup N2. The correlogram on each map indicates results of the spatial-autocorrelation analysis of the given haplogroup distribution within the studied Russian area. The Moran's I coefficient was calculated in the PASSAGE program with binary weight matrix with five distance classes. Absciss shows the distance (in hundreds of kilometers); the longest-distance classes is wider because of less number of distant populations. Nonsignificant values are shown as empty circles; significant values are shown as black (p > 0.01) and gray (p > 0.05) circles. Maps were created with haplogroup frequency data from this study and literature4–7,9,10,12,13,15–17,20,21,33,37,39,41–55 in the GGMAG program package as described in and . Because of different phylogenetic resolution levels of data from literature, not all of them were included for creating all eight maps. If source identified R1a1 and R1(xR1a1) haplogroups, they were taken for the mapmaking as R1a and R1b, respectively. Gray lines mark the studied Russian area. Population grouping. Most of populations with sample size less than 40 were omitted or pooled. Data on the same group from the different sources with the sample sizes greater than 40 were pooled when exact localities were not specified in all sources. The map scales are different for frequent (R1a, R1b, and N3, 10% scale step) and less frequent haplogroups (the other five, 5% step); for all maps, the first interval indicates virtual absence (less than 1%). The bar graph above the scale shows the portion of the total area covered by the respective scale interval. Abbreviations in the statistical legend indicate the following: K, number of the studied populations; n, number of samples in K populations; and MIN, MEAN, and MAX, the minimal, mean and maximum frequencies on the map.
Figure 4
Figure 4
Distribution of Y Chromosomal Haplogroups I1a, I1b, J2, and E3b in Europe (A) Frequency distribution map of haplogroup I1a. (B) Frequency distribution map of haplogroup I1b. (C) Frequency distribution map of haplogroup E3b. (D) Frequency distribution map of haplogroup J2.
Figure 5
Figure 5
Synthetic Maps of the Russian Gene Pool The synthetic maps were constructed from the correlation matrix as described in . Maps A and B are based on frequencies of eight haplogroups in 14 Russian populations; data are from Table 2. (A) The first synthetic map of the Y chromosomal variation. The interpolated frequency distribution maps of individual haplogroups were created, and then the principal components (synthetic maps) were calculated from these interpolated distributions. (B) The map of the first principal component of the Y chromosomal variation. The principal components were calculated from the raw data in Statistica 6.0 software, and then the values were interpolated so that the map was obtained. Comparing maps A and B allowed an estimation of possible artifacts caused in the map A by the initial interpolation. (C) The first synthetic map of the classical markers variation. The map is based on frequencies of 35 alleles of 13 loci, studied on average in 39 Russian populations; data came from the Russian Gene Pool databank (see Web Resources).
Figure 6
Figure 6
MDS Plot Depicting Genetic, Y Chromosomal, Relationships between 14 Russian Populations
Figure 7
Figure 7
MDS Plot Revealing Different Patrilineal Affinities of Northern and Central-Southern Russians
Figure 8
Figure 8
MDS Plot of the Y Chromosomal Variation, Grouping Regional Subpopulations and Averaged Ethnical Populations of Europe The aggregate set of populations (specified in the Table 3) was used, except for Croatians (isolated island populations) and Belorussians (data of lower phylogenetic resolution). Regional subpopulations of different ethnic affiliation are marked by signs of different color and shape (small circles, triangles, and cubes) and designated by abbreviations (populations names are those published in the original papers, indicated in the Table 3). Average values for ethnic populations are marked by large circles and bold names. The analysis was performed in Statistica 6.0 program. Axes were omitted from the plot. Greeks: Gr1, central (Agrinion, Ioannina, Kardhitsa, and Patrai); Gr2, northern (Larisa, Serrai, Thessaloniki); Gr3, isles (Khios, Mitilini); and Gr4, Crete (Iraklion, Khania, Lasithi, Rethimnon). Italians: I1, northern (Val di Non, Verona, Garfagnana, and Genoa); I2, central (L'Aquila, Pescara, and Avezzano); I3, southern (Benevento, Foggia, and North Gargano); I4, south-eastern (Altamura, Brindisi, Casarano, and Matera); and I5, southwestern (Cilento, Paola, and Reggio Calabria). Germans: G1, Berlin; G2, Cologne; G3, Freiburg; G4, Greifswald; G5, Hamburg; G6, Leipzig; G7, Magdeburg; G8, Mainz; G9, Muenster; G10, Munich; and G11, Rostock. Poles: P1, Bydgoszcz; P2, Gdansk; P3, Krakow; P4, Lublin; P5, Suwalki; P6, Szczecin; P7, Warsaw; and P8, Wroclaw. Ukrainians: U1, Dnepr; U2, eastern; U3, Podol; and U4, western (Lvov and Ivano-Frankovsk). Finns: F1, Northern Ostrobothnia; F2, Northern Savo; F3, southern (Southwest Finland, Hame, and Satakunta); F4, Karelia (Northern Karelia and Southern Karelia); and F5, Ostrobotnia (South Ostrobotnia and Swedish-speaking Ostrobotnia). Swedes: S1, Vasterbotten; S2, Blekinge and Gotland; S3, Uppsala and Varmland; and S4, Skaraborg, Ostergotland, and Jonkoping. Russians: Populations numbers as shown in Tables 1 and 2 and Figure 2. Populations with sample sizes less than 70 were pooled (population 1 with 2, 5 with 6, 7 with 8, and 11 with 13) and marked on the plot as R1,2; R5,6; R7,8; and R11,13, respectively. Turks: Similarly, population 1 was pooled with 2; 5 with 6; and 7 with 8, and pooled populations were marked on the plot as T1,2; T5,6; and T7,8, respectively.
See this image and copyright information in PMC

References

    1. Y Chromosome Consortium A nomenclature system for the tree of human Y-chromosomal binary haplogroups. Genome Res. 2002;12:339–348. - PMC - PubMed
    1. Jobling M.A., Tyler-Smith C. The human Y chromosome: An evolutionary marker comes of age. Nat. Rev. Genet. 2003;4:598–612. - PubMed
    1. Underhill P.A., Kivisild T. Use of Y chromosome and mitochondrial DNA population structure in tracing human migrations. Annu. Rev. Genet. 2007;41:539–564. - PubMed
    1. Semino O., Passarino G., Oefner P.J., Lin A.A., Arbuzova S., Beckman L.E., De Benedictis G., Francalacci P., Kouvatsi A., Limborska S. The genetic legacy of Paleolithic Homo sapiens sapiens in extant Europeans: A Y chromosome perspective. Science. 2000;290:1155–1159. - PubMed
    1. Rosser Z.H., Zerjal T., Hurles M.E., Adojaan M., Alavantic D., Amorim A., Amos W., Armenteros M., Arroyo E., Barbujani G. Y-chromosomal diversity in Europe is clinal and influenced primarily by geography, rather than by language. Am. J. Hum. Genet. 2000;67:1526–1543. - PMC - PubMed

Publication types

MeSH terms

LinkOut - more resources

Full text links
Elsevier Science full text link Elsevier Science Free PMC article
Cite
Send To

NCBI Literature Resources

MeSHPMCBookshelfDisclaimer

The PubMed wordmark and PubMed logo are registered trademarks of the U.S. Department of Health and Human Services (HHS). Unauthorized use of these marks is strictly prohibited.


[8]ページ先頭

©2009-2025 Movatter.jp