WO2023139741A1 - Particle measuring apparatus - Google Patents
Particle measuring apparatusDownload PDFInfo
- Publication number
- WO2023139741A1 WO2023139741A1PCT/JP2022/002107JP2022002107WWO2023139741A1WO 2023139741 A1WO2023139741 A1WO 2023139741A1JP 2022002107 WJP2022002107 WJP 2022002107WWO 2023139741 A1WO2023139741 A1WO 2023139741A1
- Authority
- WO
- WIPO (PCT)
- Prior art keywords
- particle
- particles
- light
- measuring device
- optical axis
- Prior art date
- Legal status (The legal status is an assumption and is not a legal conclusion. Google has not performed a legal analysis and makes no representation as to the accuracy of the status listed.)
- Ceased
Links
Images


Classifications
- G—PHYSICS
- G01—MEASURING; TESTING
- G01N—INVESTIGATING OR ANALYSING MATERIALS BY DETERMINING THEIR CHEMICAL OR PHYSICAL PROPERTIES
- G01N15/00—Investigating characteristics of particles; Investigating permeability, pore-volume or surface-area of porous materials
- G01N15/02—Investigating particle size or size distribution
- G01N15/0205—Investigating particle size or size distribution by optical means
- G01N15/0227—Investigating particle size or size distribution by optical means using imaging; using holography
- G—PHYSICS
- G01—MEASURING; TESTING
- G01N—INVESTIGATING OR ANALYSING MATERIALS BY DETERMINING THEIR CHEMICAL OR PHYSICAL PROPERTIES
- G01N15/00—Investigating characteristics of particles; Investigating permeability, pore-volume or surface-area of porous materials
- G01N15/04—Investigating sedimentation of particle suspensions
- G—PHYSICS
- G01—MEASURING; TESTING
- G01N—INVESTIGATING OR ANALYSING MATERIALS BY DETERMINING THEIR CHEMICAL OR PHYSICAL PROPERTIES
- G01N15/00—Investigating characteristics of particles; Investigating permeability, pore-volume or surface-area of porous materials
- G01N15/10—Investigating individual particles
- G01N15/14—Optical investigation techniques, e.g. flow cytometry
- G01N15/1429—Signal processing
- G01N15/1433—Signal processing using image recognition
- G—PHYSICS
- G01—MEASURING; TESTING
- G01N—INVESTIGATING OR ANALYSING MATERIALS BY DETERMINING THEIR CHEMICAL OR PHYSICAL PROPERTIES
- G01N15/00—Investigating characteristics of particles; Investigating permeability, pore-volume or surface-area of porous materials
- G01N15/10—Investigating individual particles
- G01N15/14—Optical investigation techniques, e.g. flow cytometry
- G01N15/1434—Optical arrangements
- G—PHYSICS
- G01—MEASURING; TESTING
- G01N—INVESTIGATING OR ANALYSING MATERIALS BY DETERMINING THEIR CHEMICAL OR PHYSICAL PROPERTIES
- G01N15/00—Investigating characteristics of particles; Investigating permeability, pore-volume or surface-area of porous materials
- G01N2015/0092—Monitoring flocculation or agglomeration
- G—PHYSICS
- G01—MEASURING; TESTING
- G01N—INVESTIGATING OR ANALYSING MATERIALS BY DETERMINING THEIR CHEMICAL OR PHYSICAL PROPERTIES
- G01N15/00—Investigating characteristics of particles; Investigating permeability, pore-volume or surface-area of porous materials
- G01N15/10—Investigating individual particles
- G01N2015/1029—Particle size
- G—PHYSICS
- G01—MEASURING; TESTING
- G01N—INVESTIGATING OR ANALYSING MATERIALS BY DETERMINING THEIR CHEMICAL OR PHYSICAL PROPERTIES
- G01N15/00—Investigating characteristics of particles; Investigating permeability, pore-volume or surface-area of porous materials
- G01N15/10—Investigating individual particles
- G01N2015/103—Particle shape
- G—PHYSICS
- G01—MEASURING; TESTING
- G01N—INVESTIGATING OR ANALYSING MATERIALS BY DETERMINING THEIR CHEMICAL OR PHYSICAL PROPERTIES
- G01N15/00—Investigating characteristics of particles; Investigating permeability, pore-volume or surface-area of porous materials
- G01N15/10—Investigating individual particles
- G01N15/14—Optical investigation techniques, e.g. flow cytometry
- G01N15/1434—Optical arrangements
- G01N2015/1452—Adjustment of focus; Alignment
- G—PHYSICS
- G01—MEASURING; TESTING
- G01N—INVESTIGATING OR ANALYSING MATERIALS BY DETERMINING THEIR CHEMICAL OR PHYSICAL PROPERTIES
- G01N15/00—Investigating characteristics of particles; Investigating permeability, pore-volume or surface-area of porous materials
- G01N15/10—Investigating individual particles
- G01N15/14—Optical investigation techniques, e.g. flow cytometry
- G01N2015/1493—Particle size
Definitions
- the present inventionrelates to a particle measuring device.
- Biopharmaceuticalshave excellent effects that low-molecular-weight drugs do not have, in that antibody molecules modified with sugar chains exert effects on specific targets such as cancer and rare intractable diseases. While small-molecule drugs are synthesized through chemical reactions, biopharmaceuticals are produced using the biological functions of cells. Immunoglobulin G (IgG), a representative biopharmaceutical, is a large molecule with a complex structure and a molecular weight of about 150,000, so it is almost impossible to prevent structural heterogeneity. Therefore, testing technology for confirming the safety and efficacy of formulations in biopharmaceuticals plays an even more important role. Biopharmaceuticals have a wide variety of inspection items, but aggregates are one of the important inspection items. It is known that biopharmaceuticals tend to aggregate due to their macromolecular nature, and aggregation can cause toxicity. Therefore, it is required to measure the size and the number of aggregates contained in the formulation and appropriately manage them.
- biopharmaceutical samples to be testedmay include various types of particles such as silicone oil droplets, air bubbles, stainless steel, glass, and rubber fragments (in this specification, these particle-like substances are collectively referred to simply as particles). Since the impact on the safety and efficacy of pharmaceuticals differs depending on the type of particle, and the countermeasures to control the generation of particles differ depending on the type of particle, it is important to determine the type of particle as well as measure the size of the particle during inspection.
- Patent Document 1discloses a method of calculating the hydrodynamic size of a particle based on the diffusion constant of the particle obtained by observing the Brownian motion of the particle for a certain period of time, called Nano Particle Tracking Analysis (NTA).
- NTANano Particle Tracking Analysis
- Patent Document 2discloses a method of measuring particle size from the sedimentation velocity of particles due to gravity.
- Patent Document 3discloses a method of measuring the size of particles based on the amount of light reflected from the particles.
- Non-Patent Document 1discloses a resonant mass measurement (RMM) that calculates the mass of particles based on changes in the resonance frequency of the cantilever that occur when the particles flow through a channel provided in the cantilever.
- RMMresonant mass measurement
- JP 2020-109419A Japanese Patent No. 4339924 Japanese Patent No. 6559555
- the particle diffusion constant evaluated by NTAcannot provide information other than size because the only relevant particle parameter is size.
- the sedimentation methodPatent Document 2
- the sign of the resonance frequency changediffers depending on the density of the particles with respect to the solvent, so it is possible to narrow down the types of particles to some extent based on the sign.
- conventional particle measuring devicesdetect only one of the information related to particles such as the diffusion constant and mass, so there is a problem that it is difficult to determine the type of particles.
- the present inventionhas been made in view of the above problems, and an object of the present invention is to provide a particle measuring device capable of distinguishing the types of particles.
- the particle measuring devicerepeatedly scans the focal position of light in a three-dimensional area in the sample along the optical axis direction, and calculates at least two or more of (a) one or more parameters representing the type of particles obtained from the maximum intensity of reflected light from the particles acquired from each focal position in the scanning process; (b) one or more parameters representing the type of particles obtained based on the position of the particles obtained by continuously tracking the particles; Accordingly, it is possible to accurately determine the particle type based on a plurality of determination parameters.
- the particle typecan be determined based on the size of the particle.
- the time required for one scan of the three-dimensional areais set to a predetermined value or less according to the concentration of the particles to be measured and the minimum diffusion constant of the particles. This makes it possible to obtain a plurality of pieces of information about the particles with high accuracy, and enables particle discrimination with high reproducibility.
- the focal position of lightis repeatedly scanned on a specific three-dimensional area of the sample, and the time required for scanning the two-dimensional plane once is reduced to a predetermined value or less according to the width of the three-dimensional area in the optical axis direction, the maximum particle concentration to be measured, the minimum diffusion constant of the particles to be measured, and the movement interval of the focal point in the optical axis direction. decided to set. This makes it possible to obtain a plurality of pieces of information about the particles with high accuracy, and enables particle discrimination with high reproducibility.
- the width in the vertical and horizontal directions of the plane perpendicular to the optical axis of the three-dimensional area and the width in the direction of the optical axisare set to a predetermined value or more according to the time required for one scan of the three-dimensional area, the number of repeated scans of the three-dimensional area, the diffusion constant of the smallest particle to be measured, the density of particles, the density of the solvent, the viscosity of the solvent, the gravitational acceleration, and the particle size.
- the diffusion constant of particlesbased on the temporal change in the position of the particles, or calculated the particle size based on the diffusion constant. This allows particle discrimination based on maximum light intensity and diffusion constant.
- an interference optical systemthat splits the light from the light source to generate signal light and reference light, and combines the signal light reflected from the sample with the reference light to generate three or more interference lights with different phase relationships.
- At least two of the following four(a) the maximum light intensity reflected from the particle at each focal position of the light along the optical axis direction, (b) the diffusion constant of the particle calculated based on the time change of the position of the particle or the particle size calculated from the diffusion constant, (c) the sedimentation velocity of the particle calculated based on the time change of the position of the particle in the gravitational direction, and (d) the sphericity of the particle calculated from the maximum light intensity of a plurality of particles corresponding to each of a plurality of three-dimensional images.
- FIG. 1is an example of a configuration diagram of a particle measuring device according to Embodiment 1.
- FIG.It is a figure explaining the relationship between particle size and the magnitude
- FIG. 4is a schematic diagram showing how particles that are not truly spherical are measured.
- FIG. 4is a schematic diagram showing how particles that are not truly spherical are measured.
- FIG. 10is a diagram for explaining the operation of the Z stage 115 during repeated scanning;
- FIG. 4is a schematic diagram of expected results when reflected light from particles with high sphericity and particles with low sphericity are repeatedly acquired using the particle measuring device of the present invention.
- FIG. 7Bis a schematic diagram showing a prediction result similar to FIG. 7A; It is an example of the results expected when measuring a mixed sample of aggregates and silicone oil droplets using the particle measuring device of the present invention and plotting the particles against the average signal amplitude A ave (or particle size) and the sphericity parameter ⁇ . The dependence of tc on concentration is shown.
- FIG. 4is a schematic diagram showing a three-dimensional region within a sample; Dependence of aggregates (positive sedimentation velocity) and silicone oil (negative sedimentation velocity) on ⁇ Z and particle size d. It is an example of the results expected when measuring a mixed sample of protein aggregates and bubbles using the particle measuring device of the present invention and plotting the particles against the particle size dB calculated based on the signal amplitude A and Brownian motion.
- FIG. 11is a schematic diagram showing a configuration example of a particle measuring device according to Embodiment 4.
- FIG. 1is an example of a block diagram of a particle measuring device according to Embodiment 1 of the present invention.
- Light emitted from a light source 100 whose light emission state is controlled by a laser driver 101is converted into parallel light by a collimator lens 102, and after the polarization direction is adjusted by a ⁇ /2 plate 103 whose optical axis direction is adjustable, the light is separated into signal light (reflected light component) and reference light (transmitted light component) by a polarizing beam splitter 104.
- the branching ratio between the signal light and the reference lightcan be freely set by adjusting the optical axis direction of the ⁇ /2 plate 103 .
- the reference lightAfter the reference light is converted into a circularly polarized state by the ⁇ /4 plate 105, it is reflected by the reference light mirror 106, changed to a polarized state in which the polarization is rotated by 90 degrees from the outward path by the ⁇ /4 plate 105, and reflected by the polarizing beam splitter 104.
- the optical axis direction of the signal lightAfter the optical axis direction of the signal light is deflected in the XY directions by the two-dimensional scanner 107, the polarized light is converted into a circularly polarized state by the action of the ⁇ /4 plate 108, and focused in the sample 114 held by the sample container 110 by the objective lens 109.
- the two-dimensional scanner 107serves to two-dimensionally scan the focal position of the light by the objective lens 109 within the XY plane (within the plane perpendicular to the optical axis), and specifically, a combination of resonant and non-resonant galvanometer mirrors can be used.
- a Z stage 115 that moves the sample in the Z-axis direction (optical axis direction)serves to scan the focal position of the signal light with respect to the sample 114 along the Z-axis direction.
- the focal position of the lightcan be scanned with respect to a specific three-dimensional region in the sample 114.
- the signal light reflected from the particles contained in the sample 114is converted again into parallel light by the objective lens 109, and the ⁇ /4 plate 108 acts to rotate the polarization state by 90 degrees from that of the outgoing path.
- the sample container 110has a transparent window 112 that transmits signal light, a resin member 113 that forms a well, and a base plate 111 that mechanically holds the sample container 110 in contact with the transparent window 112 and stabilizes the temperature of the sample 114.
- the signal light and the reference lightare combined by the polarization beam splitter 104 and guided to the detection optical system 116 as combined light. After part of the unnecessary light such as reflected light from the transparent window 112 is removed by the pinhole 117, the combined light is split into transmitted light and reflected light by the half beam splitter 118.
- FIG. The transmitted light of the combined lightis transmitted through a ⁇ /2 plate 119 whose optical axis is set at approximately 22.5 degrees with respect to the horizontal direction, then is condensed by a condenser lens 120 and split into two by a polarizing beam splitter 121.
- the signalsAfter being converted into electrical signals by photodetectors 126 and 127, respectively, the signals are differentially amplified by a current differential amplifier 130 to become a detection signal 132, which is input to a three-dimensional image generation unit 134.
- the reflected light of the combined lightpasses through a ⁇ /4 plate 122 whose optical axis is set at approximately 0 degrees with respect to the horizontal direction and a ⁇ /2 plate 123 whose optical axis is set at approximately 0 degrees with respect to the horizontal direction. is entered in
- the optical axes of the ⁇ /2 plates 119 and 123are adjustable, so that the splitting ratio of light by the polarizing beam splitters 121 and 125 can be adjusted.
- E sig and E refare the electric field amplitudes of the signal light and the reference light, respectively, and ⁇ is the phase difference between the signal light and the reference light. Constants such as the photoelectric conversion efficiency of the photodetector are omitted for simplicity.
- a signal A that is proportional to the amplitude of the signal lightcan be obtained by applying the square root of the sum of squares to I and Q as follows.
- the three-dimensional image generation unit 134calculates the signal A represented by Equation 2 for each focal position of light and generates a three-dimensional image of the sample 114 .
- the analysis unit 135derives information on the particles by analyzing the plurality of generated three-dimensional images, outputs the information to the display unit 136, and presents it to the user.
- FIG. 2is a diagram for explaining the relationship between the particle size and the amount of reflected light when particles smaller than the spot size are present at the focal position of light.
- the principle of particle size measurement by the particle measuring device of the present inventionwill be described with reference to FIG. In the range where the particle size is smaller than the spot size, the larger the particle, the larger the ratio of the projected area of the particle in the light spot, and the greater the amount of reflected light. That is, the amount of reflected light from relatively large particles shown on the right side of FIG. 2 is greater than the amount of reflected light from relatively small particles shown on the left side of FIG.
- a reflected signal amplitude A obtained from a particle placed at the focal positionis given by the following equation using the particle size d, the refractive index n particle of the particle, and the refractive index n solvent of the solvent.
- ⁇is a constant determined by the sensitivity of the detector, the spot size, and the like.
- the proportionality coefficient ⁇becomes clear, and by substituting the refractive indices of the particles and solvent into Equation 3, the particle size can be calculated.
- the spot size of the lightis adjustable by the wavelength and the numerical aperture of the objective lens, and can be set according to the size range of particles to be measured by this principle. For example, when the wavelength of the light source is 785 nm and the numerical aperture of the objective lens is 0.45, the spot size is about 1.74 ⁇ m. In this case, particles with a particle size of 1.74 ⁇ m or less can be measured according to this principle. For particles larger than the spot size, it is possible to calculate the particle size based on the three-dimensional image obtained by an approach similar to microscopy.
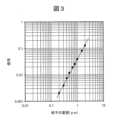
- Fig. 3shows the simulation results of the relationship between particle size (particle diameter) and detection signal amplitude.
- the “wave dynamic ray tracing method” described in Patent Document 3was used, with the wavelength of the light source set to 785 nm and the numerical aperture of the objective lens set to 0.45.
- Equation 3shows, it can be seen that the detected signal amplitude is proportional to the particle diameter.
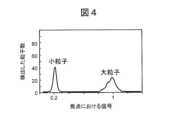
- FIG. 4shows the results of measuring a mixed sample of polystyrene beads with a diameter of 0.2 ⁇ m and polystyrene beads with a diameter of 1.0 ⁇ m using the particle measuring device of the present invention. It can be seen that two types of particles with different sizes are separately detected based on the difference in the amount of reflected light.
- Fig. 5is a schematic diagram showing how particles that are not spherical are measured. As shown in FIG. 5, when the particles are not perfectly spherical, the amount of light reflected from the particles varies depending on the orientation of the particles. Specifically, the particles in the state shown in the right side of FIG. 5 have a larger projected area ratio in the light spot than the particles in the state shown in the left side of FIG.
- the amount of reflected light from non-spherical particleswill not be a constant value but will vary to some extent. That is, the difference in sphericity of particles can be detected as the difference in the magnitude of variation in the amount of reflected light obtained repeatedly. Therefore, in the present invention, in order to repeatedly detect the reflected light from the same particle, the focal position of the light is repeatedly scanned with respect to a specific three-dimensional area.
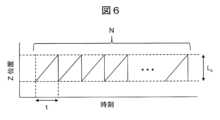
- FIG. 6is a diagram for explaining the operation of the Z stage 115 during repeated scanning.
- An area having a width Lz in the Z directionis repeatedly scanned N times at time intervals t (the time required to scan a specific three-dimensional area once).
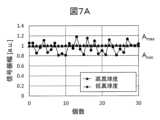
- FIG. 7Ais a schematic diagram of expected results when reflected light from particles with high sphericity and particles with low sphericity are repeatedly acquired using the particle measuring device of the present invention. While the signal amplitude of particles with high sphericity is almost constant, the signal amplitude of particles with low sphericity is expected to vary as shown in FIG.
- the parameter ⁇ representing the sphericity of particlesis defined by the following equation.
- a min and A max in the equationare the minimum and maximum values of the reflected signal amplitude A from the particles repeatedly acquired, respectively.
- the particle size of non-spherical particlescan be defined using, for example, the average signal amplitude value Aave .
- the particle size and sphericity of particles larger than the spot sizecan be evaluated directly from the image, similar to microscopy.
- FIG. 7Bis a schematic diagram showing a prediction result similar to that of FIG. 7A.
- FIG. 7Ashows an example in which the reflected signal amplitudes from the particles are obtained 31 times in a row from the 0th scan to the 30th scan, but it is not always necessary to obtain the signal amplitude continuously from the first (0th) scan to the last scan. For example, a total of 300 scans may be performed, and the signal amplitudes of particles present in the scanning range may be continuously acquired in the 100th to 131st scans.
- FIG. 7Bshows one such example.
- FIG. 8shows an example of the results expected when measuring a mixed sample of aggregates and silicone oil droplets using the particle measuring device of the present invention and plotting the particles against the average signal amplitude A ave (or particle size) and the sphericity parameter ⁇ . Since protein aggregates are distributed in regions with low sphericity and droplets of silicone oil are distributed in regions with high sphericity, it is possible to measure the particle size and distinguish between the two.
- ⁇ Embodiment 1Conditions necessary for measurement of sphericity> Next, the conditions required to acquire reflected light from the same particle a plurality of times will be described.
- the identity of particlesmeans a state in which it can be confirmed that each particle detected in the m-th scan is the same particle as each particle detected in the m+1-th scan.
- Particles in liquidundergo Brownian motion, and a typical particle movement amount ⁇ r due to Brownian motion at time interval t is given by the following equation, where D is the diffusion constant of the particles. ⁇ is a constant of 1 or more.
- the amount of particle movement due to Brownian motionfollows a Gaussian distribution.
- the diffusion constant D of particlesis expressed by the following formula using the Boltzmann constant k B , the absolute temperature T of the solvent, the viscosity ⁇ of the solvent, and the particle size d.
- the average particle spacing laveis given by the following formula.
- the average particle spacingmust be greater than twice the amount of movement of the particles due to Brownian motion during the time interval t.
- D maxis the diffusion constant for particles with the largest Brownian motion, that is, the smallest particles in the particle size range to be measured.
- tcdepends on particle concentration and particle size (via the diffusion constant), it is necessary to set tc to an appropriate value depending on the particle concentration range and particle size range to be measured.
- the scanning time t per scan for the three-dimensional areacan be expressed by the following formula, where ⁇ t is the scanning time per scan for the XY plane, and pz is the amount of sample movement in the Z direction per scan by the Z stage 115 .
- Equation 10By substituting Equation 10 into Equation 9, the following conditions to be satisfied by ⁇ t, Lz, and pz necessary for maintaining the identity of particles are derived.
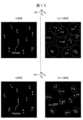
- FIG. 10is a schematic diagram of XY images obtained in each of the m-th and m+1-th scans at a certain z position.
- the cross marks in the figureare the positions of the respective particles in the m-th scan, and the circle indicated by the dotted line is a circle with a radius ⁇ r centered on the cross mark.
- the circlesoverlap (the movement amount of the particles is larger than the average particle spacing), so the identity of the particles cannot be ensured.
- particles 1 and 2 in the image obtained in the (m+1)th scanare present in the area where the circles overlap, so it is impossible to distinguish which particle is which.
- the circlesdo not overlap, so the particle closest to the particle position detected in the m-th scan can be determined to be the original particle.
- FIG. 11is a schematic diagram showing a three-dimensional region within a sample. Another condition for repeatedly acquiring reflected light from the same particle N times is that the particle does not move out of the three-dimensional area to be scanned due to Brownian motion or sedimentation during the N times of scanning. As shown in FIG. 11, particles present in the periphery of the scanning region V at the start of scanning may move outside the scanning region V during N repetitions of scanning (FIG. 11 shows the xz cross section).
- the scanning area Vis represented by the following formula, where the widths of the scanning area in the xyz direction are Lx , Ly , and Lz .
- the particlesin order to detect reflected light repeatedly N times, the particles must exist in the following xy region, which is the xy direction range of region V'.
- Movement of particles in the z directionis caused by Brownian motion and sedimentation, and the amount of movement ⁇ Z of particles in the z direction during time Nt is expressed as the sum of both as follows.
- the maximum movement amounts ⁇ L z+ and ⁇ L z- of particles occurring in the positive and negative directions of zare represented by the following equations.
- Equation 17means that the value in parentheses is maximized with respect to the particle size for particles with a positive sedimentation velocity.
- the particlesIn order to repeatedly acquire reflected light from particles in the target size range N times, the particles must be present in the following z-region, which is the z-direction range of region V'.
- Equations 15 and 19the following conditions must be satisfied in order for the volume of region V' to be 0 or more.
- the sedimentation velocity v of particlesis given by the following equation.
- dis the particle size
- ⁇ particleis the particle density
- cis the particle drag coefficient
- ⁇ solventis the solvent density
- gis the gravitational acceleration.
- the drag coefficient c of the particlesis given by the following formula, where R is the Reynolds number.
- FIG. 12shows the dependence of aggregates (positive sedimentation velocity) and silicone oil (negative sedimentation velocity) on ⁇ Z and particle size d, calculated by substituting Eqs. 6 and 26 into Eq.
- the particle sizeis small (approximately 1.0 ⁇ m or less), the contribution of Brownian motion is large, and when measuring particles of 1.0 ⁇ m or less, the effect of sedimentation can be almost ignored.
- the condition of Equation 22is L z >63.1 ⁇ m, which is satisfied by Condition I, which is an example of the condition satisfying Equation 11 described above.
- Equation 27Substituting Equation 27 into Equation 22 yields the following equation.
- Equation 10is a condition equivalent to Eq. 22 when particle sedimentation is negligible.
- Embodiment 1not only the particle size but also the sphericity of the particles can be evaluated by repeatedly scanning the three-dimensional area so as to satisfy the conditions shown in Equations 11 and 20 to 22 and repeatedly detecting the reflected light from the particles. This makes it possible to discriminate the type of particles.
- the case where the particles existing in the periphery of the scanning area V at the start of scanning are to be measuredis described, but for example, particles that have moved from outside the measurement area into the measurement area during repeated scanning may be the measurement targets. Equations 20-22 need not be satisfied in this case. Further, the number of repeated measurements N, the scanning area V, and the area V' do not need to be defined at the start of scanning until the final scanning, and can be redefined during the scanning.
- Embodiment 2Evaluation of Brownian motion>
- the coordinates of particlesare constantly changing due to Brownian motion, and the amount of movement of particles due to Brownian motion differs depending on the particle size. Since the particle measuring apparatus of the present invention repeatedly scans a specific three-dimensional area, it is possible to continuously observe the coordinates of particles for a certain period of time. Therefore, in Embodiment 2 of the present invention, the diffusion constant of the particles represented by Equation 6 is calculated based on the amount of movement of the particles due to Brownian motion, and the particle size is calculated from the value of the diffusion constant.
- the configuration of the particle measuring deviceis the same as that of the first embodiment. Since the signal amplitude A depends on the particle diameter and refractive index, and the Brownian motion depends only on the particle diameter as shown in Equation 6, both give different information about the particle.
- particle movementis also caused by convection of the solvent caused by heat non-uniformity in the sample 114, so it is important to suppress the occurrence of convection or suppress the effects of convection in order to ensure stable measurement accuracy.
- the use of the base plate 111 with high heat dissipationsuppresses heat accumulation in the sample 114 and suppresses convection. Furthermore, since the movement of particles caused by convection of the solvent is almost constant regardless of the particle size, the average movement of all particles was subtracted when evaluating the movement of particles to remove the influence of convection.
- FIG. 13shows an example of the results expected when measuring a mixed sample of protein aggregates and bubbles using the particle measuring device of the present invention and plotting the particles against the particle size dB calculated based on the signal amplitude A and Brownian motion.
- Bubbleshave a larger refractive index difference with the solvent than aggregates, and are distributed in a region with a larger signal amplitude than aggregates. It is thus possible to distinguish between agglomerates and bubbles. That is, in the present invention, by repeatedly scanning the three-dimensional area and continuously observing the coordinates of the particles, it is possible to evaluate the amount of movement of the particles due to Brownian motion in addition to the signal amplitude, thereby making it possible to discriminate the types of particles.
- Embodiment 3Evaluation of sedimentation velocity> Since the particles in the liquid settle due to the action of gravity, the position in the direction of gravity (Z coordinate) changes with time.
- Z coordinatethe position in the direction of gravity
- a specific three-dimensional areais repeatedly scanned to continuously observe the Z coordinate of the particle for a certain period of time, and not only the reflected signal amplitude from the particle but also the sedimentation velocity of the particle represented by Equation 23 or Equation 26 is evaluated.
- the configuration of the particle measuring deviceis the same as in the first and second embodiments.
- the reflected signal amplitude Adepends on the particle diameter and refractive index
- the sedimentation velocity vdepends on the particle diameter and density
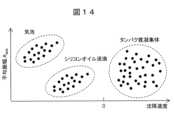
- Fig. 14shows an example of the results expected when a mixed sample of protein aggregates, air bubbles, and silicon oil droplets is measured using the particle measuring device of the present invention, and particles are plotted against signal amplitude A and sedimentation velocity v.
- Agglomerateshave a positive sedimentation velocity because they are denser than the common solvent, and bubbles and silicone oil have a negative sedimentation velocity because they are less dense than the solvent. Since bubbles have a larger refractive index difference with the solvent than silicon oil and have a smaller density, they are considered to be distributed in a region with a larger signal amplitude and a smaller sedimentation velocity (larger absolute value) than silicon oil. As a result, the three types of particles are detected separately as shown in FIG.
- Embodiment 3by repeatedly scanning the three-dimensional area and continuously observing the coordinates of the particles, it is possible to evaluate the amount of movement of the particles due to the sedimentation velocity in addition to the signal amplitude, and to determine the type of particles. In addition, by simultaneously calculating not only the sedimentation velocity but also the sphericity described in the first embodiment and the particle size based on the Brownian motion described in the second embodiment, it is possible to determine the type of particles with higher accuracy.
- FIG. 15is a schematic diagram showing a configuration example of a particle measuring device according to Embodiment 4 of the present invention.
- Embodiment 4differs from Embodiments 1 to 3 in that it further includes a constant temperature and humidity chamber 201 and a vibration stress applying section 202 .
- Other configurationsare the same as those of the first to third embodiments.
- Aggregatesare known to be generated by physical stress such as heating and vibration, and in formulation research, stress tests are conducted under various solvent conditions in order to find conditions that make it more difficult for aggregates to form.
- stress testsare conducted under various solvent conditions in order to find conditions that make it more difficult for aggregates to form.
- measurementis performed using a particle measuring device. This process had problems such as the time required to transfer the sample, the time lag between the application of stress and the measurement, and the inability to perform real-time measurement while applying stress.
- the role of the stress testeris built into the grain measuring device by providing a constant temperature and humidity chamber 201 that keeps the sample at a constant temperature and a vibration stress application unit 202 that applies vibration stress to the sample.
- a constant temperature and humidity chamber 201that keeps the sample at a constant temperature
- a vibration stress application unit 202that applies vibration stress to the sample.
- the present inventionis not limited to the embodiments described above, and includes various modifications.
- the above-described embodimentshave been described in detail in order to explain the present invention in an easy-to-understand manner, and are not necessarily limited to those having all the configurations described.
- part of the configuration of one embodimentcan be replaced with the configuration of another embodiment, and the configuration of another embodiment can be added to the configuration of one embodiment.
- the analysis unit 135may calculate two or more parameters used to determine the particle type and output the results in some form, or may determine the particle type using the parameters and output the result. For example, on plot planes illustrated in FIGS. 8, 13, and 14, each plot can be classified into one of particle types by a method such as clustering each plot or specifying a division line that divides each plot.
- the three-dimensional image generation unit 134 and the analysis unit 135can be configured by hardware such as circuit devices implementing these functions, or can be configured by executing software implementing these functions by an arithmetic device such as a CPU (Central Processing Unit).
- a CPUCentral Processing Unit
- Light source 101Laser driver 109: Objective lens 115: Z stage 116: Detection optical system 134: Three-dimensional image generation unit 135: Analysis unit 136: Display unit
Landscapes
- Chemical & Material Sciences (AREA)
- Life Sciences & Earth Sciences (AREA)
- Dispersion Chemistry (AREA)
- Physics & Mathematics (AREA)
- Health & Medical Sciences (AREA)
- Analytical Chemistry (AREA)
- Biochemistry (AREA)
- General Health & Medical Sciences (AREA)
- General Physics & Mathematics (AREA)
- Immunology (AREA)
- Pathology (AREA)
- Signal Processing (AREA)
- Engineering & Computer Science (AREA)
- Investigating Or Analysing Materials By Optical Means (AREA)
Abstract
Description
Translated fromJapanese本発明は、粒子計測装置に関する。The present invention relates to a particle measuring device.
バイオ医薬品は、糖鎖で修飾された抗体分子ががんや希少難病等の特定標的に対して効果を発現するという、低分子医薬品にない優れた作用をもっている。低分子薬が化学反応によって合成されるのに対し、バイオ医薬品は細胞の生体機能を利用して生成される。代表的なバイオ医薬品である免疫グロブリンG(IgG)は複雑な構造を持つ分子量15万程度の大きな分子であるので、構造の不均一性を防ぐことはほぼ不可能である。したがって、バイオ医薬品において製剤の安全性・有効性を確認するための検査技術は、より一層重要な役割を果たす。バイオ医薬品の検査項目は多岐にわたるが、凝集体は重要な検査項目の1つである。バイオ医薬品は高分子であるがゆえに凝集しやすく、凝集すると毒性を生じうることが知られている。したがって、製剤に含まれる凝集体のサイズおよび個数を計測し、適正に管理することが求められている。Biopharmaceuticals have excellent effects that low-molecular-weight drugs do not have, in that antibody molecules modified with sugar chains exert effects on specific targets such as cancer and rare intractable diseases. While small-molecule drugs are synthesized through chemical reactions, biopharmaceuticals are produced using the biological functions of cells. Immunoglobulin G (IgG), a representative biopharmaceutical, is a large molecule with a complex structure and a molecular weight of about 150,000, so it is almost impossible to prevent structural heterogeneity. Therefore, testing technology for confirming the safety and efficacy of formulations in biopharmaceuticals plays an even more important role. Biopharmaceuticals have a wide variety of inspection items, but aggregates are one of the important inspection items. It is known that biopharmaceuticals tend to aggregate due to their macromolecular nature, and aggregation can cause toxicity. Therefore, it is required to measure the size and the number of aggregates contained in the formulation and appropriately manage them.
検査対象となるバイオ医薬品のサンプルには、凝集体以外にもシリコンオイルの液滴、気泡、ステンレス、ガラス、ゴムの破片などの様々な種類の粒子(本明細書ではこれらの粒子様物質を総称して単に粒子と呼ぶこととする)が含まれ得る。医薬品の安全性・有効性への影響は粒子の種類によって異なること、粒子の種類により発生を抑制するための対策が異なることなどから、検査の際には粒子のサイズ計測だけではなく粒子の種類の判別を行うことは重要である。In addition to aggregates, biopharmaceutical samples to be tested may include various types of particles such as silicone oil droplets, air bubbles, stainless steel, glass, and rubber fragments (in this specification, these particle-like substances are collectively referred to simply as particles). Since the impact on the safety and efficacy of pharmaceuticals differs depending on the type of particle, and the countermeasures to control the generation of particles differ depending on the type of particle, it is important to determine the type of particle as well as measure the size of the particle during inspection.
特許文献1は、従来の粒子計測技術として、ナノ粒子追跡法(Nano particle Tracking Analysis;NTA)と呼ばれる、粒子のブラウン運動を一定時間観察することで得られる粒子の拡散定数に基いて粒子の流体力学的なサイズを算出する方法を開示している。As a conventional particle measurement technology,
特許文献2には、重力による粒子の沈降速度から粒子サイズを測定する方法が開示されている。
特許文献3には、粒子からの反射光量に基いて、粒子のサイズを計測する方法が開示されている。
非特許文献1には、カンチレバーに設けられた流路に粒子が流れる際に生じるカンチレバーの共振周波数の変化に基づき、粒子の質量を算出する共振式質量測定法(Resonant mass measurement;RMM)が開示されている。Non-Patent
NTA(特許文献1)が評価している粒子の拡散定数は、関連する粒子のパラメータはサイズのみであるので、サイズ以外の情報を得ることはできない。沈降法(特許文献2)においては、溶媒よりも密度の大きい粒子のみが検出され、かつ得られる情報は粒子の沈降速度のみであるので、粒子の判別は困難である。RMM(非特許文献1)においては、溶媒に対する粒子の密度の大小に応じて共振周波数変化の符合が異なるので、その符合に基づき粒子の種類をある程度絞り込むことが可能である。しかし、溶媒に対する大小関係が一致する異種粒子同士を区別することができない。このように従来の粒子計測装置は、拡散定数や質量などの粒子に関わる情報のうちいずれか1つのみを検出しているので、粒子の種類を判別することが困難であるという課題があった。The particle diffusion constant evaluated by NTA (Patent Document 1) cannot provide information other than size because the only relevant particle parameter is size. In the sedimentation method (Patent Document 2), only particles with a higher density than the solvent are detected, and the information obtained is only the sedimentation velocity of the particles, so it is difficult to distinguish the particles. In the RMM (Non-Patent Document 1), the sign of the resonance frequency change differs depending on the density of the particles with respect to the solvent, so it is possible to narrow down the types of particles to some extent based on the sign. However, it is not possible to distinguish different types of particles having the same size relationship with respect to the solvent. As described above, conventional particle measuring devices detect only one of the information related to particles such as the diffusion constant and mass, so there is a problem that it is difficult to determine the type of particles.
本発明は、上記課題に鑑みてなされたものであり、粒子の種類を判別することができる粒子計測装置を提供することを目的とする。The present invention has been made in view of the above problems, and an object of the present invention is to provide a particle measuring device capable of distinguishing the types of particles.
本発明に係る粒子計測装置は、光の焦点位置をサンプル内の3次元領域において光軸方向に沿って繰り返し走査し、(a)走査過程において各焦点位置から取得する粒子からの反射光の最大強度から得られる、粒子の種別を表す1つ以上のパラメータ;(b)粒子を継続的にトラッキングすることにより取得する粒子の位置に基づいて得られる、粒子の種別を表す1つ以上のパラメータ;のうち少なくとも2つ以上を計算してその結果を出力する。これにより、複数の判定パラメータに基づいて、粒子種別を精度よく判定することができる。The particle measuring device according to the present invention repeatedly scans the focal position of light in a three-dimensional area in the sample along the optical axis direction, and calculates at least two or more of (a) one or more parameters representing the type of particles obtained from the maximum intensity of reflected light from the particles acquired from each focal position in the scanning process; (b) one or more parameters representing the type of particles obtained based on the position of the particles obtained by continuously tracking the particles; Accordingly, it is possible to accurately determine the particle type based on a plurality of determination parameters.
1例として、最大光強度、粒子の屈折率、サンプル溶媒の屈折率、粒子のサイズ、の間の関係にしたがって、粒子のサイズを計算することとした。これにより、粒子のサイズに基づき粒子種別を判定できる。As an example, we calculated the size of the particles according to the relationship between the maximum light intensity, the refractive index of the particles, the refractive index of the sample solvent, and the size of the particles. Thereby, the particle type can be determined based on the size of the particle.
1例として、3次元画像のそれぞれに対応した複数個の粒子の最大光強度から、粒子の最大光強度の真球度を算出することとした。これにより、最大光強度とその真球度に基いた粒子判別が可能になる。As an example, we decided to calculate the sphericity of the maximum light intensity of a particle from the maximum light intensity of a plurality of particles corresponding to each of the three-dimensional images. This enables particle discrimination based on maximum light intensity and its sphericity.
1例として、3次元領域の1回の走査に要する時間を、測定対象とする粒子の濃度と最小の粒子の拡散定数に応じて所定の値以下に設定することとした。これにより、粒子に関する複数の情報を高い確度で取得することが可能となり、高い再現性で粒子判別が可能になる。As an example, the time required for one scan of the three-dimensional area is set to a predetermined value or less according to the concentration of the particles to be measured and the minimum diffusion constant of the particles. This makes it possible to obtain a plurality of pieces of information about the particles with high accuracy, and enables particle discrimination with high reproducibility.
1例として、光軸に垂直な2次元平面に対して光の焦点位置を走査するステップと、サンプルに対する焦点の光軸方向位置を所定の間隔で移動するステップを繰り返すことにより、サンプルの特定の3次元領域に対して光の焦点位置を繰り返し走査し、前記2次元平面を1回走査するのに要する時間を、3次元領域の光軸方向の幅、測定対象とする最大の粒子濃度、測定対象とする最小の粒子の拡散定数、焦点の光軸方向への移動間隔に応じて所定の値以下に設定することとした。これにより、粒子に関する複数の情報を高い確度で取得することが可能となり、高い再現性で粒子判別が可能になる。As an example, by repeating the step of scanning the focal position of light on a two-dimensional plane perpendicular to the optical axis and the step of moving the position of the focal point on the sample in the optical axis direction at predetermined intervals, the focal position of light is repeatedly scanned on a specific three-dimensional area of the sample, and the time required for scanning the two-dimensional plane once is reduced to a predetermined value or less according to the width of the three-dimensional area in the optical axis direction, the maximum particle concentration to be measured, the minimum diffusion constant of the particles to be measured, and the movement interval of the focal point in the optical axis direction. decided to set. This makes it possible to obtain a plurality of pieces of information about the particles with high accuracy, and enables particle discrimination with high reproducibility.
1例として、3次元領域の光軸に垂直な平面の縦横方向の幅および光軸方向の幅を、3次元領域の1回の走査に要する時間、3次元領域の繰り返し走査回数、測定対象とする最小の粒子の拡散定数、粒子の密度、溶媒の密度、溶媒の粘度、重力加速度、粒径に応じて所定の値以上に設定することとした。これにより、有限個の粒子からの反射光を高い確率で繰り返し検出することが可能となり、高い再現性で粒子判別が可能になる。As an example, the width in the vertical and horizontal directions of the plane perpendicular to the optical axis of the three-dimensional area and the width in the direction of the optical axis are set to a predetermined value or more according to the time required for one scan of the three-dimensional area, the number of repeated scans of the three-dimensional area, the diffusion constant of the smallest particle to be measured, the density of particles, the density of the solvent, the viscosity of the solvent, the gravitational acceleration, and the particle size. As a result, reflected light from a limited number of particles can be repeatedly detected with high probability, and particle discrimination can be performed with high reproducibility.
1例として、粒子の位置の時間変化に基いて粒子の拡散定数を算出し、または拡散定数に基づき粒子サイズを計算することとした。これにより、最大光強度と拡散定数に基づいた粒子判別が可能になる。As an example, we calculated the diffusion constant of particles based on the temporal change in the position of the particles, or calculated the particle size based on the diffusion constant. This allows particle discrimination based on maximum light intensity and diffusion constant.
1例として、粒子の重力方向の位置の時間変化に基いて粒子の沈降速度を算出することとした。これにより、最大光強度と沈降速度に基づいた粒子判別が可能になる。As an example, we decided to calculate the sedimentation velocity of particles based on the time change of the position of the particles in the direction of gravity. This allows particle discrimination based on maximum light intensity and sedimentation velocity.
1例として、光源からの光を分岐して信号光と参照光を生成し、サンプルから反射した信号光を参照光と合波することにより互いに位相関係が異なる3つ以上の干渉光を生成する干渉光学系を設けることとした。このような構成とすることにより、微弱な粒子からの反射光を高い感度で検出することが可能となり。より小さな粒子を計測することができる。As an example, an interference optical system is provided that splits the light from the light source to generate signal light and reference light, and combines the signal light reflected from the sample with the reference light to generate three or more interference lights with different phase relationships. With such a configuration, it becomes possible to detect the reflected light from weak particles with high sensitivity. Smaller particles can be counted.
1例として、(a)光軸方向に沿った光の焦点位置ごとの前記粒子からの反射光強度のうち最も大きい最大光強度、(b)粒子の位置の時間変化に基いて算出される粒子の拡散定数または拡散定数から計算される粒子サイズ、(c)粒子の重力方向の位置の時間変化に基いて算出される粒子の沈降速度、(d)複数の3次元画像のそれぞれに対応した複数個の粒子の最大光強度から算出される前記粒子の真球度、の4つのうち少なくとも2つ以上の情報を出力することとした。これにより、より高い精度で粒子の種類の判別を行うことができる。As an example, at least two of the following four: (a) the maximum light intensity reflected from the particle at each focal position of the light along the optical axis direction, (b) the diffusion constant of the particle calculated based on the time change of the position of the particle or the particle size calculated from the diffusion constant, (c) the sedimentation velocity of the particle calculated based on the time change of the position of the particle in the gravitational direction, and (d) the sphericity of the particle calculated from the maximum light intensity of a plurality of particles corresponding to each of a plurality of three-dimensional images. We decided to output more than one information. This makes it possible to determine the type of particles with higher accuracy.
本発明によれば、粒子のサイズ計測および粒子の種類を判別することができる粒子計測装置を提供することができる。上記した以外の課題、構成、および効果は、以下の実施形態の説明により明らかにされる。According to the present invention, it is possible to provide a particle measuring device capable of measuring the size of particles and discriminating the types of particles. Problems, configurations, and effects other than those described above will be clarified by the following description of the embodiments.
<実施の形態1:装置構成>
図1は、本発明の実施形態1に係る粒子計測装置の構成図の1例である。レーザドライバ101により発光状態を制御された光源100から出射した光は、コリメートレンズ102によって平行光に変換され、光学軸方向が調整可能なλ/2板103によって偏光方向を調整された後、偏光ビームスプリッタ104によって信号光(反射光成分)と参照光(透過光成分)とに分離される。信号光と参照光の分岐比はλ/2板103の光学軸方向を調整することにより、自由に設定可能である。<Embodiment 1: Apparatus configuration>
FIG. 1 is an example of a block diagram of a particle measuring device according to
参照光は、λ/4板105によって偏光を円偏光状態に変換された後、参照光ミラー106によって反射され、λ/4板105によって往路とは偏光が90度回転した偏光状態となり、偏光ビームスプリッタ104で反射される。信号光は、2次元スキャナ107によってその光軸方向をXY方向に偏向されたのち、λ/4板108の作用により偏光を円偏光状態に変換され、対物レンズ109によってサンプル容器110によって保持されたサンプル114内で焦点を結ぶ。After the reference light is converted into a circularly polarized state by the λ/4
2次元スキャナ107は、対物レンズ109による光の焦点位置をXY平面(光軸に垂直な平面内)内で2次元的に走査する役割を果たしており、具体的には共振型と非共振型のガルバノミラーの組み合わせなどを用いることができる。サンプルをZ軸方向(光軸方向)に移動するZステージ115は、信号光の焦点位置をサンプル114に対してZ軸方向に沿って走査する役割を果たす。2次元スキャナ107によって、光軸に垂直なXY平面に対して光の焦点位置を走査するステップと、Zステージ115によってサンプル114に対する焦点のZ位置を所定の間隔pzで移動するステップを繰り返すことにより、サンプル114内の特定の3次元領域に対して光の焦点位置を走査することができる。The two-
サンプル114に含まれる粒子から反射した信号光は、対物レンズ109によって再び平行光に変換され、λ/4板108の作用により往路とは偏光が90度回転した偏光状態となり、2次元スキャナ107によって光軸方向が往路と同じ方向に偏向されたのちに、偏光ビームスプリッタ104を透過する。サンプル容器110は、信号光を透過させる透明窓112、ウエルを形成する樹脂部材113、透明窓112と接触して機械的にサンプル容器110を保持するとともにサンプル114の温度の安定化を担うベースプレート111、を有する。The signal light reflected from the particles contained in the
信号光と参照光は、偏光ビームスプリッタ104によって合波され、合成光となって検出光学系116に導かれる。合成光はピンホール117によって透明窓112からの反射光などの不要な光の一部を除去された後に、ハーフビームスプリッタ118によって透過光と反射光に分岐される。合成光の透過光は、光学軸が水平方向に対して約22.5度に設定されたλ/2板119を透過した後、集光レンズ120によって集光されるとともに偏光ビームスプリッタ121によって2分岐され、それぞれ光検出器126,127によって電気信号に変換された後、電流差動アンプ130によって差動増幅され検出信号132となり3次元画像生成部134に入力される。合成光の反射光は、光学軸が水平方向に対して約0度に設定されたλ/4板122と光学軸が水平方向に対して約0度に設定されたλ/2板123を通過した後、集光レンズ124によって集光されるとともに偏光ビームスプリッタ125によって2分岐され、それぞれ光検出器128,129によって電気信号に変換された後、電流差動アンプ131により差動増幅され検出信号133となり3次元画像生成部134に入力される。ここで、λ/2板119,123は光学軸が調整可能となっており、これにより偏光ビームスプリッタ121,125による光の分岐比を調整することができる。The signal light and the reference light are combined by the
検出信号132をI、検出信号133をQとすると、これらは以下の式によって表される。Esig、Erefはそれぞれ信号光と参照光の電場振幅、θは信号光と参照光の位相差である。光検出器の光電変換効率等の定数は簡単のため省略した。Assuming that the

以下のようにIとQに対して2乗和平方根の演算を施すことにより、信号光の振幅に比例する信号Aを得ることができる。A signal A that is proportional to the amplitude of the signal light can be obtained by applying the square root of the sum of squares to I and Q as follows.

3次元画像生成部134は光の焦点位置ごとに式2で表される信号Aを算出し、サンプル114の3次元画像を生成する。解析部135は生成された複数の3次元画像を分析することにより、粒子の情報を導きだし、表示部136に出力してユーザに提示する。The three-dimensional
<実施の形態1:反射光量に基くサイズ計測原理>
図2は、光の焦点位置にスポットサイズよりも小さな粒子が存在する場合における、粒子サイズと反射光量の大きさの関係を説明する図である。図2を用いて、本発明の粒子計測装置による粒子サイズ計測の原理について説明する。粒子サイズがスポットサイズよりも小さい範囲においては、粒子が大きいほど光スポット内における粒子の投影面積の比率が大きくなり、反射光量が増大する。すなわち、図2右に示した相対的に大きな粒子からの反射光量は、図2左に示した相対的に小さな粒子からの反射光量よりも大きい。したがって、3次元画像を解析して粒子に対して焦点が合った場合の反射光量(粒子位置に対する反射光量の最大値)を抽出することにより、粒子サイズの差異を反射光量の差異として検出することが可能である。焦点位置に配置された粒子から得られる反射信号振幅Aは、粒径d、粒子の屈折率nparticle、溶媒の屈折率nsolvantを用いて以下の式で与えられる。βは検出器の感度やスポットサイズなどにより決まる定数である。<Embodiment 1: Principle of Size Measurement Based on Reflected Light Amount>
FIG. 2 is a diagram for explaining the relationship between the particle size and the amount of reflected light when particles smaller than the spot size are present at the focal position of light. The principle of particle size measurement by the particle measuring device of the present invention will be described with reference to FIG. In the range where the particle size is smaller than the spot size, the larger the particle, the larger the ratio of the projected area of the particle in the light spot, and the greater the amount of reflected light. That is, the amount of reflected light from relatively large particles shown on the right side of FIG. 2 is greater than the amount of reflected light from relatively small particles shown on the left side of FIG. Therefore, by analyzing the three-dimensional image and extracting the amount of reflected light when the particle is in focus (the maximum value of the amount of reflected light with respect to the particle position), it is possible to detect the difference in particle size as the difference in the amount of reflected light. A reflected signal amplitude A obtained from a particle placed at the focal position is given by the following equation using the particle size d, the refractive index nparticle of the particle, and the refractive index nsolvent of the solvent. β is a constant determined by the sensitivity of the detector, the spot size, and the like.

ポリスチレンビーズ等のサイズと屈折率が既知のサンプルを測定することにより、比例係数βが明らかになり、粒子と溶媒の屈折率を式3に代入することにより、粒径の算出が可能になる。光のスポットサイズは波長と対物レンズの開口数により調整可能であり、本原理によって計測する粒子のサイズ範囲に応じて設定することが可能である。例えば、光源の波長を785nm、対物レンズの開口数を0.45とした場合のスポットサイズは約1.74μmである。この場合、粒径が1.74μm以下の粒子を本原理により計測することが可能である。スポットサイズよりも大きな粒子に関しては、得られた3次元画像に基いて顕微鏡法と同様のアプローチで粒子サイズを算出することが可能である。By measuring a sample of known size and refractive index, such as polystyrene beads, the proportionality coefficient β becomes clear, and by substituting the refractive indices of the particles and solvent into
図3は、粒径(粒子の直径)と検出信号振幅の関係のシミュレーション結果である。シミュレーション方法は、特許文献3に記載の『波動的光線追跡法』を用い、光源の波長を785nm、対物レンズの開口数を0.45とした。式3が示すように、検出信号振幅が粒子の直径に比例していることが分かる。このような対応関係のデータをあらかじめ記憶しておくことにより、本発明の粒子計測装置を用いて検出信号の大きさから粒径を算出することが可能である。Fig. 3 shows the simulation results of the relationship between particle size (particle diameter) and detection signal amplitude. For the simulation method, the “wave dynamic ray tracing method” described in
図4は、本発明の粒子計測装置を用いて直径0.2μmのポリスチレンビーズと直径1.0μmのポリスチレンビーズの混合サンプルを計測した結果である。反射光量の違いに基づき、サイズの異なる2種の粒子が分離して検出されていることが分かる。FIG. 4 shows the results of measuring a mixed sample of polystyrene beads with a diameter of 0.2 μm and polystyrene beads with a diameter of 1.0 μm using the particle measuring device of the present invention. It can be seen that two types of particles with different sizes are separately detected based on the difference in the amount of reflected light.
<実施の形態1:真球度の計測>
次に本発明の粒子計測装置における、粒子の真球度の計測原理について説明する。計測対象となる粒子がシリコンオイルの液滴や気泡の場合にはその形状は真球(完全球体)であるが、タンパク質の凝集体の場合には一般に球体とは異なる形状を取る。したがって、粒子の真球度(どの程球体に近い形状か)を評価することにより、粒子の種類を判別することが可能となる。<Embodiment 1: Measurement of sphericity>
Next, the principle of measuring the sphericity of particles in the particle measuring apparatus of the present invention will be described. When the particles to be measured are silicon oil droplets or bubbles, they have a true sphere (perfect sphere) shape, but protein aggregates generally have a different shape from a sphere. Therefore, by evaluating the sphericity of the particles (how close to a sphere they are), it is possible to determine the type of particles.
図5は、真球ではない粒子を計測する様子を示す模式図である。図5に示すように、粒子が真球でない場合、粒子の向きによって粒子からの反射光量は異なる。具体的には、図5右に示す状態の粒子は、図5左に示す状態の粒子よりも光スポット内における粒子の投影面積の比率が大きいため、反射光量が大きい。Fig. 5 is a schematic diagram showing how particles that are not spherical are measured. As shown in FIG. 5, when the particles are not perfectly spherical, the amount of light reflected from the particles varies depending on the orientation of the particles. Specifically, the particles in the state shown in the right side of FIG. 5 have a larger projected area ratio in the light spot than the particles in the state shown in the left side of FIG.
液中では粒子の向きは絶えず変化しているので、同じ粒子からの反射光量を異なる時刻に繰り返し検出すると、真球でない粒子からの反射光量は一定値ではなくある程度のばらつきを持つ。すなわち、粒子の真球度の差を、繰り返し取得した反射光量のばらつきの大きさの差として検出することができる。そこで本発明では、同一粒子からの反射光を繰り返し検出するために、特定の3次元領域に対して光の焦点位置を繰り返し走査することとした。 Because the direction of the particles in the liquid is constantly changing, if the amount of reflected light from the same particle is repeatedly detected at different times, the amount of reflected light from non-spherical particles will not be a constant value but will vary to some extent. That is, the difference in sphericity of particles can be detected as the difference in the magnitude of variation in the amount of reflected light obtained repeatedly. Therefore, in the present invention, in order to repeatedly detect the reflected light from the same particle, the focal position of the light is repeatedly scanned with respect to a specific three-dimensional area.
図6は、繰り返し走査の際のZステージ115の動作を説明する図である。あるZ方向の幅Lzの領域に対して、時間間隔t(特定の3次元領域を1回走査するのに要する時間)で、N回繰り返し走査を実施する。FIG. 6 is a diagram for explaining the operation of the
図7Aは、本発明の粒子計測装置を用いて真球度の高い粒子と低い粒子からの反射光を繰り返し取得した際に予想される結果の模式図である。真球度の高い粒子の信号振幅はほぼ一定であるのに対して、真球度の低い粒子の信号振幅は図7に示すようにばらつくことが予想される。本発明においては、粒子の真球度を表すパラメータεを以下の式で定義することとした。式におけるAmin、Amaxは、それぞれ繰り返し取得した粒子からの反射信号振幅Aの最小値と最大値である。FIG. 7A is a schematic diagram of expected results when reflected light from particles with high sphericity and particles with low sphericity are repeatedly acquired using the particle measuring device of the present invention. While the signal amplitude of particles with high sphericity is almost constant, the signal amplitude of particles with low sphericity is expected to vary as shown in FIG. In the present invention, the parameter ε representing the sphericity of particles is defined by the following equation. Amin and Amax in the equation are the minimum and maximum values of the reflected signal amplitude A from the particles repeatedly acquired, respectively.

εは光スポット内の粒子の投影面積の最大値と最小値の比率に相当しており、ε=1のときが真球である。真球でない粒子の粒径は、例えば信号振幅の平均値Aaveを用いて定義することができる。スポットサイズよりも大きな粒子の粒径及び真球度は、顕微鏡法と同様に画像から直接評価することが可能である。ε corresponds to the ratio between the maximum and minimum projected areas of the particles in the light spot, and when ε=1, the particles are true spheres. The particle size of non-spherical particles can be defined using, for example, the average signal amplitude valueAave . The particle size and sphericity of particles larger than the spot size can be evaluated directly from the image, similar to microscopy.
図7Bは、図7Aと同様の予想結果を示す模式図である。真球度を高い精度で計測する上では、粒子からの信号振幅は数十回以上取得することが望ましい。図7Aは0回目の走査から30回目の走査まで31回連続で粒子からの反射信号振幅を取得した例であるが、このように必ずしも最初の(0回目の)走査から最後の走査まで連続して信号振幅を取得する必要はない。例えば、合計で300回の走査を実施し、その中の100回目から131回目までの走査において、走査範囲に存在した粒子の信号振幅を連続して取得することとしてもよい。図7Bはその1例を示す。FIG. 7B is a schematic diagram showing a prediction result similar to that of FIG. 7A. In order to measure the sphericity with high accuracy, it is desirable to acquire the signal amplitude from the particles several tens of times or more. FIG. 7A shows an example in which the reflected signal amplitudes from the particles are obtained 31 times in a row from the 0th scan to the 30th scan, but it is not always necessary to obtain the signal amplitude continuously from the first (0th) scan to the last scan. For example, a total of 300 scans may be performed, and the signal amplitudes of particles present in the scanning range may be continuously acquired in the 100th to 131st scans. FIG. 7B shows one such example.
図8は、本発明の粒子計測装置を用いて凝集体とシリコンオイルの液滴の混合サンプルを測定し、平均信号振幅Aave(あるいは粒径)と真球度パラメータεに対して粒子をプロットした際に期待される結果の例である。真球度の低い領域にタンパク質の凝集体が分布し、真球度の高い領域にシリコンオイルの液滴が分布するので、粒径を計測すると同時に両者を区別することが可能になる。FIG. 8 shows an example of the results expected when measuring a mixed sample of aggregates and silicone oil droplets using the particle measuring device of the present invention and plotting the particles against the average signal amplitude Aave (or particle size) and the sphericity parameter ε. Since protein aggregates are distributed in regions with low sphericity and droplets of silicone oil are distributed in regions with high sphericity, it is possible to measure the particle size and distinguish between the two.
<実施の形態1:真球度の計測に必要な条件>
次に、同一の粒子からの反射光を複数回取得するために必要な条件について説明する。第1に、m回目の走査とm+1回目(mはN以下の自然数)の走査との間において粒子の同一性が保たれる必要がある。ここで、粒子の同一性とは、m回目の走査で検出された各粒子が、m+1回目の走査で検出された各粒子と同一の粒子であることを確認できる状態を意味することとする。液中の粒子はブラウン運動をしており、時間間隔tにおけるブラウン運動に起因する典型的な粒子の移動量Δrは粒子の拡散定数をDとして以下の式で与えられる。αは1以上の定数である。<Embodiment 1: Conditions necessary for measurement of sphericity>
Next, the conditions required to acquire reflected light from the same particle a plurality of times will be described. First, the identity of particles must be maintained between the mth scan and the m+1th scan (m is a natural number equal to or less than N). Here, the identity of particles means a state in which it can be confirmed that each particle detected in the m-th scan is the same particle as each particle detected in the m+1-th scan. Particles in liquid undergo Brownian motion, and a typical particle movement amount Δr due to Brownian motion at time interval t is given by the following equation, where D is the diffusion constant of the particles. α is a constant of 1 or more.

ブラウン運動による粒子の移動量はガウス分布に従い、例えばα=1の場合には約68%、α=2の場合には約95%の確率で粒子の移動量がΔr以下となる。粒子の拡散定数Dはボルツマン定数kB、溶媒の絶対温度T、溶媒の粘度η、粒径dを用いて下記式で表される。The amount of particle movement due to Brownian motion follows a Gaussian distribution. The diffusion constant D of particles is expressed by the following formula using the Boltzmann constant kB , the absolute temperature T of the solvent, the viscosity η of the solvent, and the particle size d.

例えば、α=2、t=5秒、d=0.2μm、kB=1.38×10⁻²³J/K、T=25℃(298.15K)、η=0.00089Pa*sとしたときのΔrは約5.0μmである。一方で、粒子密度をnとすると、平均粒子間隔laveは以下の式で与えられる。For example, Δr is about 5.0 μm when α=2, t=5 seconds, d=0.2 μm, kB =1.38×10⁻²³ J/K, T=25° C. (298.15 K), and η=0.00089 Pa*s. On the other hand, when the particle density is n, the average particle spacinglave is given by the following formula.

例えば粒子濃度が107個/mLの場合、laveは約46μmである。m回目とm+1回目の走査において、粒子の同一性が保たれるためには、平均粒子間隔が時間間隔tにおけるブラウン運動による粒子の移動量の2倍よりも大きい必要がある。これを式で表すと、下記式となる。Dmaxは、計測対象とする粒径範囲のうち、もっともブラウン運動の大きい、すなわち最も小さい粒子に対する拡散定数である。For example, when the particle concentration is 107 particles/mL,lave is about 46 μm. In order for the identity of the particles to be maintained between the mth and m+1th scans, the average particle spacing must be greater than twice the amount of movement of the particles due to Brownian motion during the time interval t. When this is represented by a formula, it becomes the following formula. Dmax is the diffusion constant for particles with the largest Brownian motion, that is, the smallest particles in the particle size range to be measured.

αの値については、例えばα=1の場合には約68%以上、α=2の場合には約95%以上の粒子に対して同一性が保たれる。式8をtについて解くことにより、粒子の同一性を保つために必要な3次元領域の1回あたりの走査時間tに対する以下の条件が得られる。Regarding the value of α, for example, when α=1, the identity is maintained for about 68% or more of the particles, and when α=2, about 95% or more of the particles. Solving

tcは粒子濃度と(拡散定数を介して)粒径に依存するので、計測対象とする粒子濃度範囲と粒径範囲に応じて、tcを適切な値に設定する必要がある。Sincetc depends on particle concentration and particle size (via the diffusion constant), it is necessary to settc to an appropriate value depending on the particle concentration range and particle size range to be measured.
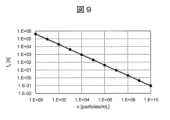
図9は、tcの濃度に対する依存性を示す。計算に用いたパラメータはd=0.2μm、T=25℃(298.15K)、η=0.00089Pa*s、α=3である。粒子濃度が高くなるにつれて、平均粒子間隔が小さくなるので、粒子の同一性を保つために必要な走査時間tcは短くなる。例えばn=107個/mLのときのtcは約9.1秒である。濃度が高いために式9を満たすことが困難な場合には、適度な倍率でサンプル114を希釈することにより、式9の条件を満たすことができる。FIG. 9 shows the dependence of tc on concentration. Parameters used for the calculation are d=0.2 μm, T=25° C. (298.15 K), η=0.00089 Pa*s, and α=3. As the particle concentration increases, the scan timetc required to maintain particle identity decreases because the average particle spacing decreases. For example, tc is about 9.1 seconds when n=107 /mL. If it is difficult to satisfy Equation 9 due to its high concentration, the condition of Equation 9 can be satisfied by diluting the
3次元領域に対する1回あたりの走査時間tは、XY平面に対する1回あたりの走査時間をΔt、Zステージ115による1回あたりのZ方向へのサンプル移動量をpzとすると、下記式で表すことができる。The scanning time t per scan for the three-dimensional area can be expressed by the following formula, where Δt is the scanning time per scan for the XY plane, andpz is the amount of sample movement in the Z direction per scan by the

式10を式9に代入することにより、粒子の同一性を保つために必要なΔt、Lz、pzが満たすべき以下の条件が導かれる。By substituting

本発明においては、式11を満たすようにLz、pz、Δtを設定することにより、N回の繰り返し走査の間に粒子の同一性を保つこととした。粒子が小さいほどtcの値は小さくなるので、計測対象とする粒子のうち最も小さい粒子サイズ(ユーザが計測を望む最も小さい粒子サイズ)に対して式11を満たすことが必要である。例えば、pz=1.0μm、Lz=100μm、n=107個/mL、d=0.2μm、T=25℃(298.15K)、η=0.00089Pa*s、α=2(図12に関連して後に参照するためこのパラメータ条件を条件Iと称する)のときの式11はΔt<0.09となり、これを満たす走査速度はガルバノミラーで十分に達成可能である。In the present invention, by setting Lz , pz , and Δt so as to satisfy Equation 11, the identity of the particles is maintained during N repeated scans. Since the smaller the particle, the smaller the value oftc , it is necessary to satisfy Equation 11 for the smallest particle size among the particles to be measured (the smallest particle size that the user desires to measure). For example, Equation 11 when pz = 1.0 µm, Lz = 100 µm, n =107 particles/mL, d = 0.2 µm, T = 25°C (298.15 K), η = 0.00089 Pa*s, α = 2 (this parameter condition will be referred to as Condition I for later reference in connection with Fig. 12) yields Δt < 0.09, a scanning speed that satisfies this is well achievable with a galvanometer mirror. There is.
図10は、あるz位置におけるm回目とm+1回目の走査それぞれにおいて得られたXY画像の模式図である。図中のバツ印はm回目の走査における各粒子の位置であり、点線で示された円はバツ印を中心とした半径Δrの円である。図10上段に示したように、式11の条件が満たされない場合には、円と円が重なり合う(平均粒子間隔よりも粒子の移動量が大きい)ので、粒子の同一性を確保することができない。たとえば、(m+1)番目の走査で得られた画像における1番と2番の粒子は円が重なり合った領域に存在するので、どちらがどちらの粒子であるかを判別することはできない。一方で、図10下段に示したように、式11の条件が満たされる場合には、円と円が重なり合わないので、m回目の走査において検出された粒子位置に最も近い粒子が、元の粒子であると判断することができる。FIG. 10 is a schematic diagram of XY images obtained in each of the m-th and m+1-th scans at a certain z position. The cross marks in the figure are the positions of the respective particles in the m-th scan, and the circle indicated by the dotted line is a circle with a radius Δr centered on the cross mark. As shown in the upper part of FIG. 10, when the condition of Equation 11 is not satisfied, the circles overlap (the movement amount of the particles is larger than the average particle spacing), so the identity of the particles cannot be ensured. For example,
図11は、サンプル内の3次元領域を示す模式図である。同一の粒子からの反射光をN回繰り返し取得するためのもう1つの条件は、N回走査する間に粒子がブラウン運動や沈降によって走査対象の3次元領域の外に移動しないことである。図11に示したように、走査開始時点で走査領域Vの周辺部に存在する粒子は、N回繰り返し走査する間に走査領域Vの外に移動する可能性がある(図11にはxz断面を示している)。走査領域のxyz方向の幅をLx,Ly,Lzとして、走査領域Vを下記式で表す。FIG. 11 is a schematic diagram showing a three-dimensional region within a sample. Another condition for repeatedly acquiring reflected light from the same particle N times is that the particle does not move out of the three-dimensional area to be scanned due to Brownian motion or sedimentation during the N times of scanning. As shown in FIG. 11, particles present in the periphery of the scanning region V at the start of scanning may move outside the scanning region V during N repetitions of scanning (FIG. 11 shows the xz cross section). The scanning area V is represented by the following formula, where the widths of the scanning area in the xyz direction areLx ,Ly , andLz .

粒子のブラウン運動と沈降を考慮し、N回繰り返し反射光を検出可能な粒子が存在する領域V’(3次元領域Vの内部領域)について考える。対流は十分に抑えられているとして、粒子のxy方向への移動はブラウン運動によってのみ生じると仮定すると、最もxy方向への移動量が大きいのは最もサイズの小さな粒子である。計測対象とする粒子のうち最も小さい粒子サイズの時間Ntの間に生じるx方向、y方向それぞれの移動量ΔLx、ΔLyは、下記式で表される。Considering Brownian motion and sedimentation of particles, consider a region V′ (internal region of the three-dimensional region V) in which particles whose reflected light can be detected repeatedly N times are present. Assuming that convection is sufficiently suppressed and that movement of particles in the xy directions is caused only by Brownian motion, the smallest particles move the most in the xy directions. Movement amounts ΔLx and ΔLy in the x direction and y direction generated during the time Nt of the smallest particle size among the particles to be measured are represented by the following equations.


したがって、N回繰り返し反射光を検出するためには、粒子は以下のxy領域に存在しなければならず、これが領域V’のxy方向の範囲となる。Therefore, in order to detect reflected light repeatedly N times, the particles must exist in the following xy region, which is the xy direction range of region V'.

粒子のz方向の移動は、ブラウン運動と沈降によって生じ、時間Ntの間のz方向への粒子の移動量ΔZは以下のように両者の和で表される。Movement of particles in the z direction is caused by Brownian motion and sedimentation, and the amount of movement ΔZ of particles in the z direction during time Nt is expressed as the sum of both as follows.

重力方向をz軸正方向として、沈降速度は溶媒と粒子の密度の大小関係により正負いずれの値も取りうることを考慮すると、zの正方向と負方向それぞれに生じる粒子の最大移動量ΔLz+,ΔLz-は以下の式で表される。Considering that the direction of gravity is the positive direction of the z-axis and that the sedimentation velocity can take both positive and negative values depending on the magnitude relationship between the density of the solvent and the particles, the maximum movement amounts ΔLz+ and ΔLz- of particles occurring in the positive and negative directions of z are represented by the following equations.


ここで、例えば式17の右辺は、正の沈降速度を持つ粒子に関して、括弧内の値を粒径に対して最大化するという意味である。対象とする粒径範囲の粒子の反射光をN回繰り返し取得するためには、粒子は以下のz領域に存在しなければならず、これが領域V’のz方向の範囲となる。Here, for example, the right side of Equation 17 means that the value in parentheses is maximized with respect to the particle size for particles with a positive sedimentation velocity. In order to repeatedly acquire reflected light from particles in the target size range N times, the particles must be present in the following z-region, which is the z-direction range of region V'.

式15と式19より、領域V’の体積が0以上であるためには、以下の条件が満たされる必要がある。According to Equations 15 and 19, the following conditions must be satisfied in order for the volume of region V' to be 0 or more.


例えば、α=2、N=10、t=5秒、d=0.2μm、kB=1.38×10⁻²³J/K、T=25℃(298.15K)、η=0.00089Pa*sのときの式20と式21はLx,Ly>62.7μmとなり、これは通常のガルバノスキャナと対物レンズの組み合わせで十分に達成可能な条件である。For example, α = 2, N = 10, T = 5 seconds, D = 0.2 μm, d = 0.2 μm, KB = 1.38 × 10 J /23 J / K, T = 25 ° C (298.15k), η =
次にΔLz+,ΔLz-の具体的な値について説明する。粒子の沈降速度vは以下の式で与えられる。dは粒径、ρparticleは粒子の密度、cは粒子の抵抗係数、ρsolventは溶媒の密度、gは重力加速度である。Next, specific values of ΔLz+ and ΔLz− will be explained. The sedimentation velocity v of particles is given by the following equation. d is the particle size, ρparticle is the particle density, c is the particle drag coefficient, ρsolvent is the solvent density, and g is the gravitational acceleration.

粒子が静かに沈降するとき、つまり粘性に対して慣性が非常に小さいとき,粒子の抵抗係数cはレイノルズ数をRとして下記式で与えられる。When the particles settle quietly, that is, when the inertia is very small relative to the viscosity, the drag coefficient c of the particles is given by the following formula, where R is the Reynolds number.

また、レイノルズ数Rは下記式で表される。 In addition, the Reynolds number R is represented by the following formula.

式24と式25を式23に代入して整理すると以下の式が得られる。The following formula is obtained by substituting formulas 24 and 25 into formula 23 and arranging them.

図12は、式16に式6と式26を代入して計算した、凝集体(沈降速度が正)とシリコンオイル(沈降速度が負)のΔZおよび粒径dに対する依存性を示す。計算に用いたパラメータは、N=10、t=5秒、kB=1.38×10⁻²³J/K、T=25℃(298.15K)、η=0.00089Pa*s、g=9.8m/s2、ρsolvent=1.0g/cm3、ρparticleは凝集体については1.2g/cm3、シリコンオイルについては0.818g/cm3である。粒径が小さい場合(1.0μm程度以下)にはブラウン運動の寄与が大きく、1.0μm以下の粒子を計測対象とする場合には、沈降の影響はほぼ無視することができる。FIG. 12 shows the dependence of aggregates (positive sedimentation velocity) and silicone oil (negative sedimentation velocity) on ΔZ and particle size d, calculated by substituting Eqs. 6 and 26 into Eq. The parameters used in the calculation are N = 10, t = 5 seconds, kB = 1.38 × 10⁻²³ J/K, T = 25°C (298.15K), η = 0.00089 Pa*s, g = 9.8 m/s2 , ρsolvent = 1.0 g/
計測対象の粒径dの範囲を0.2μm~2.0μmとする。式16~式18について説明したように、ΔLz+とΔLz-は、dの可変範囲におけるΔZの最大値である。したがって図12に示すように、d=0.2μmのときのΔZの値がΔLz+とΔLz-となり、いずれも約31.6μmである。このとき、式22の条件はLz>63.1μmとなり、これは上で述べた式11を満たす条件の1例である条件Iで満たされている。The range of particle size d to be measured is set to 0.2 μm to 2.0 μm. 16-18, ΔLz+ and ΔLz− are the maximum values of ΔZ in the variable range of d. Therefore, as shown in FIG. 12, the values of ΔZ when d=0.2 μm are ΔLz+ and ΔLz− , both of which are approximately 31.6 μm. At this time, the condition of Equation 22 is Lz >63.1 μm, which is satisfied by Condition I, which is an example of the condition satisfying Equation 11 described above.
計測対象を1.0μm以下の粒子の小さな粒子に限定し、粒子の沈降がほぼ無視できる場合は、式22の条件を簡略化することができる。式17と式18にv=0を代入すると以下の式が得られる。If the objects to be measured are limited to small particles of 1.0 μm or less, and the sedimentation of particles can be almost ignored, the conditions of Equation 22 can be simplified. Substituting v=0 into Equations 17 and 18 yields the following equations.

式27を式22に代入すると下記式となる。Substituting Equation 27 into Equation 22 yields the following equation.

さらに、式28に式10を代入して整理すると、以下の条件式が得られる。これは、粒子の沈降が無視できる場合の式22と同等の条件である。Furthermore, by substituting

上述したように、本実施形態1においては、式11と式20~22に示す条件を満たすように3次元領域を繰り返し走査し、粒子からの反射光を繰り返し検出することにより、粒径だけでなく粒子の真球度を評価することができる。これにより粒子の種類の判別が可能になる。As described above, in
本実施形態1においては、走査開始時点で走査領域Vの周辺部に存在する粒子を計測対象とする場合について説明したが、例えば繰り返し走査の途中で計測領域の外から計測領域の中に移動してきた粒子を計測対象としてもよい。この場合には式20~22は満足される必要はない。また、繰り返し測定回数N、走査領域V、および領域V’は走査開始時点で定義したものを最後の走査まで用いる必要はなく、走査の途中で定義しなおすことが可能である。In the first embodiment, the case where the particles existing in the periphery of the scanning area V at the start of scanning are to be measured is described, but for example, particles that have moved from outside the measurement area into the measurement area during repeated scanning may be the measurement targets. Equations 20-22 need not be satisfied in this case. Further, the number of repeated measurements N, the scanning area V, and the area V' do not need to be defined at the start of scanning until the final scanning, and can be redefined during the scanning.
<実施の形態2:ブラウン運動の評価>
粒子の座標はブラウン運動により絶えず変化しており、ブラウン運動による粒子の移動量は粒径によって異なる。本発明の粒子計測装置では、特定の3次元領域を繰り返し走査するので、粒子の座標を一定時間観測し続けることが可能である。そこで、本発明の実施形態2においては、ブラウン運動による粒子の移動量に基いて式6で表される粒子の拡散定数を算出し、さらに拡散定数の値から粒径を算出することとした。粒子計測装置の構成は実施形態1と同様である。信号振幅Aは粒子の直径と屈折率に依存し、ブラウン運動は式6に示されるように粒子の直径にのみ依存するので、両者は粒子に関する異なる情報を与える。<Embodiment 2: Evaluation of Brownian motion>
The coordinates of particles are constantly changing due to Brownian motion, and the amount of movement of particles due to Brownian motion differs depending on the particle size. Since the particle measuring apparatus of the present invention repeatedly scans a specific three-dimensional area, it is possible to continuously observe the coordinates of particles for a certain period of time. Therefore, in
粒子の移動はブラウン運動以外に、サンプル114内の熱の不均一性等に起因する溶媒の対流によっても生じるので、対流の発生を抑制する、あるいは対流の影響を抑制することは、安定した計測精度を確保する上で重要である。本発明においては、放熱性の高いベースプレート111を用いることにより、サンプル114に熱が蓄積するのを抑制し、対流を抑制することとした。さらに、溶媒の対流によって生じる粒子の移動は粒径に依らずほぼ一定であるため、粒子の移動量を評価する際に、全粒子の平均的な移動量を減算することにより、対流の影響を取り除くこととした。In addition to Brownian motion, particle movement is also caused by convection of the solvent caused by heat non-uniformity in the
図13は、本発明の粒子計測装置を用いてタンパク質の凝集体と気泡の混合サンプルを測定し、信号振幅Aとブラウン運動に基いて算出される粒径dBに対して粒子をプロットした際に期待される結果の例である。気泡は凝集体と比べると溶媒との屈折率差が大きく、凝集体よりも信号振幅の大きな領域に分布する。したがって、凝集体と気泡を区別することが可能になる。すなわち、本発明においては3次元領域を繰り返し走査し、粒子の座標を観測し続けることにより、信号振幅に加えてブラウン運動による粒子の移動量を評価し、粒子の種類の判別が可能になる。FIG. 13 shows an example of the results expected when measuring a mixed sample of protein aggregates and bubbles using the particle measuring device of the present invention and plotting the particles against the particle sizedB calculated based on the signal amplitude A and Brownian motion. Bubbles have a larger refractive index difference with the solvent than aggregates, and are distributed in a region with a larger signal amplitude than aggregates. It is thus possible to distinguish between agglomerates and bubbles. That is, in the present invention, by repeatedly scanning the three-dimensional area and continuously observing the coordinates of the particles, it is possible to evaluate the amount of movement of the particles due to Brownian motion in addition to the signal amplitude, thereby making it possible to discriminate the types of particles.
<実施の形態3:沈降速度の評価>
液中の粒子は重力の作用によって沈降するので、時間とともに重力方向の位置(Z座標)が変化する。本発明の実施形態3においては、特定の3次元領域を繰り返し走査することにより粒子のZ座標を一定時間観測し続け、粒子からの反射信号振幅だけでなく式23あるいは式26で表される粒子の沈降速度を評価することとした。粒子計測装置の構成は実施形態1~2と同様である。<Embodiment 3: Evaluation of sedimentation velocity>
Since the particles in the liquid settle due to the action of gravity, the position in the direction of gravity (Z coordinate) changes with time. In
反射信号振幅Aは粒子の直径と屈折率に依存し、沈降速度vは粒子の直径と密度に依存するので、反射信号振幅Aと進行速度vは粒子に関する異なる情報を与える。例えば、d=1.0μm、ρparticle=1.2g/cm3、ρsolvent、=1.0g/cm3、g=9.8m/s2として式26を用いて沈降速度を計算するとv=0.12μm/sとなる。Since the reflected signal amplitude A depends on the particle diameter and refractive index, and the sedimentation velocity v depends on the particle diameter and density, the reflected signal amplitude A and the traveling velocity v give different information about the particle. For example, if d=1.0 μm, ρparticle =1.2 g/cm3 , ρsolvent =1.0 g/cm3 , g=9.8 m/s2 and the sedimentation velocity is calculated using Equation 26, v=0.12 μm/s.
図14は、本発明の粒子計測装置を用いてタンパク質の凝集体と気泡とシリコンオイルの液滴の混合サンプルを測定し、信号振幅Aと沈降速度vに対して粒子をプロットした際に期待される結果の例である。凝集体は一般的な溶媒よりも密度が大きいので正の沈降速度を持ち、気泡とシリコンオイルは溶媒よりも密度が小さいので負の沈降速度を持つ。気泡はシリコンオイルよりも溶媒との屈折率差が大きく、また密度が小さいので、シリコンオイルよりも信号振幅は大きく、沈降速度は小さい(絶対値は大きい)領域に分布すると考えられる。結果として、図14に示すように3種類の粒子は分離して検出される。Fig. 14 shows an example of the results expected when a mixed sample of protein aggregates, air bubbles, and silicon oil droplets is measured using the particle measuring device of the present invention, and particles are plotted against signal amplitude A and sedimentation velocity v. Agglomerates have a positive sedimentation velocity because they are denser than the common solvent, and bubbles and silicone oil have a negative sedimentation velocity because they are less dense than the solvent. Since bubbles have a larger refractive index difference with the solvent than silicon oil and have a smaller density, they are considered to be distributed in a region with a larger signal amplitude and a smaller sedimentation velocity (larger absolute value) than silicon oil. As a result, the three types of particles are detected separately as shown in FIG.
このように、本実施形態3においては3次元領域を繰り返し走査し、粒子の座標を観測し続けることにより、信号振幅に加えて沈降速度による粒子の移動量を評価し、粒子の種類の判別が可能になる。また、沈降速度だけでなく、実施形態1で説明した真球度、実施形態2で説明したブラウン運動に基く粒径も同時に算出することにより、さらに高精度で粒子の種類を判別することも可能である。In this way, in
<実施の形態4:攪拌・加熱ストレスの付与>
図15は、本発明の実施形態4に係る粒子計測装置の構成例を示す模式図である。本実施形態4は、恒温恒湿槽201および振動ストレス付与部202をさらに有する点において、実施形態1~3とは異なる。その他の構成は実施形態1~3と同様である。<Embodiment 4: Addition of stirring/heating stress>
FIG. 15 is a schematic diagram showing a configuration example of a particle measuring device according to Embodiment 4 of the present invention. Embodiment 4 differs from
凝集体は加熱・振動などの物理的ストレスによって発生することが知られており、製剤研究においては、より凝集体の生成されにくい条件を探索するために様々な溶媒条件でストレス試験を実施する。通常、ストレス試験機を用いてサンプルに加熱・振動等のストレスを付与したあとに、粒子計測装置を用いて計測を実施する。このプロセスは、サンプルを移し替える手間を要する、ストレスを付与してから計測までにタイムラグが生じる、ストレスを与えながらのリアルタイム計測ができない、といった課題があった。Aggregates are known to be generated by physical stress such as heating and vibration, and in formulation research, stress tests are conducted under various solvent conditions in order to find conditions that make it more difficult for aggregates to form. Usually, after applying stress such as heating and vibration to a sample using a stress tester, measurement is performed using a particle measuring device. This process had problems such as the time required to transfer the sample, the time lag between the application of stress and the measurement, and the inability to perform real-time measurement while applying stress.
本実施形態4においては、サンプルを一定の温度に保つ恒温恒湿槽201と、サンプルに振動ストレスを与える振動ストレス付与部202を設けることにより、ストレス試験機の役割を粒計測装置内に内蔵することとした。本実施例においては、ストレス試験の際にサンプルを移し替える手間がかからず、ストレスを付与した直後に計測が可能である。また、加熱ストレスを与えながらのリアルタイム計測が可能であると言った利点がある。In the fourth embodiment, the role of the stress tester is built into the grain measuring device by providing a constant temperature and
<本発明の変形例について>
本発明は、前述した実施形態に限定されるものではなく、様々な変形例が含まれる。例えば、上記した実施形態は本発明を分かりやすく説明するために詳細に説明したものであり、必ずしも説明した全ての構成を備えるものに限定されるものではない。また、ある実施形態の構成の一部を他の実施形態の構成に置き換えることが可能であり、また、ある実施形態の構成に他の実施形態の構成を加えることも可能である。また、各実施形態の構成の一部について、他の構成の追加・削除・置換をすることが可能である。<Regarding Modifications of the Present Invention>
The present invention is not limited to the embodiments described above, and includes various modifications. For example, the above-described embodiments have been described in detail in order to explain the present invention in an easy-to-understand manner, and are not necessarily limited to those having all the configurations described. Also, part of the configuration of one embodiment can be replaced with the configuration of another embodiment, and the configuration of another embodiment can be added to the configuration of one embodiment. Moreover, it is possible to add, delete, or replace a part of the configuration of each embodiment with another configuration.
以上の実施形態において、解析部135は、粒子種別を判定するために用いる2つ以上のパラメータを計算してその結果を何らかの形式によって出力してもよいし、さらにそのパラメータを用いて粒子種別を判定してその結果を出力してもよい。例えば図8、図13、図14などが例示するプロット平面上において、各プロットをクラスタリングする、あるいは各プロットを区分する区分線を特定する、などの手法により、各プロットをいずれかの粒子種別へ区分することができる。In the above embodiment, the
以上の実施形態において、3次元画像生成部134と解析部135は、これらの機能を実装した回路デバイスなどのハードウェアによって構成することもできるし、これらの機能を実装したソフトウェアをCPU(Central Processing Unit)などの演算装置が実行することによって構成することもできる。In the above embodiment, the three-dimensional
100:光源
101:レーザドライバ
109:対物レンズ
115:Zステージ
116:検出光学系
134:3次元画像生成部
135:解析部
136:表示部100: Light source 101: Laser driver 109: Objective lens 115: Z stage 116: Detection optical system 134: Three-dimensional image generation unit 135: Analysis unit 136: Display unit
Claims (15)
Translated fromJapanese光を出射する光源、
前記サンプルに対して前記光を集光して照射する光照射部、
前記光の焦点位置を前記サンプル内の3次元領域において繰り返し走査する走査部、
前記粒子からの反射光を検出する光検出部、
前記光検出部で検出された信号に基づいて前記サンプルの3次元画像を生成する画像生成部、
前記3次元画像を解析する解析部、
を備え、
前記解析部は、
前記焦点位置を前記光の光軸方向に沿って前記3次元領域内において繰り返し走査する過程において各前記焦点位置から取得する前記反射光の最大強度から得られる、前記粒子の種別を表す1つ以上のパラメータ、
前記粒子を継続的にトラッキングすることにより取得する前記粒子の位置に基づいて得られる、前記粒子の種別を表す1つ以上のパラメータ、
のうち少なくとも2つ以上を計算してその結果を出力する
ことを特徴とする粒子計測装置。A particle measuring device for measuring the particles contained in a sample containing a solvent and particles,
a light source that emits light,
a light irradiation unit that collects and irradiates the light onto the sample;
a scanning unit that repeatedly scans the focal position of the light in a three-dimensional area within the sample;
a light detection unit that detects reflected light from the particles;
an image generator that generates a three-dimensional image of the sample based on the signal detected by the photodetector;
an analysis unit that analyzes the three-dimensional image;
with
The analysis unit is
One or more parameters representing the type of the particles obtained from the maximum intensity of the reflected light obtained from each of the focal positions in the process of repeatedly scanning the focal position within the three-dimensional region along the optical axis direction of the light,
one or more parameters representing the type of the particle obtained based on the position of the particle obtained by continuously tracking the particle;
A particle measuring device that calculates at least two or more of and outputs the results.
前記最大強度、前記粒子の屈折率、前記溶媒の屈折率、および前記粒子のサイズ、
の間の関係にしたがって、前記粒子のサイズを前記パラメータとして計算する
ことを特徴とする請求項1記載の粒子計測装置。The analysis unit is
the maximum intensity, the particle refractive index, the solvent refractive index, and the particle size;
The particle measuring device according to claim 1, wherein the size of the particle is calculated as the parameter according to the relationship between.
前記解析部は、前記焦点位置を前記往復させる過程において各前記焦点位置から得られる前記最大強度を、前記繰り返しごとに取得し、
前記解析部は、全ての前記繰り返しにおける各前記最大強度のなかの最大値と最小値とを用いて、前記粒子の真球度を表す数値を前記パラメータとして計算する
ことを特徴とする請求項1記載の粒子計測装置。The scanning unit repeatedly reciprocates the focal position along the optical axis direction in the three-dimensional area,
The analysis unit acquires the maximum intensity obtained from each focus position in the process of reciprocating the focus position for each repetition,
2. The particle measuring device according to claim 1, wherein the analysis unit calculates, as the parameter, a numerical value representing the sphericity of the particle using the maximum value and the minimum value among the maximum intensities in all the repetitions.

ことを特徴とする請求項1記載の粒子計測装置。When the time required for the scanning unit to scan the three-dimensional region once is t, the maximum concentration of the particles to be measured is n, the minimum diffusion constant of the particles to be measured is D, and a constant of 1 or more is α,
前記3次元領域の前記光軸方向に沿った幅をLz、前記走査部が前記2次元平面を1回走査するのに要する時間をΔt、測定対象とする最大の前記粒子の濃度をn、測定対象とする最小の前記粒子の拡散定数をD、1以上の定数をαとしたとき、

ことを特徴とする請求項1記載の粒子計測装置。The scanning unit repeats the step of scanning the focal position of the light on a two-dimensional plane perpendicular to the optical axis, and the step of moving the position of the focal point of the light on the sample along the optical axis direction at intervals ofpz , thereby repeatedly scanning the focal position of the light in the three-dimensional area,
Lz is the width of the three-dimensional area along the optical axis direction, Δt is the time required for the scanning unit to scan the two-dimensional plane once, n is the maximum concentration of the particles to be measured, D is the minimum diffusion constant of the particles to be measured, and α is a constant of 1 or more,

ことを特徴とする請求項1記載の粒子計測装置。Lx andLy are the widths of the three-dimensional area in the vertical and horizontal directions in a plane perpendicular to the optical axis, Lz is the width of the three-dimensional area in the optical axis direction, t is the time required for the scanning unit to scan the three-dimensional area once, N is the number of times the scanning unit scans the three-dimensional area repeatedly, D is the minimum diffusion constant of the particles to be measured, α is a constant of 1 or more, ρp is the density of the particles, ρs is the density of the solvent, When the viscosity of the solvent is η, the acceleration of gravity is g, and the particle diameter of the particles is d,

ことを特徴とする請求項1記載の粒子計測装置。Lx andLy are the widths of the three-dimensional area in the vertical and horizontal directions in a plane perpendicular to the optical axis, Lz is the width of the three-dimensional area in the optical axis direction, t is the time required for the scanning unit to scan the three-dimensional area once, N is the number of times the scanning unit scans the three-dimensional area repeatedly, D is the minimum diffusion constant of the particles to be measured, and α is a constant of 1 or more.
前記光軸に対して垂直な平面内における前記3次元領域の縦横方向における幅をそれぞれLxとLy、前記3次元領域の前記光軸方向のおける幅をLz、前記走査部が前記2次元平面を1回走査するのに要する時間をΔt、前記走査部が前記3次元領域を繰り返し走査する回数をN、測定対象とする最小の前記粒子の拡散定数をD、1以上の定数をαとしたとき、

ことを特徴とする請求項1記載の粒子計測装置。The scanning unit repeats the step of scanning the focal position of the light on a two-dimensional plane perpendicular to the optical axis, and the step of moving the position of the focal point of the light on the sample along the optical axis direction at intervals ofpz , thereby repeatedly scanning the focal position of the light in the three-dimensional area,
Lx andLy are the widths of the three-dimensional area in the vertical and horizontal directions in the plane perpendicular to the optical axis, Lz is the width of the three-dimensional area in the optical axis direction, Δt is the time required for the scanning unit to scan the two-dimensional plane once, N is the number of times the scanning unit scans the three-dimensional area repeatedly, D is the minimum diffusion constant of the particles to be measured, and α is a constant of 1 or more,
ことを特徴とする請求項1記載の粒子計測装置。The particle measuring device according to claim 1, wherein the analysis unit calculates the diffusion coefficient of the particle as the parameter based on the temporal change in the position of the particle.
ことを特徴とする請求項9記載の粒子計測装置。The particle measuring device according to claim 9, wherein the analysis unit calculates the size of the particle as the parameter based on the diffusion coefficient of the particle.
ことを特徴とする請求項1記載の粒子計測装置。The particle measuring device according to claim 1, wherein the analysis unit calculates the sedimentation velocity of the particles as the parameter based on a change in the position of the particles in the gravitational direction over time.
ことを特徴とする請求項11記載の粒子計測装置。12. The particle measuring device according to claim 11, wherein the analysis unit classifies the types of the particles by using the signal amplitude of the reflected light and the sedimentation velocity as the parameters.
前記光源が出射する光を分岐して信号光と参照光を生成する光分岐部、
前記サンプルから反射した信号光を前記参照光と合波することにより互いに位相関係が異なる3つ以上の干渉光を生成する干渉光学系、
を備え、
前記光検出部は、前記干渉光を検出して電気信号として出力する
ことを特徴とする請求項1記載の粒子計測装置。The particle measuring device further comprises
an optical splitter that splits the light emitted from the light source to generate signal light and reference light;
an interference optical system that generates three or more interference lights with different phase relationships by combining the signal light reflected from the sample with the reference light;
with
The particle measuring device according to claim 1, wherein the light detection section detects the interference light and outputs it as an electric signal.
前記最大強度、
前記3次元領域内において前記焦点位置を前記光軸方向に沿って繰り返し往復させることにより得られる前記最大強度から算出される前記粒子の真球度、
前記粒子の位置の経時変化に基づいて計算される前記粒子の拡散定数または前記拡散定数から計算される前記粒子のサイズ、
前記粒子の重力方向における位置の時間変化に基づいて計算される前記粒子の沈降速度、
の4つのうち少なくとも2つ以上を前記パラメータとして出力する
ことを特徴とする請求項1記載の粒子計測装置。The analysis unit is
said maximum intensity;
sphericity of the particles calculated from the maximum intensity obtained by repeatedly reciprocating the focal position along the optical axis direction within the three-dimensional area;
a diffusion constant of said particle calculated based on the change in position of said particle over time or a size of said particle calculated from said diffusion constant;
the sedimentation velocity of the particles calculated based on the time change of the position of the particles in the gravitational direction;
2. The particle measuring device according to claim 1, wherein at least two or more of the four of are output as said parameters.
ことを特徴とする請求項1記載の粒子計測装置。2. The particle measuring device according to claim 1, wherein the analysis unit determines the type of the particle using the two or more parameters and outputs the result.
Priority Applications (5)
| Application Number | Priority Date | Filing Date | Title |
|---|---|---|---|
| CN202280066249.5ACN118043641A (en) | 2022-01-21 | 2022-01-21 | Particle measuring device |
| PCT/JP2022/002107WO2023139741A1 (en) | 2022-01-21 | 2022-01-21 | Particle measuring apparatus |
| JP2023574990AJPWO2023139741A1 (en) | 2022-01-21 | 2022-01-21 | |
| US18/697,047US20240410811A1 (en) | 2022-01-21 | 2022-01-21 | Particle Measuring Apparatus |
| EP22921898.7AEP4467961A1 (en) | 2022-01-21 | 2022-01-21 | Particle measuring apparatus |
Applications Claiming Priority (1)
| Application Number | Priority Date | Filing Date | Title |
|---|---|---|---|
| PCT/JP2022/002107WO2023139741A1 (en) | 2022-01-21 | 2022-01-21 | Particle measuring apparatus |
Publications (1)
| Publication Number | Publication Date |
|---|---|
| WO2023139741A1true WO2023139741A1 (en) | 2023-07-27 |
Family
ID=87348384
Family Applications (1)
| Application Number | Title | Priority Date | Filing Date |
|---|---|---|---|
| PCT/JP2022/002107CeasedWO2023139741A1 (en) | 2022-01-21 | 2022-01-21 | Particle measuring apparatus |
Country Status (5)
| Country | Link |
|---|---|
| US (1) | US20240410811A1 (en) |
| EP (1) | EP4467961A1 (en) |
| JP (1) | JPWO2023139741A1 (en) |
| CN (1) | CN118043641A (en) |
| WO (1) | WO2023139741A1 (en) |
Cited By (1)
| Publication number | Priority date | Publication date | Assignee | Title |
|---|---|---|---|---|
| WO2025101870A1 (en)* | 2023-11-08 | 2025-05-15 | Idexx Laboratories, Inc. | Systems and methods for biological optical imaging with artificial particles as references |
Citations (10)
| Publication number | Priority date | Publication date | Assignee | Title |
|---|---|---|---|---|
| JPH03500816A (en)* | 1987-11-10 | 1991-02-21 | イギリス国 | Particle asymmetry analyzer |
| US5905568A (en)* | 1997-12-15 | 1999-05-18 | The United States Of America As Represented By The Administrator Of The National Aeronautics And Space Administration | Stereo imaging velocimetry |
| JP4339924B1 (en) | 2008-09-02 | 2009-10-07 | オーム電機株式会社 | Particle size measuring apparatus and particle size measuring method |
| US8477307B1 (en)* | 2012-01-26 | 2013-07-02 | Ann Rachel Yufa | Methods and apparatus for biomedical agent multi-dimension measuring and analysis |
| WO2016159131A1 (en)* | 2015-03-30 | 2016-10-06 | 国立研究開発法人産業技術総合研究所 | Particle size measuring method and device |
| JP2016197130A (en)* | 2011-08-29 | 2016-11-24 | アムジェン インコーポレイテッド | Method and apparatus for non-destructive detection of non-dissolved particles in a fluid |
| US20170363532A1 (en)* | 2015-07-31 | 2017-12-21 | The Catholic University Of Korea Industry-Academic Cooperation Foundation | Cell analysis apparatus using plurality of lasers |
| JP2019045431A (en)* | 2017-09-06 | 2019-03-22 | 株式会社日立製作所 | Optical image measurement device |
| JP6559555B2 (en) | 2015-12-02 | 2019-08-14 | 株式会社日立エルジーデータストレージ | Optical measurement method and apparatus |
| WO2021199797A1 (en)* | 2020-03-31 | 2021-10-07 | 国立研究開発法人産業技術総合研究所 | Method for measuring refractive index of particles |
- 2022
- 2022-01-21CNCN202280066249.5Apatent/CN118043641A/enactivePending
- 2022-01-21JPJP2023574990Apatent/JPWO2023139741A1/jaactivePending
- 2022-01-21EPEP22921898.7Apatent/EP4467961A1/enactivePending
- 2022-01-21USUS18/697,047patent/US20240410811A1/enactivePending
- 2022-01-21WOPCT/JP2022/002107patent/WO2023139741A1/ennot_activeCeased
Patent Citations (10)
| Publication number | Priority date | Publication date | Assignee | Title |
|---|---|---|---|---|
| JPH03500816A (en)* | 1987-11-10 | 1991-02-21 | イギリス国 | Particle asymmetry analyzer |
| US5905568A (en)* | 1997-12-15 | 1999-05-18 | The United States Of America As Represented By The Administrator Of The National Aeronautics And Space Administration | Stereo imaging velocimetry |
| JP4339924B1 (en) | 2008-09-02 | 2009-10-07 | オーム電機株式会社 | Particle size measuring apparatus and particle size measuring method |
| JP2016197130A (en)* | 2011-08-29 | 2016-11-24 | アムジェン インコーポレイテッド | Method and apparatus for non-destructive detection of non-dissolved particles in a fluid |
| US8477307B1 (en)* | 2012-01-26 | 2013-07-02 | Ann Rachel Yufa | Methods and apparatus for biomedical agent multi-dimension measuring and analysis |
| WO2016159131A1 (en)* | 2015-03-30 | 2016-10-06 | 国立研究開発法人産業技術総合研究所 | Particle size measuring method and device |
| US20170363532A1 (en)* | 2015-07-31 | 2017-12-21 | The Catholic University Of Korea Industry-Academic Cooperation Foundation | Cell analysis apparatus using plurality of lasers |
| JP6559555B2 (en) | 2015-12-02 | 2019-08-14 | 株式会社日立エルジーデータストレージ | Optical measurement method and apparatus |
| JP2019045431A (en)* | 2017-09-06 | 2019-03-22 | 株式会社日立製作所 | Optical image measurement device |
| WO2021199797A1 (en)* | 2020-03-31 | 2021-10-07 | 国立研究開発法人産業技術総合研究所 | Method for measuring refractive index of particles |
Non-Patent Citations (1)
| Title |
|---|
| T. P. BURGS. R. MANALIS, APPL. PHYS. LETT., vol. 83, 2003, pages 2698 - 2700 |
Cited By (1)
| Publication number | Priority date | Publication date | Assignee | Title |
|---|---|---|---|---|
| WO2025101870A1 (en)* | 2023-11-08 | 2025-05-15 | Idexx Laboratories, Inc. | Systems and methods for biological optical imaging with artificial particles as references |
Also Published As
| Publication number | Publication date |
|---|---|
| CN118043641A (en) | 2024-05-14 |
| US20240410811A1 (en) | 2024-12-12 |
| EP4467961A1 (en) | 2024-11-27 |
| JPWO2023139741A1 (en) | 2023-07-27 |
Similar Documents
| Publication | Publication Date | Title |
|---|---|---|
| Falke et al. | Dynamic light scattering (DLS) principles, perspectives, applications to biological samples | |
| JP2722362B2 (en) | Method and apparatus for measuring particle or defect size information | |
| JP4455730B2 (en) | Method and apparatus for particle evaluation using multi-scan beam reflectivity | |
| US11054356B2 (en) | Particle characterisation with a focus tuneable lens | |
| JP6030131B2 (en) | Optical detection and analysis of particles | |
| US5434667A (en) | Characterization of particles by modulated dynamic light scattering | |
| US11255767B2 (en) | Method for measuring light field distribution and device therefor | |
| Wishard et al. | Dynamic light scattering–an all-purpose guide for the supramolecular chemist | |
| US20170074768A1 (en) | Common Radiation Path for Acquiring Particle Information by Means of Direct Image Evaluation and Differential Image Analysis | |
| JP5841475B2 (en) | Dynamic light scattering measurement method and dynamic light scattering measurement device using low coherence light source | |
| KR20180011762A (en) | Particle analysis method | |
| JP2010532468A (en) | Apparatus and method for measuring static and dynamic scattering light at low volume | |
| CN113227759A (en) | Size distribution measuring device, size distribution measuring method, and sample container | |
| CN110161008A (en) | Common optical axis degree and amplification factor can self-alignment fluorescent grain tracing method and devices | |
| WO2023139741A1 (en) | Particle measuring apparatus | |
| Schwarz et al. | Investigations on the capability of the statistical extinction method for the determination of mean particle sizes in concentrated particle systems | |
| JPH0843292A (en) | A detector for measuring the intensity of light scattered by thin layers of colloidal media. | |
| WO2018179078A1 (en) | Photometric analysis device, photometric analysis method, and program | |
| CN114324339A (en) | A kind of spherical object mass measurement system and measurement method | |
| CN116045841B (en) | Fitting method, fitting device and measuring system of focusing curve | |
| US12270749B2 (en) | Imaging flow cytometer | |
| JP2022000612A (en) | Analysis apparatus and analysis method | |
| WO2023139777A1 (en) | Particle measurement device, particle measurement method, sample container | |
| SU823843A1 (en) | Method of touch-free measuring of transverse dimension of a micro-object | |
| CN105527224B (en) | A device and method for analyzing a sample |
Legal Events
| Date | Code | Title | Description |
|---|---|---|---|
| 121 | Ep: the epo has been informed by wipo that ep was designated in this application | Ref document number:22921898 Country of ref document:EP Kind code of ref document:A1 | |
| WWE | Wipo information: entry into national phase | Ref document number:2023574990 Country of ref document:JP | |
| WWE | Wipo information: entry into national phase | Ref document number:202280066249.5 Country of ref document:CN | |
| WWE | Wipo information: entry into national phase | Ref document number:2022921898 Country of ref document:EP | |
| NENP | Non-entry into the national phase | Ref country code:DE | |
| ENP | Entry into the national phase | Ref document number:2022921898 Country of ref document:EP Effective date:20240821 |