WO2020027213A1 - Dementia risk presentation system and method - Google Patents
Dementia risk presentation system and methodDownload PDFInfo
- Publication number
- WO2020027213A1 WO2020027213A1PCT/JP2019/030056JP2019030056WWO2020027213A1WO 2020027213 A1WO2020027213 A1WO 2020027213A1JP 2019030056 WJP2019030056 WJP 2019030056WWO 2020027213 A1WO2020027213 A1WO 2020027213A1
- Authority
- WO
- WIPO (PCT)
- Prior art keywords
- user
- brain
- risk
- line
- data
- Prior art date
- Legal status (The legal status is an assumption and is not a legal conclusion. Google has not performed a legal analysis and makes no representation as to the accuracy of the status listed.)
- Ceased
Links
Images


Classifications
- G—PHYSICS
- G16—INFORMATION AND COMMUNICATION TECHNOLOGY [ICT] SPECIALLY ADAPTED FOR SPECIFIC APPLICATION FIELDS
- G16H—HEALTHCARE INFORMATICS, i.e. INFORMATION AND COMMUNICATION TECHNOLOGY [ICT] SPECIALLY ADAPTED FOR THE HANDLING OR PROCESSING OF MEDICAL OR HEALTHCARE DATA
- G16H50/00—ICT specially adapted for medical diagnosis, medical simulation or medical data mining; ICT specially adapted for detecting, monitoring or modelling epidemics or pandemics
- G16H50/30—ICT specially adapted for medical diagnosis, medical simulation or medical data mining; ICT specially adapted for detecting, monitoring or modelling epidemics or pandemics for calculating health indices; for individual health risk assessment
- A—HUMAN NECESSITIES
- A61—MEDICAL OR VETERINARY SCIENCE; HYGIENE
- A61B—DIAGNOSIS; SURGERY; IDENTIFICATION
- A61B5/00—Measuring for diagnostic purposes; Identification of persons
- A61B5/02—Detecting, measuring or recording for evaluating the cardiovascular system, e.g. pulse, heart rate, blood pressure or blood flow
- A61B5/026—Measuring blood flow
- A—HUMAN NECESSITIES
- A61—MEDICAL OR VETERINARY SCIENCE; HYGIENE
- A61B—DIAGNOSIS; SURGERY; IDENTIFICATION
- A61B5/00—Measuring for diagnostic purposes; Identification of persons
- A61B5/05—Detecting, measuring or recording for diagnosis by means of electric currents or magnetic fields; Measuring using microwaves or radio waves
- A61B5/055—Detecting, measuring or recording for diagnosis by means of electric currents or magnetic fields; Measuring using microwaves or radio waves involving electronic [EMR] or nuclear [NMR] magnetic resonance, e.g. magnetic resonance imaging
- A—HUMAN NECESSITIES
- A61—MEDICAL OR VETERINARY SCIENCE; HYGIENE
- A61B—DIAGNOSIS; SURGERY; IDENTIFICATION
- A61B5/00—Measuring for diagnostic purposes; Identification of persons
- A61B5/24—Detecting, measuring or recording bioelectric or biomagnetic signals of the body or parts thereof
- A61B5/25—Bioelectric electrodes therefor
- A61B5/279—Bioelectric electrodes therefor specially adapted for particular uses
- A61B5/291—Bioelectric electrodes therefor specially adapted for particular uses for electroencephalography [EEG]
- A—HUMAN NECESSITIES
- A61—MEDICAL OR VETERINARY SCIENCE; HYGIENE
- A61B—DIAGNOSIS; SURGERY; IDENTIFICATION
- A61B5/00—Measuring for diagnostic purposes; Identification of persons
- A61B5/24—Detecting, measuring or recording bioelectric or biomagnetic signals of the body or parts thereof
- A61B5/316—Modalities, i.e. specific diagnostic methods
- A61B5/369—Electroencephalography [EEG]
- A—HUMAN NECESSITIES
- A61—MEDICAL OR VETERINARY SCIENCE; HYGIENE
- A61B—DIAGNOSIS; SURGERY; IDENTIFICATION
- A61B5/00—Measuring for diagnostic purposes; Identification of persons
- A61B5/40—Detecting, measuring or recording for evaluating the nervous system
- A61B5/4076—Diagnosing or monitoring particular conditions of the nervous system
- A61B5/4088—Diagnosing of monitoring cognitive diseases, e.g. Alzheimer, prion diseases or dementia
- A—HUMAN NECESSITIES
- A61—MEDICAL OR VETERINARY SCIENCE; HYGIENE
- A61B—DIAGNOSIS; SURGERY; IDENTIFICATION
- A61B5/00—Measuring for diagnostic purposes; Identification of persons
- A61B5/72—Signal processing specially adapted for physiological signals or for diagnostic purposes
- A61B5/7271—Specific aspects of physiological measurement analysis
- A61B5/7275—Determining trends in physiological measurement data; Predicting development of a medical condition based on physiological measurements, e.g. determining a risk factor
- G—PHYSICS
- G16—INFORMATION AND COMMUNICATION TECHNOLOGY [ICT] SPECIALLY ADAPTED FOR SPECIFIC APPLICATION FIELDS
- G16H—HEALTHCARE INFORMATICS, i.e. INFORMATION AND COMMUNICATION TECHNOLOGY [ICT] SPECIALLY ADAPTED FOR THE HANDLING OR PROCESSING OF MEDICAL OR HEALTHCARE DATA
- G16H10/00—ICT specially adapted for the handling or processing of patient-related medical or healthcare data
- G16H10/20—ICT specially adapted for the handling or processing of patient-related medical or healthcare data for electronic clinical trials or questionnaires
- G—PHYSICS
- G16—INFORMATION AND COMMUNICATION TECHNOLOGY [ICT] SPECIALLY ADAPTED FOR SPECIFIC APPLICATION FIELDS
- G16H—HEALTHCARE INFORMATICS, i.e. INFORMATION AND COMMUNICATION TECHNOLOGY [ICT] SPECIALLY ADAPTED FOR THE HANDLING OR PROCESSING OF MEDICAL OR HEALTHCARE DATA
- G16H15/00—ICT specially adapted for medical reports, e.g. generation or transmission thereof
- G—PHYSICS
- G16—INFORMATION AND COMMUNICATION TECHNOLOGY [ICT] SPECIALLY ADAPTED FOR SPECIFIC APPLICATION FIELDS
- G16H—HEALTHCARE INFORMATICS, i.e. INFORMATION AND COMMUNICATION TECHNOLOGY [ICT] SPECIALLY ADAPTED FOR THE HANDLING OR PROCESSING OF MEDICAL OR HEALTHCARE DATA
- G16H50/00—ICT specially adapted for medical diagnosis, medical simulation or medical data mining; ICT specially adapted for detecting, monitoring or modelling epidemics or pandemics
- G16H50/50—ICT specially adapted for medical diagnosis, medical simulation or medical data mining; ICT specially adapted for detecting, monitoring or modelling epidemics or pandemics for simulation or modelling of medical disorders
- G—PHYSICS
- G16—INFORMATION AND COMMUNICATION TECHNOLOGY [ICT] SPECIALLY ADAPTED FOR SPECIFIC APPLICATION FIELDS
- G16H—HEALTHCARE INFORMATICS, i.e. INFORMATION AND COMMUNICATION TECHNOLOGY [ICT] SPECIALLY ADAPTED FOR THE HANDLING OR PROCESSING OF MEDICAL OR HEALTHCARE DATA
- G16H50/00—ICT specially adapted for medical diagnosis, medical simulation or medical data mining; ICT specially adapted for detecting, monitoring or modelling epidemics or pandemics
- G16H50/70—ICT specially adapted for medical diagnosis, medical simulation or medical data mining; ICT specially adapted for detecting, monitoring or modelling epidemics or pandemics for mining of medical data, e.g. analysing previous cases of other patients
- G—PHYSICS
- G16—INFORMATION AND COMMUNICATION TECHNOLOGY [ICT] SPECIALLY ADAPTED FOR SPECIFIC APPLICATION FIELDS
- G16H—HEALTHCARE INFORMATICS, i.e. INFORMATION AND COMMUNICATION TECHNOLOGY [ICT] SPECIALLY ADAPTED FOR THE HANDLING OR PROCESSING OF MEDICAL OR HEALTHCARE DATA
- G16H30/00—ICT specially adapted for the handling or processing of medical images
- G16H30/20—ICT specially adapted for the handling or processing of medical images for handling medical images, e.g. DICOM, HL7 or PACS
Definitions
- the present inventionrelates to a system and a method for presenting a risk of dementia of a user.
- Japanese Patent Application Laid-Open No. 2016-22310discloses that a potential risk of dementia can be determined at an extremely early stage and a dementia risk determination system that can provide a preventive opportunity to delay the onset of dementia can be provided. Have been.
- This systemincludes a biometric data detection sensor that acquires biometric data during sleep of a subject, and a depth of sleep of the subject over time from biometric data of the subject acquired by the biometric data detection sensor.
- a sleep data generating devicethat generates sleep data including a change in body movement and body movement, and a storage unit that stores sleep data specific to each symptom obtained from an actual onset patient, for a symptom related to predetermined dementia, The sleep data of the subject generated by the data generation device is compared with the sleep data of each symptom stored in the storage unit to determine three dementia risks from the sleep data of the subject. Disease risk determination device.
- sample brain health dataincluding at least one of sample brain state data that is data relating to a brain state of a sample subject and sample cognition data that is data relating to cognition that is a function of the brain.
- sample brain state datathat is data relating to a brain state of a sample subject
- sample cognition datathat is data relating to cognition that is a function of the brain.
- sample brain health dataincluding at least one of sample brain state data that is data relating to a brain state of a sample subject and sample cognition data that is data relating to cognition that is a function of the brain.
- a first recognition unitthat recognizes user brain health data including at least one of user cognition data that is data relating to cognition; a second recognition unit that recognizes user individual characteristics that are individual characteristics of a user; Based on past and present user brain health data, an aging line showing the transition of the user's brain health data from the past to the present of the user
- a risk presentation for presenting a risk line related to dementiadetermined based on sample brain health data associated with an individual characteristic corresponding to a user individual characteristic with reference to a transition according to the age of the sample brain health data.
- a systemcomprising:
- user brain health dataincluding at least one of data relating to the brain state of the user to be subjected to risk determination (user brain state data) and user cognition data which is data relating to cognition as a function of the brain.
- risk determinationuser brain state data
- user cognition datadata relating to cognition as a function of the brain.
- the data related to the brain stateis direct data of quantitative parameters based on the state of the brain that affects cognition, not indirect data of brain functions inferred from the user's brain waves, movements, etc. , Data directly related to brain conditions.
- the cognitive test for acquiring cognitive datais enriched as a criterion for determining the risk of dementia, and can accurately determine the state of brain function.
- An example of the cognitive testis described in Japanese Patent Application No. 2018-33652 filed by the present applicant. Therefore, the risk of dementia can be accurately recognized by comparing the user brain health data including one or both of these with the sample brain health data.
- the user and the likecan not only determine the magnitude of the user's dementia risk, but also the user's dementia risk.
- the tendency(whether it is worsening, improving, suppressing deterioration, etc.) can be grasped at the same time.
- the user or a person who manages the health of the user(hereinafter, collectively referred to as “user etc.”) does not have sufficient knowledge based on the information presented by the present system. Even so, it is possible to intuitively grasp the magnitude of the risk of dementia.
- the risk presenting unitbased on the result of comparison between the user brain health data and the sample brain health data associated with the individual characteristics corresponding to the user individual characteristics, a score indicating the dementia risk of the user, or according to the score. And a first score presenting section for presenting the changed symbol.
- the dementia riskas a score or a symbol corresponding to the score (hereinafter, referred to as “score or the like”), the user or the like can more intuitively grasp the magnitude of the dementia risk of the user.
- This systemhas a prediction unit that predicts an aging prediction line indicating a transition of user brain health data predicted from the present to the future of the user based on the aging line, and the risk presenting unit includes an aging line and a risk In addition to the line, a prediction presenting unit that presents an aging prediction line may be included.
- an aging prediction linewhich is a prediction of the transition of dementia risk from the present to the future, in a manner comparable to the risk line, the user and the like can more accurately grasp the tendency of the user's dementia risk.
- the risk presentation unitcompares the user brain health data of the first age on the aging prediction line with the sample brain health data associated with the individual characteristic corresponding to the individual characteristic obtained by adding the first age to the user individual characteristic. Based on the result, a second score presentation unit that presents a score indicating the future dementia risk of the user or a symbol corresponding to the score together with or instead of the aging prediction line may be included.
- the risk presenting unitpredicts or predicts the user brain health data of the user's future first age separately from the aging prediction line, and assigns the predicted user brain health data and the first age to the user individual characteristic. Based on the result of the comparison with the sample brain health data associated with the individual characteristic corresponding to the added individual characteristic, a score indicating the future dementia risk of the user, or a symbol corresponding to the score may be presented. .
- the sample brain health datamay be associated with individual characteristics and life characteristics including at least one of the sample subject's lifestyle and living environment.
- the systemfurther includes a third recognition unit that recognizes a user life characteristic that is a life characteristic of the user, and the prediction unit includes an individual characteristic corresponding to the user individual characteristic, a life characteristic corresponding to the user life characteristic, and
- the aging prediction linemay be predicted based on the sample brain health data associated with the age and the aging line.
- a highly reliable aging prediction line(and, consequently, the tendency of dementia risk) can be recognized by referring to the user life characteristics. This allows the user or the like to more accurately grasp the tendency of the user for dementia risk.
- the risk presenting unitcalculates the first age user brain health data on the aging prediction line, the individual characteristics corresponding to the individual characteristics obtained by adding the first age to the user individual characteristics, and the life characteristics corresponding to the user life characteristics.
- a third scorethat presents a score indicating the future risk of dementia of the user, or a symbol responsive to the score, along with or instead of the aging prediction line, based on the results of the comparison with the associated sample brain health data.
- a presentation unitmay be included.
- the risk presenting unitpredicts user brain health data corresponding to a user life characteristic specified or arbitrarily selected by the user, separately from the aging prediction line, and the predicted user brain health data and the user life Based on the result of the comparison with the sample brain health data associated with the life characteristic corresponding to the characteristic, a score indicating the future dementia risk of the user or a symbol corresponding to the score may be presented.
- the prediction unitincludes a comparison prediction unit that recognizes, for the same user, a first aging prediction line based on a first user life characteristic and a second aging prediction line based on a second user life characteristic
- the risk presentation unitmay include a comparison presentation unit that presents the first aging prediction line and the second aging prediction line side by side in a comparable manner or continuously.
- the risk presenting unitincludes a first score indicating a future dementia risk of the user corresponding to the first aging prediction line, and a second score indicating a future dementia risk of the user corresponding to the second aging prediction line.
- a fourth score presenting unit for presenting a scoremay be included.
- Each scorecorresponds to the user brain health data of the first age on each aging prediction line, the individual characteristics corresponding to the individual characteristics obtained by adding the first age to the user individual characteristics, and the respective user life characteristics. It is calculated based on the result of comparison with the sample brain health data associated with the living characteristics to be performed.
- the risk presenting unitpredicts a user's future dementia risk based on each user's life characteristic separately from the aging prediction line, and presents a first score and a second score indicating those risks. Good.
- the sample brain condition data and the user brain condition datamay include data indicating the entire volume of the brain or the volume of at least one predetermined region of the brain, and may include a brain image, a cerebral blood flow, an electroencephalogram, and the like. May directly or indirectly indicate the state of the brain, for example, information such as a blood biomarker.
- sample brain health dataincluding at least one of sample brain state data that is data relating to the state of the brain of a sample subject and sample cognition data that is data relating to cognition that is a function of the brain;
- sample cognition datathat is data relating to cognition that is a function of the brain;
- the methodincludes the following steps. 1. Recognizing user brain health data including at least one of user brain state data that is data relating to the state of the brain of the user and user cognition data that is data relating to cognition that is a function of the brain. 2. Recognizing user individual characteristics that are user individual characteristics. 3.
- the methodfurther includes generating a score or a score indicating a risk of dementia of the user based on a result of the comparison between the user brain health data and the sample brain health data associated with the individual characteristic corresponding to the user individual characteristic. Presenting a corresponding symbol may be included.
- the methodfurther comprises predicting, based on the aging line, an aging prediction line indicating a transition of the user's brain health data that is predicted from the user's present to the future, and presenting the risk is based on the aging line.
- Thismay include presenting an aging forecast line in addition to the line and the risk line.
- the methodincludes the step of combining the user brain health data of the first age on the aging prediction line with the sample brain health data associated with the individual characteristic corresponding to the individual characteristic obtained by adding the first age to the user individual characteristic. Based on the results of the comparison, a score indicating the user's future dementia risk, or a symbol corresponding to the score, may be presented along with or instead of the aging prediction line.
- the sample brain health datamay be associated with individual characteristics and life characteristics including at least one of the sample subject's lifestyle and living environment.
- the methodfurther includes recognizing a user life characteristic that is a life characteristic of the user, and the estimating includes determining an individual characteristic corresponding to the user individual characteristic, a life characteristic and an age corresponding to the user life characteristic.
- the methodmay include predicting an aging prediction line based on the associated sample brain health data and the aging line.
- the methodfurther includes user brain health data of the first age on the aging prediction line, individual characteristics corresponding to the individual characteristics obtained by adding the first age to the user individual characteristics, and user life characteristics. Presenting a score indicating the user's future dementia risk, or a symbol corresponding to the score, along with or instead of the aging prediction line, based on the results of comparison with sample brain health data associated with life characteristics. May be provided.
- the methodpredicts user brain health data of a first age specified or arbitrarily selected by a user, separately from an aging prediction line, and adds first brain health data to the user brain health data and a first individual characteristic to a user individual characteristic.
- a score indicating the user's future risk of dementia, based on the individual characteristics corresponding to the age-added individual characteristics and the results of comparison with the sample brain health data associated with the life characteristics corresponding to the user life characteristics, or , A symbol corresponding to the scoremay be presented.
- Predictingincludes, for the same user, predicting a first aging prediction line based on a first user life characteristic and a second aging prediction line based on a second user life characteristic, Presenting the risk may include presenting the first aging line and the second aging line in a comparable or continuous manner.
- the methodmay include presenting a score for a first age on a first aging line and a score for a first age on a second aging line.
- the methodmay present multiple scores for the risk of dementia specified by the user or predicted based on any user life characteristics.
- Another aspect of the present inventionis a program (program product) having instructions for operating a computer as the above system.
- the program (program product)may be recorded on any recording medium and provided.
- FIG. 6Ashows an example of a change in the display content of a report when the life characteristics are changed, and FIG. 6A shows a case where drinking is daily, and FIG.
- FIGS. 7A and 7Bshow another example of a change in the display content of the report when the life characteristics are changed.
- FIG. 7Ashows a case where drinking is daily
- FIG. 7Bshows a case where drinking is 2-3 days a week.
- the figure which shows the other example of the reportprovided from a presentation system.
- inspection or test which measures the health condition of a brain following FIG. 9is a flowchart showing an outline of the operation of the presentation system.
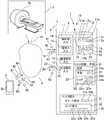
- FIG. 1shows an example of a system including a device (system) for presenting a risk of dementia.
- the system 1includes a hospital 3 including an MRI (Magnetic Resonance Imaging) device (MRI) 3a, and an information terminal (personal computer, tablet) for inputting various kinds of information on a user and outputting (displaying) a report 50 on dementia risk.
- a terminal) 2 and an information providing devicethat processes information received from the MRI 3a and the tablet 2 via the Internet 9 and transmits a report 50 including dementia risk and other information (dementia risk presentation device, dementia risk presentation System, presentation system) 10.
- the presentation system 10includes computer resources such as a memory and a CPU, and is mounted on the server 7 that can input and output information via the Internet (cloud) 9.
- the information processing apparatusmay be mounted in a distributed manner on a plurality of information processing apparatuses including the information processing apparatus.
- the MRI 3aacquires data relating to the brain state of the user (user brain state data), and transmits the user brain state data 41 to the presentation system 10.
- the device that acquires the user brain condition data 41is not limited to the MRI 3a, but may be any device that has a configuration that can recognize the user brain condition data of the user who is the target for determining the risk of dementia.
- a CT (Computed @ Tomography) inspection device, an ultrasonic inspection device, etc., a device for measuring brain functions (cerebral blood flow) such as FDG, SPECT, etc., a device for measuring brain waves, blood biomarkers, etc.may be used. The information measurable by these may be included in the data relating to the brain condition.
- a PET (Positron Emission Tomography) image acquisition device or the likemay be used.
- the presentation system 10may use the brain state data 41 obtained from the MRI 3a, or may use the brain state data 41 obtained in advance and stored in the user library 18.
- the brain state data 41refers to the overall state of the brain or a region of the brain that affects cognition (eg, hippocampus, supralimbic, angular, upper frontal, middle frontal, lower frontal) Times, anterior cingulate cortex, etc.).
- the “state”includes the volume and shape of the entire brain or a predetermined region of the brain, the amount of a predetermined protein (for example, amyloid ⁇ ) in the brain, and the like.
- the brain state data (data related to the brain state, data related to the brain state) 41includes quantitative parameters based on the state of the brain, and includes, for example, the above-described brain state itself (that is, the entire brain or a predetermined region). Of the brain) or numerically expressing the capacity or size of the brain.
- the brain condition data 41may be related to a single brain condition or may be related to a plurality of brain conditions. Specifically, for example, the brain condition data 41 may include the amount of the hippocampus, and may include a value obtained by a predetermined calculation formula based on the amount of the hippocampus and the amount of amyloid ⁇ in the brain.
- the tablet 2 that inputs information about the user to the presentation system 10 and receives a report 50 including information on the risk of dementia of the user from the presentation system 10includes the touch panel 2a (input / output unit). Via the touch panel 2a, the user's individual characteristic 43 is input to the individual characteristic inquiry 42 from the presentation system 10, and the user's life characteristic 45 is input and changed to the life characteristic inquiry 44. . In addition, a question 60 of a cognitive test is presented on the touch panel 2a, and cognitive data 61 including an answer to the cognitive test is input to the presentation system 10. Further, a report 50 including the presentation of the risk of dementia is displayed on the touch panel 2a.
- the user terminal used for inputting / outputting such informationis not limited to the tablet 2 having the touch panel 2a.
- the user terminalonly needs to have a configuration capable of recognizing the individual characteristics of the user whose dementia risk is to be determined and presenting the dementia risk.
- a personal computer, a smartphone, or the likemay be used instead of a tablet.
- an independent output unit and input unitmay be employed instead of the touch panel which is an input / output unit in which the output unit and the input unit are integrated.
- a keyboard, a microphone, or the likemay be employed as the input unit
- a display, a speaker, a printing device, or the likemay be employed as the output unit.
- the input unit and the output unit of the user terminaldo not necessarily have to be provided in the same device, and do not have to be arranged near each other, such as in a room.
- a display, a speaker, a printing device, or the like as an output unit of the user terminalmay be arranged on a medical workstation provided in a location different from the location where the MRI apparatus or the like is installed.
- the server 7 operating as the presentation system 10loads various functions (functional units, functional units) by loading a memory (data storage unit, data storage area) 16 and a program (program product) 19 stored in the memory 16. ) Which operates as a processor (CPU) 8).
- the memory 16includes sample brain health data including at least one of sample brain state data 17d that is data relating to the brain state of the sample subject and sample cognition data 17e that is data relating to cognition that is a function of the brain.
- a database (first database) 17 including a database 17a and a user library 18 storing brain health data of the user (user brain health data) 18aare included.
- the database 17further includes individual characteristics 17b including at least one of the age, sex, and physical information of the sample subject, and the sample brain health data 17a is stored in association with the individual characteristics 17b.
- the database 17further includes a life characteristic 17c including at least one of the lifestyle and the living environment of the sample subject, and the sample brain health data 17a is stored in association with the life characteristic 17c.
- sample subjectsinclude not only those who have developed dementia (including mild dementia) and those who are suspected of having dementia, but also healthy people who do not have dementia. It is.
- the individual characteristics 17binclude at least one of age, gender, and physical information.
- the “physical information” included in the individual characteristics 17brefers to physical information that can be quantitatively shown. Specific examples include height, weight, body fat percentage, BMI, and cholesterol level.
- Life characteristics 17cinclude at least one of a lifestyle and a living environment.
- “Lifestyle”refers to a habit that affects the risk of dementia in life. Specifically, for example, exercise amount, meal amount and type, length and quality of sleep time, communication amount and frequency, hobby activity amount and frequency, drinking amount and frequency, smoking amount and frequency, and the like are included.
- “Living environment”refers to an environment that affects the increase or decrease in dementia risk in life. Specifically, for example, the address (living environment), occupation, educational background, annual income, the number of cohabitants, and the like are given.
- sample brain health data 17aincluding data (sample brain state data) 17d relating to the brain state of the sample subject (sample brain state data) 17e and data (sample cognition data) 17e relating to the result of the cognitive test of the sample subject are stored in a format associated with the individual characteristics 17b and life characteristics 17c of the sample subject.
- the user library 18includes the latest (current) user brain health data 18a including data 41 relating to the user's brain condition (user brain condition data) 41 and data relating to the user's cognition (user cognition data) 61. In addition, those acquired in the past are stored.
- the user library 18may store individual characteristics (user individual characteristics) 43 and life characteristics (user life characteristics) 45 of each user.
- the presentation system 10compares the data (user brain health data) 18a related to the health state of the brain of the user to be subjected to the risk determination with the data (sample brain state data) 17a related to the brain state of the sample subject. Recognize the risk of dementia.
- the data 17a and 41 relating to the brain stateare direct data of quantitative parameters based on the state of the brain that affect cognition. That is, the dementia risk presentation system 10 uses not the indirect data of the brain function inferred from the user's brain waves and movements as in the conventional system but the direct data of the brain state. ing. As a result, in the presentation system 10, recognition of the risk of dementia is not affected by estimation accuracy regarding brain functions. As a result, according to this presentation system 10, the dementia risk can be recognized more accurately than in the conventional system.
- the presentation system 10generates the user brain health data 18a including at least one of the user brain state data 41 that is data relating to the state of the brain of the user and the user cognition data 61 that is data relating to cognition that is a function of the brain.
- the first recognizing unit 11has a first recognizing unit 11 that obtains (recognizes) the input unit (input function, input unit) 14 that obtains the user brain condition data 41 and the user cognitive data 61. And an input unit (input function, input unit) 15.
- the cognitive data input unit 15sends a cognitive test 60 to the user terminal 2 and recognizes the user cognitive data 61 from the answer.
- the cognitive data input unit 15is not limited to the direct information input from the terminal 2, and indirectly inputs information about the user by inputting via a paper medium or providing information via a doctor or other specialist. May be obtained. The same applies to recognition (acquisition, input) of other information.
- the cognitive test 60evaluates the function of each of the five cognitive domains.
- the cognitive domainincludes short-term memory, working memory, executive function, spatial cognition, and computation.
- Short-term memoryindicates the ability to retain and remember what has been learned for a short period of time, and is said to involve the hippocampus of the brain.
- Working memoryis the ability to manipulate the retained memory in different ways, such as ⁇ remember the phone number and press the number button to make a phone call '' ing.
- the execution functionis the ability to maintain and update rules, such as cooking ⁇ procedures '' and ⁇ change ingredients according to the situation, '' and to control behavior and thinking.In particular, it is said that the prefrontal cortex of the brain is involved. Have been done.
- Spatial cognitionis the ability to instantly grasp and understand which direction a figure or object is facing in space, and it is said that the parietal lobe of the brain is involved.
- Computationis the ability to perform four arithmetic operations and involves various regions of the brain, but it is said that the temporal and parietal portions of the brain are particularly involved.
- the cognitive data input unit 15performs a cognitive test 60, and acquires the evaluation for each cognitive domain as user cognitive data 61.
- the cognitive data 61can be used as an index for determining the function of the brain with high accuracy by performing an evaluation for each cognitive domain by performing statistical processing as described below.
- the presentation system 10further includes a second recognition unit (individual characteristic input unit, second input unit) 12 for recognizing (acquiring) a user individual characteristic 43 which is an individual characteristic of the user, and a user which is a living characteristic of the user.
- the individual characteristic input unit 12may send a questionnaire form (question table) 42 relating to individual characteristics to the user terminal 2 and recognize individual characteristics 43 of each user from an answer thereto.
- the individual characteristic input unit 12may recognize the user individual characteristic 43 based on the description of the electronic medical record or the like.
- the life characteristic input unit 13may send a questionnaire (question table) 44 relating to the life characteristic to the user terminal 2 and recognize the life characteristic 45 of each user from the answer thereto.
- a questionnairequestions table
- the life characteristic input unit 13may recognize the user life characteristic 45 based on the description of the electronic medical record or the like.
- the presentation system 10further recognizes each user's current risk for dementia and predicts future risks by a recognition / prediction unit (prediction unit, prediction function, prediction unit) 20 and information including the risk of dementia. (Risk presenting function, risk presenting unit) 30 for presenting to the user.
- the recognition / prediction unit 20includes a current risk recognition unit 21 that recognizes a current risk, a prediction unit 22 that predicts a future risk, and a score calculation unit 23 that converts a risk into a score.
- the current risk recognition unit 21includes an aging line indicating the transition of the user's brain health data 18a from the past to the present of the user, and an individual characteristic 17b corresponding to the user individual characteristic 43. Recognize a risk line related to dementia determined by referring to the transition according to the age of the sample brain health data 17a based on the sample brain health data 17a associated with the Output to 2.
- the current risk recognition unit 21acquires the sample brain state data 17d and the sample cognition data 17e associated with the individual characteristics 17b corresponding to the user individual characteristics 43 from the database 17. Thereafter, the comparison between the sample brain state data 17d and the user brain state data 41 and the comparison between the sample cognitive data 17e and the user cognitive data 61 are performed. Then, the risk of dementia of the user may be recognized based on the results of these comparisons.
- the sample brain state data 17d and the user brain state data 41are not limited to the hippocampus, but may be the whole brain capacity or the capacity of at least one predetermined region of the brain.
- the prediction unit 22predicts an aging prediction line indicating the transition of the user's brain health data predicted from the present to the future of the user based on the aging line, and the aging line and the risk line via the risk presentation unit 30. In addition, it is possible to present an aging forecast line.
- the score calculation unit 23calculates the current or future predicted user brain health data 18a and the sample brain health data 17a associated with the individual characteristic 17b corresponding to the user individual characteristic 43, based on the result of the comparison of the user. A score indicating a dementia risk or a symbol corresponding to the score is obtained, and can be presented via the risk presentation unit 30.
- the risk presenting unit 30includes a chart display unit 31 that displays an aging line, an aging predicted line, a risk line, and the like in a chart or graphic form, and a score presenting unit 32 that displays the obtained score.
- the chart display unit 31includes a prediction presentation unit 31a that performs prediction display including an aging prediction line, and a comparison presentation unit 31b that displays a result of simulating a plurality of cases in which life characteristics have been changed.
- the score presenting unit 32includes a first score presenting unit 32a that displays a current risk score (including a corresponding symbol and the like), a second score presenting unit 32b that displays a predicted risk score and the like, A third score presenting unit 32c for displaying a risk score or the like predicted including life characteristics, and a fourth score presenting unit 32d for displaying a risk score or the like simulating a case where the life characteristics are changed. Including.
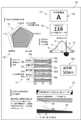
- FIG. 2shows an example of a report 50 provided to the user by the presentation system 10.
- the report 50may be a screen or digital data presented to the user terminal 2 when the dementia risk is determined, may be an audio file, may be transmitted through the user terminal 2, Instead, it may be a printed matter, a booklet, or the like provided to the user by mail or the like.
- the report 50includes a brain image display area 59, a secular change display area 51, a score display area 57, and a life characteristic display area 58, and information on dementia risk or user life characteristics is presented in each area.
- the brain image display area 59an image of the user's brain included in the user's brain state data 41 acquired by the MRI 3a is displayed.
- a graphis displayed via the presentation unit 30 as the dementia risk recognized by the risk recognition / prediction unit 20. This graph shows the result of comparison between sample brain state data and user brain state data.
- This graphincludes an aging transition line 52, an aging prediction line 53, and a risk line 54.
- the score display area 57includes, as dementia risks recognized by the risk recognition / prediction unit 20, a rank 55 related to the overall risk determination indicated by alphabets A to D and F, and a brain age 56a indicated by numerals. , An arrow 56b, which is a symbol related to long-term prediction, is displayed. In the score display area 57, a legend 56c related to the rank 55 is displayed. The value of the rank 55, the value of the brain age 56a, and the inclination of the arrow 56b are obtained by comparing the sample brain state data 17d with the user brain state data 41 and the sample cognitive data 17e and the user cognitive data 61. It is determined according to the score obtained based on the result of the comparison.
- Rank Aindicates that the brain function is high
- rank Bindicates that the brain function is standard
- rank Cindicates that the brain function is reduced
- rank Dindicates that the brain function is reduced. Indicates what to do.
- Rank Findicates that treatment has already begun due to reduced brain function.
- the user life characteristic 45is displayed. This user life characteristic 45 reflects the changed result via the touch panel 2a.
- the method of presenting the risk of dementia using such a display formatis merely an example. That is, the method of presenting the dementia risk by the presentation system 10 is not limited to such a configuration, and the brain health data 18a of the user and the sample brain associated with the individual characteristics and / or life characteristics of the user What is necessary is just to show the result of comparison with the health data 17a.
- the layout of the screen (report) 50may be changed as appropriate. Further, only the graph or the display related to the score may be performed. Further, among the displays related to the score, one or two of the rank, the brain age, and the arrow may be displayed.
- an image of the brain of the user and an image of the brain of the sample subject having the same individual characteristics as the user and in an ideal health stateare arranged in parallel. It may be displayed. Further, the result may be presented by voice.
- the display contents in the aging display area 51will be further described.
- a graph showing the hippocampal volume on the vertical axis and the age on the horizontal axisis displayed as the risk of dementia in the aging display area 51.
- This graphincludes an aging transition line 52, an aging prediction line 53, and a risk line 54.
- the aging transition line 52shows the transition of the user brain state data 41 from the past to the present of the user.
- the aging prediction line 53shows the transition of the user brain state data 41 predicted from the present to the future of the user.
- the risk line 54is for indicating the degree of dementia risk that the user or the like should be alert to, and divides the area in the graph into a reference range 54a and a zone requiring caution 54b.
- the user or the likecompares the inclination of the aging line 52 and the inclination of the aging prediction line 53 with the inclination of the risk line 54, and the position of the aging line 52 and the position of the aging prediction line 53 (specifically, , The reference range 54a or the zone of caution zone 54b) to determine the magnitude of the dementia risk of the user and the tendency of the dementia risk.
- the user brain state recognition unit 14recognizes the current and past brain state data 41 of the user. Specifically, the user's brain condition recognition unit 14 determines the past (when the user is 41 years old in the present embodiment) and the present (when the dementia risk is determined (in the present embodiment, when the user is 45 years old))
- the hippocampus volumeis calculated using a predetermined algorithm from the cross-sectional image of the brain of the user acquired using the MRI 3a.
- a technique of predicting the hippocampus volume by a generation model of an image using a neural networkmay be used.
- biomarker data informationthat is highly correlated with the living findings may be added.
- the current risk recognition unit 21 of the risk recognition / prediction unit 20recognizes the aging line 52 relating to the brain state of the user based on the user brain state 41 recognized by the user brain state recognition unit 14.
- the current risk recognition unit 21displays the hippocampus volume in the past (41 years old) of the user on the graph in which the vertical axis is the hippocampus volume and the horizontal axis is the age. , Plot the hippocampus volume at the user's current age (45). Thereafter, the risk recognition unit 21 generates the aging line 52 by connecting them with line segments. The risk recognizing unit 21 acquires, from the database 17, sample brain state data 17 d associated with the individual characteristic 17 b corresponding to the user individual characteristic 43 based on the user individual characteristic 43.
- the risk recognition unit 21acquires sample brain state data (ie, hippocampus volume) 17d associated with the individual characteristic 17b of a male. Next, the risk recognition unit 21 determines the risk line 54 with reference to the transition according to the age of the sample brain state data 17d recognized based on the individual characteristics.
- sample brain state dataie, hippocampus volume
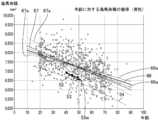
- FIG. 3shows the hippocampus volume on the vertical axis and the age on the horizontal axis, and the sample brain state data 17d extracted based on the individual characteristics 17b is plotted.
- black circles and white circlesrepresent each sample brain state data 17d
- white circlesrepresent sample brain state data 17d belonging to a group having a large amount of drinking
- black circlesrepresent other sample brain state data.
- the first average line 66 indicating the average of the hippocampus volume of the extracted sample brain state data 17d including the group with a large amount of drinkingis indicated by a solid line, and the sample brain state data 17d of only the group with a large amount of drinking is shown.
- a second average line 67indicating the average hippocampus volume is indicated by a broken line.
- Such statistical processingmay be performed in advance, or may be performed by the risk recognition unit 21.
- the risk recognition unit 21generates a risk line 54 indicated by a dotted line below the first average line 66. Specifically, a line based on a value (x1-2 ⁇ ) lower than the value x1 of the first average line 66 by 2 ⁇ (“ ⁇ ” represents the standard deviation of hippocampal volume (sample brain state data) for each age.) A line indicating the lower 2.3%) is generated, and the line is recognized as a risk line 54.
- the method of recognizing the risk line 54 of the present inventionis not limited to such a method, and based on the sample brain state data 17d associated with the individual characteristics corresponding to the user individual characteristics, the sample brain is used. Any method may be used as long as it is determined with reference to the transition according to the age of the state data. For example, when the user individual characteristic is male as in the present embodiment, not all of the sample brain state data 17d associated with the individual characteristic of male, but the user life characteristic of the sample brain state data 17d.
- the risk line 54may be determined based on the average line of the sample brain condition data 17d associated with the life characteristic 17c corresponding to 45. Specifically, the risk line 54 may be determined based on the second average line 67, which is the tendency line of only the group having a large amount of drinking.
- the average line itselfmay be used as the risk line 54 instead of the line based on the value of ( ⁇ 2 ⁇ ) for each value of the average line.
- the risk line 54may be generated using different values (for example, a value of ( ⁇ 3 ⁇ ) for each value of the average line).
- the risk line 54may be generated simply by referring to the order of the data, etc., without generating the risk line 54 based on the statistical data.
- the risk line 54is defined based on data of a predetermined order (for example, data within the lower third). May be generated.
- the prediction unit 22 of the risk recognition / prediction unit 20predicts (calculates) an aging prediction line 53 indicating a transition of user brain health data predicted from the present to the future of the user based on the aging transition line 52. .
- the prediction unit 22calculates the aging prediction line 53 based on the individual characteristics 17b corresponding to the user individual characteristics 43, the life characteristics 17c corresponding to the user life characteristics 45, the sample brain health data 17a associated with the age, and the aging transition line 52. Includes the ability to predict
- the prediction unit 22calculates the sample brain state data 17d associated with the life characteristic 17c corresponding to the user life characteristic 45, based on the user life characteristic 45.
- the aging prediction line 53is generated based on the second average line 67 of the brain state data (white circle) 17d. More specifically, the prediction unit 22 calculates the age from the reference age of the user brain state data 41 (45 years old, which is the age at the latest time in this embodiment) to a predetermined age (50 years old in this embodiment). With reference to the transition of the second average line 67, a line following the same transition as the transition of the second average line 67 is generated as the aging prediction line 53, starting from the age that is the reference of the aging transition line 52.
- the user life characteristics 45are referred to when recognizing the aging prediction line 53.
- Thisis to recognize a reliable aging prediction line (and, consequently, a tendency of dementia risk).
- the method of recognizing the aging prediction line of the present inventionis not limited to such a method, and any method may be used as long as the method is based on the aging line 52.
- the inclination of the aging line 52may be recognized, and the aging prediction line 53 may be generated and recognized using the inclination.
- any methodmay be used as long as the determination is made by referring to the transition of the sample brain state data 17d according to the age. For example, not only the sample brain state data 17d relating to only one life characteristic 17c but also the sample brain state data 17d relating to two or more life characteristics 17c may be referred to.
- the regression equationis represented by the following equation (1), and among the unspecified number of sample subjects of age z, the regression of the evaluation factor x is performed on the sample subjects having a predetermined living characteristic (for example, having a drinking habit).
- the evaluation factor x t + 1 at the next time point t + 1(t represents a discrete time such as 5 years or 10 years) is calculated at the current time point t. based on the evaluation factors x t, it is predicted according to the following equation (3).
- x⁇ 0 + ⁇ 1 z ( ⁇ 0 and ⁇ 1 are regression coefficients)
- x ′⁇ 0 ′ + ⁇ 1 ′ z ( ⁇ 0 ′ and ⁇ 1 ′ are regression coefficients)
- x t + 1x t + ⁇ THEN with IF life characteristics (x t + 1 '-x t ') ELSE (x t + 1 -x t) ⁇ ...
- the prediction presenting unit 31athat performs the chart display of the risk presenting unit 30 displays the aging transition line 52, the aging prediction line 53, and the risk line 54 in the aging display area 51 of the report 50 so as to be comparable to each other.
- the prediction presenting unit 31amay display the plot including the sample brain state data 17d, the first average line 66, and the second average line 67, but delete them so that the user or the like can easily see it.
- the prediction presenting unit 31amay give different colors to the upper reference range 54a of the risk line 54 and the lower caution zone 54b.
- the prediction presenting unit 31aplots the ages (41 years, 45 years, and 50 years in the present embodiment) that are the references of the aging line 52 and the aging line 53 on the horizontal axis of the graph.
- the fact that the aging prediction line 53 is above the risk line 54means that the value at the future time point t + 1 of the cumulative density function cdf (x
- ⁇ , ⁇ )(1/2) ⁇ 1 + erf (x ⁇ ) / (2 ⁇ 2 ) 1/2 ⁇ ) (Erf is an error function) (4)
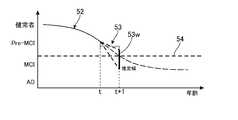
- the prediction unit 22may indicate the aging prediction line 53 with an estimated width 53w indicating a region with a high probability.
- the first average line 66 and the second average line 67include an error, and 95% CI (Confidence Interval, confidence interval) is indicated by lines 66a and 67a, respectively.
- the prediction unit 22obtains the estimated width 53w of the aging prediction line 53 with the estimated width of the second average line 67 of the same age at the future time t + 1 with respect to the end time t of each user.
- the predicted width 53 wmay be displayed in the aging display area 51.
- FIG. 5shows another example in which the aging prediction line 53 is shown using the estimated width 53w.
- the estimated width 53w of the dementia riskmay fall below the risk line 54 from pre-MCI (previous stage of mild dementia (Mild Cognitive Impairment)) to MCI.
- ADAlzheimer's dementia
- the presentation system 10presents the dementia risk in a format that is compared with the aging line 52, the aging prediction line 53, and the risk line 54, which are lines corresponding to the age.
- the user and the likecan simultaneously grasp not only the magnitude of the user's dementia risk but also the tendency of the user's dementia risk (whether the user is deteriorating, improving, or suppressing the deterioration). it can.
- the prediction unit 22 of the presentation system 10further provides, for the same user, a first aging prediction line 53 based on the first user life characteristics 45 and a second aging prediction line based on the second user life characteristics 45. 53a is included.
- the presentation system 10includes a comparison prediction unit 22a that simulates a result obtained by changing the user's life characteristics 45, and a comparison presentation unit 31b that presents the results in a comparable or continuous manner.
- FIG. 6shows two types of reports 50 in which the user life characteristics 45 are changed and the aging prediction line 53 is changed.
- the content of the drinking amount in the life characteristic display area 58is set to “daily”, and in the report 50 shown in FIG. The content of drinking has been changed to "2 to 3 times a week.”
- the aging prediction line 53a displayed in the aging transition display area 51is positioned above the aging prediction line 53 shown in the report 50 in FIG. It has a slope away from the risk line 54, indicating that the risk of dementia is reduced.
- the comparison prediction unit 22awhen the content of the drinking amount of the user life characteristic 45 is changed from “every day” to “2 to 3 times a week”, the drinking amount is changed from the sample brain state data 17d extracted in FIG. A new average line (third average line, not shown) is obtained by extracting a sample with a small amount, and a new aging prediction line 53a is generated based on the average line by the same processing as the aging prediction line 53. .
- the comparison presenting unit 31bmay present the first aging prediction line 53 of the previous condition and the second aging prediction line 53a of the next condition as separate reports 50, and can refer to the inside of the report 50. May be presented side by side.
- the comparison presenting unit 31bmay continuously display the first aging prediction line 53 and the second aging prediction line 53a in a comparable manner. Specifically, after hiding the first aging prediction line 53 after a lapse of a predetermined time, the second aging prediction line 53 is displayed within the time when the user or the like grasps the general shape of the first aging prediction line 53.
- the prediction line 53amay be displayed.
- the comparison prediction unit 22a and the comparison presentation unit 31bmay obtain and present the aging prediction line 53 by changing the condition of the user life characteristic 45 not only twice but also many times.
- a user or the likecan intuitively grasp a change in dementia risk according to a change in the life characteristics 45.
- the user or the likecan specifically grasp the life characteristics to be improved, and thus is provided with an incentive for the improvement of the life characteristics.
- the risk recognition / prediction unit 20 of the presentation system 10includes a score calculation unit 23 that converts dementia risk into a score, and the risk presentation unit 30 includes a score presentation unit 32 that presents dementia risk based on the score. .
- the score calculation unit 23calculates the sample brain state data 17d and the sample cognition data 17e recognized based on the user brain state data 41, the user cognition data 61, the user individual characteristics 43, and the user life characteristics 45. Then, based on the result of the comparison, scoring is performed, and a rank, a brain age, and a corresponding symbol are determined based on the score.
- ⁇ , ⁇ ) of the evaluation factor xsuch as the sample brain state data 17d at the current time t, which was previously expressed by Expression (4). t ) may be defined as the score S.
- the score Shas a plurality of numerical ranges (for example, 0.0 ⁇ S ⁇ 0.25, 0.25 ⁇ S ⁇ 0.50, 0.50 ⁇ S ⁇ 0.75, 0.75 ⁇ S ⁇ 1.0
- the rank 55may be determined according to which of the four numerical ranges (the four numerical ranges) are included.
- the score calculation unit 23determines the brain age 56a by referring to a table in which various values of the score S or each of the plurality of numerical ranges and each of the plurality of brain ages are associated. It may include the function 23a.
- the score calculation unit 23calculates the value cdf (x t + 1
- ⁇ t , ⁇ t ) at the current time tmay be included. If the deviation is a positive value or more than a predetermined positive value, there is a possibility that the risk will decrease.If the deviation is a negative value or less than a predetermined negative value, the risk may increase.
- the symbol 56b corresponding to the score Sis determined according to the risk “possible decrease”, “possible increase”, and “no change”.
- the function 23b for determining the symbolis that the value cdf (xt + 1
- a function of determining the symbol 56b of the long-term prediction corresponding to the score S based on whether it is equal to or larger than 0.023 which is equivalent to the threshold value)) or smaller than 0.023may be included.
- the method for calculating the scoreis not limited to a method using parametric modeling as in the above-described method using the cumulative density function.
- a method using a non-parametric rankingmay be used.
- a method of calculating various quantiles using an average rank, a media rank, approximation, or the likemay be used.
- the score presenting unit 32 of the presentation system 10displays (outputs) the rank 55 determined based on the score, the brain age 56a, the arrow 56b, and the legend 56c related to the rank on the touch panel 2a of the tablet 2 or the report 50. .
- the presentation system 10presents the risk of dementia as a score or a symbol corresponding to the score. Thereby, the user or the like can intuitively grasp the magnitude of the risk of dementia of the user.
- the score calculation unit 23calculates the current dementia risk score and displays it via the first score presenting unit 32a, and also calculates the future dementia risk score of the user, for example, one year later.
- a function 23c for calculatingmay be included.
- the function 23c for calculating the future scoreassociates the user brain health data 18a of the first age on the aging prediction line 53 with the individual characteristics corresponding to the individual characteristics 17b obtained by adding the first age to the user individual characteristics 43. Based on the result of comparison with the obtained sample brain health data 17a, a score indicating the future dementia risk of the user is obtained, and the second score presenting unit 32b calculates the calculated score or a symbol corresponding to the score. May be output together with or instead of the aging prediction line 53.
- the function 23c for calculating the future scoreincludes user brain health data 18a of the first age on the aging prediction line 53, individual characteristics 17b corresponding to the individual characteristics obtained by adding the first age to the user individual characteristics 43, and Based on the result of the comparison with the sample brain health data 17a associated with the life characteristic 17c corresponding to the user life characteristic 45, a score indicating the future dementia risk of the user is obtained, and the third score presenting unit 32c calculates The calculated score or a symbol corresponding to the score may be output together with or instead of the aging prediction line 53.
- the function 23c for calculating a future scoreincludes a function for calculating a score based on the user brain health data 18a specified or arbitrarily selected by the user instead of the user brain health data 18a on the aging prediction line 53. May be included.
- the function 23c for calculating the future scoremay include a simulation function 23d for changing the user life characteristics 45 and checking how the score changes.
- This function 23dincludes the first age user brain health data 18a on the first aging prediction line 53 reflecting the first user life characteristics 45, and the individual characteristics obtained by adding the first age to the user individual characteristics 43. Based on the result of the comparison with the sample brain health data 17a associated with the individual characteristics 17b corresponding to the first user life characteristics 45 and the life characteristics 17c corresponding to the first user life characteristics 45. Is calculated. Further, this function 23d includes user brain health data 18a of the first age on the second aging prediction line 53a based on the second user life characteristics 45, and individual characteristics obtained by adding the first age to the user individual characteristics.
- the second characteristicindicating the future risk of dementia of the user.
- a score of 2is calculated.
- the fourth score presenting section 32dmay output the first and second scores, or symbols corresponding thereto, together with or instead of the aging prediction line.
- the content of the drinking amount in the life characteristic display area 58is “every day”, and in the report 50 shown in FIG. 7B, the content of the drinking amount is “weekly”. 2-3 times. "
- the dementia risk at a certain point in the futurefor example, one year later, is displayed as a score, and by changing the content of drinking from “every day” to “two or three times a week”,
- the aging prediction line 53changes, and the sample brain health data 17a to be compared changes from “a group with a large amount of drinking” to “a group with a small amount of drinking”.
- the overall risk judgment 55changes from “B” to “A”
- the brain age 56abecomes younger
- the long-term prediction symbol 56balso changes to a flat direction.
- the future risk of dementiacan be output as a score or a rank in accordance with the change in the user's life characteristics 45. Therefore, the user and the like can intuitively grasp the change in the risk of dementia according to the change in the life characteristics. Thus, the user or the like can specifically grasp the life characteristics to be improved, and thus is provided with an incentive for the improvement of the life characteristics.
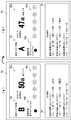
- FIG. 8shows examples of different types of reports showing the risk of dementia.
- This report 50is output from the risk presentation unit 30 of the presentation system 10 in the same manner as described above.
- the report 50includes, in addition to the score display area 57 and the aging display area 51 of the user brain condition data 41, an analysis result display area 75 of the user cognition data 61 and an aging display area 71 of the user cognition data 61.
- the score display area 57includes a display of a CQ score (Cognitive Quotient Score) 76 in addition to the rank 55 and the brain age 56a.
- the CQ score 76is a comprehensive individual cognitive and brain function score based on each cognitive function test. When the average is set to 100 and the standard deviation is set to 15, IQ (intelligence index) and other cognitive tests are set. The scale is compatible with scoring.
- the CQ score (cq) 76is obtained by the following equation (5).
- the variable xiis the evaluation result of each domain of the cognitive test 60, and in this report 50, it is the test result of each function of short-term memory, working memory, execution function, spatial cognition, and calculation.
- the test items (domains) included in the cognitive test 60are not limited to these, and may be a combination of singing, recitation, calculation, Stroop test, mental rotation, or a combination of other test items. Good.
- the total score (cq, CQ score) 76is obtained by normalizing (z) the normal distribution of the scores of each test item (domain) and then summing them.
- ⁇ , ⁇ ) 77 of the same ageis obtained by using the cumulative density function shown by the equation (4), and ranks according to the numerical range including the calculated CQ score 76. Seeking 55. For example, assuming a normal distribution having an average of 100 and a standard deviation of 15, a region of "Above” having a deviation value (standard @ score) exceeding 110 is ranked A, and "Average and Low” having a deviation value of 80-110. The area of “Average” is set to rank B, the area of “Low” with a deviation value of 70-79 is set to rank C, and the area of “Very @ Low” with a deviation value of less than 70 is set to rank D.
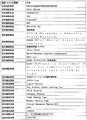
- the cognitive testis not limited to these, and tests or tests for measuring the brain health status (including the status of cognitive function and the presence or absence and degree of brain disease and mental illness) listed in FIG. 9 and FIG.
- the scoremay be evaluated according to a similar type of test or test.
- the analysis result display area 75 of the report 50includes a radar chart 78 showing the results of each item (short-term memory, working memory, executive function, spatial cognition, calculation) of the cognitive test 60, and a standard of the same age.
- the aging display area 71 of the user cognition data 61includes aging lines 72a to 72e for each item (short-term memory, working memory, execution function, spatial cognition, calculation) of the user cognition data 61, and a risk line.
- the standard lines 74a to 74e of the age groupare shown.
- the aging display area 51 of the report 50shows an aging line 52 of the user's brain condition data 41, a risk line 54, and an average transition line 65 of the same age group based on the user individual characteristics 43. From these displays, the user can clearly understand the risk of dementia and the progress of the brain health by looking at the report 50.
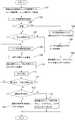
- FIG. 11is a flowchart showing an outline of the processing in the presentation system 10 described above.
- the first recognizing unit 11converts at least one of the user brain condition data 41 which is data relating to the state of the brain of the user and the user cognition data 61 which is data relating to cognition which is a function of the brain. Recognize (acquire) the user's brain health data 18a including the data.
- the second individual recognition unit (individual characteristic input unit) 12recognizes (acquires) a user individual characteristic 43 that is a user individual characteristic.
- the presentation system 10determines whether or not the prediction process is requested.
- the risk presenting unit 30performs the process based on the past and current user brain health data 18a. Then, based on the aging line 52 indicating the transition of the user's brain health data 18a from the past to the present of the user and the sample brain health data 17a associated with the individual characteristics 17b corresponding to the user individual characteristics 43, the sample brain health data The risk is presented by the risk line 54 related to dementia determined with reference to the transition according to the age of the person.
- the risk presenting unit 30further recognizes the user based on the result of the comparison between the user brain health data 18 a and the sample brain health data 17 a associated with the individual characteristic 17 b corresponding to the user individual characteristic 43. A score 55 indicating the disease risk or a symbol corresponding to the score is presented. Further, in step 106, the risk presenting unit 30 creates a report 50 including such information and provides the report 50 to the user.
- the report 50 at this stageis a report that does not include the aging prediction line.
- step 107the presentation system 10 further determines whether or not a user life characteristic has been input. If there is an input of the user life characteristic 45, in step 108, the third recognition unit (life characteristic input unit) 13 recognizes (acquires) the user life characteristic 45 which is the life characteristic of the user. In step 109, the prediction unit 22 of the risk recognition / prediction unit 20 calculates the individual characteristics 17b corresponding to the user individual characteristics 43, the life characteristics 17c corresponding to the user life characteristics 45, and the sample brain health data 17a associated with the age and the aging. Based on the transition line 52, an aging prediction line 53 is predicted (calculated). If the user life characteristics 45 have not been input in step 108, the prediction unit 22 determines in step 109 the aging prediction line based on the sample brain health data 17 a associated with the individual characteristics 17 b and the aging transition line 52. 53 is generated.
- the risk presenting unit 30presents an aging prediction line 53 in addition to the aging transition line 52 and the risk line 54.
- the score calculation unit 23calculates the first age user brain health data 18a on the aging prediction line 53, the individual characteristics 17b corresponding to the individual characteristics obtained by adding the first age to the user individual characteristics 43, and Based on the result of comparison with the sample brain health data 17a associated with the life characteristic 17c corresponding to the user life characteristic 45, a score 55 indicating the future dementia risk of the user is calculated. 55 or a symbol corresponding to the score is presented together with or instead of the aging prediction line 53. If the user life characteristics 45 have not been input in step 108, the score calculation unit 23 calculates the score 55 based on the sample brain health data 17a associated with the individual characteristics 17b in step 110.
- step 112the presentation system 10 determines whether a different (next) user life characteristic 45 is provided. If a different user life characteristic 45 has been provided, the process returns to step 108 to acquire a different life characteristic (second user life characteristic) 45 and perform the same processing as described above. In step 109, the second aging prediction line 53a relating to the second user life characteristic 45 is predicted, and in step 110, the first aging prediction relating to the previous life characteristic (first user life characteristic) 45 is performed.
- the line 53 and the second aging prediction line 53a related to the second user life characteristic 45are arranged side by side or continuously so as to be comparable.
- step 111the second score 55 on the second aging prediction line 53a relating to the second user life characteristic 45 is calculated, and the second score 55 on the first aging prediction line 53 relating to the first user life characteristic 45 is calculated.
- the second score 55 on the first aging prediction line 53 relating to the first user life characteristic 45is calculated.
- step 113If there is no input of the next user's life characteristic in step 112, it is determined in step 113 whether or not a plurality of predictions have been executed.
- the server 30creates a report 50 including an aging transition line 52, an aging prediction line 53, a risk line 54, a score 55, and the like, and provides the report to the user. If a plurality of aging prediction lines 53 have been generated, in step 115, the risk presentation unit 30 creates a report 50 including the simulated aging prediction lines 53 and the plurality of scores 55, and provides the report to the user. .
- the brain condition data and the cognitive ability dataare used with reference to the user's life characteristics when scoring the dementia risk. This is to recognize the reliability score (and, consequently, the risk of dementia).
- the scoring method of the present inventionis not limited to such a method, and the result of the comparison between the user brain state data and the sample brain state data associated with the individual characteristics corresponding to the user individual characteristics is obtained. It is sufficient that scoring is performed based on the score. For example, it is not necessary to refer to life characteristics, and it is possible to use only brain state data without using cognitive data.
- an aging display area 51is provided in addition to the score display area 57, and when the aging display area 51 displays the dementia risk based on the brain condition data, the score is calculated.
- the score 55 or the like to be displayed in the display area 57may be obtained by referring to only the cognitive ability data.
- the presentation system 10includes data relating to the brain state of the user who is the subject of risk determination (user brain state data) and data relating to the brain state of the sample subject (sample brain state data). Compare brain health data to recognize dementia risk.
- the data relating to the brain stateis direct data of quantitative parameters based on the state of the brain that affects cognition. That is, in the dementia risk presentation system 10, not the indirect data of the brain function inferred from the user's brain waves, motions and the like as in the conventional system, but the direct data of the brain state data is used. be able to.
- the recognition of the risk of dementiais less affected by the estimation accuracy regarding brain functions.
- the dementia riskcan be recognized more accurately than in the conventional system.
- the present presentation system 10can present the recognized dementia risk to a user or the like in the form of a result of a comparison between the user brain state data and the sample brain state data.
- the presentation system 10can present the dementia risk in a format in which the aging line, which is a line corresponding to the age, and a risk line are compared. For this reason, the user and the like can simultaneously grasp not only the magnitude of the user's dementia risk but also the tendency of the user's dementia risk (whether the user is deteriorating, improving, or suppressing the deterioration). become able to.
- an aging prediction linewhich is a prediction of the transition of dementia risk from the present to the future, can be presented so as to be able to be compared with the risk line, and the user and the like can more accurately grasp the tendency of the user's dementia risk. it can.
- the presentation system 10can refer to one or a plurality of user life characteristics when recognizing the aging prediction line, and recognizes the highly reliable aging prediction line (and, consequently, the tendency of dementia risk).
- the user and the likecan more accurately grasp the tendency of the user for dementia risk.
- the user or the likecan intuitively grasp the fluctuation of the aging prediction line (and, consequently, the risk of dementia) according to the fluctuation of the life characteristics. can do.
- the user or the likecan specifically grasp the life characteristics to be improved, and thus is provided with an incentive for the improvement of the life characteristics.
- the presentation system 10can present the dementia risk as a score or the like.
- the user or the likecan recognize a highly reliable score or the like (and a risk of dementia) by referring to the user life characteristics. This allows the user or the like to more accurately grasp the tendency of the user for dementia risk.
- an incentive for improving the life characteristicsis given.
- the aboveis a dementia risk presentation system that presents a dementia risk of the user, wherein the sample brain state data that is data relating to the state of the brain of the sample subject is the age, gender, and physical information of the sample subject.
- a data storage unitstored in association with an individual characteristic including at least one of the following: a user brain state recognition unit that recognizes user brain state data that is data relating to the state of the brain of the user; and an individual characteristic of the user.
- a user individual characteristic recognition unitthat recognizes a user individual characteristic that is a risk recognition unit that performs a comparison between the user brain state data and the sample brain state data associated with the individual characteristic corresponding to the user individual characteristic.
- a risk presenting unitfor presenting a result of the comparison by the risk recognizing unit. It has been.
- the sample brain state data and the user brain state dataare the entire capacity of the brain, or data indicating the capacity of at least one predetermined region of the brain, and the risk recognition unit is configured to execute the past user brain state data and Based on the current user brain state data, recognizes an aging line indicating the transition of the user brain state data from the past to the present of the user, and the sample associated with the individual characteristic corresponding to the user individual characteristic. Based on the brain state data, recognize the risk line determined by referring to the transition according to the age of the sample brain state data, the risk presenting unit, the aging line and the risk line can be compared May be presented in parallel.
- the risk recognition unitwhile recognizing the aging line and the risk line, based on the aging line, the aging prediction line indicating the transition of the user brain state data predicted from the present of the user in the future in the future Recognizing, the risk presentation unit may present the aging line and the aging prediction line in parallel with the risk line in a comparable manner.
- the systemincludes a user life characteristic recognition unit that recognizes a user life characteristic that is a life characteristic including at least one of the user's lifestyle and living environment, and the data storage unit stores the sample brain state data in the individual. Characteristics, and the risk recognition unit is stored in association with the life characteristics of the sample subject, and based on the sample brain state data associated with the life characteristics corresponding to the user life characteristics.
- a trend line indicating a transition according to the age of the state datamay be recognized, and the aging prediction line may be recognized based on the trend line and the aging transition line.
- the risk recognizing unitwhen the user life characteristic is changed, recognizes the aging prediction line again based on the changed user life characteristic, and the risk presenting unit recognizes the user life characteristic before the change.
- the aging prediction line recognized based on the aging prediction line and the aging prediction line recognized based on the user's life characteristics after the changeare arranged in parallel in a comparable manner, or continuously presented in a comparable manner. Is also good.
- the risk recognition unitscores the dementia risk of the user based on a result of a comparison between the user brain state data and the sample brain state data associated with the individual characteristic corresponding to the user individual characteristic. And the risk presenting unit may present the score or a symbol corresponding to the score.
- the systemincludes a user life characteristic recognition unit that recognizes a user life characteristic that is a life characteristic of the user, and the data storage unit stores the sample brain state data, the individual characteristics, and a lifestyle of the sample target person.
- the risk recognition unitstored in association with a living characteristic including at least one of the living environment, the risk recognition unit, the user brain state data, the sample brain state data associated with the individual characteristics corresponding to the user individual characteristics, And the risk of the dementia of the user may be recognized as a score based on a result of comparison with the sample brain state data associated with the life characteristic corresponding to the user life characteristic.
- the systemincludes a user life characteristic recognition unit that recognizes a user life characteristic that is a life characteristic of the user, and the data storage unit stores the sample brain state data, the individual characteristics, and a lifestyle of the sample target person. And the risk recognition unit stores the score again based on the changed user life characteristic when the user life characteristic is changed when the user life characteristic is changed. Then, the risk presenting unit, the score or a symbol corresponding to the score recognized based on the user life characteristics before the change, and the score or the score recognized based on the user life characteristics after the change May be presented in parallel in a comparable manner or continuously in a comparable manner.
- a dementia risk presentation methodfor presenting a dementia risk of a user
- the data storage unitis sample brain state data that is data relating to the state of the brain of the sample subject
- the user brain state recognition unitrecognizes user brain state data that is data relating to the state of the brain of the user.
- the user individual characteristic recognizing unitrecognizes a user individual characteristic that is the individual characteristic of the user; and a risk recognizing unit associated with the user brain state data and the individual characteristic corresponding to the user individual characteristic.
- the present inventionis not limited to such an embodiment.
- the value of the capacity of the hippocampushippocampus volume
- a user's life characteristicsare referenced in addition to the user's individual characteristics.
- the dementia risk presentation system of the present inventionis not limited to such a configuration, and may be any system that compares brain state data based on individual characteristics to determine dementia risk.
- the capacity of the hippocampusa value related to the whole brain or another region may be used, or the life characteristics may not be referred to.
- other changes that can be conceived by those skilled in the artare included in the scope of the present invention in accordance with the scope set forth in the claims.
Landscapes
- Health & Medical Sciences (AREA)
- Engineering & Computer Science (AREA)
- Life Sciences & Earth Sciences (AREA)
- Medical Informatics (AREA)
- Public Health (AREA)
- General Health & Medical Sciences (AREA)
- Pathology (AREA)
- Biomedical Technology (AREA)
- Data Mining & Analysis (AREA)
- Physics & Mathematics (AREA)
- Primary Health Care (AREA)
- Epidemiology (AREA)
- Biophysics (AREA)
- Heart & Thoracic Surgery (AREA)
- Molecular Biology (AREA)
- Surgery (AREA)
- Animal Behavior & Ethology (AREA)
- Veterinary Medicine (AREA)
- Neurology (AREA)
- Databases & Information Systems (AREA)
- Physiology (AREA)
- Psychiatry (AREA)
- Psychology (AREA)
- Nuclear Medicine, Radiotherapy & Molecular Imaging (AREA)
- Developmental Disabilities (AREA)
- Neurosurgery (AREA)
- Hospice & Palliative Care (AREA)
- Child & Adolescent Psychology (AREA)
- High Energy & Nuclear Physics (AREA)
- Radiology & Medical Imaging (AREA)
- Signal Processing (AREA)
- Cardiology (AREA)
- Hematology (AREA)
- Computer Vision & Pattern Recognition (AREA)
- Artificial Intelligence (AREA)
- Medical Treatment And Welfare Office Work (AREA)
- Measuring And Recording Apparatus For Diagnosis (AREA)
- Apparatus For Radiation Diagnosis (AREA)
- Magnetic Resonance Imaging Apparatus (AREA)
- Nuclear Medicine (AREA)
Abstract
Description
Translated fromJapanese本発明は、ユーザの認知症リスクを提示するシステムおよび方法に関するものである。The present invention relates to a system and a method for presenting a risk of dementia of a user.
日本国特開2016-22310号公報には、認知症の潜在的リスクを極めて早い段階で判定でき、認知症の発症を遅らせる予防機会を与えることができる認知症リスク判定システムを提供することが記載されている。このシステムは、被検者の睡眠時の生体データを取得する生体データ検出センサと、生体データ検出センサにより取得された被検者の生体データから、時間の経過に伴う被検者の睡眠の深さ及び体動変化を含む睡眠データを生成する睡眠データ生成装置と、所定の認知症に関する症状について、実際の発症患者から得られた各症状特有の睡眠データを記憶した記憶部を具備し、睡眠データ生成装置で生成された被検者の睡眠データと、記憶部に記憶されている各症状の睡眠データとを比較して、被検者の睡眠データから3つの認知症のリスクを判定する認知症リスク判定装置とを備える。Japanese Patent Application Laid-Open No. 2016-22310 discloses that a potential risk of dementia can be determined at an extremely early stage and a dementia risk determination system that can provide a preventive opportunity to delay the onset of dementia can be provided. Have been. This system includes a biometric data detection sensor that acquires biometric data during sleep of a subject, and a depth of sleep of the subject over time from biometric data of the subject acquired by the biometric data detection sensor. A sleep data generating device that generates sleep data including a change in body movement and body movement, and a storage unit that stores sleep data specific to each symptom obtained from an actual onset patient, for a symptom related to predetermined dementia, The sleep data of the subject generated by the data generation device is compared with the sleep data of each symptom stored in the storage unit to determine three dementia risks from the sleep data of the subject. Disease risk determination device.
従来、認知症については、発症初期(実際に発症している状態だけでなく、発症が疑われている状態も含む)に、運動量、飲酒量等の生活習慣を適切なものとしたり、適切な治療を施したりすることによって、その進行を抑制できることが知られている。そのため、認知症の発症の可能性、または、発症後の進行の度合いを、早期に把握したいという要望がある。これに伴って、認知症の発症及び進行のリスク(以下、単に「認知症リスク」という)を把握するための様々なシステムが提案されている。Conventionally, in the early stages of dementia (including not only the actual onset but also the suspected onset), lifestyle habits such as exercise and alcohol consumption were adjusted appropriately, It is known that the progress can be suppressed by performing treatment. Therefore, there is a demand that the possibility of onset of dementia or the degree of progress after onset be ascertained at an early stage. Along with this, various systems for grasping the risk of onset and progress of dementia (hereinafter, simply referred to as “dementia risk”) have been proposed.
上記の催眠データから認知症でリスクを判定するシステムでは、睡眠時の状態によってユーザの脳の機能を推測し、その推測結果に基づいて、認知症リスクを認識している。そのため、認知症リスクの精度も、その推測の精度の影響を受けてしまうので、適切に認知症リスクを認識することが難しいという問題がある。単純に認知症リスクの有無を提示したのでは、十分な知識を有していない者にとって、その認知症リスクの内容を適切に理解することが難しいという問題がある。このため、認知症リスクを精度よく認識することができ、さらに、理解しやすい形で提示することができるシステムおよび方法が求められている。(4) In the above system for determining risk of dementia from hypnotic data, the function of the brain of the user is estimated based on the state of sleep, and the risk of dementia is recognized based on the estimation result. For this reason, the accuracy of the dementia risk is also affected by the accuracy of the estimation, and there is a problem that it is difficult to appropriately recognize the dementia risk. Simply presenting the presence or absence of dementia risk has a problem that it is difficult for those who do not have sufficient knowledge to appropriately understand the contents of the dementia risk. Therefore, there is a need for a system and method capable of accurately recognizing the risk of dementia and presenting it in an easily understandable form.
本発明の一態様は、サンプル対象者の脳の状態に係るデータであるサンプル脳状態データおよび脳の機能である認知力に係るデータであるサンプル認知力データの少なくともいずれかを含むサンプル脳健康データが、サンプル対象者の年齢、性別及び身体情報の少なくとも1つを含む個体特性に関連付けられた第1のデータベースと、ユーザの脳の状態に係るデータであるユーザ脳状態データおよび脳の機能である認知力に係るデータであるユーザ認知力データの少なくともいずれかを含むユーザ脳健康データを認識する第1の認識部と、ユーザの個体特性であるユーザ個体特性を認識する第2の認識部と、過去および現在のユーザ脳健康データに基づいて、ユーザの過去から現在におけるユーザ脳健康データの推移を示す経年推移ラインと、ユーザ個体特性に対応する個体特性に関連付けられたサンプル脳健康データに基づいて、該サンプル脳健康データの年齢に応じた推移を参照して決定された認知症に関するリスクラインとを提示するリスク提示部とを有するシステムである。One embodiment of the present invention provides sample brain health data including at least one of sample brain state data that is data relating to a brain state of a sample subject and sample cognition data that is data relating to cognition that is a function of the brain. Are a first database associated with individual characteristics including at least one of the age, gender, and physical information of the sample subject, user brain state data that is data relating to the state of the brain of the user, and functions of the brain. A first recognition unit that recognizes user brain health data including at least one of user cognition data that is data relating to cognition; a second recognition unit that recognizes user individual characteristics that are individual characteristics of a user; Based on past and present user brain health data, an aging line showing the transition of the user's brain health data from the past to the present of the user A risk presentation for presenting a risk line related to dementia determined based on sample brain health data associated with an individual characteristic corresponding to a user individual characteristic with reference to a transition according to the age of the sample brain health data. And a system comprising:
このシステムでは、リスク判定の対象となるユーザの脳状態に係るデータ(ユーザ脳状態データ)および脳の機能である認知力に係るデータであるユーザ認知力データの少なくともいずれかを含むユーザ脳健康データ(脳の健康状態のデータ)と、サンプル対象者の同様の脳の健康状態に係るデータ(サンプル脳健康データ)とを比較して、認知症リスクを認識する。脳状態に係るデータは、認知力に影響を及ぼす脳の状態に基づく定量的なパラメータという直接的なデータであり、ユーザの脳波、動作等から推測された脳の機能という間接的なデータではなく、脳状態に係るデータという直接的なデータである。認知力データを取得する認知力テストは、認知症リスクの判断基準としての内容の充実が図られており、脳機能の状態を精度よく判断できる。認知力テストの一例は、本件出願人が出願済みの特願2018-33652に記載されている。したがって、これらのいずれかまたは両方を含むユーザ脳健康データをサンプル脳健康データと比較することにより認知症リスクを精度よく認識できる。In this system, user brain health data including at least one of data relating to the brain state of the user to be subjected to risk determination (user brain state data) and user cognition data which is data relating to cognition as a function of the brain. By comparing (brain health data) and data on the same brain health of the sample subject (sample brain health data), the risk of dementia is recognized. The data related to the brain state is direct data of quantitative parameters based on the state of the brain that affects cognition, not indirect data of brain functions inferred from the user's brain waves, movements, etc. , Data directly related to brain conditions. The cognitive test for acquiring cognitive data is enriched as a criterion for determining the risk of dementia, and can accurately determine the state of brain function. An example of the cognitive test is described in Japanese Patent Application No. 2018-33652 filed by the present applicant. Therefore, the risk of dementia can be accurately recognized by comparing the user brain health data including one or both of these with the sample brain health data.
さらに、年齢に応じたラインである経年推移ラインとリスクラインと比較する形式で認知症リスクを提示することにより、ユーザ等は、ユーザの認知症リスクの大小だけでなく、ユーザの認知症リスクの傾向(悪化しているか、改善されているか、悪化が抑制されているか等)も同時に把握できる。このため、ユーザ、または、ユーザの健康を管理する者等(以下、総称する場合には、「ユーザ等」という)は、本システムが提示される情報により、十分な知識を有していない場合であっても、直感的に認知症リスクの大小を把握することができる。Furthermore, by presenting the dementia risk in a format that is compared with the age line and the risk line that are age-based lines, the user and the like can not only determine the magnitude of the user's dementia risk, but also the user's dementia risk. The tendency (whether it is worsening, improving, suppressing deterioration, etc.) can be grasped at the same time. For this reason, the user or a person who manages the health of the user (hereinafter, collectively referred to as “user etc.”) does not have sufficient knowledge based on the information presented by the present system. Even so, it is possible to intuitively grasp the magnitude of the risk of dementia.
リスク提示部は、ユーザ脳健康データと、ユーザ個体特性に対応する個体特性に関連付けられたサンプル脳健康データとの比較の結果に基づいて、ユーザの認知症リスクを示すスコア、または、スコアに応じた記号を提示する第1のスコア提示部を含んでもよい。認知症リスクを、スコアまたはスコアに応じた記号(以下、「スコア等」という)として提示することにより、ユーザ等は、ユーザの認知症リスクの大小をさらに直感的に把握できる。The risk presenting unit, based on the result of comparison between the user brain health data and the sample brain health data associated with the individual characteristics corresponding to the user individual characteristics, a score indicating the dementia risk of the user, or according to the score. And a first score presenting section for presenting the changed symbol. By presenting the dementia risk as a score or a symbol corresponding to the score (hereinafter, referred to as “score or the like”), the user or the like can more intuitively grasp the magnitude of the dementia risk of the user.
このシステムは、経年推移ラインに基づいて、ユーザの現在から将来において予測されるユーザ脳健康データの推移を示す経年予測ラインを予測する予測部を有し、リスク提示部は、経年推移ラインおよびリスクラインに加え、経年予測ラインを提示する予測提示部を含んでもよい。現在から未来の認知症リスクの推移の予測である経年予測ラインをリスクラインと比較可能に提示することにより、ユーザ等は、ユーザの認知症リスクの傾向をさらに的確に把握できる。This system has a prediction unit that predicts an aging prediction line indicating a transition of user brain health data predicted from the present to the future of the user based on the aging line, and the risk presenting unit includes an aging line and a risk In addition to the line, a prediction presenting unit that presents an aging prediction line may be included. By presenting an aging prediction line, which is a prediction of the transition of dementia risk from the present to the future, in a manner comparable to the risk line, the user and the like can more accurately grasp the tendency of the user's dementia risk.
リスク提示部は、経年予測ライン上の第1の年齢のユーザ脳健康データと、ユーザ個体特性に第1の年齢を加えた個体特性に対応する個体特性に関連付けられたサンプル脳健康データとの比較の結果に基づいて、ユーザの将来の認知症リスクを示すスコア、または、スコアに応じた記号を、経年予測ラインとともに、または代わりに提示する第2のスコア提示部を含んでもよい。リスク提示部は、経年予測ラインとは別に、ユーザの将来の第1の年齢のユーザ脳健康データを予想または予測し、その予測されたユーザ脳健康データと、ユーザ個体特性に第1の年齢を加えた個体特性に対応する個体特性に関連付けられたサンプル脳健康データとの比較の結果に基づいて、ユーザの将来の認知症リスクを示すスコア、または、スコアに応じた記号を提示してもよい。The risk presentation unit compares the user brain health data of the first age on the aging prediction line with the sample brain health data associated with the individual characteristic corresponding to the individual characteristic obtained by adding the first age to the user individual characteristic. Based on the result, a second score presentation unit that presents a score indicating the future dementia risk of the user or a symbol corresponding to the score together with or instead of the aging prediction line may be included. The risk presenting unit predicts or predicts the user brain health data of the user's future first age separately from the aging prediction line, and assigns the predicted user brain health data and the first age to the user individual characteristic. Based on the result of the comparison with the sample brain health data associated with the individual characteristic corresponding to the added individual characteristic, a score indicating the future dementia risk of the user, or a symbol corresponding to the score may be presented. .
第1のデータベースでは、サンプル脳健康データが、個体特性、並びに、サンプル対象者の生活習慣および生活環境の少なくとも1つを含む生活特性に関連付けられていてもよい。また、このシステムは、ユーザの生活特性であるユーザ生活特性を認識する第3の認識部をさらに有し、予測部は、ユーザ個体特性に対応する個体特性、ユーザ生活特性に対応する生活特性および年齢に関連付けられたサンプル脳健康データと経年推移ラインとに基づいて、経年予測ラインを予測してもよい。経年予測ラインを認識するに際し、ユーザ生活特性を参照すると、信頼性の高い経年予測ライン(ひいては、認知症リスクの傾向)を認識できる。これにより、ユーザ等は、ユーザの認知症リスクの傾向をさらに的確に把握することができる。In the first database, the sample brain health data may be associated with individual characteristics and life characteristics including at least one of the sample subject's lifestyle and living environment. Further, the system further includes a third recognition unit that recognizes a user life characteristic that is a life characteristic of the user, and the prediction unit includes an individual characteristic corresponding to the user individual characteristic, a life characteristic corresponding to the user life characteristic, and The aging prediction line may be predicted based on the sample brain health data associated with the age and the aging line. When recognizing the aging prediction line, a highly reliable aging prediction line (and, consequently, the tendency of dementia risk) can be recognized by referring to the user life characteristics. This allows the user or the like to more accurately grasp the tendency of the user for dementia risk.
リスク提示部は、経年予測ライン上の第1の年齢のユーザ脳健康データと、ユーザ個体特性に第1の年齢を加えた個体特性に対応する個体特性、およびユーザ生活特性に対応する生活特性に関連付けられたサンプル脳健康データとの比較の結果に基づいて、ユーザの将来の認知症リスクを示すスコア、または、スコアに応じた記号を、経年予測ラインとともに、または代わりに提示する第3のスコア提示部を含んでもよい。リスク提示部は、経年予測ラインとは別に、ユーザから指定された、または任意に選択されたユーザ生活特性に対応するユーザ脳健康データを予測し、その予測されたユーザ脳健康データと、ユーザ生活特性に対応する生活特性に関連付けられたサンプル脳健康データとの比較の結果に基づいて、ユーザの将来の認知症リスクを示すスコア、または、スコアに応じた記号を提示してもよい。The risk presenting unit calculates the first age user brain health data on the aging prediction line, the individual characteristics corresponding to the individual characteristics obtained by adding the first age to the user individual characteristics, and the life characteristics corresponding to the user life characteristics. A third score that presents a score indicating the future risk of dementia of the user, or a symbol responsive to the score, along with or instead of the aging prediction line, based on the results of the comparison with the associated sample brain health data. A presentation unit may be included. The risk presenting unit predicts user brain health data corresponding to a user life characteristic specified or arbitrarily selected by the user, separately from the aging prediction line, and the predicted user brain health data and the user life Based on the result of the comparison with the sample brain health data associated with the life characteristic corresponding to the characteristic, a score indicating the future dementia risk of the user or a symbol corresponding to the score may be presented.
予測部は、同一のユーザに対し、第1のユーザ生活特性に基づく第1の経年予測ラインと、第2のユーザ生活特性に基づく第2の経年予測ラインとを認識する比較予想部を含み、リスク提示部は、第1の経年予測ラインと第2の経年予測ラインとを比較可能に並べて、または連続的に提示する比較提示部を含んでもよい。ユーザ等は、生活特性の変動に応じた経年予測ライン(ひいては、認知症リスク)の変動を、直感的に把握することができる。これにより、ユーザ等は、具体的に改善すべき生活特性を把握することができるので、生活特性の改善に対するインセンティブを与えられることになる。The prediction unit includes a comparison prediction unit that recognizes, for the same user, a first aging prediction line based on a first user life characteristic and a second aging prediction line based on a second user life characteristic, The risk presentation unit may include a comparison presentation unit that presents the first aging prediction line and the second aging prediction line side by side in a comparable manner or continuously. The user or the like can intuitively grasp the change of the aging prediction line (and, by extension, the risk of dementia) according to the change in the life characteristics. Thus, the user or the like can specifically grasp the life characteristics to be improved, and thus is provided with an incentive for the improvement of the life characteristics.
リスク提示部は、第1の経年予測ラインに対応するユーザの将来の認知症リスクを示す第1のスコアと、第2の経年予測ラインに対応するユーザの将来の認知症リスクを示す第2のスコアとを提示する第4のスコア提示部を含んでいてもよい。それぞれのスコアは、それぞれの経年予測ライン上の第1の年齢のユーザ脳健康データと、ユーザ個体特性に第1の年齢を加えた個体特性に対応する個体特性、およびそれぞれのユーザ生活特性に対応する生活特性に関連付けられたサンプル脳健康データとの比較の結果に基づいて算出される。リスク提示部は、経年予測ラインとは別に、それぞれのユーザ生活特性に基づくユーザの将来の認知症リスクを予測し、それらのリスクを示す第1のスコアと第2のスコアとを提示してもよい。The risk presenting unit includes a first score indicating a future dementia risk of the user corresponding to the first aging prediction line, and a second score indicating a future dementia risk of the user corresponding to the second aging prediction line. A fourth score presenting unit for presenting a score may be included. Each score corresponds to the user brain health data of the first age on each aging prediction line, the individual characteristics corresponding to the individual characteristics obtained by adding the first age to the user individual characteristics, and the respective user life characteristics. It is calculated based on the result of comparison with the sample brain health data associated with the living characteristics to be performed. The risk presenting unit predicts a user's future dementia risk based on each user's life characteristic separately from the aging prediction line, and presents a first score and a second score indicating those risks. Good.
サンプル脳状態データおよびユーザ脳状態データは、脳の全体の容量、又は、脳の少なくとも1つの所定領域の容量を示すデータを含んでもよく、脳画像、脳血流、脳波を含んでもよく、その他の直接・間接的に脳の状態を示す情報、たとえば、血液バイオマーカなどの情報を含んでもよい。The sample brain condition data and the user brain condition data may include data indicating the entire volume of the brain or the volume of at least one predetermined region of the brain, and may include a brain image, a cerebral blood flow, an electroencephalogram, and the like. May directly or indirectly indicate the state of the brain, for example, information such as a blood biomarker.
本発明の他の態様の1つは、認知症のリスクを提示する方法である。この方法は、サンプル対象者の脳の状態に係るデータであるサンプル脳状態データおよび脳の機能である認知力に係るデータであるサンプル認知力データの少なくともいずれかを含むサンプル脳健康データが、前記サンプル対象者の年齢、性別及び身体情報の少なくとも1つを含む個体特性に関連付けられた第1のデータベースを参照可能なシステムを用い、以下のステップを含む。
1.ユーザの脳の状態に係るデータであるユーザ脳状態データおよび脳の機能である認知力に係るデータであるユーザ認知力データの少なくともいずれかを含むユーザ脳健康データを認識すること。
2.ユーザの個体特性であるユーザ個体特性を認識すること。
3.過去および現在のユーザ脳健康データに基づいて、ユーザの過去から現在におけるユーザ脳健康データの推移を示す経年推移ラインと、ユーザ個体特性に対応する個体特性に関連付けられたサンプル脳健康データに基づいて、該サンプル脳健康データの年齢に応じた推移を参照して決定された認知症に関するリスクラインとによりリスクを提示すること。Another aspect of the present invention is a method for presenting a risk of dementia. The method comprises the steps of: sample brain health data including at least one of sample brain state data that is data relating to the state of the brain of a sample subject and sample cognition data that is data relating to cognition that is a function of the brain; Using a system capable of referring to a first database associated with an individual characteristic including at least one of age, gender, and physical information of a sample subject, the method includes the following steps.
1. Recognizing user brain health data including at least one of user brain state data that is data relating to the state of the brain of the user and user cognition data that is data relating to cognition that is a function of the brain.
2. Recognizing user individual characteristics that are user individual characteristics.
3. Based on the past and present user brain health data, based on the user's past and present user brain health data over time, and based on sample brain health data associated with individual characteristics corresponding to the user individual characteristics Presenting a risk using a risk line for dementia determined with reference to the age-dependent transition of the sample brain health data.
この方法は、さらに、ユーザ脳健康データと、ユーザ個体特性に対応する個体特性に関連付けられたサンプル脳健康データとの比較の結果に基づいて、ユーザの認知症リスクを示すスコア、または、スコアに応じた記号を提示することを有してもよい。The method further includes generating a score or a score indicating a risk of dementia of the user based on a result of the comparison between the user brain health data and the sample brain health data associated with the individual characteristic corresponding to the user individual characteristic. Presenting a corresponding symbol may be included.
この方法は、さらに、経年推移ラインに基づいて、ユーザの現在から将来において予測されるユーザ脳健康データの推移を示す経年予測ラインを予測することを有し、リスクを提示することは、経年推移ラインおよびリスクラインに加え、経年予測ラインを提示することを含んでもよい。また、この方法は、経年予測ライン上の第1の年齢のユーザ脳健康データと、ユーザ個体特性に第1の年齢を加えた個体特性に対応する個体特性に関連付けられたサンプル脳健康データとの比較の結果に基づいて、ユーザの将来の認知症リスクを示すスコア、または、スコアに応じた記号を、経年予測ラインとともに、または代わりに提示することを有してもよい。The method further comprises predicting, based on the aging line, an aging prediction line indicating a transition of the user's brain health data that is predicted from the user's present to the future, and presenting the risk is based on the aging line. This may include presenting an aging forecast line in addition to the line and the risk line. In addition, the method includes the step of combining the user brain health data of the first age on the aging prediction line with the sample brain health data associated with the individual characteristic corresponding to the individual characteristic obtained by adding the first age to the user individual characteristic. Based on the results of the comparison, a score indicating the user's future dementia risk, or a symbol corresponding to the score, may be presented along with or instead of the aging prediction line.
第1のデータベースでは、サンプル脳健康データが、個体特性、並びに、サンプル対象者の生活習慣および生活環境の少なくとも1つを含む生活特性に関連付けられていてもよい。また、この方法は、さらに、ユーザの生活特性であるユーザ生活特性を認識することを有し、予測することは、ユーザ個体特性に対応する個体特性、ユーザ生活特性に対応する生活特性および年齢に関連付けられたサンプル脳健康データと経年推移ラインとに基づいて、経年予測ラインを予測することを含んでもよい。In the first database, the sample brain health data may be associated with individual characteristics and life characteristics including at least one of the sample subject's lifestyle and living environment. In addition, the method further includes recognizing a user life characteristic that is a life characteristic of the user, and the estimating includes determining an individual characteristic corresponding to the user individual characteristic, a life characteristic and an age corresponding to the user life characteristic. The method may include predicting an aging prediction line based on the associated sample brain health data and the aging line.
また、この方法は、さらに、経年予測ライン上の第1の年齢のユーザ脳健康データと、ユーザ個体特性に第1の年齢を加えた個体特性に対応する個体特性、およびユーザ生活特性に対応する生活特性に関連付けられたサンプル脳健康データとの比較の結果に基づいて、ユーザの将来の認知症リスクを示すスコア、または、スコアに応じた記号を、経年予測ラインとともに、または代わりに提示することを有してもよい。この方法は、経年予測ラインとは別に、ユーザから指定された、または任意に選択された第1の年齢のユーザ脳健康データを予想し、そのユーザ脳健康データと、ユーザ個体特性に第1の年齢を加えた個体特性に対応する個体特性、およびユーザ生活特性に対応する生活特性に関連付けられたサンプル脳健康データとの比較の結果に基づいて、ユーザの将来の認知症リスクを示すスコア、または、スコアに応じた記号を提示してもよい。Further, the method further includes user brain health data of the first age on the aging prediction line, individual characteristics corresponding to the individual characteristics obtained by adding the first age to the user individual characteristics, and user life characteristics. Presenting a score indicating the user's future dementia risk, or a symbol corresponding to the score, along with or instead of the aging prediction line, based on the results of comparison with sample brain health data associated with life characteristics. May be provided. The method predicts user brain health data of a first age specified or arbitrarily selected by a user, separately from an aging prediction line, and adds first brain health data to the user brain health data and a first individual characteristic to a user individual characteristic. A score indicating the user's future risk of dementia, based on the individual characteristics corresponding to the age-added individual characteristics and the results of comparison with the sample brain health data associated with the life characteristics corresponding to the user life characteristics, or , A symbol corresponding to the score may be presented.
予測することは、同一のユーザに対し、第1のユーザ生活特性に基づく第1の経年予測ラインと、第2のユーザ生活特性に基づく第2の前記経年予測ラインとを予測することを含み、リスクを提示することは、第1の経年予測ラインと第2の経年予測ラインとを比較可能に並べて、または連続的に提示することを含んでもよい。この方法は、第1の経年予測ライン上の第1の年齢に対するスコアと、第2の経年予測ライン上の第1の年齢に対するスコアとを提示することを有していてもよい。この方法は、ユーザにより指定された、あるいは任意のユーザ生活特性に基づいて予測された、認知症のリスクに関する複数のスコアを提示してもよい。Predicting includes, for the same user, predicting a first aging prediction line based on a first user life characteristic and a second aging prediction line based on a second user life characteristic, Presenting the risk may include presenting the first aging line and the second aging line in a comparable or continuous manner. The method may include presenting a score for a first age on a first aging line and a score for a first age on a second aging line. The method may present multiple scores for the risk of dementia specified by the user or predicted based on any user life characteristics.
本発明の他の対応の1つは、上記のシステムとしてコンピュータを稼働させるための命令を有するプログラム(プログラム製品)である。プログラム(プログラム製品)を、任意の記録媒体に記録して提供してもよい。Another aspect of the present invention is a program (program product) having instructions for operating a computer as the above system. The program (program product) may be recorded on any recording medium and provided.
図1に、認知症のリスクを提示する装置(システム)を含むシステムの一例を示している。このシステム1は、MRI(Magnetic Resonance Imaging)装置(MRI)3aを含む病院3と、ユーザに関する各種情報の入力、および認知症リスクに関するレポート50の出力(表示)を行う情報端末(パーソナルコンピュータ、タブレット端末)2と、インターネット9を介してMRI3aおよびタブレット2から受信した情報を処理し、認知症リスクおよびその他の情報を含むレポート50を送信する情報提供装置(認知症リスク提示装置、認知症リスク提示システム、提示システム)10とを含む。本例において、提示システム10は、メモリ、CPUなどのコンピュータ資源を含み、インターネット(クラウド)9を介して情報を入出力可能なサーバ7に実装されているが、提示システム10は、ユーザの情報端末2と一体化されていてもよく、有線または無線により接続されていてもよく、病院3の内部に設置されていてもよく、提示システム10の各機能の一部あるいは全部がユーザ端末2を含めた複数の情報処理装置に分散して実装されていてもよい。FIG. 1 shows an example of a system including a device (system) for presenting a risk of dementia. The
MRI3aは、ユーザの脳状態に係るデータ(ユーザ脳状態データ)を取得し、そのユーザ脳状態データ41を提示システム10へ送信する。ユーザ脳状態データ41を取得する装置は、MRI3aに限らず、認知症リスクの判断対象であるユーザのユーザ脳状態データを認識できる構成を備えた装置であればよい。例えば、CT(Computed Tomography)検査装置、超音波検査装置等、さらに、FDG、SPECT等の脳機能(脳血流)を測定する装置、脳波、血液バイオマーカなどを測定する装置であってもよく、これらにより測定可能な情報は脳状態に係るデータに含まれてもよい。また、脳状態に係るデータとして、脳の形状、容量ではなく、脳内の所定のタンパク質の量を用いる場合には、PET(Positron Emission Tomography)画像取得装置等を用いてもよい。提示システム10は、MRI3aから得た脳状態データ41を使用してもよく、事前に得られ、ユーザライブラリ18に格納された脳状態データ41を使用してもよい。The MRI 3a acquires data relating to the brain state of the user (user brain state data), and transmits the user
以下において、脳状態データ41として、海馬の容量(海馬体積)の値を用いた例を説明するが、脳状態データ41はこれに限定されない。ここで、「脳の状態」とは、脳の全体の状態、または、認知力に影響を及ぼす脳の領域(例えば、海馬、縁上回、角回、上前頭回、中前頭回、下前頭回、前帯状皮質等)の状態を指す。「状態」とは、脳の全体又は脳の所定領域の容量および形状の他、脳内の所定のタンパク質(例えば、アミロイドβ等)の量等が挙げられる。脳状態データ(脳状態に係るデータ、脳の状態に係るデータ)41は、脳の状態に基づく定量的なパラメータを含み、例えば、上記した脳の状態そのもの(すなわち、脳の全体又は所定の領域の形状)、または、脳の容量若しくは大きさを数値化したものを含む。脳状態データ41は、単一の脳状態に係るものであってもよいし、複数の脳状態に係るものであってもよい。具体的には、例えば、脳状態データ41は、海馬の量を含んでもよく、海馬の量と脳内のアミロイドβの量とに基づいて所定の計算式で得られる値を含んでもよい。In the following, an example in which a value of the capacity of the hippocampus (hippocampus volume) is used as the
提示システム10にユーザに関する情報を入力し、提示システム10からユーザの認知症リスクの情報を含むレポート50を受信するタブレット2は、タッチパネル2a(入出力部)を備えている。タッチパネル2aを介して、提示システム10からの個体特性の照会42に対してユーザの個体特性43が入力され、生活特性の照会44に対してユーザの生活特性45が入力され、また、変更される。また、タッチパネル2aに、認知力テストの問題60が提示され、認知力テストに対する回答を含む認知力データ61が提示システム10へ入力される。さらに、タッチパネル2aには、認知症リスクの提示を含むレポート50が表示される。The
これらの情報の入出力に用いられるユーザ端末はタッチパネル2aを有するタブレット2に限定されない。ユーザ端末は、認知症リスクの判断対象であるユーザの個体特性を認識することができ、認知症リスクを提示することができる構成を備えていればよい。例えば、タブレットではなく、パソコン、スマートフォン等を用いてもよい。また、出力部と入力部が一体化した入出力部であるタッチパネルに代わり、独立した出力部及び入力部を採用してもよい。具体的には、入力部としてキーボード、マイク等を採用してもよいし、出力部としてディスプレイ、スピーカ、印刷デバイス等を採用してもよい。ユ ー ザ The user terminal used for inputting / outputting such information is not limited to the
また、ユーザ端末の入力部と出力部とは、必ずしも同一の装置に備わっていなくてもよく、部屋内等、相互に近い位置に配置しなくてもよい。例えば、ユーザ端末の出力部としてのディスプレイ、スピーカ、印刷デバイス等を、MRI装置等の設置されている場所とは異なる場所に設けられた医療用ワークステーションに配置してもよい。The input unit and the output unit of the user terminal do not necessarily have to be provided in the same device, and do not have to be arranged near each other, such as in a room. For example, a display, a speaker, a printing device, or the like as an output unit of the user terminal may be arranged on a medical workstation provided in a location different from the location where the MRI apparatus or the like is installed.
提示システム10として稼働するサーバ7は、メモリ(データ格納部、データ格納領域)16と、メモリ16に格納されたプログラム(プログラム製品)19がロードされることにより各種の機能(機能ユニット、機能部)として動作するプロセッサ(CPU)8とを含む。メモリ16は、サンプル対象者の脳の状態に係るデータであるサンプル脳状態データ17d、および脳の機能である認知力に係るデータであるサンプル認知力データ17eの少なくともいずれかを含むサンプル脳健康データ17aを含むデータベース(第1のデータベース)17と、ユーザの脳健康データ(ユーザ脳健康データ)18aが格納されたユーザライブラリ18とを含む。The
データベース17は、さらに、サンプル対象者の年齢、性別及び身体情報の少なくとも1つを含む個体特性17bを含み、サンプル脳健康データ17aが個体特性17bに関連付けられて格納されている。データベース17は、さらに、サンプル対象者の生活習慣および生活環境の少なくとも1つを含む生活特性17cを含み、サンプル脳健康データ17aが生活特性17cに関連付けられて格納されている。The
ここで、「サンプル対象者」とは、認知症(軽度認知症を含む)を発症している者および認知症の発症を疑われる者だけではなく、認知症を発症していない健常者も含まれる。個体特性17bとは、年齢、性別及び身体情報の少なくとも1つを含むものである。また、個体特性17bに含まれる「身体情報」とは、定量的に示すことのできる身体の情報を指す。具体的には、例えば、身長、体重、体脂肪率、BMI、コレステロール値等が挙げられる。Here, the “sample subjects” include not only those who have developed dementia (including mild dementia) and those who are suspected of having dementia, but also healthy people who do not have dementia. It is. The
生活特性17cとは、生活習慣および生活環境の少なくとも1つを含むものである。「生活習慣」とは、生活において認知症リスクの増減に影響を及ぼす習慣のことを指す。具体的には、例えば、運動量、食事量及び種類、睡眠時間の長さ及び質、コミュニケーション量及び頻度、趣味活動量及び頻度、飲酒量及び頻度、喫煙量及び頻度等が挙げられる。「生活環境」とは、生活において認知症リスクの増減に影響を及ぼす環境のことを指す。具体的には、例えば、住所(住環境)、職業、学歴、年収、同居人の人数等が挙げられる。
データベース17においては、サンプル対象者の脳の状態に係るデータ(サンプル脳状態データ)17dおよびサンプル対象者の認知力テストの結果に係るデータ(サンプル認知力データ)17eを含むサンプル脳健康データ17aが、サンプル対象者の個体特性17bおよび生活特性17cに関連付けられた形式で格納されている。ユーザライブラリ18には、ユーザの脳状態に係るデータ(ユーザ脳状態データ)41およびユーザの認知力に係るデータ(ユーザ認知力データ)61を含むユーザ脳健康データ18aが最新(現在)のものに加えて、過去に取得されたものが格納されている。ユーザライブラリ18には、各ユーザの個体特性(ユーザ個体特性)43および生活特性(ユーザ生活特性)45が格納されていてもよい。提示システム10は、リスク判定の対象となるユーザの脳の健康状態に係るデータ(ユーザ脳健康データ)18aと、サンプル対象者の脳状態に係るデータ(サンプル脳状態データ)17aとを比較して、認知症リスクを認識する。In the
ここで、脳状態に係るデータ17aおよび41は、認知力に影響を及ぼす脳の状態に基づく定量的なパラメータという直接的なデータである。すなわち、この認知症リスク提示システム10では、従来のシステムのようにユーザの脳波、動作等から推測された脳の機能という間接的なデータではなく、脳状態に係るデータという直接的なデータを用いている。これにより、この提示システム10では、認知症リスクの認識において、脳の機能に関する推測精度の影響を受けることがない。その結果、この提示システム10によれば、従来のシステムに比べ、認知症リスクを精度よく認識することができる。デ ー タ Here, the
提示システム10は、ユーザの脳の状態に係るデータであるユーザ脳状態データ41および脳の機能である認知力に係るデータであるユーザ認知力データ61の少なくともいずれかを含むユーザ脳健康データ18aを取得(認識)する第1の認識部11を有する、第1の認識部11は、ユーザ脳状態データ41を取得する入力部(入力機能、入力ユニット)14と、ユーザ認知力データ61を取得する入力部(入力機能、入力ユニット)15とを含む。認知力データ入力部15は、ユーザの端末2に対し認知力テスト60を送り、その回答からユーザ認知力データ61を認識する。認知力データ入力部15は、端末2からの直接的な情報入力に限定されず、紙媒体を介した入力や、医師、その他の専門家を介した情報の提供などにより、ユーザに関する情報を間接的に取得してもよい。他の情報の認識(取得、入力)においても同様である。The
認知力テスト60の一例は、5つの認知力ドメイン毎の機能を評価するものである。認知力ドメインには、短期記憶、作業記憶、実行機能、空間認知、計算が含まれる。短期記憶は、短い時間、覚えた内容を保持して思い出せる能力を示し、脳の海馬が関わっていると言われている。作業記憶は「電話番号を覚え、その番号のボタンを押して電話をかける」といった、保持した記憶を異なる形で操作する能力であり、脳の前頭前野・側頭頭頂部などが関わっていると言われている。実行機能は、料理の「手順」や「状況に応じた材料の変更」など、ルールを維持・更新し、行動や思考を制御する能力であり、特に、脳の前頭前野が関わっていると言われている。空間認知は、図形・物体が空間の中でどの方向を向いているかを瞬時に把握・理解する能力であり、脳の頭頂葉が関わっていると言われている。計算は、四則演算を行う能力であり、脳のいろいろな領域が関わっているが、特に、脳の側頭頭頂部が関わっている言われている。One example of the
認知力データ入力部15は、認知力テスト60を行い、これらの認知力ドメイン毎の評価をユーザ認知力データ61として取得する。認知力データ61は、認知力ドメイン毎の評価を、後述するような統計処理を行うことにより、脳の機能を精度よく判断する指標とすることができる。(4) The cognitive
提示システム10は、さらに、ユーザの個体特性であるユーザ個体特性43を認識(取得)する第2の認識部(個体特性入力部、第2の入力ユニット)12と、ユーザの生活特性であるユーザ生活特性45を認識(取得)する第3の認識部(生活特性入力部、第3の入力ユニット)13とを含む。個体特性入力部12は、個体特性に関わる問診票(質問表)42をユーザ端末2に送り、それに対する回答から各ユーザの個体特性43を認識してもよい。ユーザに関する電子カルテ等が予め作成されている場合等には、個体特性入力部12は、その電子カルテ等の記載に基づいて、ユーザ個体特性43を認識してもよい。The
生活特性入力部13は、生活特性に関わる問診票(質問表)44をユーザ端末2に送り、それに対する回答から各ユーザの生活特性45を認識してもよい。ユーザに関する電子カルテ等が予め作成されている場合等には、生活特性入力部13は、その電子カルテ等の記載に基づいて、ユーザ生活特性45を認識してもよい。The life
提示システム10は、さらに、各ユーザの現状の認知症に対するリスクを認識し、将来のリスクを予想する認識・予測部(予測部、予測機能、予測ユニット)20と、認知症のリスクを含む情報をユーザに提示するリスク提示部(リスク提示機能、リスク提示ユニット)30とを含む。認識・予測部20は現状のリスクを認識する現状リスク認識部21と、将来のリスクを予測する予測部22と、リスクをスコアに変換するスコア算出部23とを含む。The
現状リスク認識部21は、過去および現在のユーザ脳健康データ18aに基づいて、ユーザの過去から現在におけるユーザ脳健康データ18aの推移を示す経年推移ラインと、ユーザ個体特性43に対応する個体特性17bに関連付けられたサンプル脳健康データ17aに基づいて、そのサンプル脳健康データ17aの年齢に応じた推移を参照して決定された認知症に関するリスクラインを認識し、リスク提示部30を介してユーザ端末2に出力する。Based on the past and present user's
現状のリスク認識部21は、データベース17からユーザ個体特性43に対応する個体特性17bに関連付けられたサンプル脳状態データ17d、および、サンプル認知力データ17eを取得する。その後、そのサンプル脳状態データ17dとユーザ脳状態データ41との比較、および、そのサンプル認知力データ17eとユーザ認知力データ61との比較を行う。そして、これらの比較の結果に基づいて、ユーザの認知症リスクを認識してもよい。上述したように、サンプル脳状態データ17dおよびユーザ脳状態データ41は、海馬に限定されず、脳の全体の容量、または、脳の少なくとも1つの所定領域の容量であってもよい。The current
予測部22は、経年推移ラインに基づいて、ユーザの現在から将来において予測されるユーザ脳健康データの推移を示す経年予測ラインを予測し、リスク提示部30を介して、経年推移ラインおよびリスクラインに加え、経年予測ラインを提示可能とする。スコア算出部23は、現状または将来の予測されたユーザ脳健康データ18aと、ユーザ個体特性43に対応する個体特性17bに関連付けられたサンプル脳健康データ17aとの比較の結果に基づいて、ユーザの認知症リスクを示すスコア、または、スコアに応じた記号を求め、リスク提示部30を介して提示可能とする。The
リスク提示部30は、経年推移ライン、経年予測ライン、リスクラインなどをチャートまたはグラフィック表示するチャート表示部31と、求められたスコアを表示するスコア提示部32とを含む。チャート表示部31は、経年予測ラインを含めた予測表示を行う予測提示部31aと、生活特性を変えた複数のケースをシミュレートした結果を表示する比較提示部31bとを含む。スコア提示部32は、現状のリスクのスコア(対応する記号等を含む)を表示する第1のスコア提示部32aと、予測されたリスクのスコア等を表示する第2のスコア提示部32bと、生活特性を含めて予測されたリスクのスコア等を表示する第3のスコア提示部32cと、生活特性を変えたケースをシミュレートしたリスクのスコア等を表示する第4のスコア提示部32dとを含む。The
図2に、提示システム10によりユーザに提供されるレポート50の一例を示している。このレポート50は、認知症リスクの判断を行われた際に、ユーザ端末2に提示される画面またはデジタルデータであってもよく、オーディオファイルであってもよく、ユーザ端末2を経て、また経ずに郵送などによりユーザに提供される印刷物、冊子などであってもよい。レポート50は、脳画像表示エリア59と、経年推移表示エリア51と、スコア表示エリア57と、生活特性表示エリア58とを含み、各エリアに認知症リスクまたはユーザ生活特性に関する情報が提示される。FIG. 2 shows an example of a
具体的には、脳画像表示エリア59には、MRI3aによって取得されたユーザ脳状態データ41に含まれるユーザの脳の画像が表示される。経年推移表示エリア51には、リスク認識・予測部20によって認識された認知症リスクとして、グラフ(チャート)が提示部30を介して表示される。このグラフは、サンプル脳状態データとユーザ脳状態データとの比較の結果を示すものである。このグラフには、経年推移ライン52と、経年予測ライン53と、リスクライン54とが含まれる。Specifically, in the brain
スコア表示エリア57には、リスク認識・予測部20によって認識された認知症リスクとして、A~D及びFのアルファベットで示された総合リスク判定に係るランク55と、数字で示された脳年齢56a、長期予測に係る記号である矢印56bが表示される。また、スコア表示エリア57には、ランク55に関する凡例56cが表示される。このランク55の値、脳年齢56aの値および矢印56bの傾きは、サンプル脳状態データ17dとユーザ脳状態データ41との比較の結果、および、サンプル認知力データ17eとユーザ認知力データ61との比較の結果に基づいて得られたスコアに応じて定められる。ランクAは、脳機能が高いことを示し、ランクBは、脳機能が標準的であることを示し、ランクCは脳機能が低下していることを示し、ランクDは脳機能の低下に注意すべきことを示している。ランクFは、すでに脳機能の低下により治療が開始されていることを示す。The
生活特性表示エリア58には、ユーザ生活特性45が表示される。このユーザ生活特性45は、タッチパネル2aを介して、変更された結果が反映される。ユ ー ザ In the life
なお、このような表示形式によって認知症リスクを提示する方法はあくまでも一例である。すなわち、提示システム10により認知症リスクを提示する方法は、このような構成に限定されるものではなく、ユーザの脳健康データ18aと、ユーザの個体特性および/または生活特性に関連付けられたサンプル脳健康データ17aとの比較の結果を提示するものであればよい。例えば、画面(レポート)50のレイアウトは適宜変更してもよい。また、グラフのみ、または、スコアに関する表示のみを行ってもよい。また、スコアに関する表示のうち、ランク、脳年齢、矢印のいずれか1つ、または2つのみを表示してもよい。上記の表示とは全く異なる形式で提示してもよく、例えば、ユーザの脳の画像と、ユーザと同じ個体特性を有し、理想的な健康状態にあるサンプル対象者な脳の画像とを並列表示してもよい。また、音声によって結果を提示してもよい。(4) The method of presenting the risk of dementia using such a display format is merely an example. That is, the method of presenting the dementia risk by the
経年推移表示エリア51における表示内容についてさらに説明する。このレポート50においては、経年推移表示エリア51に、認知症リスクとして、縦軸を海馬体積、横軸を年齢としたグラフが表示される。このグラフには、経年推移ライン52、経年予測ライン53、および、リスクライン54が含まれる。経年推移ライン52は、ユーザの過去から現在におけるユーザ脳状態データ41の推移を示す。経年予測ライン53は、ユーザの現在から将来において予測されるユーザ脳状態データ41の推移を示す。リスクライン54は、ユーザ等が警戒すべき認知症リスクの度合いを示すためのものであり、グラフ中の領域を基準範囲54aと要注意ゾーン54bとに分割する。表示 The display contents in the aging
ユーザ等は、経年推移ライン52の傾き、および経年予測ライン53の傾きと、リスクライン54の傾きとを対比したり、経年推移ライン52の位置、および経年予測ライン53の位置(具体的には、基準範囲54aの範囲内にあるか、要注意ゾーン54bの範囲内にあるか)を参照したりして、ユーザの認知症リスクの大小、認知症リスクの傾向を把握する。The user or the like compares the inclination of the aging
経年推移ライン52および経年予測ライン53を作成する処理に際しては、まず、ユーザ脳状態認識部14が、ユーザの現在及び過去における脳状態データ41を認識する。具体的には、ユーザ脳状態認識部14は、過去(本実施形態ではユーザが41歳のとき)、および、現在(認知症リスク判断のとき(本実施形態ではユーザが45歳のとき))に、MRI3aを用いて取得されたユーザの脳の断面画像から、所定のアルゴリズムを用いて、海馬体積を算出する。所定のアルゴリズムとして、ニューラルネットワークを用いて画像の経年の生成モデルによる海馬体積の予測を行う技術を用いてもよい。さらに精度を上げるため、生活所見と相関の高いバイオマーカーデータ情報を加えてもよい。In the process of creating the aging
リスク認識・予想部20の現状のリスク認識部21は、ユーザ脳状態認識部14が認識したユーザ脳状態41に基づいて、ユーザの脳の状態に関する経年推移ライン52を認識する。The current
具体的には、図3に示すように、まず、現状のリスク認識部21は、縦軸を海馬体積、横軸を年齢としたグラフ上に、ユーザの過去(41歳)における海馬体積、及び、ユーザの現在(45歳)における海馬体積をプロットする。その後、リスク認識部21は、それらを線分で結ぶことによって、経年推移ライン52を生成する。リスク認識部21は、ユーザ個体特性43に基づいて、そのユーザ個体特性43に対応する個体特性17bに関連付けられたサンプル脳状態データ17dを、データベース17から取得する。Specifically, as shown in FIG. 3, first, the current
ユーザの一例は男性という個体特性43を有する。リスク認識部21は、男性という個体特性17bを関連付けられたサンプル脳状態データ(すなわち、海馬体積)17dを取得する。次に、リスク認識部21は、個体特性に基づいて認識したサンプル脳状態データ17dの年齢に応じた推移を参照して、リスクライン54を決定する。An example of a user has an
図3は、縦軸が海馬体積、横軸が年齢であり、個体特性17bにより抽出されたサンプル脳状態データ17dがプロットされている。図3における黒い丸、及び、白い丸は、一つ一つのサンプル脳状態データ17dを表し、白い丸は、飲酒量が多いグループに属するサンプル脳状態データ17dを表し、黒い丸はその他のサンプル脳状態データ17dを表す。図中、飲酒量が多いグループを含めた、抽出されたサンプル脳状態データ17dの海馬体積の平均を示す第1平均ライン66を実線で示し、飲酒量が多いグループのみのサンプル脳状態データ17dの海馬体積の平均を示す第2平均ライン67を破線で示している。このような統計処理は事前に行われていてもよく、リスク認識部21が行ってもよい。FIG. 3 shows the hippocampus volume on the vertical axis and the age on the horizontal axis, and the sample brain state data 17d extracted based on the
リスク認識部21は、第1平均ライン66よりも下方に位置に、点線で示すリスクライン54を生成する。具体的には、第1平均ライン66の各値x1より2σ(「σ」は年齢ごとの海馬体積(サンプル脳状態データ)の標準偏差を表わす。)低い値(x1-2σ)に基づくライン(下位2.3%を示すライン)を生成し、そのラインをリスクライン54として認識する。The
なお、本発明のリスクライン54の認識の方法は、このような方法に限定されるものではなく、ユーザ個体特性に対応する個体特性に関連付けられたサンプル脳状態データ17dに基づいて、そのサンプル脳状態データの年齢に応じた推移を参照して決定する方法であればよい。例えば、本実施形態と同様にユーザ個体特性が男性である場合には、男性という個体特性を関連付けられたサンプル脳状態データ17dの全てではなく、それらのサンプル脳状態データ17dのうちのユーザ生活特性45と対応する生活特性17cに関連付けられたサンプル脳状態データ17dの平均ラインに基づいて、リスクライン54を定めてもよい。具体的には、飲酒量が多いグループのみの傾向ラインである第2平均ライン67に基づいて、リスクライン54を定めてもよい。Note that the method of recognizing the
また、例えば、平均ラインの各値に対し(-2σ)の値に基づくラインではなく、平均ラインそのものをリスクライン54としてもよい。また、異なる値(例えば、平均ラインの各値に対し(-3σ)の値)を用いてリスクライン54を生成してもよい。また、このように統計化したデータに基づいてリスクライン54を生成せずに、単純にデータの順位等を参照してリスクライン54を生成してもよい。具体的には、例えば、ユーザ個体特性に対応する個体特性に関連付けられたサンプル脳状態データ17dのうち、所定の順位のデータ(例えば、下位3番以内のデータ)を基準として、リスクライン54を生成してもよい。For example, the average line itself may be used as the
次に、リスク認識・予測部20の予測部22は、経年推移ライン52に基づいて、ユーザの現在から将来において予測されるユーザ脳健康データの推移を示す経年予測ライン53を予測(算出)する。予測部22は、ユーザ個体特性43に対応する個体特性17b、ユーザ生活特性45に対応する生活特性17cおよび年齢に関連付けられたサンプル脳健康データ17aと経年推移ライン52とに基づいて経年予測ライン53を予測する機能を含む。Next, the
予測部22は、ユーザ生活特性45に基づいて、そのユーザ生活特性45に対応する生活特性17cに関連付けられたサンプル脳状態データ17d、本例においては、ユーザは飲酒量が多いという個体特性のサンプル脳状態データ(白い丸)17dの第2平均ライン67に基づいて経年予測ライン53を生成する。具体的には、予測部22は、ユーザ脳状態データ41の基準となる年齢(本実施形態では最も新しい時点における年齢である45歳)から、所定の年齢(本実施形態では50歳)までの第2平均ライン67の推移を参照し、経年推移ライン52の基準となる年齢を起点として、第2平均ライン67の推移と同様の推移を辿るラインを経年予測ライン53として生成する。The
なお、本実施形態においては、経年予測ライン53を認識するに際し、ユーザ生活特性45を参照している。これは、信頼性の高い経年予測ライン(ひいては、認知症リスクの傾向)を認識するためである。しかしながら、本発明の経年予測ラインの認識の方法は、このような方法に限定されるものではなく、経年推移ライン52に基づいて認識する方法であればよい。例えば、経年推移ライン52の傾きを認識し、その傾きを用いて、経年予測ライン53を生成し、認識してもよい。また、ユーザ生活特性45に対応する生活特性17cに関連付けられたサンプル脳状態データ17dに基づいて、そのサンプル脳状態データ17dの年齢に応じた推移を参照して決定する方法であればよい。例えば、1つだけの生活特性17cに係るサンプル脳状態データ17dだけではなく、2つ以上の生活特性17cに係るサンプル脳状態データ17dを参照してもよい。In the present embodiment, the
年齢zの不特定多数のサンプル対象者に関して、「サンプル脳状態データ」、「サンプル認知力データ」及び「ユーザ個人特性」の3つの因子のうち少なくとも1つの因子により構成される評価用因子xの回帰式が以下の式(1)で表わされ、年齢zの不特定多数のサンプル対象者のうち、所定の生活特性(例えば、飲酒習慣あり)を有するサンプル対象者に関して評価用因子xの回帰式が以下の式(2)で表わされている場合、次回時点t+1(tは5年、10年などの離散的時間を表わす。)における評価用因子xt+1は、今回時点tにおける評価用因子xtに基づき、以下の式(3)にしたがって予測される。
x=β0+β1z(β0、β1は回帰係数) ・・・(1)
x’=β0’+β1’z(β0’、β1’は回帰係数)・・・(2)
xt+1=xt+{IF生活特性を有するTHEN(xt+1’-xt’)ELSE(xt+1-xt)}
・・・(3)Regarding an unspecified number of sample subjects of age z, an evaluation factor x of at least one of three factors of “sample brain state data”, “sample cognition data” and “user personal characteristics” The regression equation is represented by the following equation (1), and among the unspecified number of sample subjects of age z, the regression of the evaluation factor x is performed on the sample subjects having a predetermined living characteristic (for example, having a drinking habit). When the equation is represented by the following equation (2), the evaluation factor xt + 1 at the next time point t + 1 (t represents a discrete time such as 5 years or 10 years) is calculated at the current time point t. based on the evaluation factors xt, it is predicted according to the following equation (3).
x = β0 + β1 z (β0 and β1 are regression coefficients) (1)
x ′ = β0 ′ + β1 ′ z (β0 ′ and β1 ′ are regression coefficients) (2)
x t + 1 = x t + {THEN with IF life characteristics(x t + 1 '-x t ') ELSE (x t + 1 -x t)}
... (3)
リスク提示部30のチャート表示を行う予測提示部31aは、レポート50の経年推移表示エリア51に、経年推移ライン52、経年予測ライン53およびリスクライン54を、比較可能に並列させて表示する。予測提示部31aは、サンプル脳状態データ17dを示すプロット、第1平均ライン66、第2平均ライン67を含めて表示してもよいが、ユーザ等が見やすくなるようにこれらを削除している。予測提示部31aは、リスクライン54の上側の基準範囲54aと、下側の要注意ゾーン54bとに異なる色を付してもよい。また、予測提示部31aは、グラフの横軸に、経年推移ライン52および経年予測ライン53の基準となる年齢(本実施形態では、41歳、45歳、50歳)をプロットする。The prediction presenting unit 31a that performs the chart display of the
本実施形態では、経年予測ライン53がリスクライン54の上側にあることは、以下の式(4)で示す評価用因子xの累積密度関数cdf(x|μ,σ)の未来時点t+1における値cdf(xt+1|μt+1,σt+1)が、2σより大きいことを意味する。
cdf(x|μ,σ)=(1/2){1+erf(x-μ)/(2σ2)1/2})
(erfは誤差関数)・・・(4)In the present embodiment, the fact that the aging
cdf (x | μ, σ) = (1/2) {1 + erf (x−μ) / (2σ2 )1/2 })
(Erf is an error function) (4)
予測部22は、経年予測ライン53を、確率の高い領域を示す推定幅53wで示してもよい。図4に示すように、第1平均ライン66および第2平均ライン67は誤差を含み、95%CI(Confidence Interval、信頼区間)をそれぞれライン66aおよび67aにより示している。予測部22が、各ユーザの経過最終時点tに対して、未来の時点t+1における同年齢の第2平均ライン67の推定幅で、経年予測ライン53の推定幅53wを求め、予測提示部31aが、その予測幅53wを経年推移表示エリア51に表示してもよい。The
図5に、推定幅53wを用いて経年予測ライン53を示した異なる例を示している。この例では、未来の時点t+1において、認知症リスクの推定幅53wがpre-MCI(軽度認知症(Mild Cognitive Impairment)の前段階)からMCIに至るリスクライン54を下回る可能性が示唆されており、AD(Alzheimer's Disease、アルツハイマー型認知症)に至る危険性が確率的にあり得ることを示している。FIG. 5 shows another example in which the aging
このように、提示システム10では、年齢に応じたラインである経年推移ライン52、経年予測ライン53およびリスクライン54と比較する形式で認知症リスクを提示している。これにより、ユーザ等は、ユーザの認知症リスクの大小だけでなく、ユーザの認知症リスクの傾向(悪化しているか、改善されているか、悪化が抑制されているか等)も同時に把握することができる。As described above, the
提示システム10の予測部22は、さらに、同一のユーザに対し、第1のユーザ生活特性45に基づく第1の経年予測ライン53と、第2のユーザ生活特性45に基づく第2の経年予測ライン53aとを認識する比較予想部22aを含む。ユーザ等によってユーザ生活特性45が変更された場合、その変更内容に応じて、認知症リスクに係る表示内容も変動する。このため、提示システム10は、ユーザ生活特性45を変えた結果をシミュレーションする比較予想部22aと、その結果を比較可能に並べて、または連続的に提示する比較提示部31bとを含む。The
図6にユーザ生活特性45を変更して経年予測ライン53が変化した2種類のレポート50を示している。図6(a)に示したレポート50では、生活特性表示エリア58における飲酒量の内容が「毎日」に設定されており、図6(b)に示したレポート50では、生活特性表示エリア58における飲酒量の内容が「週2~3回」に変更されている。この結果、図6(b)に示したレポート50では、経年推移表示エリア51に表示される経年予測ライン53aが、図6(a)のレポート50に示された経年予測ライン53より上側に、リスクライン54から離れた傾きを持ち、認知症のリスクが低減されることを示している。FIG. 6 shows two types of
比較予想部22aにおいては、ユーザ生活特性45の飲酒量の内容が「毎日」から「週2~3回」に変更されると、図3において抽出されたサンプル脳状態データ17dの中から、飲酒量が少ないサンプルを抽出して新たな平均ライン(第3平均ライン、不図示)を求め、その平均ラインに基づいて、経年予測ライン53と同様の処理により、新たな経年予測ライン53aを生成する。比較提示部31bは、以前の条件の第1の経年予測ライン53と、次の条件の第2の経年予測ライン53aとを別々のレポート50として提示してもよく、レポート50の内部で参照できるように並べて提示してもよい。比較提示部31bは、第1の経年予測ライン53と第2の経年予測ライン53aとを、比較可能に連続的に表示してもよい。具体的には、第1の経年予測ライン53を所定時間経過後に非表示にした後、ユーザ等が第1の経年予測ライン53の大まかな形状を把握している時間内に、第2の経年予測ライン53aを表示するようにしてもよい。In the
比較予想部22aおよび比較提示部31bは、2回に限らず、何度でも、ユーザ生活特性45の条件を変えて経年予測ライン53を求めて提示してもよい。この機能により、提示システム10を用いて、ユーザ等は、生活特性45の変動に応じた認知症リスクの変動を、直感的に把握することができる。これにより、ユーザ等は、具体的に改善すべき生活特性を把握することができるので、生活特性の改善に対するインセンティブを与えられることになる。The
この提示システム10のリスク認識・予想部20は、認知症リスクをスコアに換算するスコア算出部23を含み、リスク提示部30は、認知症リスクをスコアに基づいて提示するスコア提示部32を含む。スコア算出部23は、ユーザ脳状態データ41と、ユーザ認知力データ61と、ユーザ個体特性43と、ユーザ生活特性45とに基づいて認識されたサンプル脳状態データ17dおよびサンプル認知力データ17eとを比較して、その比較の結果に基づいて、スコア付け、及び、そのスコアに基づいたランク、脳年齢、及び、対応する記号の決定を行う。The risk recognition /
例えば、先に式(4)で示した、サンプル脳状態データ17d等の評価用因子xの累積密度関数cdf(x|μ,σ)の今回時点tにおける値cdf(xt|μt,σt)が、スコアSとして定義されてもよい。当該スコアSが複数の数値範囲(例えば、0.0<S≦0.25,0.25<S≦0.50,0.50<S≦0.75,0.75<S≦1.0の4つの数値範囲)のそれぞれのうちいずれの数値範囲に含まれるかに応じてランク55が決定されてもよい。また、スコア算出部23は、スコアSのさまざまな値、または複数の数値範囲のそれぞれと、複数の脳年齢のそれぞれとが対応付けられているテーブルが参照されることにより脳年齢56aを決定する機能23aを含んでいてもよい。For example, the value cdf (xt | μt , σ) of the cumulative density function cdf (x | μ, σ) of the evaluation factor x such as the sample brain state data 17d at the current time t, which was previously expressed by Expression (4).t ) may be defined as the score S. The score S has a plurality of numerical ranges (for example, 0.0 <S ≦ 0.25, 0.25 <S ≦ 0.50, 0.50 <S ≦ 0.75, 0.75 <S ≦ 1.0 The
また、スコア算出部23は、評価用因子xの累積密度関数cdf(x|μ,σ)の未来時点t+1における値cdf(xt+1|μt+1,σt+1)の、その今回時点tにおける値cdf(xt|μt,σt)に対する偏差に基づき、スコアに対応する記号56bを決定する機能23bを含んでいてもよい。当該偏差が正値である場合又は所定の正値以上である場合にはリスク低下の可能性があり、当該偏差が負値である場合又は所定の負値以下である場合にはリスク上昇の可能性がある、当該偏差が0である場合又はその大きさが所定の正値未満かつ所定の負値より大きい場合にはリスクに変化なしと判定される。そして、リスクの「低下可能性あり」、「上昇可能性あり」及び「変化なし」の別に応じて、スコアSに対応する記号56bが決定される。The
記号を決定する機能23bは、評価用因子xの、未来時点t+1における値cdf(xt+1|μt+1,σt+1)が、母集団の(-2σ、(下位2.3%を示す閾値))と等価である0.023以上であるか、それよりも小さいかということに基づき、スコアSに対応する長期予測の記号56bを決定する機能を含んでいてもよい。The
なお、スコアの算出方法としては、上述の累積密度関数を用いた方法のように、パラメトリックなモデル化を利用する方法に限定されるものではない。例えば、ノンパラメトリックな順位を利用した方法であってもよい。具体的には、平均ランク、メディアランク、近似等を用いた各種分位数の算出方法を用いてもよい。The method for calculating the score is not limited to a method using parametric modeling as in the above-described method using the cumulative density function. For example, a method using a non-parametric ranking may be used. Specifically, a method of calculating various quantiles using an average rank, a media rank, approximation, or the like may be used.
提示システム10のスコア提示部32は、タブレット2のタッチパネル2a、またはレポート50に、スコアに基づいて決定されたランク55、脳年齢56a、矢印56b、および、ランクに関する凡例56cを表示(出力)する。このように、提示システム10では、認知症リスクをスコアまたはスコアに応じた記号として提示している。これにより、ユーザ等は、ユーザの認知症リスクの大小を直感的に把握することができる。The
スコア算出部23は、現在の認知症リスクのスコアを算出して第1のスコア提示部32aを介して表示する機能に加えて、ユーザの将来、例えば、1年後の認知症リスクのスコアを算出する機能23cを含んでいてもよい。将来のスコアを算出する機能23cは、経年予測ライン53上の第1の年齢のユーザ脳健康データ18aと、ユーザ個体特性43に第1の年齢を加えた個体特性17bに対応する個体特性に関連付けられたサンプル脳健康データ17aとの比較の結果に基づいて、ユーザの将来の認知症リスクを示すスコアを求め、第2のスコア提示部32bにより、算出されたスコア、または、スコアに応じた記号を、経年予測ライン53とともに、または代わりに出力してもよい。The
将来のスコアを算出する機能23cは、経年予測ライン53上の第1の年齢のユーザ脳健康データ18aと、ユーザ個体特性43に第1の年齢を加えた個体特性に対応する個体特性17b、およびユーザ生活特性45に対応する生活特性17cに関連付けられたサンプル脳健康データ17aとの比較の結果に基づいて、ユーザの将来の認知症リスクを示すスコアを求め、第3のスコア提示部32cにより、算出されたスコア、または、スコアに応じた記号を、経年予測ライン53とともに、または代わりに出力してもよい。将来のスコアを算出する機能23cは、経年予測ライン53上のユーザ脳健康データ18aの代わりに、ユーザが指定した、あるいは、任意に選択したユーザ脳健康データ18aに基づいてスコアを計算する機能を含んでいてもよい。The
将来のスコアを算出する機能23cは、ユーザ生活特性45を変更してスコアがどのように変化するかを確認するシミュレーション機能23dを含んでいてもよい。この機能23dは、第1のユーザ生活特性45を反映した第1の経年予測ライン53上の第1の年齢のユーザ脳健康データ18aと、ユーザ個体特性43に第1の年齢を加えた個体特性に対応する個体特性17b、および第1のユーザ生活特性45に対応する生活特性17cに関連付けられたサンプル脳健康データ17aとの比較の結果に基づいて、ユーザの将来の認知症リスクを示す第1のスコアを算出する。さらに、この機能23dは、第2のユーザ生活特性45に基づく第2の経年予測ライン53a上の第1の年齢のユーザ脳健康データ18aと、ユーザ個体特性に第1の年齢を加えた個体特性43に対応する個体特性17b、および第2のユーザ生活特性45に対応する生活特性17cに関連付けられたサンプル脳健康データ17aとの比較の結果に基づいて、ユーザの将来の認知症リスクを示す第2のスコアを算出する。第4のスコア提示部32dは、第1および第2のスコア、またはそれらに応じた記号を経年予測ラインとともに、または代わりに出力してもよい。ユーザ等によってユーザ生活特性が変更された場合、その変更内容に応じて、認知症リスクに係る表示内容も変動する。The
図7(a)に示したレポート50においては、生活特性表示エリア58における飲酒量の内容が「毎日」であり、図7(b)に示したレポート50においては、飲酒量の内容が「週2~3回」に変更されている。これらのレポート50には、将来のある時点、例えば一年後の認知症リスクがスコアで表示されており、飲酒量の内容を「毎日」から「週2~3回」に変更することにより、経年予測ライン53が変わり、比較対象となるサンプル脳健康データ17aが「飲酒量が多いグループ」から「飲酒量が少ないグループ」に代わる。このケースでは、総合リスク判定55が「B」から「A」に代わり、脳年齢56aが若くなり、長期予測記号56bも平坦な方向に変わっている。In the
このように提示システム10においては、ユーザ生活特性45の変更に応じて、将来の認知症リスクをスコアまたはランクなどに出力できる。そのため、ユーザ等は、生活特性の変動に応じた認知症リスクの変動を、直感的に把握することができる。これにより、ユーザ等は、具体的に改善すべき生活特性を把握することができるので、生活特性の改善に対するインセンティブを与えられることになる。As described above, in the
図8に、認知症のリスクを示す異なるタイプのレポートの例を示している。このレポート50は、上記と同様に、提示システム10のリスク提示部30から出力される。レポート50は、スコア表示エリア57およびユーザ脳状態データ41の経年推移表示エリア51に加え、ユーザ認知力データ61の解析結果表示エリア75と、ユーザ認知力データ61の経年推移表示エリア71とを含む。スコア表示エリア57は、ランク55と、脳年齢56aに加えて、CQスコア(Cognitive Quotient Score)76の表示が含まれる。CQスコア76は、各認知機能テストを踏まえた総合的な個人の認知力・脳機能のスコアであり、平均を100、標準偏差を15に設定するとIQ(知能指数)およびその他の認知力テストのスコアリングと互換性があるスケールとなる。CQスコア(cq)76は以下の式(5)により求められる。
変数xiは、認知力テスト60の各ドメインの評価結果であり、このレポート50においては、短期記憶、作業記憶、実行機能、空間認知、計算の各機能のテスト結果である。認知力テスト60に含まれるテスト項目(ドメイン)はこれらに限定されず、順唱、逆唱、計算、ストループテスト、メンタルローテーションの組み合わせであってもよく、その他のテスト項目の組み合わせであってもよい。式(5)においては、各テスト項目(ドメイン)のスコアについて正規分布の標準化(z)を行った上で合算したものを総合スコア(cq、CQスコア)76とする。The variable xi is the evaluation result of each domain of the
このレポート50においては、式(4)で示した累積密度関数を用い、同年齢の累積密度関数cdf(cq|μ,σ)77を求め、算出されたCQスコア76が含まれる数値範囲によりランク55を求めている。例えば、平均が100、標準偏差が15の正規分布を仮定したときに、偏差値(standard score)が110を超えた「Above」の領域をランクA、偏差値が80-110の「AverageおよびLow Average」の領域をランクB、偏差値が70-79の「Low」の領域をランクC、偏差値が70未満の「Very Low」の領域をランクDに設定している。In this
なお、認知力テストはこれらに限定されず、図9および図10に列記する脳の健康状態(認知機能の状態並びに脳疾患及び精神疾患の有無及び程度を含む)を測定する検査またはテストその他の同様の形式の検査またはテストに従って、スコアを評価してもよい。Note that the cognitive test is not limited to these, and tests or tests for measuring the brain health status (including the status of cognitive function and the presence or absence and degree of brain disease and mental illness) listed in FIG. 9 and FIG. The score may be evaluated according to a similar type of test or test.
レポート50の解析結果表示エリア75には、認知力テスト60の各項目(短期記憶、作業記憶、実行機能、空間認知、計算)の結果と、同年齢の標準とを示すレーダーチャート78を含む。ユーザ認知力データ61の経年推移表示エリア71には、ユーザ認知力データ61の各項目(短期記憶、作業記憶、実行機能、空間認知、計算)の経年推移ライン72a~72eと、リスクラインとして同年齢層の標準ライン74a~74eとを示す。The analysis
レポート50の経年推移表示エリア51には、ユーザ脳状態データ41の経年推移ライン52と、リスクライン54に加え、ユーザ個体特性43に基づいて同年齢層の平均推移ライン65が示されている。これらの表示より、ユーザはレポート50を見ることにより、認知症のリスクと、脳の健康状態の経過とを明確に把握できる。The aging
図11に、上述した提示システム10における処理の概要を、フローチャートを用いて示している。ステップ101において、第1の認識部11により、ユーザの脳の状態に係るデータであるユーザ脳状態データ41および脳の機能である認知力に係るデータであるユーザ認知力データ61の少なくともいずれかを含むユーザ脳健康データ18aを認識(取得)する。ステップ102において、第2の認識部(個体特性入力部)12により、ユーザの個体特性であるユーザ個体特性43を認識(取得)する。ステップ103において、提示システム10は、予測処理が要求されているかを判断し、予測処理が要求されていなければ、ステップ104において、リスク提示部30は、過去および現在のユーザ脳健康データ18aに基づいて、ユーザの過去から現在におけるユーザ脳健康データ18aの推移を示す経年推移ライン52と、ユーザ個体特性43に対応する個体特性17bに関連付けられたサンプル脳健康データ17aに基づいて、サンプル脳健康データの年齢に応じた推移を参照して決定された認知症に関するリスクライン54とによりリスクを提示する。FIG. 11 is a flowchart showing an outline of the processing in the
ステップ105において、リスク提示部30は、さらに、ユーザ脳健康データ18aと、ユーザ個体特性43に対応する個体特性17bに関連付けられたサンプル脳健康データ17aとの比較の結果に基づいて、ユーザの認知症リスクを示すスコア55、または、スコアに応じた記号を提示する。さらに、ステップ106において、リスク提示部30は、これらの情報を含むレポート50を作成してユーザに提供する。この段階のレポート50は、経年予測ラインを含まないレポートとなる。In step 105, the
ステップ103において、予測処理が要求されると、ステップ107において、提示システム10は、さらに、ユーザ生活特性の入力の有無を判断する。ユーザ生活特性45の入力があれば、ステップ108において、第3の認識部(生活特性入力部)13により、ユーザの生活特性であるユーザ生活特性45を認識(取得)する。ステップ109において、リスク認識・予測部20の予測部22が、ユーザ個体特性43に対応する個体特性17b、ユーザ生活特性45に対応する生活特性17cおよび年齢に関連付けられたサンプル脳健康データ17aと経年推移ライン52とに基づいて、経年予測ライン53を予測(算出)する。ステップ108において、ユーザ生活特性45が入力されていない場合は、ステップ109において、予測部22は、個体特性17bに関連付けられたサンプル脳健康データ17aと経年推移ライン52とに基づいて、経年予測ライン53を生成する。(4) When a prediction process is requested in
ステップ110において、リスク提示部30は、経年推移ライン52およびリスクライン54に加え、経年予測ライン53を提示する。ステップ111において、スコア算出部23は、経年予測ライン53上の第1の年齢のユーザ脳健康データ18aと、ユーザ個体特性43に第1の年齢を加えた個体特性に対応する個体特性17b、およびユーザ生活特性45に対応する生活特性17cに関連付けられたサンプル脳健康データ17aとの比較の結果に基づいて、ユーザの将来の認知症リスクを示すスコア55を算出し、リスク提示部30は、スコア55または、スコアに応じた記号を、経年予測ライン53とともに、または代わりに提示する。ステップ108において、ユーザ生活特性45が入力されていない場合は、ステップ110において、スコア算出部23は、個体特性17bに関連付けられたサンプル脳健康データ17aに基づきスコア55を算出する。In
ステップ112において、提示システム10は、異なる(次の)ユーザ生活特性45が提供されているか否かを判断する。異なるユーザ生活特性45が提供されている場合は、ステップ108に戻って、異なる生活特性(第2のユーザ生活特性)45を取得し、上記と同様の処理を行う。ステップ109においては、第2のユーザ生活特性45に関わる第2の経年予測ライン53aを予測し、ステップ110においては、前回の生活特性(第1のユーザ生活特性)45に関わる第1の経年予測ライン53と、第2のユーザ生活特性45に関わる第2の経年予測ライン53aとを比較可能に並べて、または連続的に提示する。ステップ111においては、第2のユーザ生活特性45に関わる第2の経年予測ライン53a上の第2のスコア55を算出し、第1のユーザ生活特性45に関わる第1の経年予測ライン53上の第1のスコア55と比較可能な状態で、経年予測ライン53および53aとともに、あるいはそれらに代わり提示する。In
ステップ112において、次のユーザ生活特性の入力がなければ、ステップ113において、複数の予測が実行されているか否かを判断し、複数の予測が実行されていなければ、ステップ114において、リスク提示部30は、経年推移ライン52、経年予測ライン53、リスクライン54およびスコア55などを含むレポート50を作成してユーザに提供する。複数の経年予測ライン53が生成されていれば、ステップ115において、リスク提示部30は、シミュレーションされた複数の経年予測ライン53および複数のスコア55などを含むレポート50を作成してユーザに提供する。If there is no input of the next user's life characteristic in
なお、本実施形態においては、認知症リスクに関するスコア付けを行うに際し、ユーザ生活特性を参照して、脳状態データ及び認知力データを用いている。これは、信頼性のスコア(ひいては、認知症リスク)を認識するためである。しかしながら、本発明のスコア付けの方法は、このような方法に限定されるものではなく、ユーザ脳状態データとユーザ個体特性に対応する個体特性に関連付けられたサンプル脳状態データとの比較の結果に基づいて、スコア付けが行われていればよい。例えば、生活特性を参照しなくてもよいし、認知力データを用いず、脳状態データだけを用いてもよい。In the present embodiment, the brain condition data and the cognitive ability data are used with reference to the user's life characteristics when scoring the dementia risk. This is to recognize the reliability score (and, consequently, the risk of dementia). However, the scoring method of the present invention is not limited to such a method, and the result of the comparison between the user brain state data and the sample brain state data associated with the individual characteristics corresponding to the user individual characteristics is obtained. It is sufficient that scoring is performed based on the score. For example, it is not necessary to refer to life characteristics, and it is possible to use only brain state data without using cognitive data.
また、図2に示すレポート50のように、スコア表示エリア57とともに、経年推移表示エリア51を設け、その経年推移表示エリア51に脳状態データに基づく認知症リスクを表示する場合等には、スコア表示エリア57に表示するスコア55等を、認知力データのみを参照して求めるようにしてもよい。In addition, as in the
以上説明したように、提示システム10では、リスク判定の対象となるユーザの脳状態に係るデータ(ユーザ脳状態データ)と、サンプル対象者の脳状態に係るデータ(サンプル脳状態データ)とを含む脳健康データを比較して、認知症リスクを認識している。脳状態に係るデータは、認知力に影響を及ぼす脳の状態に基づく定量的なパラメータという直接的なデータである。すなわち、この認知症リスク提示システム10では、従来のシステムのようにユーザの脳波、動作等から推測された脳の機能という間接的なデータではなく、脳状態に係るデータという直接的なデータを用いることができる。As described above, the
これにより、この提示システム10では、認知症リスクの認識において、脳の機能に関する推測精度の影響を受けることが少ない。その結果、この提示システム10によれば、従来のシステムに比べ、認知症リスクを精度よく認識することができる。Accordingly, in the
また、この提示システム10では、認識した認知症リスクを、ユーザ脳状態データとサンプル脳状態データとの比較の結果という形で、ユーザ等に提示することができる。これにより、この提示システム10によれば、ユーザ等は、十分な知識を有していない場合であっても、直感的に認知症リスクの大小を把握することができる。また、提示システム10は、年齢に応じたラインである経年推移ラインとリスクラインと比較する形式で認知症リスクを提示することができる。このため、ユーザ等は、ユーザの認知症リスクの大小だけでなく、ユーザの認知症リスクの傾向(悪化しているか、改善されているか、悪化が抑制されているか等)も同時に把握することができるようになる。また、現在から未来の認知症リスクの推移の予測である経年予測ラインをリスクラインと比較可能に提示することができ、ユーザ等は、ユーザの認知症リスクの傾向をさらに的確に把握することができる。In addition, the
また、提示システム10は、経年予測ラインを認識するに際し、1または複数のユーザ生活特性を参照することができ、信頼性の高い経年予測ライン(ひいては、認知症リスクの傾向)を認識するとともに、ユーザ等は、ユーザの認知症リスクの傾向をさらに的確に把握することができる。さらに、複数のユーザ生活特性に関する経年予測ラインを比較できる形で提示することにより、ユーザ等は、生活特性の変動に応じた経年予測ライン(ひいては、認知症リスク)の変動を、直感的に把握することができる。これにより、ユーザ等は、具体的に改善すべき生活特性を把握することができるので、生活特性の改善に対するインセンティブを与えられることになる。In addition, the
さらに、提示システム10は、認知症リスクをスコア等として提示することができる。ユーザ等は、スコア等を認識するに際し、ユーザ生活特性を参照すると、信頼性の高いスコア等(ひいては、認知症リスク)を認識することができる。これにより、ユーザ等は、ユーザの認知症リスクの傾向をさらに的確に把握することができる。また、ユーザ等は、具体的に改善すべき生活特性を把握することができるので、生活特性の改善に対するインセンティブを与えられることになる。Furthermore, the
上記には、ユーザの認知症リスクを提示する認知症リスク提示システムであって、サンプル対象者の脳の状態に係るデータであるサンプル脳状態データが、前記サンプル対象者の年齢、性別及び身体情報の少なくとも1つを含む個体特性に関連付けて格納されているデータ格納部と、前記ユーザの脳の状態に係るデータであるユーザ脳状態データを認識するユーザ脳状態認識部と、前記ユーザの個体特性であるユーザ個体特性を認識するユーザ個体特性認識部と、前記ユーザ脳状態データと前記ユーザ個体特性に対応する前記個体特性に関連付けられた前記サンプル脳状態データとの比較を行うリスク認識部と、前記リスク認識部による比較の結果を提示するリスク提示部とを備えていることを特徴とする認知症リスク提示システムが開示されている。前記サンプル脳状態データ及び前記ユーザ脳状態データは、脳の全体の容量、又は、脳の少なくとも1つの所定領域の容量を示すデータであり、前記リスク認識部は、過去の前記ユーザ脳状態データ及び現在の前記ユーザ脳状態データに基づいて、前記ユーザの過去から現在における前記ユーザ脳状態データの推移を示す経年推移ラインを認識し、前記ユーザ個体特性に対応する前記個体特性に関連付けられた前記サンプル脳状態データに基づいて、該サンプル脳状態データの年齢に応じた推移を参照して決定されたリスクラインを認識し、前記リスク提示部は、前記経年推移ラインと前記リスクラインとを、比較可能に並列させて提示してもよい。The above is a dementia risk presentation system that presents a dementia risk of the user, wherein the sample brain state data that is data relating to the state of the brain of the sample subject is the age, gender, and physical information of the sample subject. A data storage unit stored in association with an individual characteristic including at least one of the following: a user brain state recognition unit that recognizes user brain state data that is data relating to the state of the brain of the user; and an individual characteristic of the user. A user individual characteristic recognition unit that recognizes a user individual characteristic that is a risk recognition unit that performs a comparison between the user brain state data and the sample brain state data associated with the individual characteristic corresponding to the user individual characteristic. A risk presenting unit for presenting a result of the comparison by the risk recognizing unit. It has been. The sample brain state data and the user brain state data are the entire capacity of the brain, or data indicating the capacity of at least one predetermined region of the brain, and the risk recognition unit is configured to execute the past user brain state data and Based on the current user brain state data, recognizes an aging line indicating the transition of the user brain state data from the past to the present of the user, and the sample associated with the individual characteristic corresponding to the user individual characteristic. Based on the brain state data, recognize the risk line determined by referring to the transition according to the age of the sample brain state data, the risk presenting unit, the aging line and the risk line can be compared May be presented in parallel.
前記リスク認識部は、前記経年推移ライン及び前記リスクラインを認識するとともに、前記経年推移ラインに基づいて、前記ユーザの現在から将来において予測される前記ユーザ脳状態データの推移を示す経年予測ラインを認識し、前記リスク提示部は、前記経年推移ライン及び前記経年予測ラインと前記リスクラインとを、比較可能に並列させて提示してもよい。システムは、前記ユーザの生活習慣及び生活環境の少なくとも1つを含む生活特性であるユーザ生活特性を認識するユーザ生活特性認識部を備え、前記データ格納部は、前記サンプル脳状態データを、前記個体特性、並びに、前記サンプル対象者の前記生活特性に関連付けて格納され、前記リスク認識部は、前記ユーザ生活特性に対応する前記生活特性に関連付けられた前記サンプル脳状態データに基づいて、該サンプル脳状態データの年齢に応じた推移を示す傾向ラインを認識し、前記傾向ラインと前記経年推移ラインとに基づいて、前記経年予測ラインを認識してもよい。前記リスク認識部は、前記ユーザ生活特性が変更された場合に、変更後の前記ユーザ生活特性に基づいて、前記経年予測ラインを再度認識し、前記リスク提示部は、変更前の前記ユーザ生活特性に基づいて認識された前記経年予測ラインと、変更後の前記ユーザ生活特性に基づいて認識された前記経年予測ラインとを、比較可能に並列させて、又は、比較可能に連続的に提示してもよい。The risk recognition unit, while recognizing the aging line and the risk line, based on the aging line, the aging prediction line indicating the transition of the user brain state data predicted from the present of the user in the future in the future Recognizing, the risk presentation unit may present the aging line and the aging prediction line in parallel with the risk line in a comparable manner. The system includes a user life characteristic recognition unit that recognizes a user life characteristic that is a life characteristic including at least one of the user's lifestyle and living environment, and the data storage unit stores the sample brain state data in the individual. Characteristics, and the risk recognition unit is stored in association with the life characteristics of the sample subject, and based on the sample brain state data associated with the life characteristics corresponding to the user life characteristics. A trend line indicating a transition according to the age of the state data may be recognized, and the aging prediction line may be recognized based on the trend line and the aging transition line. The risk recognizing unit, when the user life characteristic is changed, recognizes the aging prediction line again based on the changed user life characteristic, and the risk presenting unit recognizes the user life characteristic before the change. The aging prediction line recognized based on the aging prediction line and the aging prediction line recognized based on the user's life characteristics after the change are arranged in parallel in a comparable manner, or continuously presented in a comparable manner. Is also good.
前記リスク認識部は、前記ユーザ脳状態データと、前記ユーザ個体特性に対応する前記個体特性に関連付けられた前記サンプル脳状態データとの比較の結果に基づいて、前記ユーザの前記認知症リスクをスコアとして認識し、前記リスク提示部は、前記スコア、又は、前記スコアに応じた記号を提示してもよい。システムは、前記ユーザの生活特性であるユーザ生活特性を認識するユーザ生活特性認識部を備え、前記データ格納部は、前記サンプル脳状態データを、前記個体特性、並びに、前記サンプル対象者の生活習慣及び生活環境の少なくとも1つを含む生活特性に関連付けて格納され、前記リスク認識部は、前記ユーザ脳状態データと、前記ユーザ個体特性に対応する前記個体特性に関連付けられた前記サンプル脳状態データ、及び、前記ユーザ生活特性に対応する前記生活特性に関連付けられた前記サンプル脳状態データとの比較の結果に基づいて、前記ユーザの前記認知症リスクをスコアとして認識してもよい。The risk recognition unit scores the dementia risk of the user based on a result of a comparison between the user brain state data and the sample brain state data associated with the individual characteristic corresponding to the user individual characteristic. And the risk presenting unit may present the score or a symbol corresponding to the score. The system includes a user life characteristic recognition unit that recognizes a user life characteristic that is a life characteristic of the user, and the data storage unit stores the sample brain state data, the individual characteristics, and a lifestyle of the sample target person. And stored in association with a living characteristic including at least one of the living environment, the risk recognition unit, the user brain state data, the sample brain state data associated with the individual characteristics corresponding to the user individual characteristics, And the risk of the dementia of the user may be recognized as a score based on a result of comparison with the sample brain state data associated with the life characteristic corresponding to the user life characteristic.
システムは、前記ユーザの生活特性であるユーザ生活特性を認識するユーザ生活特性認識部を備え、前記データ格納部は、前記サンプル脳状態データを、前記個体特性、並びに、前記サンプル対象者の生活習慣及び生活環境の少なくとも1つを含む生活特性に関連付けて格納され、前記リスク認識部は、前記ユーザ生活特性が変更された場合に、変更後の前記ユーザ生活特性に基づいて、前記スコアを再度認識し、前記リスク提示部は、変更前の前記ユーザ生活特性に基づいて認識された前記スコア又は前記スコアに応じた記号と、変更後の前記ユーザ生活特性に基づいて認識された前記スコア又は前記スコアに応じた記号とを、比較可能に並列させて、又は、比較可能に連続的に提示してもよい。The system includes a user life characteristic recognition unit that recognizes a user life characteristic that is a life characteristic of the user, and the data storage unit stores the sample brain state data, the individual characteristics, and a lifestyle of the sample target person. And the risk recognition unit stores the score again based on the changed user life characteristic when the user life characteristic is changed when the user life characteristic is changed. Then, the risk presenting unit, the score or a symbol corresponding to the score recognized based on the user life characteristics before the change, and the score or the score recognized based on the user life characteristics after the change May be presented in parallel in a comparable manner or continuously in a comparable manner.
上記には、また、ユーザの認知症リスクを提示する認知症リスク提示方法であって、データ格納部が、サンプル対象者の脳の状態に係るデータであるサンプル脳状態データが、前記サンプル対象者の年齢、性別及び身体情報の少なくとも1つを含む個体特性に関連付けて格納されているステップと、ユーザ脳状態認識部が、前記ユーザの脳の状態に係るデータであるユーザ脳状態データを認識するステップと、ユーザ個体特性認識部が、前記ユーザの個体特性であるユーザ個体特性を認識するステップと、リスク認識部が、前記ユーザ脳状態データと前記ユーザ個体特性に対応する前記個体特性に関連付けられた前記サンプル脳状態データとの比較を行うステップと、リスク提示部が、前記リスク認識部による比較の結果を提示するステップとを備えていることを特徴とする認知症リスク提示方法が開示されている。In the above, there is also provided a dementia risk presentation method for presenting a dementia risk of a user, wherein the data storage unit is sample brain state data that is data relating to the state of the brain of the sample subject, And a step stored in association with individual characteristics including at least one of age, gender, and physical information of the user, and the user brain state recognition unit recognizes user brain state data that is data relating to the state of the brain of the user. And a step in which the user individual characteristic recognizing unit recognizes a user individual characteristic that is the individual characteristic of the user; and a risk recognizing unit associated with the user brain state data and the individual characteristic corresponding to the user individual characteristic. Performing a comparison with the sample brain state data, and a step of presenting a result of the comparison by the risk recognizing unit. Dementia risk presentation method characterized in that it includes the door is disclosed.
以上、図示の実施形態について説明したが、本発明はこのような形態に限られるものではない。例えば、上記実施形態の提示システムでは、脳状態に係るデータとして、海馬の容量(海馬体積)の値を用いる。また、認知症リスクの判断に際しては、ユーザ個体特性に加え、ユーザ生活特性を参照している。しかしながら、本発明の認知症リスク提示システムは、そのような構成に限定されるものではなく、個体特性に基づいて脳状態データの比較を行って、認知症リスクを判断するものであればよい。例えば、海馬の容量に代わり、脳全体又は他の領域に係る値を用いてもよいし、生活特性を参照しなくてもよい。また、その他の当業者が想到可能な変更については、特許請求の範囲に示された範囲にしたがって、本発明の範囲に含まれるものである。Although the illustrated embodiment has been described above, the present invention is not limited to such an embodiment. For example, in the presentation system of the above embodiment, the value of the capacity of the hippocampus (hippocampus volume) is used as the data relating to the brain state. In determining the risk of dementia, a user's life characteristics are referenced in addition to the user's individual characteristics. However, the dementia risk presentation system of the present invention is not limited to such a configuration, and may be any system that compares brain state data based on individual characteristics to determine dementia risk. For example, instead of the capacity of the hippocampus, a value related to the whole brain or another region may be used, or the life characteristics may not be referred to. Further, other changes that can be conceived by those skilled in the art are included in the scope of the present invention in accordance with the scope set forth in the claims.
Claims (18)
Translated fromJapaneseユーザの脳の状態に係るデータであるユーザ脳状態データおよび脳の機能である認知力に係るデータであるユーザ認知力データの少なくともいずれかを含むユーザ脳健康データを認識する第1の認識部と、
前記ユーザの個体特性であるユーザ個体特性を認識する第2の認識部と、
過去および現在の前記ユーザ脳健康データに基づいて、前記ユーザの過去から現在における前記ユーザ脳健康データの推移を示す経年推移ラインと、前記ユーザ個体特性に対応する前記個体特性に関連付けられた前記サンプル脳健康データに基づいて、該サンプル脳健康データの年齢に応じた推移を参照して決定された認知症に関するリスクラインとを提示するリスク提示部とを有するシステム。Sample brain health data including at least one of sample brain state data that is data relating to the state of the brain of the sample subject and sample cognition data that is data relating to cognition that is a function of the brain, A first database associated with individual characteristics including at least one of age, gender and physical information;
A first recognition unit that recognizes user brain health data including at least one of user brain state data that is data relating to the state of the brain of the user and user cognitive data that is data relating to cognition that is a function of the brain; ,
A second recognition unit that recognizes a user individual characteristic that is the individual characteristic of the user;
Based on the past and present user brain health data, an aging line indicating a transition of the user brain health data from the past to the present of the user, and the sample associated with the individual characteristic corresponding to the user individual characteristic A risk presenting unit for presenting, based on the brain health data, a risk line related to dementia determined by referring to a transition according to the age of the sample brain health data.
前記リスク提示部は、前記ユーザ脳健康データと、前記ユーザ個体特性に対応する前記個体特性に関連付けられた前記サンプル脳健康データとの比較の結果に基づいて、前記ユーザの認知症リスクを示すスコア、または、前記スコアに応じた記号を提示する第1のスコア提示部を含む、システム。In claim 1,
The risk presenting unit, based on a result of comparison between the user brain health data and the sample brain health data associated with the individual characteristics corresponding to the user individual characteristics, a score indicating the dementia risk of the user. Or a first score presenting unit for presenting a symbol corresponding to the score.
前記経年推移ラインに基づいて、前記ユーザの現在から将来において予測される前記ユーザ脳健康データの推移を示す経年予測ラインを予測する予測部を有し、
前記リスク提示部は、前記経年推移ラインおよび前記リスクラインに加え、前記経年予測ラインを提示する予測提示部を含む、システム。In claim 1 or 2, further,
Based on the aging line, having a prediction unit for predicting the aging prediction line indicating the transition of the user brain health data predicted from the present of the user in the future,
The system wherein the risk presenting unit includes a prediction presenting unit that presents the aging prediction line in addition to the aging transition line and the risk line.
前記リスク提示部は、前記経年予測ライン上の第1の年齢の前記ユーザ脳健康データと、前記ユーザ個体特性に前記第1の年齢を加えた個体特性に対応する前記個体特性に関連付けられた前記サンプル脳健康データとの比較の結果に基づいて、前記ユーザの将来の認知症リスクを示すスコア、または、前記スコアに応じた記号を、前記経年予測ラインとともに、または代わりに提示する第2のスコア提示部を含む、システム。In claim 3,
The risk presenting unit, the user brain health data of the first age on the aging prediction line, and the individual characteristics corresponding to the individual characteristics obtained by adding the first age to the user individual characteristics, A second score for presenting a score indicating the future risk of dementia of the user, or a symbol corresponding to the score, together with or instead of the aging prediction line, based on a result of the comparison with the sample brain health data. A system including a presentation unit.
前記第1のデータベースでは、前記サンプル脳健康データが、前記個体特性、並びに、前記サンプル対象者の生活習慣および生活環境の少なくとも1つを含む生活特性に関連付けられており、
前記ユーザの生活特性であるユーザ生活特性を認識する第3の認識部を、さらに有し、
前記予測部は、前記ユーザ個体特性に対応する前記個体特性、前記ユーザ生活特性に対応する前記生活特性および年齢に関連付けられた前記サンプル脳健康データと前記経年推移ラインとに基づいて、前記経年予測ラインを予測する、システム。In claim 3 or 4,
In the first database, the sample brain health data is associated with the individual characteristic and a life characteristic including at least one of a lifestyle and a living environment of the sample subject;
A third recognition unit that recognizes a user life characteristic that is a life characteristic of the user,
The prediction unit is configured to perform the aging prediction based on the individual characteristics corresponding to the user individual characteristics, the sample brain health data associated with the life characteristics and the age corresponding to the user life characteristics, and the aging transition line. A system that predicts lines.
前記リスク提示部は、前記経年予測ライン上の第1の年齢の前記ユーザ脳健康データと、前記ユーザ個体特性に前記第1の年齢を加えた個体特性に対応する前記個体特性、および前記ユーザ生活特性に対応する前記生活特性に関連付けられた前記サンプル脳健康データとの比較の結果に基づいて、前記ユーザの将来の認知症リスクを示すスコア、または、前記スコアに応じた記号を、前記経年予測ラインとともに、または代わりに提示する第3のスコア提示部を含む、システム。In claim 5,
The risk presenting unit may include the user brain health data of a first age on the aging prediction line, the individual characteristics corresponding to the individual characteristics obtained by adding the first age to the user individual characteristics, and the user life A score indicating the risk of future dementia of the user, or a symbol corresponding to the score, based on the result of comparison with the sample brain health data associated with the life characteristic corresponding to the characteristic, the aging prediction A system comprising a third score presenter for presenting with or instead of a line.
前記予測部は、同一のユーザに対し、第1の前記ユーザ生活特性に基づく第1の前記経年予測ラインと、第2の前記ユーザ生活特性に基づく第2の前記経年予測ラインとを認識する比較予想部を含み、
前記リスク提示部は、前記第1の経年予測ラインと前記第2の経年予測ラインとを比較可能に並べて、または連続的に提示する比較提示部を含む、システム。In claim 5 or 6,
A comparison unit that recognizes, for the same user, a first aging prediction line based on a first user life characteristic and a second aging prediction line based on a second user life characteristic; Including the expected part,
The system, wherein the risk presentation unit includes a comparison presentation unit that presents the first aging prediction line and the second aging prediction line side by side or continuously so that they can be compared.
前記リスク提示部は、前記第1の経年予測ライン上の第1の年齢の前記ユーザ脳健康データと、前記ユーザ個体特性に前記第1の年齢を加えた個体特性に対応する前記個体特性、および前記第1のユーザ生活特性に対応する前記生活特性に関連付けられた前記サンプル脳健康データとの比較の結果に基づいて、前記ユーザの将来の認知症リスクを示す第1のスコア、または、前記第1のスコアに応じた記号と、
前記第2の経年予測ライン上の第1の年齢の前記ユーザ脳健康データと、前記ユーザ個体特性に前記第1の年齢を加えた個体特性に対応する前記個体特性、および前記第2のユーザ生活特性に対応する前記生活特性に関連付けられた前記サンプル脳健康データとの比較の結果に基づいて、前記ユーザの将来の認知症リスクを示す第2のスコア、または、前記第2のスコアに応じた記号とを前記第1の経年予測ラインと前記第2の経年予測ラインとともに、または代わりに提示する第4のスコア提示部を含む、システム。In claim 7,
The risk presenting unit, the user brain health data of a first age on the first aging prediction line, the individual characteristics corresponding to the individual characteristics obtained by adding the first age to the user individual characteristics, and A first score indicating a future dementia risk of the user, based on a result of a comparison with the sample brain health data associated with the life characteristic corresponding to the first user life characteristic, or A symbol corresponding to a score of 1;
The user brain health data of a first age on the second aging prediction line, the individual characteristics corresponding to the individual characteristics obtained by adding the first age to the user individual characteristics, and the second user life A second score indicating the future risk of dementia of the user based on a result of a comparison with the sample brain health data associated with the life characteristic corresponding to the characteristic, or according to the second score. A system comprising: a fourth score presentation unit that presents a symbol together with or instead of the first aging line and the second aging line.
前記サンプル脳状態データおよび前記ユーザ脳状態データは、脳の全体の容量、脳の少なくとも1つの所定領域の容量、脳画像、脳波、脳血流の少なくともいずれかを示すデータを含む、システム。In any one of claims 1 to 8,
The system, wherein the sample brain condition data and the user brain condition data include data indicating at least one of a total brain volume, a volume of at least one predetermined region of the brain, a brain image, an electroencephalogram, and a cerebral blood flow.
ユーザの脳の状態に係るデータであるユーザ脳状態データおよび脳の機能である認知力に係るデータであるユーザ認知力データの少なくともいずれかを含むユーザ脳健康データを認識することと、
前記ユーザの個体特性であるユーザ個体特性を認識することと、
過去および現在の前記ユーザ脳健康データに基づいて、前記ユーザの過去から現在における前記ユーザ脳健康データの推移を示す経年推移ラインと、前記ユーザ個体特性に対応する前記個体特性に関連付けられた前記サンプル脳健康データに基づいて、該サンプル脳健康データの年齢に応じた推移を参照して決定された認知症に関するリスクラインとによりリスクを提示することとを有する方法。Sample brain health data including at least one of sample brain state data that is data relating to the state of the brain of the sample subject and sample cognition data that is data relating to cognition that is a function of the brain, A method of presenting a risk of dementia using a system capable of referring to a first database associated with individual characteristics including at least one of age, gender, and physical information,
Recognizing user brain health data including at least one of user brain condition data that is data related to the state of the user's brain and user cognitive data that is data related to cognitive ability that is a function of the brain,
Recognizing a user individual characteristic that is the individual characteristic of the user;
Based on the past and present user brain health data, an aging line indicating a transition of the user brain health data from the past to the present of the user, and the sample associated with the individual characteristic corresponding to the user individual characteristic Presenting a risk with a risk line for dementia determined based on brain health data with reference to a transition according to the age of the sample brain health data.
前記ユーザ脳健康データと、前記ユーザ個体特性に対応する前記個体特性に関連付けられた前記サンプル脳健康データとの比較の結果に基づいて、前記ユーザの認知症リスクを示すスコア、または、前記スコアに応じた記号を提示することを有する、方法。In claim 10, further comprising:
The score indicating the dementia risk of the user, or the score, based on a result of comparison between the user brain health data and the sample brain health data associated with the individual characteristic corresponding to the user individual characteristic. A method comprising presenting a responsive symbol.
前記経年推移ラインに基づいて、前記ユーザの現在から将来において予測される前記ユーザ脳健康データの推移を示す経年予測ラインを予測することを有し、
前記リスクを提示することは、前記経年推移ラインおよび前記リスクラインに加え、前記経年予測ラインを提示することを含む、方法。In claim 10 or 11, further comprising:
Based on the aging line, predicting an aging prediction line indicating the transition of the user brain health data predicted from the current time of the user in the future,
Presenting the risk includes presenting the aging prediction line in addition to the aging line and the risk line.
前記経年予測ライン上の第1の年齢の前記ユーザ脳健康データと、前記ユーザ個体特性に前記第1の年齢を加えた個体特性に対応する前記個体特性に関連付けられた前記サンプル脳健康データとの比較の結果に基づいて、前記ユーザの将来の認知症リスクを示すスコア、または、前記スコアに応じた記号を、前記経年予測ラインとともに、または代わりに提示することを有する、方法。In claim 12, further,
The user brain health data of the first age on the aging prediction line and the sample brain health data associated with the individual characteristic corresponding to the individual characteristic obtained by adding the first age to the user individual characteristic. A method comprising: presenting, along with or instead of the aging prediction line, a score indicating the user's future dementia risk, or a symbol responsive to the score, based on the result of the comparison.
前記第1のデータベースでは、前記サンプル脳健康データが、前記個体特性、並びに、前記サンプル対象者の生活習慣および生活環境の少なくとも1つを含む生活特性に関連付けられており、
当該方法は、さらに、前記ユーザの生活特性であるユーザ生活特性を認識することを有し、
前記予測することは、前記ユーザ個体特性に対応する前記個体特性、前記ユーザ生活特性に対応する前記生活特性および年齢に関連付けられた前記サンプル脳健康データと前記経年推移ラインとに基づいて、前記経年予測ラインを予測することを含む、方法。In claim 12 or 13,
In the first database, the sample brain health data is associated with the individual characteristic and a life characteristic including at least one of a lifestyle and a living environment of the sample subject;
The method further comprises recognizing a user life characteristic that is the user's life characteristic,
The predicting is performed based on the individual characteristics corresponding to the user individual characteristics, the sample brain health data associated with the life characteristics and the age corresponding to the user life characteristics, and the aging line. A method comprising predicting a prediction line.
前記経年予測ライン上の第1の年齢の前記ユーザ脳健康データと、前記ユーザ個体特性に前記第1の年齢を加えた個体特性に対応する前記個体特性、および前記ユーザ生活特性に対応する前記生活特性に関連付けられた前記サンプル脳健康データとの比較の結果に基づいて、前記ユーザの将来の認知症リスクを示すスコア、または、前記スコアに応じた記号を、前記経年予測ラインとともに、または代わりに提示することを有する、方法。In claim 14, further comprising:
The user brain health data of a first age on the aging prediction line, the individual characteristics corresponding to the individual characteristics obtained by adding the first age to the user individual characteristics, and the life corresponding to the user life characteristics Based on the result of the comparison with the sample brain health data associated with a characteristic, a score indicating the future dementia risk of the user, or a symbol corresponding to the score, together with or instead of the aging prediction line. A method, comprising presenting.
前記予測することは、同一のユーザに対し、第1の前記ユーザ生活特性に基づく第1の前記経年予測ラインと、第2の前記ユーザ生活特性に基づく第2の前記経年予測ラインとを予測することを含み、
前記リスクを提示することは、前記第1の経年予測ラインと前記第2の経年予測ラインとを比較可能に並べて、または連続的に提示することを含む、方法。In claim 14 or 15,
The predicting predicts, for the same user, a first aging prediction line based on a first user life characteristic and a second aging prediction line based on a second user life characteristic. Including
Presenting the risk includes presenting the first aging line and the second aging line in a comparable or side-by-side manner.
前記第1の経年予測ライン上の第1の年齢の前記ユーザ脳健康データと、前記ユーザ個体特性に前記第1の年齢を加えた個体特性に対応する前記個体特性、および前記第1のユーザ生活特性に対応する前記生活特性に関連付けられた前記サンプル脳健康データとの比較の結果に基づいて、前記ユーザの将来の認知症リスクを示す第1のスコア、または、前記第1のスコアに応じた記号と、前記第2の経年予測ライン上の第1の年齢の前記ユーザ脳健康データと、前記ユーザ個体特性に前記第1の年齢を加えた個体特性に対応する前記個体特性、および前記第2のユーザ生活特性に対応する前記生活特性に関連付けられた前記サンプル脳健康データとの比較の結果に基づいて、前記ユーザの将来の認知症リスクを示す第2のスコア、または、前記第2のスコアに応じた記号とを前記第1の経年予測ラインと前記第2の経年予測ラインとともに、または代わりに提示することを有する、方法。In claim 16, further comprising:
The user brain health data of a first age on the first aging prediction line, the individual characteristics corresponding to the individual characteristics obtained by adding the first age to the user individual characteristics, and the first user life A first score indicating the future dementia risk of the user, or a first score indicating the risk of future dementia of the user, based on a result of comparison with the sample brain health data associated with the life characteristic corresponding to the characteristic. A symbol, the user brain health data of the first age on the second aging prediction line, the individual characteristic corresponding to the individual characteristic obtained by adding the first age to the user individual characteristic, and the second characteristic A second score indicating a future risk of dementia of the user based on a result of comparison with the sample brain health data associated with the life characteristic corresponding to the user's life characteristic, or It has to present a symbol corresponding to the second score with the first aging predicted line and the second aging prediction line, or alternatively, method.
Priority Applications (4)
| Application Number | Priority Date | Filing Date | Title |
|---|---|---|---|
| EP19845536.2AEP3831290A4 (en) | 2018-07-31 | 2019-07-31 | DEMENTIA RISK PRESENTATION SYSTEM AND METHOD |
| US17/260,161US20210296001A1 (en) | 2018-07-31 | 2019-07-31 | Dementia risk presentation system and method |
| CN201980050854.1ACN112512417A (en) | 2018-07-31 | 2019-07-31 | System and method for presenting dementia risk |
| IL280428AIL280428B (en) | 2018-07-31 | 2021-01-26 | Dementia risk presentation system and method |
Applications Claiming Priority (2)
| Application Number | Priority Date | Filing Date | Title |
|---|---|---|---|
| JP2018143199AJP6644335B2 (en) | 2018-07-31 | 2018-07-31 | Dementia risk presentation system and dementia risk presentation method |
| JP2018-143199 | 2018-07-31 |
Publications (1)
| Publication Number | Publication Date |
|---|---|
| WO2020027213A1true WO2020027213A1 (en) | 2020-02-06 |
Family
ID=69230829
Family Applications (1)
| Application Number | Title | Priority Date | Filing Date |
|---|---|---|---|
| PCT/JP2019/030056CeasedWO2020027213A1 (en) | 2018-07-31 | 2019-07-31 | Dementia risk presentation system and method |
Country Status (6)
| Country | Link |
|---|---|
| US (1) | US20210296001A1 (en) |
| EP (1) | EP3831290A4 (en) |
| JP (1) | JP6644335B2 (en) |
| CN (1) | CN112512417A (en) |
| IL (1) | IL280428B (en) |
| WO (1) | WO2020027213A1 (en) |
Cited By (1)
| Publication number | Priority date | Publication date | Assignee | Title |
|---|---|---|---|---|
| CN114822833A (en)* | 2021-01-29 | 2022-07-29 | 株式会社理光 | Brain function evaluation system, method and computer readable medium |
Families Citing this family (5)
| Publication number | Priority date | Publication date | Assignee | Title |
|---|---|---|---|---|
| JP7568423B2 (en)* | 2019-05-10 | 2024-10-16 | キヤノンメディカルシステムズ株式会社 | Diagnostic Support Devices |
| JP7116445B1 (en)* | 2021-10-01 | 2022-08-10 | 株式会社CogSmart | Dementia prevention support device, dementia prevention support program, and dementia prevention support method |
| WO2023205347A1 (en)* | 2022-04-22 | 2023-10-26 | NeuroGeneces Inc. | Sensing system with features for determining physiological metrics of a subject and for predicting electrophysiological events of a subject |
| CN115295124B (en)* | 2022-09-30 | 2023-01-20 | 北京智精灵科技有限公司 | Multi-mode cognitive improvement method and system |
| JP2025050381A (en)* | 2023-09-22 | 2025-04-04 | 積水化学工業株式会社 | Information processing system, information processing method and program |
Citations (4)
| Publication number | Priority date | Publication date | Assignee | Title |
|---|---|---|---|---|
| JP2015084970A (en)* | 2013-10-31 | 2015-05-07 | 株式会社アラヤ・ブレイン・イメージング | Individual characteristics prediction system, individual characteristics prediction method and program |
| JP2016022310A (en) | 2014-07-24 | 2016-02-08 | タイオー株式会社 | Dementia risk determination system |
| JP2017124039A (en)* | 2016-01-14 | 2017-07-20 | 東芝メディカルシステムズ株式会社 | Image processing device and image processing program |
| JP2018033652A (en) | 2016-08-31 | 2018-03-08 | クリナップ株式会社 | Opening structure and fine bubble generator |
Family Cites Families (9)
| Publication number | Priority date | Publication date | Assignee | Title |
|---|---|---|---|---|
| JP2002143096A (en)* | 2000-11-13 | 2002-05-21 | Tokai Univ | Dementia test device, dementia test server, dementia test client, and dementia test system |
| JP4739746B2 (en)* | 2004-12-27 | 2011-08-03 | 株式会社ディー・ディー・エス | Skin evaluation method and skin evaluation apparatus |
| JP2010231308A (en)* | 2009-03-26 | 2010-10-14 | Olympus Corp | Lifestyle disease prevention device and lifestyle disease prevention program |
| JP2010256471A (en)* | 2009-04-22 | 2010-11-11 | Aiphone Co Ltd | Focus adjustment device |
| WO2011040473A1 (en)* | 2009-09-29 | 2011-04-07 | 大日本印刷株式会社 | Method, device and program for medical image processing |
| JP5989354B2 (en)* | 2012-02-14 | 2016-09-07 | 東芝メディカルシステムズ株式会社 | Image diagnosis support apparatus and method of operating image diagnosis support apparatus |
| US20160051178A1 (en)* | 2014-08-20 | 2016-02-25 | Virginia Institute of Neuropsychiatry | System and method for calculating brain volume |
| WO2017204233A1 (en)* | 2016-05-23 | 2017-11-30 | Necソリューションイノベータ株式会社 | Health condition prediction device, health condition prediction method, and computer-readable recording medium |
| KR20180002234A (en)* | 2016-06-29 | 2018-01-08 | 원시스템주식회사 | A smart examination apparatus for dementia early diagnosis and the method by using the same |
- 2018
- 2018-07-31JPJP2018143199Apatent/JP6644335B2/enactiveActive
- 2019
- 2019-07-31EPEP19845536.2Apatent/EP3831290A4/ennot_activeWithdrawn
- 2019-07-31CNCN201980050854.1Apatent/CN112512417A/enactivePending
- 2019-07-31WOPCT/JP2019/030056patent/WO2020027213A1/ennot_activeCeased
- 2019-07-31USUS17/260,161patent/US20210296001A1/ennot_activeAbandoned
- 2021
- 2021-01-26ILIL280428Apatent/IL280428B/enunknown
Patent Citations (4)
| Publication number | Priority date | Publication date | Assignee | Title |
|---|---|---|---|---|
| JP2015084970A (en)* | 2013-10-31 | 2015-05-07 | 株式会社アラヤ・ブレイン・イメージング | Individual characteristics prediction system, individual characteristics prediction method and program |
| JP2016022310A (en) | 2014-07-24 | 2016-02-08 | タイオー株式会社 | Dementia risk determination system |
| JP2017124039A (en)* | 2016-01-14 | 2017-07-20 | 東芝メディカルシステムズ株式会社 | Image processing device and image processing program |
| JP2018033652A (en) | 2016-08-31 | 2018-03-08 | クリナップ株式会社 | Opening structure and fine bubble generator |
Non-Patent Citations (2)
| Title |
|---|
| MATSUDA, HIROSHI: "Considering the early diagnosis of Alzheimer-type dementia using MRI standard database", JAPANESE JOURNAL OF GERIATRIC PSYCHIATRY, vol. 16, no. 12, December 2005 (2005-12-01), pages 38 - 44, XP009525583, ISSN: 0915-6305* |
| See also references ofEP3831290A4 |
Cited By (2)
| Publication number | Priority date | Publication date | Assignee | Title |
|---|---|---|---|---|
| CN114822833A (en)* | 2021-01-29 | 2022-07-29 | 株式会社理光 | Brain function evaluation system, method and computer readable medium |
| EP4035599A1 (en)* | 2021-01-29 | 2022-08-03 | Ricoh Company, Ltd. | Brain function evaluation system, method, and computer-readable medium |
Also Published As
| Publication number | Publication date |
|---|---|
| CN112512417A (en) | 2021-03-16 |
| JP6644335B2 (en) | 2020-02-12 |
| JP2020018424A (en) | 2020-02-06 |
| IL280428B (en) | 2021-07-29 |
| IL280428A (en) | 2021-03-01 |
| EP3831290A4 (en) | 2022-04-20 |
| EP3831290A1 (en) | 2021-06-09 |
| US20210296001A1 (en) | 2021-09-23 |
Similar Documents
| Publication | Publication Date | Title |
|---|---|---|
| JP6679017B1 (en) | Dementia risk presentation system and method | |
| WO2020027213A1 (en) | Dementia risk presentation system and method | |
| US20200227172A1 (en) | Determining indicators of individual health | |
| US20210294946A1 (en) | Selecting and applying digital twin models | |
| US20220172841A1 (en) | Methods of identifying individuals at risk of developing a specific chronic disease | |
| JP2021029692A (en) | Mild cognitive impairment determination system | |
| US20140136225A1 (en) | Discharge readiness index | |
| US20170124268A1 (en) | System and method to assist patients and clinicians in using a shared and patient-centric decision support tool | |
| JP2015513157A (en) | System and method for improving neurologist workflow for Alzheimer's disease | |
| JP6038727B2 (en) | Analysis system and analysis method | |
| JP6379199B2 (en) | Data analysis apparatus, data analysis apparatus control method, and data analysis apparatus control program | |
| US20250157669A1 (en) | Decision-Support Tools For Pediatric Obesity | |
| US20210098132A1 (en) | Analysis system and analysis method | |
| JP2006163489A (en) | Disease onset probability calculating device, and program | |
| JP7628469B2 (en) | Information Processing System | |
| Tran et al. | Explainable hybrid tabular Variational Autoencoder and feature Tokenizer Transformer for depression prediction | |
| JP7322818B2 (en) | Estimation system and simulation system | |
| US20220051795A1 (en) | Analysis system and analysis method | |
| JP4499542B2 (en) | Medical information processing apparatus and program | |
| CN115956878A (en) | Data processing method, device, equipment and storage medium based on tongue image | |
| HK40045648A (en) | Dementia risk presentation system and method | |
| CN119008016B (en) | A maternal prenatal status intelligent analysis system and method | |
| US20240112777A1 (en) | Health support apparatus, health support system, and health support method | |
| JP6960369B2 (en) | Analytical system and analytical method | |
| JP2025119247A (en) | Disease test intervention recommendation method, disease test intervention recommendation device, and disease test intervention recommendation program |
Legal Events
| Date | Code | Title | Description |
|---|---|---|---|
| 121 | Ep: the epo has been informed by wipo that ep was designated in this application | Ref document number:19845536 Country of ref document:EP Kind code of ref document:A1 | |
| NENP | Non-entry into the national phase | Ref country code:DE | |
| ENP | Entry into the national phase | Ref document number:2019845536 Country of ref document:EP Effective date:20210301 | |
| WWW | Wipo information: withdrawn in national office | Ref document number:2019845536 Country of ref document:EP |