WO2019013014A1 - Comfort level display device - Google Patents
Comfort level display deviceDownload PDFInfo
- Publication number
- WO2019013014A1 WO2019013014A1PCT/JP2018/024709JP2018024709WWO2019013014A1WO 2019013014 A1WO2019013014 A1WO 2019013014A1JP 2018024709 WJP2018024709 WJP 2018024709WWO 2019013014 A1WO2019013014 A1WO 2019013014A1
- Authority
- WO
- WIPO (PCT)
- Prior art keywords
- value
- comfort
- area
- user
- environmental data
- Prior art date
- Legal status (The legal status is an assumption and is not a legal conclusion. Google has not performed a legal analysis and makes no representation as to the accuracy of the status listed.)
- Ceased
Links
Images


Classifications
- G—PHYSICS
- G06—COMPUTING OR CALCULATING; COUNTING
- G06T—IMAGE DATA PROCESSING OR GENERATION, IN GENERAL
- G06T11/00—2D [Two Dimensional] image generation
- G06T11/20—Drawing from basic elements, e.g. lines or circles
- G06T11/206—Drawing of charts or graphs
- F—MECHANICAL ENGINEERING; LIGHTING; HEATING; WEAPONS; BLASTING
- F24—HEATING; RANGES; VENTILATING
- F24F—AIR-CONDITIONING; AIR-HUMIDIFICATION; VENTILATION; USE OF AIR CURRENTS FOR SCREENING
- F24F11/00—Control or safety arrangements
- F24F11/50—Control or safety arrangements characterised by user interfaces or communication
- F24F11/52—Indication arrangements, e.g. displays
- F24F11/523—Indication arrangements, e.g. displays for displaying temperature data
- F—MECHANICAL ENGINEERING; LIGHTING; HEATING; WEAPONS; BLASTING
- F24—HEATING; RANGES; VENTILATING
- F24F—AIR-CONDITIONING; AIR-HUMIDIFICATION; VENTILATION; USE OF AIR CURRENTS FOR SCREENING
- F24F11/00—Control or safety arrangements
- F24F11/62—Control or safety arrangements characterised by the type of control or by internal processing, e.g. using fuzzy logic, adaptive control or estimation of values
- F24F11/63—Electronic processing
- F24F11/64—Electronic processing using pre-stored data
- F—MECHANICAL ENGINEERING; LIGHTING; HEATING; WEAPONS; BLASTING
- F24—HEATING; RANGES; VENTILATING
- F24F—AIR-CONDITIONING; AIR-HUMIDIFICATION; VENTILATION; USE OF AIR CURRENTS FOR SCREENING
- F24F2120/00—Control inputs relating to users or occupants
Definitions
- the present inventionrelates to a configuration of a comfort degree display device that displays environmental data in a conditioned space and the degree of comfort of the user.
- this inventionmakes it easy to grasp
- an object of this inventionis to enable management of an appropriate air conditioning installation.
- the comfort degree display deviceincludes: a preference storage unit storing a user's preference for an air conditioning environment; an attribute storage unit storing an attribute of the user; and an environmental data value acquiring an environmental data value representing a condition of the air conditioning space Based on the acquisition unit, the preference of the user stored in the preference storage unit, the attribute of the user stored in the attribute storage unit, and the environmental data value of the air-conditioned space acquired by the environmental data value acquisition unit
- a degree-of-comfort value generating unitfor generating a degree-of-comfort value indicating the degree of comfort of the user in the air-conditioned space; a degree of comfort value for the user generated by the degree-of-comfort value generating unit;
- a display data generation unitthat generates display data by combining environmental data values of the air-conditioned space, and a display unit that displays the display data.
- the present inventiondisplays the comfort level value and the environmental data value in an overlapping manner, the air conditioning manager can easily grasp the relevance between the comfort level and the environmental data. For this reason, the present invention enables the air conditioning manager to properly adjust the air conditioning equipment.
- the comfort degree display device of the present inventionfurther includes a comfort degree value basic statistic representing the comfort degree value of the user generated by the comfort degree value generation unit, and the air conditioning space acquired by the environmental data value acquisition unit. It may have a basic statistics calculation part which calculates environmental data value basic statistics which represent environmental data values. Further, the display data generation unit may be any one or more of the user comfort value, the environmental data value of the air-conditioned space, the comfort value basic statistic, and the environmental data value basic statistic. And may be combined to generate display integrated data, and the display unit may display the display integrated data.
- the comfort value basic statistic calculated by the basic statistic calculation unithas the following groups (1) to (5), (1) time average value or space average value of the user comfort value (2) time median or space median value of the user comfort value (3) time maximum value or space maximum of the user comfort value Value (4) Time minimum value or space minimum value of the user's comfort level value (5) time mode or spatial mode value of the user's level of comfort value
- the environmental data value calculated by the basic statistic calculation unitThe basic statistics have the following groups (6) to (10), (6) time average value or space average value of environmental data values of the air conditioned space (7) median time or median value of environmental data values of the air conditioned space (8) maximum time value of environmental data values of the air conditioned space Or space maximum value (9)
- the time minimum value or space minimum value of the environmental data value of the said air conditioning spaceIt is good also as a time mode or space mode value of the environmental data value of the said air conditioning space.
- the display data generation unitis configured to: the comfort degree value of the user; an environmental data value of the air conditioned space; and the comfort degree basic statistic of the group of (1).
- Any one or more of the environmental data value basic statistics of the group of (6), or the comfort value of the user, the environmental data value of the air conditioned space, and the group of the (2)Any one or more of the comfort value basic statistic and the environmental data value basic statistic of the group (7), or the comfort value of the user, and the environmental data value of the air-conditioned space
- the air conditioning managercan grasp the tendency of the relationship between the comfort level and the environmental data, and the air conditioning facility You can easily determine the need for replacement, additional installation, etc.
- the comfort level basic statistics and the environmental data basic statisticsare superimposed and displayed, the air conditioning manager can grasp the tendency of the spatial relationship between the comfort level and the environmental data, and within the air conditioning space It is easy to determine the necessity for replacement of air conditioning equipment in a specific area or for additional installation of building equipment such as partitions.
- the comfort value basic statistics and environmental data values basic statisticsuse the comfort value and the average value, median, maximum value, minimum value, mode which is an index representing the data group of environmental data values The data group can be comprehensively grasped.
- the comfort degree display devicefurther includes a comfort degree value basic statistic representing the comfort degree value of the user generated by the comfort degree value generation unit, and the air conditioning acquired by the environmental data value acquisition unit. It may have a basic statistic calculation unit that calculates an environmental data value basic statistic that represents environmental data values in space. Further, the display data generation unit generates statistics display data by combining any one of the comfort level basic statistics and any one of the environmental data value basic statistics. The display unit may display the statistic display data.
- the display data generation unitis configured to select one of two values included in the comfort degree basic statistics of the group (1) and the group of the (6). And one of two values included in the environmental data value basic statistic of the above, or one of two values included in the comfort degree basic statistic of the group (2); And any one of two values included in the environmental data value basic statistic of the group or any one of two values included in the comfort value basic statistic of the group of (3); Either one of two values included in the environmental data value basic statistic of the group of (8) or any one of two values included in the comfort value basic statistic of the group of (4) One and the above (9) Either one of two values included in the environmental data value basic statistic of the loop, or one of two values included in the comfort value basic statistic of the group of (5),
- the statistical data display datamay be generated by combining one of the two values included in the environmental data value basic statistic of the group of 10).
- the air conditioning managercan grasp the tendency of the relationship between the comfort degree and the environmental data, and replace or add the air conditioning facility. You can easily determine the need for
- the comfort value basic statistics and environmental data values basic statisticsthe comfort value, average value, median, maximum value, minimum value, mode which is an index representing the data group of environmental data values By using it, it is possible to comprehend the data group comprehensively.
- the air conditioning spaceis further constituted by a plurality of areas, and an area information storage unit for storing configuration information of each area of the air conditioning space; and each information stored in the area information storage unit
- An area environmental data value acquiring unitfor acquiring area environmental data values representing the condition of the air conditioned space of each area with reference to area configuration information, the user preference stored in the preference storage unit, and An area comfort generating area comfort value indicating comfort of the user in the area based on the attribute of the user stored in the attribute storage unit and the area environmental data value acquired by the area environmental data value acquiring unit
- a degree value generation unit, the area comfort degree value of the user generated by the area comfort degree value generation unit, and the area environmental data acquired by the area environmental data value acquisition unitIf it may be a have the area display data generating unit that combined to produce an area display data.
- the display unitmay display one or more of the area display data.
- an area comfort degree basic statistic representing the area comfort degree value of the usergenerated by the area comfort degree value generation unit and the area environmental data value acquisition unit
- An area basic statistic calculation unitmay be provided to calculate an area environmental data value basic statistic representing the acquired area environmental data value.
- the area display data generation unitis any one or more of the area comfort value of the user, the area environment data value, the area comfort value basic statistic, and the area environment data value basic statistic. And may be synthesized to generate area display integrated data.
- the display unitmay display one or more of the area display integrated data.
- the area comfort degree basic statistic calculated by the area basic statistic calculation unithas the following groups (1) to (5), (1) time average value or space average value of the area comfort value of the user (2) time median or space median value of the area comfort value of the user (3) time maximum value of the area comfort value of the user Or the space maximum value (4) the time minimum value or the space minimum value of the area comfort value of the user (5) the time mode or space mode of the area comfort value of the user
- the area environmental data value basic statistic to be calculatedhas the following groups (6) to (10): (6) time average value or space average value of the area environmental data value (7) time median value or space median value of the area environmental data value (8) time maximum value or space maximum value of the area environmental data value (9 The time minimum value or the space minimum value of the area environmental data value (10) The time mode value or the space mode value of the area environmental data value may be used.
- an area comfort degree basic statistic representing the area comfort degree value of the user generated by the area comfort degree value generation unit and the area environmental data value acquisition unitAn area basic statistic calculation unit may be provided to calculate an area environmental data value basic statistic representing the acquired area environmental data value.
- the area display data generation unitgenerates area statistics display data by combining any one of the area comfort value basic statistics and any one of the area environmental data values basic statistics. You may Further, the display unit may display one or more of the area statistic display data.
- the area display data generation unitis configured to select one of two values included in the area comfort degree basic statistic of the group of (1) and the group of (6). And one of two values included in the area environmental data value basic statistic of the above, or one of two values included in the area comfort value basic statistic of the group (2); Either of two values included in the area environmental data value basic statistic of the group of (7), or any of two values included in the area comfort value basic statistic of the group of (3).
- one of two values included in the area environmental data value basic statistic of the group of (8), or included in the area comfort value basic statistic of the group of (4)Either one of the two values and one of the two values included in the area environmental data value basic statistic of the group of (9) or the area comfort value of the group of (5)
- the area statisticis displayed by combining one of two values included in the basic statistic and one of two values included in the area environmental data value basic statistic of the group of (10). Data may be generated.
- the air conditioning managercan grasp the tendency of the relationship between the comfort degree and the environmental data for each area, and for each area It is possible to easily judge the necessity for replacement or additional installation of air conditioners. Also, as the area comfort value basic statistics and area environmental data values basic statistics, the comfort value, average value, median, maximum value, minimum value, mode which is an index representing a data group of environmental data values The data group can be comprehensively grasped by using the value.
- the comfort level display device of the present inventionmay further include an area information input unit for inputting configuration information of the area of the air-conditioned space to the area information storage unit.
- the comfort level display device of the present inventionmay further include a power information acquisition unit that acquires a power data value used for the device in the air-conditioned space.
- the display data generation unitacquires the user comfort level value generated by the comfort level value generation unit, the environmental data value of the air-conditioned space acquired by the environmental data value acquisition unit, and the power information acquisition unit
- the display datamay be generated by combining with the power data value.
- the air conditioning managercan grasp the relationship between the power consumption, the degree of comfort, and the environmental data value.
- the comfort degree display devicefurther includes an area basic statistic calculation unit for calculating an area comfort degree basic statistic representing the area comfort degree value of the user generated by the area comfort degree value generation unit;
- An area comfort degree evaluation unitmay be provided which compares the area comfort degree basic statistic calculated by the area basic statistic calculation unit with a predetermined threshold value and outputs an area comfort degree evaluation.
- the area display data generation unitincludes the area comfort value of the user generated by the area comfort value generation unit, the area environmental data value acquired by the area environmental data value acquisition unit, and the area comfort evaluation unit.
- the area display datamay be generated by combining the area comfort degree evaluations output by
- the comfort level display device of the present inventionfurther includes a biometric information storage unit for storing biometric information of the user, and a user condition acquisition unit for acquiring the current condition amount of the user and the current position of the user.
- the comfort degree value generation unitmay include the preference of the user stored in the preference storage unit, the attribute of the user stored in the attribute storage unit, and an environmental data value of the air-conditioned space acquired by the environmental data value acquisition unit. And comfort of the user in the air-conditioned space based on the biometric information of the user stored in the biometric information storage unit, the current state amount of the user acquired by the user status acquisition unit, and the current position of the user It is also possible to generate a comfort value indicating the sex.
- the comfort degree display device of the present inventionfurther complements the comfort degree value of the user, which is a discrete value generated by the comfort degree value generation unit, to calculate a continuous value for time or space, and the environmental data value acquisition unit It may have a complementation part which complements the environmental data value of the above-mentioned air-conditioning space which is a discrete value which acquired the, and computes a continuous value to time or space.
- the display data generation unitcombines and combines either one of time or space continuous values of the user's comfort level with either of time or space continuous values of environmental data values of the air-conditioned space Display data may be generated, and the display unit may display the continuous display data.
- the displayis easy to view, and the air conditioning manager can more easily understand the relationship between the comfort and the environmental data.
- the comfort degree display device of the present inventionmay further include an abnormality detection unit that detects an abnormality when the comfort degree value of the user is not within the comfort limit range, and outputs abnormal data.
- the display data generation unitgenerates abnormality display data by combining the abnormality data output from the abnormality detection unit, the comfort level value of the user, and the environmental data value of the air-conditioned space, and the display unit The abnormality display data may be displayed.
- the comfort degree display device of the present inventionmay further include an abnormality detection unit that detects an abnormality and outputs abnormality data when the comfort degree value of the user is not within the comfort limit range.
- the display data generation unitmay be configured to determine the comfort level of the user and the environmental data value of the air-conditioned space so that the comfort level of the user whose abnormality is detected may be distinguished from the comfort level of another user.
- the abnormality identification display datamay be generated, and the display unit may display the abnormality identification display data.
- the air conditioning managernotices the presence of the offender at an early stage, and the air conditioning system can be adjusted at an early stage.
- the preference storage unitstores the preference for the air conditioning environment of the type-based reference user.
- the attribute storage unitstores the attribute of the standard user classified by type, and the preference of the standard user classified by type stored in the preference storage unit and the type stored in the attribute storage unit for each area of the air conditioning space
- the comfort level value of the standard user classified by typemay be generated based on the attribute of the separate standard user and the environmental data value of the air-conditioned space acquired by the environmental data value acquisition unit.
- the comfort degree display device of the present inventionmay further include a type-wise recommended area generation unit that designates an area where the degree-of-comfort value of the type-based reference user is within a predetermined range as the type-wise recommended area.
- the display data generation unitcombines the user comfort level value generated by the comfort level value generation unit, the type classified recommended area, and the environmental data value of the air-conditioned space, and displays classified type classified area data
- the display unitmay generate and display the recommended area display data classified by type.
- the recommended areais displayed according to the type of heat type, cold type, etc., so that the user can be encouraged to view the display and move to his / her favorite location. For example, when a user may be seated at any place as in a free address office, the overall comfort and productivity can be improved if each person is seated according to his / her preference.
- the comfort level display device of the present inventionmay further include a destination display unit for displaying the type-by-type recommendation area in projection mapping or augmented reality.
- the usercan be easily moved, and the overall comfort and productivity can be further improved.
- the comfort degree display devicefurther, for each area of the air conditioning space, the preference of the user stored in the preference storage unit, the attribute of the user stored in the attribute storage unit, and acquisition of the environmental data value
- User's comfort level valueis generated on the basis of the environmental data value of the air-conditioned space acquired by the unit, and the user's recommendation level area is designated as a user-specific recommendation area, wherein the user comfort level value is in a predetermined range You may have a part.
- the display data generation unitcombines the user comfort degree value generated by the comfort degree value generation unit, the user-by-user recommendation area, and the environmental data value of the air-conditioned space, and displays the user-by-user recommendation area display data It may be generated.
- the display unitmay display the user-by-user recommendation area display data.
- the usersince the user automatically recommends where to go in the air-conditioned space in consideration of the user's preference and the user's attributes, the user can check the display etc. It can be easily moved to a comfortable position.
- the comfort level display device of the present inventionmay further include a user state acquisition unit that acquires the current state amount of the user and the current position of the user.
- the comfort degree value generation unitmay include the preference of the user stored in the preference storage unit, the attribute of the user stored in the attribute storage unit, and an environmental data value of the air-conditioned space acquired by the environmental data value acquisition unit. And a current comfort value indicating the current comfort of the user based on the current state amount of the user acquired by the user state acquisition unit and the current position of the user.
- the comfort degree display device of the present inventionfurther changes the state quantity of the user from the current state quantity until the comfort degree value of the user falls within a predetermined range when the current comfort degree value is not within the predetermined range.
- the comfort value of the useris repeatedly generated based on the preference of the user, the attribute of the user, the environmental data value of the air conditioned space, and the current position of the user, and the comfort value of the user is You may have a recommendation action production
- the display data generation unitcombines the current comfort value of the user generated by the comfort value generation unit, an environmental data value of the air-conditioned space, and the recommended action generated by the recommended action generation unit. Recommended action display data may be generated.
- the display unitmay display the recommended action display data.
- the comfort degree display deviceincludes: a preference storage unit storing preferences for the air conditioning environment of the standard user by type; an attribute storage unit storing the attributes of the standard user by type; and environmental data values representing the condition of the air conditioning space
- An environmental data value acquiring unitfor acquiring the information, a preference of the standard user by type stored in the preference storage unit, and an attribute of the standard user by type stored in the attribute storage unit for each area of the air conditioning space;
- the comfort level value of the standard user classified by typeis generated based on the environmental data value of the air conditioned space acquired by the environmental data value acquisition unit, and the area where the comfort degree value of the standard user classified by type is within a predetermined range is typed
- the recommended areais displayed according to the type of heat type, cold type, etc., so that the user can be encouraged to view the display and move to his / her favorite location.
- the comfort degree display deviceincludes: a preference storage unit storing a user's preference for an air conditioning environment; an attribute storage unit storing an attribute of the user; and an environmental data value acquiring an environmental data value representing a condition of the air conditioning space
- a user-specific recommended area generation unitthat generates the user's comfort level value based on the environmental data values and specifies an area where the user's comfort level value is within a predetermined range as the user-specific recommended area;
- a display data generation unitthat combines an area and environmental data values of the air-conditioned space to generate user-specific recommended area display data, and a display unit that displays the user-specific recommended area display data And wherein the door.
- the usercan automatically move to a comfortable position without confirming the display etc., since the user automatically recommends which place in the air-conditioned space the user should go to.
- the present inventionfacilitates understanding of comfort and relevance to environmental data, and enables appropriate management of air conditioning equipment.
- FIG. 29is a display example of the comfort degree display device shown in FIG. 28 (an example in which a temperature distribution in an air conditioned space, a current comfort degree value at a current position, and a recommended action are displayed). It is a functional block diagram which shows the structure of the comfort degree display apparatus in 11th Embodiment.
- FIG. 31shows an example of the recommended area display of the comfort level display device (an example of displaying the temperature distribution in the air-conditioned space, the distribution of comfort level, and the recommended area according to type). It is a functional block diagram which shows the structure of the comfort degree display apparatus in 12th Embodiment. It is a functional block diagram which shows the structure of the comfort degree display apparatus in 13th Embodiment. It is a flowchart which shows operation
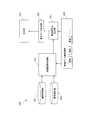
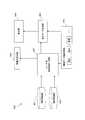
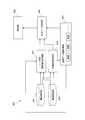
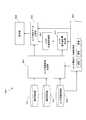
- the comfort level display device 100includes a preference storage unit 101, an attribute storage unit 102, an environmental data value acquisition unit 103, a comfort level value generation unit 104, and display data generation.
- a section 105 and a display section 106are included.
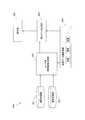
- the comfort degree display device 100can be realized by the general-purpose computer 10 shown in FIG.
- the general-purpose computer 10includes a CPU 21 that performs information processing, a ROM 22 and a RAM 23 that temporarily store data during information processing, and a hard disk drive (HDD) that stores programs and user data.
- 24includes a mouse 25 provided as input means, a keyboard 26, and a display 27 provided as a display device.
- the CPU 21, the ROM 22, the RAM 23 and the HDD 24are connected by a data bus 30.
- the mouse 25, the keyboard 26 and the display 27are connected to the data bus 30 via an input / output controller 28.
- a network controller 29provided as a communication means is connected to the data bus 30.
- the environmental data value acquiring unit 103, the comfort degree value generating unit 104, and the display data generating unit 105 of the comfort degree display device 100are realized by the cooperative operation of the hardware of the general-purpose computer 10 shown in FIG. Ru.
- the preference storage unit 101 and the attribute storage unit 102are realized by the HDD 24 of the general-purpose computer 10 shown in FIG.
- the display unit 106is realized by the display 27.
- the preference storage unit 101 and the attribute storage unit 102may be realized by the RAM 23.
- the preference storage unit 101 and the attribute storage unit 102may be realized by using an external storage unit via a network.
- the preference storage unit 101stores the preference for the air conditioning environment of the user.
- the preference for the air-conditioned environmentis, for example, "hot heat” as a preference for temperature, “cold”, “chilliness” which is a preference for temperature and wind speed, “dry skin” which is a preference for humidity and the like.
- the preference storage unit 101stores a user preference database 901 as shown in FIG. As shown in FIG. 3, in the user preference database 901, data of the user name, user ID number, and whether the user falls under each item of “Heat”, “Cold”, “Coldiness”, and “Dry Skin”. Are linked. In FIG. 3, “o” indicates that the item corresponds to the corresponding item, and "-” indicates that the item does not correspond to the corresponding item.
- the attribute storage unit 102stores user attributes.
- the attributes of the userare, for example, the user's age, gender, height, weight, body fat percentage, seat position, and the like.
- the attribute storage unit 102stores a user attribute database 902.
- the user name, the user ID number, and attribute informationsuch as the age, sex, height, weight, body fat percentage, and seat position of the user are linked.
- the seating positionis determined by the column names of the office desk 41 and the chairs 42 and It is displayed in combination with the column number. For example, in the case of "A-1", it indicates that the seat position is row A.
- the environmental data value acquisition unit 103acquires environmental data values indicating the condition of the air-conditioned space 40 shown in FIG. 7.
- the environmental data valueis, for example, a value such as temperature, humidity, or wind speed in the air-conditioned space 40.
- the environmental data value acquisition unit 103acquires each environmental data value by various sensors such as a temperature sensor, a humidity sensor, and a wind speed sensor.
- the degree-of-comfort value generation unit 104determines the preference of the user stored in the preference storage unit 101, the attribute of the user stored in the attribute storage unit 102, and the environmental data value of the air-conditioned space 40 acquired by the environmental data value acquisition unit 103. And a comfort value indicative of the user's comfort in the conditioned space 40 is generated.
- the degree-of-comfort value generation unit 104generates a degree-of-comfort value according to the following equation (1) using PMV, which is an index indicating comfort.
- Comfort value⁇ ⁇ PMV + ⁇ ⁇ F ⁇ ⁇ R ⁇ (1)
- the degree of comfort valueindicates that 0 is neutral, +1 is slightly warm, +2 is warm, and +3 is hot, as in PMV. Also, the degree of comfort indicates that -1 is somewhat cool, -2 is cool and -3 is cold.
- the PMVis a comfort index that indicates whether a human feels warm or cold with "a numerical value according to the 7-point scale". PMV takes into consideration six physical factors of temperature, humidity, wind speed and radiation temperature, and a combination of six factors on the human side of clothing and momentum as factors affecting the thermal comfort of the human body. Calculated by the theoretical formula (Formula (2) below).
- the four physical elementsvalues acquired by the environmental data value acquisition unit 103 are used.
- the amount of clothes and the amount of exerciseare the standard amounts of clothes and the amount of exercise at the time of office work. The amount of clothes may be determined by measuring the temperature of the skin and the temperature of the clothes with a thermo camera and estimating the temperature difference.
- PMV(0.303e ⁇ 0.036M + 0.028L) ⁇ L (2)
- Lis the heat load (W / m 2 ) of the human body
- Mis the metabolic amount (W / m 2 ).
- PMVindicates that 0 is neutral, +1 is slightly warm, +2 is warm and +3 is hot. Also, PMV indicates that -1 is somewhat cool, -2 is cool and -3 is cold.
- the recommended range of PMV values according to ISOis -0.5 ⁇ PMV ⁇ 0.5.
- Fis the influence degree of preference information
- Ris the influence degree of attribute information.
- the degree of influence F of preference information and the degree of influence R of attribute informationare calculated as in the following formulas (3) and (4), respectively.
- Fa ⁇ F 1 + b ⁇ F 2 +... (3)
- Rp ⁇ R 1 + q ⁇ R 2 +... (4)
- the degree of influence F of preference informationis calculated based on one or more elements included in the preference information.
- R 1 , R 2 ,...Indicate the degree of each element of the user's attributes such as “age”, “sex”, “height”, “weight”, “body fat percentage”, “seat position”, etc. It is a numerical value shown.
- the influence degree R of the attribute informationis calculated based on one or more elements included in the attribute information. Further, a, b, ..., p, q, ... are coefficients.
- SET *Standard new Effective Temperature
- PMVGreenwich temperature
- SET *based on air temperature, humidity, air flow, radiant heat, and amount of clothes, comfort is expressed at the same temperature as in the case of 50% relative humidity without air flow.
- wet bulb black ball temperature WBGTeffective temperature ET, new effective temperature ET * , OUT_SET * , action temperature OT, wet action temperature HOT, standard wet action temperature SHOT, corrected wet action temperature HOTV, corrected new effective temperature ETV, comprehensive Comfortable based on effective temperature ETU, heat stress index HSI, discomfort index THI, thermal sensation index TSI, PET, ETFe, UTCI, average radiation temperature MRT, t * mrt , OUT_MRT, wind cooling index WCI, correction effective temperature CET etc.
- a degree valuemay be generated.
- Wet bulb black bulb temperature WBGTis an experimental formula created for heat stroke prevention. In addition to air temperature and humidity, air flow and radiation are also considered in the wet bulb black bulb temperature WBGT.
- the wet bulb black bulb temperature WBGTis calculated by the following equation (5).
- WBGT (outdoor)0.7Tw + 0.2Tg + 0.1T (5)
- Tdry bulb temperature (° C.)
- Twnatural wet bulb temperature (° C.)
- Tgblack bulb temperature (° C.)
- Twexposed natural wet bulb temperature (° C.).
- the effective temperature ETis the temperature at the time of no wind, with a relative humidity of 100% giving the same thermal sensation as the real environment.
- the new effective temperature ET *is an index based on a thermal equilibrium equation that can comprehensively evaluate air temperature, humidity, air flow, radiation, clothing, and metabolism.
- the new effective temperature ET *is a temperature in consideration of the thermoregulatory function by perspiration according to the two-node model.
- the relative humidity of the standard environmentis 50%.
- the new standard effective temperature SET *assumes 50% relative humidity and a wind speed of 0.135 m / s and a metabolic rate M (met) as a standard environment.
- the action temperature OTis an index considering only temperature and radiation.
- the action temperature OTis a weighted average value of the dry bulb temperature T and the average radiation temperature Tr.
- the action temperature OTis calculated by the following equation (7).
- OT(h c ⁇ T + h r * Tr) / (h c + h r ) (7)
- Tdry bulb temperature (° C.)
- Traverage radiation temperature (° C.)
- h cconvection heat transfer coefficient (W / ° C. m 2 )
- h rradiation heat transfer coefficient (W / ° C. m 2 ) .
- the wet working temperature HOTis an index that enables evaluation of the influence of humidity on the working temperature OT.
- the wet action temperature HOTrepresents the temperature at a relative humidity of 100% where the amount of heat loss from the human body placed in the actual thermal environment is equal to the amount of heat loss due to transpiration from the skin.
- the effect of air flowis incorporated into the wet action temperature HOT using a standard wind speed (0.1 m / s).
- the standard wet action temperature SHOTis based on an environment of standard clothing volume (0.6 clo) and standard relative humidity (100%).
- the modified wet action temperature HOTVis an index that can express the temperature conversion value of air flow, radiation, and humidity by the thermal wind field (TVF), the effective radiation field (ERF), and the reduced-effect humidity field (RHF).
- the corrected wet action temperature HOTVis calculated by the following equation (8).
- the modified wetting temperature HOTVdoes not include the effects of solar radiation and conduction.
- HOTVT + (TVF / K tv ) + (ERF / K tv ) + (RHF / K tv ) (8)
- Tdry bulb temperature (° C.)
- K tvwet human body total heat transfer coefficient (W / ° C. m 2 ).
- the modified new effective temperature ETVis an index obtained by converting HOTV based on 100% relative humidity to 50% relative humidity.
- the modified new effective temperature ETVis defined using the effective humidity field (EHF) instead of the reduced-effect humidity field (RHF).
- EHFeffective humidity field
- the corrected new effective temperature ETVis expressed by the following equation (9).
- ETVT + (TVF / h v ) + (ERF / h v ) + (EHF / h v ) (9)
- Tdry bulb temperature (° C.)
- h oreference convective heat conductivity (W / ° C. m 2 )
- h rradiant heat transfer coefficient (W / ° C. m 2 )
- h vh o ⁇ F clo + h r x Fcl
- Fcloconduction efficiency of standard clothes (ND)
- Fclconduction efficiency of clothes (ND).
- the total effective temperature ETUis an index that incorporates the effects of solar radiation and conduction and is applicable to both outdoor and non-uniform thermal environments.
- the total effective temperature ETUis expressed by the following equation (10).
- ETUt ao + ( ⁇ NUAT Fi / h u ) + ( ⁇ TV Fi / h u ) + ( ⁇ ERFLi / h u) + ( ⁇ TVFri / h u) + ( ⁇ ERFSi / h u) + ( ⁇ EHFi / h u) + ( ⁇ TVFei / h u) + ( ⁇ SECFj / h u) ⁇ (10)
- t aorepresentative temperature (° C.)
- NUATFinon-uniform temperature field (W / m 2 ) representing the effect of the difference between the representative temperature and the temperature around the site i
- TVFithermal heat representing the effect of wind speed on the human body Wind speed field (W / m 2 )
- the heat stress index HSIis an index focusing on water evaporation in the human body.
- the heat stress index HSIis determined from the thermal equilibrium equation of the human body assuming that the skin temperature is 35 ° C.
- the heat stress index HSIis represented by the following equation (11).
- HIS (%)(E / Emax) x 100 ... (11)
- EEvaporative radiation amount (W / m 2 ) necessary for the human body to maintain heat balance
- EmaxMaximum possible evaporative heat radiation amount (W / m 2 ) when the human body is completely wet.
- the discomfort index THIis a subjective empirical index that can comprehensively evaluate the temperature and humidity.
- Discomfort Index The THIis 70 and 10% of people feel the current environment offensive.
- Discomfort Index The THIis 75 and 50% of people feel the current environment offensive.
- Discomfort Index The THIis 80 and 100% of people feel the current environment offensive.
- the discomfort index THIis calculated by the following equation (12) or equation (13).
- THI0.72 (Tv + Tw) +40.6... (12)
- THI0.81 T + 0.01 RH (0.99 T-14.3) + 46.3 (13)
- Tdry bulb temperature (° C.)
- Tvwet bulb temperature (° C.)
- RHrelative humidity (%).
- PETis an index developed from PMV and is widely used in Europe. PET is an integrated representation of the effects of temperature, radiation, wind speed, and humidity, based on the heat balance of the human body.
- ETFeis an index that takes into consideration temperature difference, wind speed, humidity, long wavelength radiation outdoors, solar radiation, as well as the difference in posture and the surface temperature of the substance in contact.
- the thermal conductivity excluding each effective fieldis a function of wind speed.
- the temperature change due to solar radiation, which should be independent of the wind speedis affected by the wind speed. ETFe is calculated by the following equation (14).
- EFTeT + (TVF hta / h fL) + (ERF htaL / h fL) + (ECF hta / h fL ) + (EHF ETFe / h fL ) + (ERF htaS / h fL ) ⁇ (14)
- Tdry bulb temperature (° C.)
- TVF htathermal wind velocity field (W / m 2 ) related to convective heat transfer
- ERF hta Llong wavelength effective radiation field (W / M 2 )
- ECF htaeffective conduction field (W / m 2 ) representing the influence of conduction on the contact surface with the human body
- EHF ET Feeffective humidity field (W / m 2 ) representing the influence of humidity
- ERF htaSShort wavelength effective radiation field (W / m 2 )
- h fLRadiant heat transfer coefficient (W /
- UTCIis an index proposed by the International Society of Living Meteorology. UTCI is expressed by integrating the effects of temperature, radiation, wind speed, and humidity based on heat balance calculation using the UTCI-Fiala MN model. In UTCI, the standard condition is 2.3 MET (4 km / h walking), wind speed 0.5 m / s (observed altitude 10 m), average radiation temperature equivalent to air temperature, relative humidity 50% (air temperature greater than 29 ° C) It is defined as 20 hpa).
- the mean radiation temperature MRTis used as a parameter of radiation when calculating the sensation index.
- Mean radiation temperature MRTrefers to an average temperature indication of the peripheral surface obtained by averaging radiant heat received from all directions of the surrounding.
- t isurface temperature of the surface i (° C.)
- ⁇ iform factor of the surface i (ND).
- the average radiation temperature t * mrtis one of the average radiation temperatures considering solar radiation.
- the average radiation temperature t * mrtis calculated by the following equation (16).
- t * mrt[t mrt 4 + f p ⁇ a k ⁇ (I * / ⁇ p ⁇ ⁇ )] 0.25 -273.2 ⁇ (16)
- t mrtaverage radiation temperature not including direct solar radiation
- f phuman body projected area ratio (ND)
- a kabsorptivity for short wavelength radiation (ND)
- I *normal surface direct solar radiation
- W / M 2normal surface direct solar radiation
- ⁇Stefan-Boltzmann constant (5.67 ⁇ 10 ⁇ 8 (W / m 2 K 4 )).
- OUT_MRTis one of the average radiation temperatures in consideration of solar radiation.
- OUT_SET *is an index in which solar radiation is added by using OUT_MRT for the input term of MRT.
- Wind and cold index WCIis an index used for winter frostbite and hypothermia prevention.
- the coldness index WCIis calculated from the functional equation of the air temperature and the wind velocity as the following equation (17).
- WCI(33-T) x (10. 45 + 10 U 0.5- U) (17)
- Tdry bulb temperature (° C.)
- Uwind speed (m / s).
- the correction effective temperature CETis an index obtained by adding the radiation effect of the peripheral surface to the effective temperature ET and performing correction.
- a glove thermometeris used instead of the dry bulb thermometer of the effective temperature ET.
- the display data generation unit 105superimposes two data on the display unit 106 so that the comfort degree value generated by the comfort degree value generation unit 104 and the environmental data value acquired by the environmental data value acquisition unit 103 can be superimposed on each other. Synthesize. Then, the display data generation unit 105 outputs the data obtained by the combination to the display unit 106 as display data.
- the display unit 106displays the display data input from the display data generation unit 105.
- the display unit 106is, for example, the display 27 shown in FIG.
- comfort level display device 100 of the present embodimentconfigured as described above and the display of the display unit 106 will be described with reference to FIGS. 5-7.
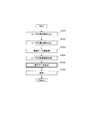
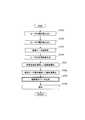
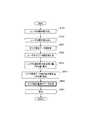
- the degree-of-comfort value generation unit 104reads user preference data from the preference storage unit 101 and user attribute data from the attribute storage unit 102. Further, as shown in step S103 of FIG. 5, the degree-of-comfort value generation unit 104 acquires an environmental data value from the environmental data value acquisition unit 103. Then, as shown in step S104 of FIG. 5, the degree-of-comfort value generation unit 104 generates the degree-of-comfort value of the user using the equations (1) to (4) described above. As shown in step S105 of FIG.
- the display data generation unit 105combines the comfort degree value generated by the comfort degree value generation unit 104 with the environmental data value acquired from the environmental data value acquisition unit 103 to display data.
- the generated display datais output to the display unit 106.
- the display unit 106displays the input display data.
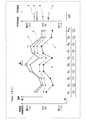
- FIG. 6shows an example of display on the display unit 106.
- FIG. 6is a view showing a change in temperature at a specific position in the air-conditioned space 40 shown by the XY plane in FIG. 7 and a change in time of the degree of comfort of the user.
- the air-conditioned space 40as shown in FIG. 7, the office desk 41 and the chair 42 are disposed on the floor, and the outlet 43 of the air-conditioning facility is disposed on the ceiling.
- the air-conditioned space 40is partitioned by a partition 44.
- the office desk 41 and the chairs 42are arranged in three stages from No. 1 to No. 3 in two rows of A row and B row.
- the seat positionis represented by [row name-step number], and Point [A-1] shown in FIG.
- FIG. 6indicates the seat position of row A.
- a solid line Tindicating a temporal change in temperature at a seat position of row A in row A in the air-conditioned space 40 shown in FIG. 7 is displayed.
- a dashed line ashowing the comfort degree of the standard user A at the seat position of row A in the air conditioned space 40 shown in FIG. 7 and a comfort degree of the cold user B are shown.
- a dashed-dotted line b and a dashed-dotted line cindicating the degree of comfort of the hot user C are displayed.
- the standard user Ais neither “hot”, “cold” nor “cold” nor “dry skin”, but “age”, “height”, “weight”, “body fat percentage” etc.
- the cold user Bis a female user who is "cold” and “cold” and whose "body weight” and “body fat percentage” are smaller than the company's standard.
- the hot user Cis a hot user and a male user whose “body weight” and “body fat percentage” are larger than the standard of the company.
- the comfort values of the temperature indicated by the solid line T, the broken line a, the two-dot chain line b, and the users A, B, C indicated by the one-dot chain line care discrete values with respect to time. However, in FIG. 6, each discrete value is complemented and displayed as a smooth line. This complementation will be described later as a fourth embodiment.
- the user C with the heat indicated by the alternate long and short dash line cfeels warm and not very comfortable, and the comfort value is about +1.
- the user B with a coldness indicated by a two-dot chain line bdoes not feel hot and feels a cold and comfortable situation, and the comfort value is about 0.
- the standard degree of comfort felt by the user Ais about 0.2, which is intermediate between the user B and the user C.
- the user C of the heat indicated by the alternate long and short dash line cfeels as a comfortable condition without being hot or cold, and the comfort value is about 0.
- the user B of the coldness indicated by the two-dot chain line bfeels cool and not very comfortable, and the comfort value is about -1.
- the standard degree of comfort felt by the user Ais about -0.5, which is intermediate between the user B and the user C.
- the manager of the air conditioning facilitycan grasp the correlation between the change in the degree of comfort value of the users A, B and C and the temperature. Then, for example, when a hot user C is seated at the seat position A-1, the air conditioning manager adjusts the set temperature of the air conditioner so that the temperature of the seat position A-1 becomes slightly lower. be able to. Conversely, when a cold user B is seated at the seat position A-1, the air conditioning manager adjusts the set temperature of the air conditioner so that the temperature of the seat position A-1 becomes slightly higher. can do.
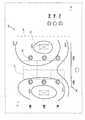
- the comfort level display device 100sets the comfort level of the user sitting at each seat position at that time on the temperature distribution in the air-conditioned space 40 indicated by the XY plane at a certain time.
- the marks showncan be superimposed and displayed on the display unit 106.
- the office desk 41 and the chair 42are disposed on the floor, and the air outlet 43 of the air conditioning facility is disposed on the ceiling.
- the air-conditioned space 40is partitioned by a partition 44.
- a face markindicating the degree of comfort of the user is displayed. In FIG. 7, the smile mark indicates that the user feels comfortable.
- the smile markcorresponds to the range of the comfort value of the user at the seat position of -0.5 to +0.5.
- the mark of the unpleasant face which is lowered at both ends of the mouthindicates that the user at the seat position feels warm or cool. In other words, the mark of the unpleasant face indicates that the user feels uncomfortable.
- the offensive face markcorresponds to a comfort value above +1.5 or a comfort value below -1.5.
- the mark of the normal faceindicates that the user feels somewhat warm or slightly cool in the middle of these. In other words, a normal facial mark indicates that the user feels between comfort and discomfort, not comfort but not discomfort. Normal face marks correspond to comfort values between 0.5 and 1.5, -0.5 to -1.5.
- the air conditioning managercan easily determine which position in the air conditioning space 40 should be adjusted based on the display shown in FIG. 7. For example, when the user at the seat position A-2 is displayed with an unpleasant face and the user is "hot", the air conditioning manager increases the amount of cold air to the vicinity of the seat position A-2 where the user sits.
- Air conditioning settingscan be adjusted. For example, the air conditioning manager can make adjustments such as changing the direction of the louver or lowering the temperature setting so that the temperature of the cold air becomes lower. Also, conversely, for example, when the user at the seat position A-2 is "cold” or "cold", the air conditioning manager reduces the amount of cold air to the vicinity of the seat position A-2 where the user sits.
- Air conditioning settingscan be adjusted. For example, the air conditioning manager can make adjustments such as changing the direction of the louver or raising the temperature setting so that the temperature of the cold air becomes high.
- the comfort degree display device 100displays the comfort degree value and the environmental data value on the display unit 106 in a superimposed manner, the air conditioning manager can associate the comfort degree with the environmental data. It can be easily grasped. For this reason, the comfort degree display device 100 according to the present embodiment enables the air conditioning manager to properly adjust the air conditioning equipment.
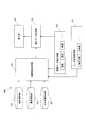
- the comfort degree display device 200 of the second embodimentwill be described with reference to FIGS. 8 and 9. Moreover, the comfort degree display apparatus 250 of 3rd Embodiment is demonstrated, referring FIG.10 and FIG.11. Thereafter, display examples of the comfort degree display devices 200 and 250 will be described with reference to FIGS. 12 to 15.
- a basic statistic calculation unit 207is added to the comfort degree display device 100 described with reference to FIG. 1.
- the preference storage unit 201, the attribute storage unit 202, the environment data value acquisition unit 203, the comfort value generation unit 204, and the display unit 206, which constitute the comfort degree display device 200,are the comfort degree display devices described with reference to FIG.
- the preference storage unit 101, the attribute storage unit 102, the environmental data value acquisition unit 103, the comfort level value generation unit 104, and the display unit 106are the same as the ones 100, so the description will be omitted.
- the basic statistic calculation unit 207calculates the comfort value basic statistic and the environmental data value basic statistic.
- the degree-of-comfort value basic statisticis a basic statistic representing the degree-of-comfort value of the user generated by the degree-of-comfort value generation unit 204.
- the comfort value basic statistichas the following groups (1) to (5). (1) time average value or space average value of user comfort value (2) time median value or space median value of user comfort value (3) time maximum value or space maximum value of user comfort value (4 ) User's comfort value time minimum value or space minimum value (5) User's comfort value time mode value or space mode value
- the environmental data value basic statisticis a basic statistic representing the environmental data of the air-conditioned space 40 acquired by the environmental data value acquisition unit 203.
- the environmental data value basic statisticshave the following groups (6) to (10). (6) Temporal average value or spatial average value of environmental data values in air-conditioned space (7) Median time or median value of environmental data values in air-conditioned space (8) Maximum time or spatial maximum value of environmental data values in air-conditioned space Value (9) Temporal minimum value or spatial minimum value of environmental data value in air-conditioned space (10) Temporal mode value or spatial mode value of environmental data value in air-conditioned space
- a time average valueis each average value in predetermined periods, such as one day, one week, one month, etc., for example.
- the spatial average valueis an average value of the user's comfort level in the block or an average value of environmental data values in the block.
- the air-conditioned space 40 indicated by XY in FIG. 7is divided into several blocks.
- the average value of the user's comfort degree in each obtained block or the average value of the environmental data value in each blockcorresponds to the spatial average value. That is, the spatial average value is an average value in a predetermined space.
- the time median and the space medianare median values in a predetermined space for a predetermined period, respectively.
- the time maximum value and the space maximum valueare respectively maximum values in a predetermined space for a predetermined period.
- the time minimum value and the space minimum valueare respectively minimum values in a predetermined space for a predetermined period.
- the temporal mode value and the spatial mode valueare modes in a predetermined space for a predetermined period, respectively.
- the average valueis a value obtained by adding all data values and dividing the added value by the number of data.
- the mean valueis often used as an index that represents the center of the data distribution. However, if the data is close to a normal distribution, the mean value indicates the center of the data distribution, but if the distribution is biased, it may not necessarily indicate the center of the data distribution.
- the medianis the middle value when the data is arranged in ascending order.
- the modeis the value that appears most frequently in the data set. When the mean value does not indicate the center of the data distribution, the center of the data distribution may be more accurately grasped by using the median and the mode value.
- the maximum value and the minimum valueare indexes indicating the width of the spread of the data value. The maximum value and the minimum value are indexes used when finding singular points in the data.
- the display data generation unit 205calculates the comfort degree value of the user generated by the comfort degree value generation unit 204, the environmental data value of the air conditioning space 40 acquired by the environmental data value acquisition unit 203, and the basic statistic calculation unit 207 calculates. Display integrated data by combining the comfort value basic statistic representing the user comfort value and any one or more of environmental data value basic statistics representing the environmental data value of the air-conditioned space 40 Generate Then, the display data generation unit 205 outputs the generated display integrated data to the display unit 206. More specifically, the display data generation unit 205 can calculate the time average value, the space average value, the time median value, the space median value, the time maximum value, and the space maximum value of the user's comfort level value calculated by the basic statistic calculation unit 207.
- the basic statistic calculation unit 207calculates the time average value or the space average value of the comfort value generated by the comfort value generation unit 204 and the time average value of the environmental data value acquired by the environmental data value acquisition unit 203 or An example of calculating the spatial average value will be described.
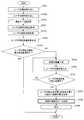
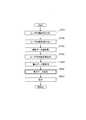
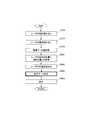
- the same steps as the operation of the comfort level display device 100 described with reference to FIG. 5will be briefly described with the same reference numerals as in FIG. 5 attached to each step.
- the degree-of-comfort value generation unit 204reads the preference and the attribute of the user, and acquires the environmental data value.
- the basic statistic calculation unit 207calculates the time average value or the space average value of the comfort value of the group (1) of the comfort value basic statistic. Further, the basic statistics calculation unit 207 calculates the time average value or the space average value of the environmental data values of the air conditioning space 40 of the group (6) of the environmental data value basic statistics in step S202 of FIG. 9.
- the display data generation unit 205calculates the user's degree of comfort value generated by the degree of comfort value generation unit 204 and the environmental data value of the air-conditioned space 40 acquired by the environmental data value acquisition unit 203.
- the time average value or the space average value of the user's comfort level value calculated by the basic statistic calculation unit 207 and any one or more of the time average value or the space average value of the environmental data value of the air conditioning space 40;Are integrated to generate display integrated data, and the generated display integrated data is output to the display unit 206.
- the display unit 206displays the display integrated data generated by the display data generation unit 205, as shown in step S106 of FIG.
- a display example of the display unit 206will be described after the description of the comfort level display device 250 of the third embodiment.
- the basic statistic calculation unit 207calculates the average value.
- the basic statistic calculation unit 207calculates the median time or the median space of the comfort values of the group (2) of the comfort value basic statistics.
- the basic statistic calculation unit 207calculates the time intermediate value or the space intermediate value of the environmental data values of the air conditioning space 40 of the group (7) of environmental data value basic statistics.
- the basic statistic calculation unit 207determines whether the group of comfort value basic statistics (3), (4) or (5) is used.
- the maximum value, the minimum value or the mode value of the comfort valueis calculated, and the maximum value of the environmental data value of the group (8), (9) or (10) of environmental data value basic statistics is calculated in step S202 of FIG. Calculate the minimum value or the mode value.
- the other operationsare the same as in the case of calculating the average value described above.
- the display part 206may combine and display the basic statistic from which a comfort degree value and an environmental data value differ.
- the basic statistic calculation unit 207calculates the time average value or the space average value of the comfort level and the time intermediate value or the space intermediate value of the environmental data values of the air conditioned space 40 and displays them on the display unit 206 You may do so.
- the display data generation unit 255 of the comfort level display device 250 of the third embodimentis a comfort level basic statistic that represents the user's comfort level value calculated by the basic statistic calculation section 257.
- the amount and any one or more of environmental data value basic statistics representative of environmental data values of the air-conditioned space 40are combined to generate statistic display data and output to the display unit 256.
- the display data generation unit 255does not combine the user comfort level value generated by the comfort level value generation unit 254 with the environmental data value acquired by the environmental data value acquisition unit 253. Therefore, the comfort degree display device 250 displays only the comfort degree value basic statistic of the comfort degree and the environmental data value basic statistic of the environmental data on the display unit 256.
- the comfort value basic statistics and environmental data values basic statisticsare, as described above, time average value, space average value, time median value, space median value, time maximum value, time maximum value, space maximum value, time The minimum value, the spatial minimum value, the temporal mode value and the spatial mode value are included.
- the basic statistic calculation unit 257calculates the time average value or the space average value of the comfort value generated by the comfort value generation unit 254 and the time average value of the environmental data value acquired by the environmental data value acquisition unit 253 or An example of calculating the spatial average value will be described.
- the preference storage unit 251, the attribute storage unit 252, the environment data value acquisition unit 253, the comfort value generation unit 254, and the display unit 256, which constitute the comfort degree display device 250,are the comfort degree described with reference to FIG.
- the preference storage unit 201, the attribute storage unit 202, the environment data value acquisition unit 203, the comfort level value generation unit 204, and the display unit 206 of the display device 200are the same as the preference storage unit 201, and thus the description is omitted. Further, the operations in steps S201 and S202 in FIG. 11 are the same as the operations in steps S201 and S202 previously shown in FIG.
- the comfort degree display device 250generates statistical quantity display data in step S204 of FIG. 11 in place of the display integrated data of step S203 of FIG. 9 (step S204).
- the display unit 256displays the statistic display data (step S106).
- FIG. 6is one of the display examples of the comfort degree display device 200 of the second embodiment.
- FIG. 6shows the temperatures at the seat position A-1 of row A and No. 1 which are specific positions of the air-conditioned space 40 shown by the XY plane in FIG. It shows the time change of the degree of comfort.
- numerical values of the average temperature of the predetermined period and the average value of the comfort value for the predetermined period for each userare displayed.
- FIG. 6shows temporal changes (the broken line a, the two-dot chain line b, and the one-dot chain line c) of the comfort values of the users A, B, and C generated by the comfort value generation unit 204.
- FIG. 6shows temporal changes (the broken line a, the two-dot chain line b, and the one-dot chain line c) of the comfort values of the users A, B, and C generated by the comfort value generation unit 204.
- FIG. 6shows temporal changes (the broken line a, the two-dot chain line
- FIG. 6the time change (solid line T) of the environmental data value of the air-conditioned space 40 which the environmental data value acquisition part 203 acquired is shown. Furthermore, in FIG. 6, the time average value of the comfort value of the users A, B, and C calculated by the basic statistic calculation unit 207 and the time average value of the temperature which is the environmental data value of the air conditioned space 40 are shown. That is, FIG.
- FIG. 6shows the time change of comfort value of users A, B and C (broken line a, two-dot chain line b, one-dot chain line c), the time change of environmental data value of air conditioning space 40 (solid line T) and user A
- FIG. 6is one of the display examples of the comfort degree display device 200 of the second embodiment.
- FIG. 7is one of the display examples of the comfort degree display device 200 of the second embodiment.
- FIG. 7shows an example in which marks indicating the degree of comfort of the user sitting at each seat position at that time are displayed superimposed on the temperature distribution in the air-conditioned space 40 indicated by the XY plane at a certain time. Further, on the right side of FIG. 7, the average temperature of the predetermined period and the average value of the comfort value of all the users in the predetermined period are displayed. Thus, in FIG. 7, the mark corresponding to the comfort value of each user generated by the comfort value generation unit 204 is shown. Moreover, in FIG. 7, the temperature distribution of the air-conditioned space 40 which the environmental data value acquisition part 203 acquired is shown. That is, FIG.
- FIG. 7shows, on the display unit 206, display integrated data in which the space average value of the comfort level values of all the users calculated by the basic statistic calculation unit 207 and the space average value of the temperature of the air conditioning space 40 are synthesized. An example of output is shown.
- FIG. 7is one of the display examples of the comfort degree display device 200 of the second embodiment.
- FIG. 12is one of the display examples of the comfort degree display device 250 of the third embodiment.
- FIG. 12shows the temperature at the seat position A-1 of row A, which is a specific position of the air-conditioned space 40 shown by the XY plane in FIG. 7 and the comfort of the users A, B and C, as in FIG. It shows daily change.
- a solid line T with a circular plotindicates a change in temperature.
- the dashed line a with a triangular plotshows the change of the standard user A comfort value.
- a two-dot chain line b with a square plotshows a change in the comfort value of the user B of “Cold”.
- a dot-dash line c with a star-shaped plotindicates a change in the comfort value of the user C of “Heat”. Similar to the example described above, the standard user A is neither “hot”, “cold” nor “cold” nor “dry skin”, but “age”, “height”, “weight”, “body fat” The rate is the user of the average value of the company.
- the cold user Bis a female user who is “cold” and “cold” and whose "body weight” and “body fat percentage” are smaller than the company's standard.
- the hot user Cis a hot user and a male user whose “body weight” and “body fat percentage” are larger than the standard of the company.
- the horizontal axisindicates each day from August 1st to August 10th.
- Each plotshows the average value of the day.
- a circular plotshows the average temperature of the day and day.
- the triangular, square and star-shaped plotsshow the average value of the comfort value of each user A, B, C of the day. Therefore, in FIG. 12, the average value of the daily comfort level of each user calculated by the basic statistic calculation unit 257 and the average daily temperature of the air conditioning space 40 as the environmental data value are synthesized. It is a display example at the time of outputting statistical quantity display data to the display part 256.
- FIG.Also, on the right side of FIG. 12, the average temperature for August in the seat position A-1 and the average comfort value for each user A, B, C for the month in August are displayed. It is done.
- a weather bar indicating the weather on that dayis provided at the bottom of the date bar.
- the change in the temperature at the seat position A-1 in row A and the degree of comfort of the users A, B and C on a daily basisis displayed.
- the daily change of the weather which is one of the environmental data valuesis displayed.
- the weather conditions representing the dayare indicated by marks such as sunny, cloudy, and rain.
- FIG. 12shows a display example of the comfort level display device 250 that displays only the average value of the comfort level and the average value of the environmental data on the display unit 256.
- the display data generation unit 205 of the comfort level display device 200combines only the average value of the comfort level and the average value of the environment data to generate statistic display data, and the generated statistic display data is displayed on the display unit 206. It may be displayed on the screen.
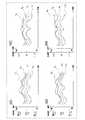
- the temperature distribution in the air conditioning space 40 at a specific day or at a specific timethere are cases where it is desirable to grasp the and the user's comfort level value. Therefore, as shown in FIG. 13, the distribution of the temperature of the air-conditioned space 40 of that day and the mark corresponding to the degree of comfort of each user may be displayed by clicking on the date portion of the date bar shown in FIG. Similar to FIG. 7, in FIG. 13, the smile mark indicates that the user feels comfortable. The smile marks correspond to comfort values ranging from -0.5 to +0.5. The offensive face mark indicates that the user feels uncomfortable.
- the offensive face markcorresponds to a comfort value greater than +1.5, or a comfort value less than -1.5. Indicates that the user feels between comfort and discomfort, not comfort but not discomfort.
- Normal face markscorrespond to comfort values between 0.5 and 1.5, -0.5 to -1.5.
- FIG. 13for example, the temperature distribution in the air-conditioned space 40 on a sunny day as in “8/1” shown in FIG. 12 and a mark corresponding to the degree of comfort of each user are shown. Further, in FIG. 13, a clear mark and a state where sunlight is incident from the window 45 are additionally displayed outside the window 45.
- FIG. 14for example, as in “8/2” shown in FIG.
- a temperature distribution in the air-conditioned space 40 on a rainy day and a mark corresponding to the degree of comfort of each userare shown.
- the correspondence between the mark corresponding to the user comfort level and the comfort levelis the same as that in FIG.
- the rain markis displayed outside the window 45. From the difference between the temperature distribution on a sunny day and the distribution of the comfort level of the user shown in FIG. 13 and the distribution of the temperature on a rainy day and the distribution of the user level shown in FIG. The adjustment of the air conditioning can be changed on rainy days.
- the distribution of the average temperature for a certain day and the distribution of the average degree of comfort for the daymay be displayed.
- FIG. 15is one of the display examples of the comfort degree display device 200 of the second embodiment.
- four table sets 55configured of four chairs 52 and one table 51 are arranged.
- the outlets 53 of the air conditioning equipmentare disposed on the respective tables 51.
- temperature distribution in such an air conditioned space 50, a user's comfort degree, and average comfort degreeare displayed.
- the table set 55is arranged in two rows of A and B, and two rows of No. 1 and No. 2.
- the numbers in the middle of each chair 52indicate the comfort value of the user at each chair 52 position.
- the number in the center of the table 51displays the average value of the comfort levels of the four users of one table 51 as the representative comfort level of the table set 55.
- the display of FIG. 15is effective, for example, when the air conditioning manager adjusts the air conditioning equipment so that the representative comfort value of the table set 55 becomes zero.
- the comfort degree display devices 200 and 250superimpose and display the time average value which is a comfort degree value basic statistic and the time average value which is an environmental data value basic statistic. For this reason, the air conditioning manager can grasp the tendency of the degree of comfort and the relation with the environmental data, and can easily judge the necessity for replacement, addition, etc. of the air conditioning equipment. Moreover, the comfort degree display devices 200 and 250 superimpose and display the space average value of the comfort degree value and the space average value of the environmental data value. For this reason, the air conditioning manager can grasp the tendency of the spatial relevance with the comfort and the environmental data, and the building facilities such as replacement of the air conditioning equipment in a specific area of the air conditioning space 40, 50 and partitions can be added. The need for installation can be easily determined.
- comfort degree display devices 200 and 250can calculate the median, the maximum value, the minimum value or the mode value instead of the average value, and can display the calculated value. Thereby, management of the air conditioning installation of an air conditioning manager and utilization of a user's air conditioning installation can be made easy.
- the comfort degree display device 300 of the fourth embodimentwill be described with reference to FIGS.
- a complementing unit 307is added to the comfort degree display device 100 described with reference to FIG. 1.
- the preference storage unit 301, the attribute storage unit 302, the environment data value acquisition unit 303, the comfort value generation unit 304, and the display unit 306, which constitute the comfort degree display device 300are the comfort degree display devices described with reference to FIG. Since the preference storage unit 101, the attribute storage unit 102, the environmental data value acquisition unit 103, the comfort level value generation unit 104, and the display unit 106 are the same as the 100, the description will be omitted.
- the complementing unit 307 shown in FIG. 16complements the user's comfort level, which is a discrete value generated by the comfort level generating unit 304, and calculates a continuous value for time or space.
- the complementing unit 307complements the environmental data value of the air conditioning space 40, which is a discrete value acquired by the environmental data value acquiring unit 303, and calculates a continuous value for time or space.
- the display data generation unit 305is configured to connect either the user comfort level to the time or space, and the environment data value of the air-conditioned space 40 to the time or space.
- the continuous display datais generated by combining with one of the values.
- the comfort degree display device 300complements the temperature which is a discrete value with respect to time and the comfort degree value of each user Display as a smooth curve.
- the displayis easily viewed by making the discrete data a continuous line by complementation, and it is possible for the air conditioning manager to grasp the relevance between the comfort level and the environmental data more easily. it can.
- FIG. 18the comfort level display device 400 of the fifth embodiment will be described with reference to FIGS. 18 to 20.
- FIG. 18is a schematic diagram of the comfort level display device 400 of the fifth embodiment.
- an abnormality detection unit 407is added to the comfort degree display device 100 shown in FIG. 1.
- the preference storage unit 401, the attribute storage unit 402, the environment data value acquisition unit 403, the comfort value generation unit 404, and the display unit 406, which constitute the comfort degree display device 400,are the comfort degree display devices described with reference to FIG. Since the preference storage unit 101, the attribute storage unit 102, the environmental data value acquisition unit 103, the comfort level value generation unit 104, and the display unit 106 are the same as the 100, the description will be omitted. Further, in FIGS. 19 and 20 showing the operation of the comfort level display device 400, the same steps as the operations of the comfort level display device 100 described with reference to FIG. Description of is omitted.
- the abnormality detection unit 407 illustrated in FIG. 18detects an abnormality when the comfort degree value of the user is not within the comfort limit range, and outputs abnormal data.
- the comfort limit rangeis a limit range that feels warm or cool.
- the comfort limit rangeis ⁇ 2.0 ⁇ comfort value ⁇ 2.0. If the degree of comfort value falls below -2.0 or exceeds 2.0, the abnormality detection unit 407 may determine that the degree of comfort value of the user is not within the comfort limit range.
- Exceeding the comfort limit rangeis equivalent to about 70% or more of people feeling uncomfortable.
- the comfort limit rangemay be set to ⁇ 1.5 ⁇ comfort value ⁇ 1.5.
- the abnormality detection unit 407generates the comfort level value generation unit 404 when the comfort level value generated by the comfort level value generation unit 404 is not within the comfort limit range described above. Determine the comfort level as an outlier. Then, the abnormality detection unit 407 proceeds to step S402 in FIG. 19 and detects an abnormality. Further, the abnormality detection unit 407 outputs abnormal data as shown in step S403 of FIG. Then, as shown in step S404 of FIG. 19, the display data generation unit 405 outputs the abnormal data output from the abnormality detection unit 407, the user's comfort level value generated by the comfort level generation unit 404, and the air conditioning space 40. Anomaly display data are generated by combining with environmental data values. Then, as shown in step S106 of FIG. 19, the display unit 406 displays the abnormality display data.
- FIG. 12is one of the display examples of the comfort level display device 250 of the third embodiment, but an exclamation point in a triangle in FIG. 12!
- the part of the mark (attention mark) which displayedis a display example of the comfort degree display device 400.
- the caution mark displayed on the display unit 406corresponds to the abnormal data output from the abnormality detection unit 407.
- the display data generation unit 405is based on the abnormal data output from the abnormality detection unit 407, and the comfort value among the user's comfort degree values generated by the comfort degree value generation unit 404.
- Anomaly identification display datamay be created in which the comfort value exceeding the limit value range can be distinguished from other comfort values.
- the display data generation unit 405may generate abnormality identification display data in which a plot indicating the target comfort level is displayed in a blinking manner.
- the display data generation unit 405 of the comfort degree display device 400can identify abnormality identification display data that can distinguish the comfort degree value of the user whose abnormality is detected by the abnormality detection unit 407 with the comfort degree value of another user.
- the comfort degree value and the environmental data value of the air conditioning space 40may be synthesized and generated.
- the comfort degree display device 400causes the display unit 406 to display a caution mark indicating that the comfort degree value is an abnormal value, or causes the air conditioning manager to be offensive by displaying the plot in a blinking manner. Early on, and can adjust the air conditioning equipment early.
- the comfort degree display device 500has a type-by-type recommended region generation unit 507 instead of the comfort degree value generation unit 104 of the comfort degree display device 100 shown in FIG. 1.
- the environmental data value acquiring unit 503 and the display unit 506 constituting the comfort degree display device 500are the same as the environmental data value acquiring unit 103 and the display unit 106 of the comfort degree display device 100 described with reference to FIG. 1.
- the preference storage unit 501 and the attribute storage unit 502 shown in FIG. 21are the same as the preference storage unit 101 and the attribute storage unit 102 shown in FIG. 1, respectively, the user preference database 901 shown in FIG. 3 and the user attribute database 902 shown in FIG. It is stored. Furthermore, the preference storage unit 501 stores, in the user preference database 901, the preference for the air conditioning environment of the reference user classified by type. Further, the attribute storage unit 502 stores the attributes of the reference user classified by type in the user attribute database 902.
- the type-based reference useris a standard person in each type of user represented by “Heat”, “Cold”, etc., and is an assumed person.
- attributessuch as age, height, weight, body fat percentage, etc. are the average value or median value of the company, and "Heat” is registered in the preference. It is a user.
- attributessuch as age, height, weight, and body fat percentage are the average value or median of the company, and "Cold” is registered in the preference Such a user.
- the type-specific recommended area generation unit 507generates the type-based reference user comfort value for each area of the air-conditioned space 40.
- the type classified recommended area generation unit 507designates an area in which the degree of comfort value of the type classified reference user is in the predetermined range as the type classified recommended area.
- the predetermined rangeis, for example, a range of a degree of comfort value that a person of about 90% or more feels comfortable.
- the predetermined rangemay be a range of ⁇ 0.5 ⁇ comfort value ⁇ 0.5.
- the display data generation unit 505combines the type recommendation area and the environmental data value of the air conditioning space 40 to generate type recommendation area display data, and outputs the generated type recommendation area display data to the display unit 506. .
- the type-by-type recommended area generation unit 507sets an area in the air-conditioned space 40 in which the degree of comfort value is calculated, as shown in step S501 in FIG.
- the type-specific recommended area generation unit 507divides the air-conditioned space 40 represented by XY shown in FIG. 7 into lattice-like areas, for example, and sets the area obtained by the division as an area for calculation of the comfort value.
- the type-by-type recommended area generation unit 507may set, for example, an area in which the degree of comfort value is calculated for each seat position centering on the position of the chair 42.
- the type-by-type recommended area generation unit 507sets, for example, an area for calculating the comfort level, with the area around seat position A-1 as area 1 and the area around seat position A-2 as area 2. May be
- the type-by-type recommendation area generation unit 507reads out the preference of the type-based reference user from the preference storage unit 501, as shown in step S502 of FIG.
- the type-specific recommended area generation unit 507reads the preference of the user specified as “heat” from the user preference database 901.
- the type-by-type recommendation area generating unit 507reads out the attribute of the type-based reference user from the attribute storage unit 502, as shown in step S503 of FIG.
- datasuch as average weight and body fat percentage of the company are read out from the user attribute database 902.
- the type-specific recommended area generation unit 507makes environmental data such as temperature, humidity, wind speed, radiation temperature, etc. of the setting area in the air conditioning space 40 from the environmental data value acquisition unit 503 Get the value.
- the type-by-type recommendation region generating unit 507proceeds to step S504 in FIG. 22 and generates the type-based reference user comfort value in the setting region.
- the type-specific recommended area generation unit 507sets the four physical quantities of the temperature, humidity, wind speed, and radiation temperature of the set area acquired from the environmental data value acquisition unit 503 in step S103 of FIG.
- the standard human PMV in the setting areais calculated by the equation (2) using the typical human clothes amount and exercise amount.
- the type-by-type recommendation area generation unit 507uses the preferences by type user and the attributes by type preference read out from the preference storage unit 501 and the attribute storage unit 502 and uses the attributes by formulas (1), (3), and (4) Generate a user comfort value.
- the type-by-type recommendation region generating unit 507proceeds to step S505 shown in FIG. 22, and determines whether or not the generated comfort value of the type-based reference user is within a predetermined range. Then, if the comfort level value of the type-based reference user is within the predetermined range, the type-by-type recommended area generation unit 507 determines YES in step S505 of FIG. 22 and proceeds to step S506 of FIG. Then, the type-by-type recommendation area generation unit 507 incorporates the set calculation area into the type-by-type recommendation area, and proceeds to step S507 in FIG.
- step S505 in FIG. 22the type-by-type recommendation area generation unit 507 proceeds to step S507 in FIG. 22 without incorporating the set calculation area in the type-by-type recommendation area.
- step S507 in FIG. 22the type-specific recommended area generation unit 507 determines whether the calculation of the entire area of the air-conditioned space 40 is completed. If the calculation of all the areas is not completed, the type-by-type recommended area generation unit 507 returns to step S501 in FIG. 22 and repeatedly executes steps S501 to S506.
- step S508 in FIG. move onthe generation of the type recommendation area generation unit 507 ends the generation of the degree of comfort value of the type standard user and the determination as to whether or not it can be incorporated into the type recommendation area in all the areas of the air conditioning space 40.
- the display data generation unit 505combines the recommended area classified by type and the environmental data value of the air-conditioned space 40 in step S508 of FIG. Is output to the display unit 506.
- the display unit 506displays this type of recommended area display data.
- FIG. 23is a display example of the display unit 506 of the comfort degree display device 500.
- the range in which the type-specific reference user feels comfortable and the temperature distribution of the air-conditioned space 40are displayed in a superimposed manner.
- the diagonally hatched area shown in FIG. 23corresponds to the temperature range of 25.5 ° C. to 26.5 ° C., and shows the “hot” type type reference criteria user feels comfortable.
- the cross hatching area shown in FIG. 23corresponds to the area of 26.5 ° C. to 27.5 ° C., and indicates the area that the user classified by type of “cold” type feels comfortable.
- the comfort degree display device 500displays the recommended area according to types such as heat type, cold type, etc., so that the user can be prompted to view the display and move to a desired place. For example, when a user may be seated at any place as in a free address office, the overall comfort and productivity can be improved if each person is seated according to his / her preference.
- the comfort degree display device 550 of the seventh embodimentwill be described with reference to FIG. The same parts as in the comfort degree display device 500 described with reference to FIG.
- a destination display unit 508is added to the comfort degree display device 500 described with reference to FIG.
- the destination display unit 508can display the type recommendation area by projection mapping or augmented reality. Thereby, the comfort degree display device 550 can recommend the movement to the user more effectively.
- the degree of comfort display device 600 shown in FIG. 25has a user-by-user recommended region generation portion 607 instead of the degree of comfort value generation portion 104 of the degree of comfort display device 100 shown in FIG.
- the preference storage unit 601, the attribute storage unit 602, the environment data value acquisition unit 603, and the display unit 606, which constitute the comfort degree display device 600,are the preference storage portion 101 of the comfort degree display device 100 described with reference to FIG. Similar to the storage unit 102, the environmental data value acquisition unit 103, and the display unit 106.
- the user-by-user recommendation area generation unit 607sets an area in the air-conditioned space 40 where the calculation of the degree of comfort value is performed, as in the comfort degree display device 500 described above.
- the user classified recommended region generation unit 607reads the preference and attribute of a specific user from the preference storage unit 601 and the attribute storage unit 602.
- the user-specific recommended area generation unit 607receives environmental data such as temperature, humidity, wind speed, radiation temperature, etc. of the setting area in the air conditioning space 40 from the environmental data value acquisition unit 603. Get the value.
- the user-by-user recommendation area generation unit 607proceeds to step S104 in FIG. 26, and generates a comfort value of a specific user in the setting area. More specifically, the user-specific recommended area generation unit 607 performs four physical quantities of temperature, humidity, wind speed, and radiation temperature of the setting area acquired from the environmental data value acquisition unit 503 in step S103 of FIG.
- the PMV of a specific user in the set areais calculated by the equation (2) using the standard amount of clothes and exercise amount of
- the user-specific recommended region generation unit 607may use, as the amount of clothing, a value estimated from the temperature difference between the temperature of the skin of the specific user measured by the thermo camera and the temperature of the clothing. Further, the user-by-user recommended region generation unit 607 may use a value obtained by analyzing an image of a monitoring camera or the like as the amount of exercise.
- the user-specific recommended area generation unit 607uses the preferences and attributes of the specific user read out from the preference storage unit 501 and the attribute storage unit 502, and uses the attributes (1), (3), and (4). Generate comfort value.
- the user-by-user recommendation area generation unit 607proceeds to step S602 shown in FIG. 26, and determines whether or not the generated comfort value of the specific user is within the predetermined range. Then, when the comfort value of the specific user is within the predetermined range, the user-by-user recommendation area generation unit 607 determines YES in step S602 of FIG. 26, and proceeds to step S603 of FIG. Then, the user recommendation area generation unit 607 incorporates the set calculation area into the user recommendation area, and proceeds to step S604 in FIG.
- step S602 in FIG. 26the user recommendation area generation unit 607 proceeds to step S604 in FIG. 26 without incorporating the set calculation area into the user recommendation area.
- step S 604 in FIG. 26the user classified recommended area generation unit 607 determines whether the calculation of the entire area of the air-conditioned space 40 is completed, and when the calculation of all the areas is not completed, the step in FIG. The process returns to step S601 to repeatedly execute steps S601 to S603.
- step S605when the user-specific recommended area generation unit 607 finishes the generation of the degree of comfort of the specific user and the determination as to whether or not it can be incorporated into the user-specific recommended area in all areas of the air-conditioned space 40, the process proceeds to step S605 in FIG.
- the display data generation unit 605combines the user-preferred area and the environmental data value of the air-conditioned space 40 in step S605 of FIG. 26 to generate the user-preferred area display data, and generates the user-preferred area display data Is output to the display unit 606.
- the display unit 606displays the user-specific recommended area display data.
- FIG. 23 described aboveis also a display example of the display unit 606 of the comfort degree display device 600.
- the diagonally hatched area shown in FIG. 23indicates an area where the specific user C of "Heat” feels comfortable.
- the cross hatching area shown in FIG. 23indicates an area where the specific user B of “Cold” feels comfortable.
- the comfort degree display device 600automatically recommends which place in the air-conditioned space 40 the particular user should go in consideration of the preferences and attributes of the particular user. Therefore, the user can easily move to a comfortable position without confirming the display etc. of the display 27.
- the comfort level display device 650 of the ninth embodimentwill be described with reference to FIG.
- a destination display portion 608is added to the comfort degree display device 600 described with reference to FIG.
- the destination display unit 608can display the user-by-user recommendation area by projection mapping or augmented reality. Thereby, the comfort degree display device 650 can recommend the movement to the user more effectively.
- FIG. 28a comfort level display device 700 of the tenth embodiment will be described with reference to FIGS. 28 to 30.
- FIG. 28in the comfort degree display device 700, a user state acquisition unit 707 and a recommended action generation unit 708 are added to the comfort degree display device 100 described with reference to FIG.
- the preference storage unit 701, the attribute storage unit 702, the environment data value acquisition unit 703, and the display unit 706, which constitute the comfort degree display device 700,are the preference storage portion 101 of the comfort degree display device 100 described with reference to FIG. The same as the storage unit 102, the environmental data value acquisition unit 103, and the display unit 106.
- the user state acquisition unit 707acquires a current state amount such as a current clothes amount and exercise amount of a specific user, and a current position of the specific user.
- the user state acquisition unit 707may acquire, for example, a value obtained from the temperature difference between the temperature of the skin measured by the thermo camera and the temperature of the clothes as the amount of clothes.
- the user state acquisition unit 707may acquire, as the amount of exercise and the current position, values obtained by analyzing the image of the monitoring camera.
- the degree-of-comfort value generation unit 704includes the preference of the user stored in the preference storage unit 701, the attribute of the user stored in the attribute storage unit 702, and the environmental data value of the air conditioning space 40 acquired by the environmental data value acquisition unit 703. Based on the current state quantity of the user acquired by the user state acquisition unit 707 and the current position of the user, a current comfort value indicating the current comfort of the user is generated. Then, the comfort degree value generation unit 704 outputs the generated current comfort degree value to the display data generation unit 705 and the recommended action generation unit 708.
- the recommended behavior generation unit 708determines the change state amount of the user whose comfort value falls within the predetermined range when the current comfort value input from the comfort value generation unit 704 is not within the predetermined range. Specifically, the recommended action generation unit 708 changes the user's state quantity from the current state quantity until the user's comfort level falls within the predetermined range, and the user's preference, the user's attributes, and the environment of the air-conditioned space 40 By repeating the operation of generating the user's comfort level value based on the data value and the current position of the user, the user's change state amount in which the user's comfort level value falls within the predetermined range is determined. Then, the recommended action generation unit 708 generates the recommended action of the user based on the difference between the current state amount of the user and the change state amount.
- the display data generation unit 705is generated by the user's current comfort degree value generated by the comfort degree value generation unit 704, the environmental data value of the air conditioning space 40 acquired by the environmental data value acquisition unit 703, and the recommended action generation unit 708
- the recommended action display datais generated by combining with the recommended action. Then, the display data generation unit 705 outputs the generated recommended action display data to the display unit 706.
- the comfort value generation unit 704reads the user's preferences and attributes from the preference storage unit 701 and the attribute storage unit 702, and the temperature of the air conditioning space 40 from the environment data value acquisition unit 703. , Environmental data values such as humidity and wind speed. Further, as shown in steps S701 and S702 in FIG. 29, the comfort level value generation unit 704 acquires the current amount of state such as the amount of clothes and exercise amount of the current user from the user state acquisition unit 707 and the current position of the user. Do.
- the degree-of-comfort value generation unit 704generates the current degree of comfort of the user. Specifically, the comfort level value generation unit 704 calculates the four physical quantities of the temperature, humidity, wind speed, and radiation temperature of the air conditioning space 40 acquired from the environment data value acquisition unit 703 in step S103 of FIG.
- the current PMV of the useris calculated by equation (2) using the current clothing amount and exercise amount of the user acquired in S701.
- the comfort level value generation unit 704uses the preferences and attributes of the user read out from the preference storage unit 701 and the attribute storage unit 702 in steps S101 and S102 of FIG. To generate the current comfort value of the user. Then, the generated current comfort value of the user is output to the recommended behavior generation unit 708 and the display data generation unit 705.
- the recommended action generation unit 708determines whether the current comfort degree value of the user input from the comfort degree value generation unit 704 is within the predetermined range, as shown in step S704 of FIG.
- the predetermined rangeis, for example, a range of a degree of comfort value that a person of about 90% or more feels comfortable, and may be a range of ⁇ 0.5 ⁇ a degree of comfort value ⁇ 0.5.
- the processproceeds to step S705 in FIG. 29, and changes the state amount of the user from the current state amount. For example, when the amount of clothes of the user is larger than the standard amount of clothes, the recommended action generation unit 708 reduces the amount of clothes. Conversely, when the amount of clothes is smaller than the standard amount of clothes, the recommended action generation unit 708 increases the amount of clothes. Then, the recommended action generation unit 708 reads the preference and attribute of the user from the preference storage unit 701 and the attribute storage unit 702 in step S706 in FIG. 29, and the temperature, humidity, and wind speed of the air conditioning space 40 from the environment data value acquisition unit 703. The environmental data value such as is acquired, the user's comfort level value is generated using the changed state quantity which is the changed user's state quantity, and the process proceeds to step S 707 in FIG. 29.
- the recommended behavior generation unit 708determines whether the user comfort value generated in step S706 is within the predetermined range in step S707 of FIG. If NO in step S707 of FIG. 29, the recommended action generation unit 708 returns to step S705 in FIG. 29, changes the state amount of the user, and generates the user's comfort level value in step S706. Thus, the recommended behavior generation unit 708 repeatedly changes the state quantity of the user until the comfort value of the user falls within the predetermined range, and generates the comfort value of the user. Then, if the recommended action generation unit 708 determines YES in step S707 in FIG. 29, the process proceeds to step S708 in FIG. 29, and determines the user's change state amount. Then, in step S709 in FIG. 29, the recommended action generating unit 708 generates a recommended action based on the difference between the current state amount of the user acquired in step S701 and the change state amount of the user determined.
- the recommended action generation unit 708generates a recommended action of "Get up and try exercise. Get warm.”
- the display data generation unit 705receives environmental data values such as temperature and humidity acquired from the environmental data value acquisition unit 703 and the user's current comfort input from the comfort level generation unit 704. The degree value and the recommended action input from the recommended action generation unit 708 are combined to generate recommended action display data. Then, the display data generation unit 705 outputs the generated recommended action display data to the display unit 706. The display unit 706 displays the recommended action display data, as shown in step S106 of FIG.
- the recommended action display data displayed by the display unit 706will be described with reference to FIG.
- a mark corresponding to the current comfort degree value of the useris superimposed on the temperature distribution of the air-conditioned space 40 as in FIG.
- the wording of the recommended action for the useris superimposed.
- the useris sitting at the seat position B-1, and the temperature near the seat position is about 28.5.degree.
- the user's current comfort valueis +2.0, and the user feels warm (the mark is indicative of discomfort when the mouth is lowered).
- the useris wearing a coat. Then, it is recommended that the user take the jacket off by displaying the recommendation message "It will cool if you take off the jacket" in the upper right as a recommended statement.
- the comfort degree display device 700recommends an action that improves the user's comfort based on the current position of the user and the current state quantity, and thus can improve the user's comfort and productivity.
- the comfort level display device 580 of the eleventh embodimentwill be described with reference to FIG.
- the comfort degree display device 500 described with reference to FIG. 21is the same as the comfort degree value generation unit 104 of the comfort degree display device 100 described with reference to FIG.
- the degree-of-comfort value generator 504is added.
- the operation of the type-specific recommended region generation unit 507is the same as the operation of the comfort level display device 500 described with reference to FIG.
- the display data generation unit 505 of the comfort degree display device 580includes the user comfort degree value generated by the comfort degree value generation unit 504, the type classified recommended area generated by the type classified recommended area generation unit 507, and the environmental data value acquiring unit The environmental data value of the air-conditioned space 40 acquired in 503 is combined to generate type-by-type recommended area display data. Then, the display data generation unit 505 outputs the generated type-by-type recommended area display data to the display unit 506.
- FIG. 32A display example of the display unit 506 of the comfort degree display device 580 is shown in FIG. In FIG. 32, the range in which the type-specific reference user feels comfortable, the temperature distribution of the air-conditioned space 40, and the mark corresponding to the comfort value of each user are superimposed.
- the hatched area shown in FIG. 32corresponds to the temperature range of 25.5 ° C. to 26.5 ° C., and indicates the area that the type-based standard user of the “Heat” type feels comfortable.
- the cross hatching area shown in FIG. 32corresponds to the temperature range of 26.5 ° C. to 27.5 ° C., and shows an area where the “cold” type type standard feels comfortable.
- the comfort degree display device 580has the same function and effect as the comfort degree display device 500.
- the comfort level display device 680 of the twelfth embodimentwill be described with reference to FIG. As shown in FIG. 33, in the comfort degree display device 680, the comfort degree display device 600 described with reference to FIG. 25 is similar to the comfort degree value generation unit 104 of the comfort degree display device 100 described with reference to FIG. The degree-of-comfort value generator 604 is added. The operation of the user-by-user recommendation area generation unit 607 is the same as the operation of the comfort level display device 600 described with reference to FIG.
- the display data generation unit 605 of the comfort degree display device 680includes the user comfort degree value generated by the comfort degree value generation unit 604, the user recommended area generated by the user recommended area generation unit 607, and the environmental data value acquisition unit The environmental data value of the air-conditioned space 40 acquired in 603 is combined to generate user-by-user recommended area display data. Then, the display data generation unit 605 outputs the generated user-by-user recommendation area display data to the display unit 606.
- the user recommended region display datais displayed on the display unit 606 of the comfort degree display device 680 as shown in FIG.
- the hatched area shown in FIG. 32indicates an area where the specific user C of "Heat” feels comfortable.
- the cross hatching area shown in FIG. 32indicates an area where the specific user B of “Cold” feels comfortable.
- the comfort degree display device 680has the same function and effect as the comfort degree display device 600.
- the comfort level display device 800 of the thirteenth embodimentwill be described with reference to FIG. As shown in FIG. 34, in the comfort degree display device 800, an area information storage unit 808 is added to the comfort degree display device 100 described with reference to FIG. In addition, the comfort degree display device 800 replaces the comfort degree value generation unit 104, the environmental data value acquisition unit 103, and the display data generation unit 105, and the area comfort degree value generation unit 804, the area environmental data value acquisition unit 803, and the area display A data generation unit 805 and a display unit 806 are included.
- the comfort degree display device 800displays area comfort degree values and area environmental data values for a plurality of areas 451 to 454 of the air-conditioned space 40.
- the air-conditioned space 40is, for example, one floor of a building, and the areas 451 to 454 are parts of the floor.
- Office desks 411 to 414 and chairs 421 to 424are arranged on the floor of each of the areas 451 to 454, and air outlets 431 to 434 of the air conditioning equipment are arranged on the ceiling.
- the area information storage unit 808stores configuration information of the areas 451 to 454.
- the configuration information of the areas 451 to 454includes information on the position and size of the areas 451 to 454 such as the position and size of each area. Further, the configuration information of the areas 451 to 454 includes information on the arrangement of the air conditioners, indoor units, temperature sensors, humidity sensors, anemometers and the like arranged in the areas 451 to 454. Further, the configuration information of the areas 451 to 454 includes the arrangement of the desks of the areas 451 to 454 and information specifying the user sitting there, for example, information such as name and employee number.
- the area environment data value acquiring unit 803refers to the configuration information of the areas 451 to 454 stored in the area information storage unit 808 in step S801 in FIG. Acquire every time.
- the area comfort value generation unit 804is, in step S802 in FIG. 35, the user preference read out from the preference storage unit 101 in step S101 in FIG. 35 and the user attribute read out from the attribute storage unit 102 in step S102 in FIG. Based on the area environmental data value acquired by the area environmental data value acquiring unit 803 and the area environmental data value acquired by the area environmental data value, the area comfort value indicating the comfort in the areas 451 to 454 of the user is generated.
- the method of generating the area comfort degreeis the same as the method of generating the comfort degree display device 100 described above.
- step S 803 in FIG. 35the area display data generation unit 805 generates the area comfort value of the user generated by the area comfort value generation unit 804 and the area environmental data value acquired by the area environmental data value acquisition unit 803. Synthesize to generate area display data.
- the display unit 806displays one or more area display data in step S804 of FIG.
- FIG. 36shows an example of display on the display unit 806.
- FIG. 36shows the degree of comfort of the user sitting at each seat position of each area 451 to 454 at that time on the temperature distribution of each area 451 to 454 in the air-conditioned space 40 indicated by the XY plane at a certain time. The example which piled up the mark which shows is shown.
- the data in FIG. 36is displayed on the display unit 806.
- face marks indicating the degree of comfort of the userare displayed at the centers of the respective chairs 421 to 424. With such a display, at a certain time, how temperatures are distributed in each area 451 to 454 of the air-conditioned space 40 and how each user of each area 451 to 454 feels easily it can.
- the air conditioning managercan easily determine how to adjust the set temperature for each of the areas 451 to 454 in the air conditioning space 40.
- FIG. 37shows another display example of the display unit 806.
- FIG. 37shows the change in temperature at each specific position of each of the areas 451 to 454 in the air-conditioned space 40 shown in FIG. 36 and the change in time of the degree of comfort of the user.
- office desks 411 to 414 and chairs 421 to 424are arranged in three rows from No. 1 to No. 3 in two rows of row A and row B, respectively.
- solid lines T1 to T4showing temporal changes in temperature at the seat position of row A are shown for each of the areas 451 to 454 of the air-conditioned space 40 shown in FIG. Further, in FIG.
- broken lines a1 to a4indicating the comfort levels of the standard users A1 to A4, two-dot chain lines b1 to b4 indicating the comfort levels of the cold users B1 to B4, and the heat users C1 to C4.
- the dashed-dotted line c1 to c4indicating the degree of comfort of C4 is shown.
- the air conditioning managercan grasp the correlation between the change in the degree of comfort value of the users A1 to A4, B1 to B4 and C1 to C4 and the temperature for each of the areas 451 to 454. It is possible to adjust the set temperature of the air-conditioning equipment of ⁇ 454.
- the comfort level display device 800generates area display data by combining the area comfort value of the user for each of the areas 451 to 454 with the area environment data value, and generates the generated area display data. Display Therefore, the air conditioning manager can grasp the tendency of the relationship between the comfort and the environmental data for each of the areas 451 to 454 and easily judge the necessity of replacement or addition of the air conditioning equipment for each area. it can.
- an area basic statistic calculation unit 817is added to the comfort degree display device 800 described with reference to FIG.
- the preference storage unit 101, the attribute storage unit 102, the area environment data value acquisition unit 803, the area comfort value generation unit 804, and the display unit 806, which constitute the comfort degree display device 800,are the comfort degrees described with reference to FIG. The description is omitted because it is the same as the display device 800.
- the area basic statistic calculation unit 817calculates an area comfort value basic statistic and an area environmental data value basic statistic.
- the area comfort value basic statisticis a basic statistic representing the area comfort value of the user generated by the area comfort value generation unit 804, and has the following groups (1) to (5): ing. (1) user's area comfort value time average value or space average value (2) user's area comfort value time median value or space median value (3) user area comfort value time maximum value or space maximum value Value (4) The time minimum value or the space minimum value of the area comfort value of the user (5) the time mode or the space mode of the area comfort value of the user
- the area environmental data value basic statisticis a basic statistic representing the area environmental data of each area 451 to 454 of the air-conditioned space 40 acquired by the area environmental data value acquisition unit 803, and the following (6) to (10 Have a group of).
- (6)Time average value or space average value of area environmental data value (7)
- Time median value or space median value of area environmental data value(8)
- Time maximum value or space maximum value of area environmental data value(9)
- Area environment valueTemporal minimum value or spatial minimum value of data value (10)
- Area environmental data value temporal mode or spatial mode valueis a basic statistic representing the area environmental data of each area 451 to 454 of the air-conditioned space 40 acquired by the area environmental data value acquisition unit 803, and the following (6) to (10 Have a group of).
- (6)Time average value or space average value of area environmental data value (7)
- Time median value or space median value of area environmental data value(8)
- Time maximum value or space maximum value of area environmental data value(9)
- Area environment valueTemporal minimum value or spatial minimum value of data value (10)
- the time average valueis each average value in a predetermined period such as one day, one week, one month, etc. of each of the areas 451 to 454, for example.
- the space average valueis an average value of the user's comfort level in each of the areas 451 to 454 of the air-conditioned space 40 or an average value of environmental data values in the areas 451 to 454. That is, the spatial average value is an average value in each of the areas 451 to 454.
- time median and the space medianare medians in the areas 451 to 454, respectively.
- the time maximum value and the space maximum valueare the maximum values in the respective areas 451 to 454, respectively.
- the time minimum value and the space minimum valueare respectively the minimum values in the areas 451 to 454.
- the temporal mode value and the spatial mode valueare modes in the areas 451 to 454, respectively.
- the area display data generation unit 815generates the area comfort value of the user generated by the area comfort value generation unit 804 and the area environment data of each area 451 to 454 of the air-conditioned space 40 acquired by the area environment data value acquisition unit 803.
- Area and area comfort value representing the area comfort value of the user calculated by the area basic statistic calculation unit 817 and area environment data representing each area environmental data value of each area 451 to 454 of the air conditioning space 40Data value basic statistics are combined with any one or more to generate display integrated data. Then, the area display data generation unit 815 outputs the generated display integrated data to the display unit 806.
- the area display data generation unit 815calculates the time average value, the space average value, the time median value, the space median value, the time maximum value of the area comfort value of the user calculated by the area basic statistic calculation unit 817 Spatial maximum value, temporal minimum value, spatial minimum value, temporal mode value, spatial mode value, temporal average value of area environmental data values of areas 451 to 454, spatial average value, temporal median value, temporal median value, temporal maximum value Display combined area comfort value and area environmental data value with any one or more of value, space maximum value, time minimum value, space minimum value, time mode, space mode, etc. Generate integrated data. Then, the area display data generation unit 815 outputs the generated display integrated data to the display unit 806.
- the area basic statistic calculation unit 817calculates the time average value or the space average value of the area comfort value generated by the area comfort value generation unit 804 and the area environmental data value acquired by the area environmental data value acquisition unit 803.
- An example of calculating a time average value or a space average value of The same steps as in the operation of the comfort level display device 800 described with reference to FIG. 35will be assigned the same reference numerals as in FIG. 35 for each step, and the description will be omitted.
- the area basic statistic calculation unit 817calculates a time average value or a space average value of the comfort levels of the group (1) of the area comfort level basic statistics. In addition, the area basic statistics calculation unit 817 calculates the time average value or the space average value of the area environmental data values of the areas 451 to 454 of the group (6) of the area environmental data values basic statistics in step S811 in FIG. Do.
- the area display data generation unit 815generates the area comfort value of the user generated by the area comfort value generation unit 804 and the areas 451 to 454 acquired by the area environmental data value acquisition unit 803. And the time average value or space average value of the area comfort value of the user calculated by the area basic statistics value calculation unit 817 and the time average value or space average value of the area environmental data values of the areas 451 to 454 And one or more of them together to generate area display integrated data.
- the area display data generation unit 815outputs the generated area display integration data to the display unit 806. Then, the display unit 806 displays the area display integrated data generated by the area display data generation unit 815, as shown in step S814 in FIG.
- FIG. 40A display example of the display unit 806 is shown in FIG. 40, a table of the average temperature and the average degree of comfort of the areas 451 to 454 is added to the display of the comfort degree display device 800 described above with reference to FIG.
- the area basic statistic calculation unit 817calculates the average value.
- the area basic statistic calculation unit 817 in step S810 in FIG.Calculate the time median or space median of the comfort value.
- the area basic statistics calculation unit 817calculates the time intermediate value or the space intermediate value of the area environmental data values of the areas 451 to 454 of the group (7) of the area environmental data value basic statistics in step S811 of FIG. Do.
- the area basic statistic calculation unit 817calculates any of the maximum value, the minimum value, and the mode value of the comfort value of the group (3), (4), (5) of the comfort value basic statistics. Further, in step S811 in FIG. 39, the area basic statistic calculation unit 817 sets the maximum value and the minimum value of the area environmental data values of groups (8), (9), and (10) of the area environmental data value basic statistics. Calculate one of the mode values. The other operations are the same as in the case of calculating the average value described above.
- the display unit 806may combine and display area basic statistics having different area comfort value and area environmental data value.
- the area basic statistic calculation unit 817calculates the time average value or the space average value of the area comfort value and the time intermediate value or the space intermediate value of the area environmental data values of the areas 451 to 454 of the air conditioned space 40. Then, the area display data generation unit 815 may display these on the display unit 806.
- the area display data generation unit 825 of the comfort level display device 820 of the fifteenth embodimentincludes any one of the area comfort level basic statistics and the area environmental data value basic statistics. To generate area statistics display data. Then, the display unit 806 displays one or more area statistic display data. The area display data generation unit 825 does not combine the area comfort degree value of the user generated by the area comfort degree value generation unit 804 with the area environment data value acquired by the area environment data value acquisition unit 803. Therefore, the comfort degree display device 820 displays only the area comfort value basic statistic of the area comfort degree and the area environmental data value basic statistic of the area environmental data on the display unit 806.
- the area basic statistic calculation unit 817calculates the time average value or the space average value of the area comfort value generated by the area comfort value generation unit 804 and the area environmental data value acquired by the area environmental data value acquisition unit 803.
- the comfort degree display device 820generates area statistic display data in step S820 of FIG. 42, and the display unit 806 displays the area statistic display data.
- FIG. 43is one of the display examples of the comfort level display device 820 of the fifteenth embodiment. Similar to FIG. 37, FIG. 43 shows a change in temperature and a change in the degree of comfort of the user at each specific position of each of the areas 451 to 454 in the air-conditioned space 40 shown in FIG. In FIG. 37, the horizontal axis is time, but the horizontal axis in FIG. 43 is a date, and each plot shows the average value of the area comfort degree for each day and the average temperature. Therefore, in FIG.
- the daily average value of the comfort level value of each user calculated by the area basic statistic calculation unit 817 and the daily average value of the temperature which is the area environmental data value of each area 451 to 454 18shows a display example in the case where statistical quantity display data obtained by combining the above is output to the display unit 806. Further, on the right side of FIG. 43, the monthly average temperature at the seat position A-1 of each of the areas 451 to 454 and the average comfort value of each of the users A, B, and C for one month in August, Is displayed.
- the display unit 806displays the area comfort value basic statistic and the area environmental data value basic statistic, so that the air conditioning manager can determine the relationship between the comfort degree and the environmental data for each of the areas 451 to 454. You can understand the trend. Therefore, the air conditioning manager can easily judge the necessity for replacement or additional installation of the air conditioning equipment in each of the areas 451 to 454. Also, as the area comfort value basic statistics and area environmental data values basic statistics, the comfort value, average value, median, maximum value, minimum value, mode which is an index representing a data group of environmental data values The data group can be comprehensively grasped by using the value.
- an area information input unit 839is added to the comfort degree display device 800 described with reference to FIG. 44.
- the area information storage unit 808stores information on the arrangement and shape of the areas 451 to 454. Also, the area information storage unit 808 stores information on the arrangement of the air conditioners, indoor units, temperature sensors, humidity sensors, anemometers, etc. arranged in the areas 451 to 454. Further, the area information storage unit 808 stores the arrangement of the desks of the areas 451 to 454 and information specifying the user sitting there, for example, information such as the name and the employee number. These pieces of information are often changed frequently. By providing the area information input unit 839 as in the comfort degree display device 830, even if such information is changed, the information in the area information storage unit 808 can be updated as needed, and the display of the appropriate degree of comfort is always performed. It can be carried out.
- a power information acquisition unit 841is added to the comfort degree display device 100 described with reference to FIG. 45.
- the power information acquisition unit 841is used for air conditioning of the air conditioning space 40 or other air conditioning equipment such as a ventilator, humidifier, dehumidifier, etc. Obtain power data values to be used by the device.
- the display data generation unit 845displays the user comfort level value generated by the comfort level value generation unit 104 and the environmental data value of the air-conditioned space 40 acquired by the environmental data value acquisition unit 103.
- the display datais generated by combining the power data values acquired by the power information acquisition unit 841.
- the generated display datais displayed on the display unit 106.
- the comfort degree display device 840enables the air conditioning manager to grasp the relationship between the power consumption, the degree of comfort, and the environmental data value.
- an area comfort degree evaluation unit 851is added to the comfort degree display device 810 described with reference to FIG. 47.
- step S851 of FIG. 48the area comfort level evaluation unit 851 compares the area comfort level basic statistic calculated by the area basic statistic calculation unit 817 with a predetermined threshold and outputs the area comfort level evaluation.
- the area display data generation unit 855generates the area comfort value of the user generated by the area comfort value generation unit 804, the area environment data value acquired by the area environment data value acquisition unit 803, and the area in step S852 in FIG.
- Area display datais generated by synthesizing the area comfort degree evaluation output by the comfort degree evaluation unit 851.
- the comfort degree display device 850can easily identify and display a low comfort area from among the plurality of areas 451 to 454. Also, the comfort degree display device 850 displays areas with low comfort among the plurality of areas 451 to 454 using the area comfort degree evaluation so that areas with low comfort can be identified and displayed more easily. It is also good.
- a biological information storage unit 861 and a user state acquisition unit 707are added to the comfort degree display device 100 shown in FIG.
- the biometric information storage unit 861stores biometric information of the user, such as a heart rate.
- the user state acquisition unit 707acquires biological information such as the current user's heart rate and the current position of the user.
- the user state acquisition unit 707acquires biological information such as the current user's heart rate and the current position of the user.
- the comfort level value generation unit 104is the air conditioning acquired by the environmental data value acquisition unit 103 in step S103 of FIG. 50 and the user preference read out in step S101 of FIG. 50, the user attribute read out in step S102 of FIG.
- biological informationsuch as the current user's heart rate acquired by the user state acquisition unit 707 in step S861 of FIG. 50, the current position of the user, and the user's user stored in the biological information storage unit 861 Based on the biological information, in step S 862 of FIG. 50, a comfort value indicating the comfort of the user in the air-conditioned space 40 is generated.
- the comfort value generation unit 104immediately after the user walks, the comfort value generation unit 104 generates the user comfort value based on the temperature of the air-conditioned space 40 lower than normal. As a result, for example, even when the state of the user is different from normal, such as after walking, the comfort can be accurately displayed.
- the comfort degree display device of each embodimentcan easily grasp the relevance between the degree of comfort and the environmental data, and can appropriately manage the air conditioning facility.
Landscapes
- Engineering & Computer Science (AREA)
- Mechanical Engineering (AREA)
- Signal Processing (AREA)
- General Engineering & Computer Science (AREA)
- Chemical & Material Sciences (AREA)
- Combustion & Propulsion (AREA)
- Physics & Mathematics (AREA)
- Fuzzy Systems (AREA)
- Mathematical Physics (AREA)
- Human Computer Interaction (AREA)
- General Physics & Mathematics (AREA)
- Theoretical Computer Science (AREA)
- Air Conditioning Control Device (AREA)
Abstract
Description
Translated fromJapanese本発明は、空調空間内の環境データとユーザの快適度とを表示する快適度表示装置の構成に関する。The present invention relates to a configuration of a comfort degree display device that displays environmental data in a conditioned space and the degree of comfort of the user.
近年、ビルや家などの建物内における温度は、建物内にいるユーザが快適に過ごせるように空調システムによって制御されている。しかし、「暑い」、「寒い」と不快に感じる温度または快適性を感じる温度は個人によって異なってくる。このため、店舗など多くの人が在室し、自由に移動できる空間では、使用中の空調システムが複数の店舗利用者にどの程度の快適性を提供しているのか不明な場合が多い。BACKGROUND In recent years, the temperature in a building such as a building or a house is controlled by an air conditioning system so that a user in the building can spend comfortably. However, temperatures that feel uncomfortable or "hot", or "cold", or temperatures that feel comfort vary among individuals. For this reason, in a space where many people, such as stores, are present and can move freely, it is often unclear how comfortable the air conditioning system in use offers to a plurality of store users.
このため、複数のユーザの携帯端末から快適度の評価データを受信し、受信した評価データを平均化してその空調空間内の快適度分布をディスプレイに表示し、快適度をモニタリングする方法が提案されている(例えば、特許文献1参照)。For this reason, a method has been proposed in which evaluation data on the degree of comfort is received from the mobile terminals of a plurality of users, the received evaluation data is averaged, and the distribution of comfort in the air-conditioned space is displayed on the display to monitor the degree of comfort. (See, for example, Patent Document 1).
また、温度、湿度、二酸化炭素濃度等に基づいてオフィス内の各エリアの快適度を算出し、オフィスのレイアウトに快適度分布を重ね合わせてディスプレイに表示するシステムも提案されている(例えば、特許文献2参照)。In addition, a system has been proposed that calculates the comfort level of each area in the office based on temperature, humidity, carbon dioxide concentration, etc., and superimposes the comfort level distribution on the office layout and displays it on the display (for example, patent) Reference 2).
ところで、人の快適性は、温度、湿度、風速、輻射温度等の環境データと着衣量、運動量等の個人状態、および暑がり、寒がり等の個人嗜好によって変化する。特許文献1、2に記載された従来技術では、ディスプレイに快適度のみを表示する。このため、快適度と環境データとの関連性が把握できず、環境データをどのように変更すれば快適度が向上するのか判断することが難しかった。By the way, human comfort changes depending on environmental data such as temperature, humidity, wind speed, radiation temperature, clothing amount, personal condition such as exercise amount, and personal preference such as heat or cold. In the prior art described in
そこで、本発明は、快適度と環境データとの関連性の把握を容易にし、適切な空調設備の管理を可能とすることを目的とする。Then, this invention makes it easy to grasp | ascertain a relationship with comfort and environmental data, and an object of this invention is to enable management of an appropriate air conditioning installation.
本発明の快適度表示装置は、ユーザの空調環境に対する嗜好を格納した嗜好格納部と、前記ユーザの属性を格納する属性格納部と、空調空間の状況を表す環境データ値を取得する環境データ値取得部と、前記嗜好格納部に格納した前記ユーザの嗜好と、前記属性格納部に格納した前記ユーザの属性と、前記環境データ値取得部が取得した前記空調空間の環境データ値とに基づいて前記ユーザの前記空調空間における快適性を示す快適度値を生成する快適度値生成部と、前記快適度値生成部で生成した前記ユーザの快適度値と、前記環境データ値取得部が取得した前記空調空間の環境データ値と、を合成して表示データを生成する表示データ生成部と、前記表示データを表示する表示部と、を有することを特徴とする。The comfort degree display device according to the present invention includes: a preference storage unit storing a user's preference for an air conditioning environment; an attribute storage unit storing an attribute of the user; and an environmental data value acquiring an environmental data value representing a condition of the air conditioning space Based on the acquisition unit, the preference of the user stored in the preference storage unit, the attribute of the user stored in the attribute storage unit, and the environmental data value of the air-conditioned space acquired by the environmental data value acquisition unit A degree-of-comfort value generating unit for generating a degree-of-comfort value indicating the degree of comfort of the user in the air-conditioned space; a degree of comfort value for the user generated by the degree-of-comfort value generating unit; A display data generation unit that generates display data by combining environmental data values of the air-conditioned space, and a display unit that displays the display data.
このように、本発明は、快適度値と環境データ値とを重ね合わせて表示するので、空調管理者は快適度と環境データとの関連性を容易に把握することができる。このため、本発明は、空調管理者が適切に空調設備の調整を行うことを可能にする。As described above, since the present invention displays the comfort level value and the environmental data value in an overlapping manner, the air conditioning manager can easily grasp the relevance between the comfort level and the environmental data. For this reason, the present invention enables the air conditioning manager to properly adjust the air conditioning equipment.
本発明の快適度表示装置は、更に、前記快適度値生成部で生成した前記ユーザの快適度値を代表する快適度値基本統計量と、前記環境データ値取得部が取得した前記空調空間の環境データ値を代表する環境データ値基本統計量と、を算出する基本統計量算出部を有してもよい。また、前記表示データ生成部は、前記ユーザの快適度値と、前記空調空間の環境データ値と、前記快適度値基本統計量と前記環境データ値基本統計量の内のいずれか1つまたは複数と、を合成して表示統合データを生成してもよく、前記表示部が、前記表示統合データを表示してもよい。ここで、前記基本統計量算出部が算出する前記快適度値基本統計量は、以下の(1)から(5)のグループを有し、
(1)前記ユーザの快適度値の時間平均値または空間平均値
(2)前記ユーザの快適度値の時間中央値または空間中央値
(3)前記ユーザの快適度値の時間最大値または空間最大値
(4)前記ユーザの快適度値の時間最小値または空間最小値
(5)前記ユーザの快適度値の時間最頻値または空間最頻値
前記基本統計量算出部が算出する前記環境データ値基本統計量は、以下の(6)から(10)のグループを有すること、
(6)前記空調空間の環境データ値の時間平均値または空間平均値
(7)前記空調空間の環境データ値の時間中央値または空間中央値
(8)前記空調空間の環境データ値の時間最大値または空間最大値
(9)前記空調空間の環境データ値の時間最小値または空間最小値
(10)前記空調空間の環境データ値の時間最頻値または空間最頻値
としてもよい。The comfort degree display device of the present invention further includes a comfort degree value basic statistic representing the comfort degree value of the user generated by the comfort degree value generation unit, and the air conditioning space acquired by the environmental data value acquisition unit. It may have a basic statistics calculation part which calculates environmental data value basic statistics which represent environmental data values. Further, the display data generation unit may be any one or more of the user comfort value, the environmental data value of the air-conditioned space, the comfort value basic statistic, and the environmental data value basic statistic. And may be combined to generate display integrated data, and the display unit may display the display integrated data. Here, the comfort value basic statistic calculated by the basic statistic calculation unit has the following groups (1) to (5),
(1) time average value or space average value of the user comfort value (2) time median or space median value of the user comfort value (3) time maximum value or space maximum of the user comfort value Value (4) Time minimum value or space minimum value of the user's comfort level value (5) time mode or spatial mode value of the user's level of comfort value The environmental data value calculated by the basic statistic calculation unit The basic statistics have the following groups (6) to (10),
(6) time average value or space average value of environmental data values of the air conditioned space (7) median time or median value of environmental data values of the air conditioned space (8) maximum time value of environmental data values of the air conditioned space Or space maximum value (9) The time minimum value or space minimum value of the environmental data value of the said air conditioning space It is good also as a time mode or space mode value of the environmental data value of the said air conditioning space.
また、本発明の快適度表示装置において、前記表示データ生成部は、前記ユーザの快適度値と、前記空調空間の環境データ値と、前記(1)のグループの前記快適度値基本統計量と前記(6)のグループの前記環境データ値基本統計量の内のいずれか1つまたは複数、或いは、前記ユーザの快適度値と、前記空調空間の環境データ値と、前記(2)のグループの前記快適度値基本統計量と前記(7)のグループの前記環境データ値基本統計量の内のいずれか1つまたは複数、或いは、前記ユーザの快適度値と、前記空調空間の環境データ値と、前記(3)のグループの前記快適度値基本統計量と前記(8)のグループの前記環境データ値基本統計量の内のいずれか1つまたは複数、或いは、前記ユーザの快適度値と、前記空調空間の環境データ値と、前記(4)のグループの前記快適度値基本統計量と前記(9)のグループの前記環境データ値基本統計量の内のいずれか1つまたは複数、或いは、前記ユーザの快適度値と、前記空調空間の環境データ値と、前記(5)のグループの前記快適度値基本統計量と前記(10)のグループの前記環境データ値基本統計量の内のいずれか1つまたは複数、を合成して前記表示統合データを生成してもよい。Further, in the comfort degree display device of the present invention, the display data generation unit is configured to: the comfort degree value of the user; an environmental data value of the air conditioned space; and the comfort degree basic statistic of the group of (1). Any one or more of the environmental data value basic statistics of the group of (6), or the comfort value of the user, the environmental data value of the air conditioned space, and the group of the (2) Any one or more of the comfort value basic statistic and the environmental data value basic statistic of the group (7), or the comfort value of the user, and the environmental data value of the air-conditioned space Any one or more of the comfort value basic statistic of the group (3) and the environmental data value basic statistic of the group (8), or the comfort value of the user; Environment of the air-conditioned space Data, and any one or more of the comfort value basic statistic of the group (4) and the environmental data value basic statistic of the group (9), or the comfort level of the user Value, the environmental data value of the air-conditioned space, the comfort value basic statistic of the group of (5), and the environmental data value basic statistic of the group of (10) , To generate the display integrated data.
このように、快適度値基本統計量と環境データ値基本統計量とが重ね合わされて表示されるため、空調管理者は、快適度と環境データとの関連性の傾向を把握でき、空調設備の交換、追設等の必要性を容易に判断できる。また、快適度値基本統計量と環境データ値基本統計量とが重ね合わされて表示されるため、空調管理者が快適度と環境データとの空間的な関連性の傾向を把握でき、空調空間内の特定エリアの空調設備の交換やパーティション等のビル設備の追設等の必要性を容易に判断できる。快適度値基本統計量、環境データ値基本統計量としては、快適度値、環境データ値のデータ群を代表する指標である平均値、中央値、最大値、最小値、最頻値を用いることで、データ群を包括的に把握することができる。As described above, since the comfort level basic statistic and the environmental data value basic statistic are superimposed and displayed, the air conditioning manager can grasp the tendency of the relationship between the comfort level and the environmental data, and the air conditioning facility You can easily determine the need for replacement, additional installation, etc. In addition, since the comfort level basic statistics and the environmental data basic statistics are superimposed and displayed, the air conditioning manager can grasp the tendency of the spatial relationship between the comfort level and the environmental data, and within the air conditioning space It is easy to determine the necessity for replacement of air conditioning equipment in a specific area or for additional installation of building equipment such as partitions. As the comfort value basic statistics and environmental data values basic statistics, use the comfort value and the average value, median, maximum value, minimum value, mode which is an index representing the data group of environmental data values The data group can be comprehensively grasped.
また、本発明の快適度表示装置は、更に、前記快適度値生成部で生成した前記ユーザの快適度値を代表する快適度値基本統計量と、前記環境データ値取得部が取得した前記空調空間の環境データ値を代表する環境データ値基本統計量と、を算出する基本統計量算出部を有していてもよい。また、前記表示データ生成部は、前記快適度値基本統計量の内のいずれか1つと、前記環境データ値基本統計量の内のいずれか1つを合成して統計量表示データを生成してもよく、前記表示部が、前記統計量表示データを表示することとしてもよい。Further, the comfort degree display device according to the present invention further includes a comfort degree value basic statistic representing the comfort degree value of the user generated by the comfort degree value generation unit, and the air conditioning acquired by the environmental data value acquisition unit. It may have a basic statistic calculation unit that calculates an environmental data value basic statistic that represents environmental data values in space. Further, the display data generation unit generates statistics display data by combining any one of the comfort level basic statistics and any one of the environmental data value basic statistics. The display unit may display the statistic display data.
また、本発明の快適度表示装置において、前記表示データ生成部は、前記(1)のグループの前記快適度値基本統計量に含まれる2つの値のいずれか一方と、前記(6)のグループの前記環境データ値基本統計量に含まれる2つの値のいずれか一方、或いは、前記(2)のグループの前記快適度値基本統計量に含まれる2つの値のいずれか一方と、前記(7)のグループの前記環境データ値基本統計量に含まれる2つの値のいずれか一方、或いは、前記(3)のグループの前記快適度値基本統計量に含まれる2つの値のいずれか一方と、前記(8)のグループの前記環境データ値基本統計量に含まれる2つの値のいずれか一方、或いは、前記(4)のグループの前記快適度値基本統計量に含まれる2つの値のいずれか一方と、前記(9)のグループの前記環境データ値基本統計量に含まれる2つの値のいずれか一方、或いは、前記(5)のグループの前記快適度値基本統計量に含まれる2つの値のいずれか一方と、前記(10)のグループの前記環境データ値基本統計量に含まれる2つの値のいずれか一方、を合成して前記統計量表示データを生成することとしてもよい。Further, in the comfort degree display device of the present invention, the display data generation unit is configured to select one of two values included in the comfort degree basic statistics of the group (1) and the group of the (6). And one of two values included in the environmental data value basic statistic of the above, or one of two values included in the comfort degree basic statistic of the group (2); And any one of two values included in the environmental data value basic statistic of the group or any one of two values included in the comfort value basic statistic of the group of (3); Either one of two values included in the environmental data value basic statistic of the group of (8) or any one of two values included in the comfort value basic statistic of the group of (4) One and the above (9) Either one of two values included in the environmental data value basic statistic of the loop, or one of two values included in the comfort value basic statistic of the group of (5), The statistical data display data may be generated by combining one of the two values included in the environmental data value basic statistic of the group of 10).
このように、快適度値基本統計量と環境データ値基本統計量が表示されるため、空調管理者は、快適度と環境データとの関連性の傾向を把握でき、空調設備の交換、追設等の必要性を容易に判断できる。また、快適度値基本統計量、環境データ値基本統計量としては、快適度値、環境データ値のデータ群を代表する指標である平均値、中央値、最大値、最小値、最頻値を用いることで、データ群を包括的に把握することができる。As described above, since the comfort level basic statistic and the environmental data value basic statistic are displayed, the air conditioning manager can grasp the tendency of the relationship between the comfort degree and the environmental data, and replace or add the air conditioning facility. You can easily determine the need for In addition, as the comfort value basic statistics and environmental data values basic statistics, the comfort value, average value, median, maximum value, minimum value, mode which is an index representing the data group of environmental data values By using it, it is possible to comprehend the data group comprehensively.
本発明の快適度表示装置は、更に、前記空調空間は複数のエリアで構成され、前記空調空間の各エリアの構成情報を格納するエリア情報格納部と、前記エリア情報格納部に格納された各エリアの構成情報を参照して各エリアの前記空調空間の状況を表すエリア環境データ値をエリア毎に取得するエリア環境データ値取得部と、前記嗜好格納部に格納した前記ユーザの嗜好と、前記属性格納部に格納した前記ユーザの属性と、前記エリア環境データ値取得部が取得した前記エリア環境データ値とに基づいて前記ユーザの前記エリアにおける快適性を示すエリア快適度値を生成するエリア快適度値生成部と、前記エリア快適度値生成部で生成した前記ユーザのエリア快適度値と、前記エリア環境データ値取得部が取得した前記エリア環境データ値と、を合成してエリア表示データを生成するエリア表示データ生成部と、を有していてもよい。前記表示部が、1つまたは複数の前記エリア表示データを表示すること、としてもよい。また、本発明の快適度表示装置は、更に、前記エリア快適度値生成部で生成した前記ユーザのエリア快適度値を代表するエリア快適度値基本統計量と、前記エリア環境データ値取得部が取得した前記エリア環境データ値を代表するエリア環境データ値基本統計量と、を算出するエリア基本統計量算出部を有していてもよい。前記エリア表示データ生成部は、前記ユーザのエリア快適度値と、前記エリア環境データ値と、前記エリア快適度値基本統計量と前記エリア環境データ値基本統計量の内のいずれか1つまたは複数と、を合成してエリア表示統合データを生成してもよい。前記表示部が、1つまたは複数の前記エリア表示統合データを表示することとしてもよい。In the comfort degree display device according to the present invention, the air conditioning space is further constituted by a plurality of areas, and an area information storage unit for storing configuration information of each area of the air conditioning space; and each information stored in the area information storage unit An area environmental data value acquiring unit for acquiring area environmental data values representing the condition of the air conditioned space of each area with reference to area configuration information, the user preference stored in the preference storage unit, and An area comfort generating area comfort value indicating comfort of the user in the area based on the attribute of the user stored in the attribute storage unit and the area environmental data value acquired by the area environmental data value acquiring unit A degree value generation unit, the area comfort degree value of the user generated by the area comfort degree value generation unit, and the area environmental data acquired by the area environmental data value acquisition unit If it may be a have the area display data generating unit that combined to produce an area display data. The display unit may display one or more of the area display data. In the comfort degree display device of the present invention, an area comfort degree basic statistic representing the area comfort degree value of the user generated by the area comfort degree value generation unit and the area environmental data value acquisition unit An area basic statistic calculation unit may be provided to calculate an area environmental data value basic statistic representing the acquired area environmental data value. The area display data generation unit is any one or more of the area comfort value of the user, the area environment data value, the area comfort value basic statistic, and the area environment data value basic statistic. And may be synthesized to generate area display integrated data. The display unit may display one or more of the area display integrated data.
また、本発明の快適度表示装置において、前記エリア基本統計量算出部が算出する前記エリア快適度値基本統計量は、以下の(1)から(5)のグループを有し、
(1)前記ユーザのエリア快適度値の時間平均値または空間平均値
(2)前記ユーザのエリア快適度値の時間中央値または空間中央値
(3)前記ユーザのエリア快適度値の時間最大値または空間最大値
(4)前記ユーザのエリア快適度値の時間最小値または空間最小値
(5)前記ユーザのエリア快適度値の時間最頻値または空間最頻値
前記エリア基本統計量算出部が算出する前記エリア環境データ値基本統計量は、以下の(6)から(10)のグループを有すること、
(6)前記エリア環境データ値の時間平均値または空間平均値
(7)前記エリア環境データ値の時間中央値または空間中央値
(8)前記エリア環境データ値の時間最大値または空間最大値
(9)前記エリア環境データ値の時間最小値または空間最小値
(10)前記エリア環境データ値の時間最頻値または空間最頻値
としてもよい。Further, in the comfort degree display device of the present invention, the area comfort degree basic statistic calculated by the area basic statistic calculation unit has the following groups (1) to (5),
(1) time average value or space average value of the area comfort value of the user (2) time median or space median value of the area comfort value of the user (3) time maximum value of the area comfort value of the user Or the space maximum value (4) the time minimum value or the space minimum value of the area comfort value of the user (5) the time mode or space mode of the area comfort value of the user The area environmental data value basic statistic to be calculated has the following groups (6) to (10):
(6) time average value or space average value of the area environmental data value (7) time median value or space median value of the area environmental data value (8) time maximum value or space maximum value of the area environmental data value (9 The time minimum value or the space minimum value of the area environmental data value (10) The time mode value or the space mode value of the area environmental data value may be used.
このように、エリア毎のユーザのエリア快適度値と、エリア環境データ値とを合成して表示することにより、エリア毎に快適度と環境データとの関連性の傾向を把握でき、エリア毎の空調設備の交換、追設等の必要性を容易に判断できる。また、エリア快適度値基本統計量とエリア環境データ値基本統計量とが重ね合わされて表示されるため、空調管理者は、エリアの快適度とエリアの環境データとの空間的な関連性の傾向を把握でき、空調空間内の特定エリアの空調設備の交換やパーティション等のビル設備の追設等の必要性を容易に判断できる。エリア快適度値基本統計量、エリア環境データ値基本統計量としては、快適度値、環境データ値のデータ群を代表する指標である平均値、中央値、最大値、最小値、最頻値を用いることで、データ群を包括的に把握することができる。In this way, by combining and displaying the area comfort value of the user for each area and the area environmental data value, it is possible to grasp the tendency of the relevance between the comfort and the environmental data for each area, and for each area It is easy to determine the necessity for replacement or additional installation of air conditioning equipment. In addition, since the area comfort value basic statistics and the area environmental data values basic statistics are superimposed and displayed, the air conditioning manager tends to associate the area comfort with the area environmental data. It is possible to easily determine the necessity of replacing the air conditioning equipment in a specific area in the air conditioning space, or installing additional building equipment such as partitions. Area comfort value basic statistics, area environmental data values Basic statistics include comfort value, average value, median value, maximum value, minimum value, mode which is an index representing a data group of environmental data values By using it, it is possible to comprehend the data group comprehensively.
また、本発明の快適度表示装置は、更に、前記エリア快適度値生成部で生成した前記ユーザのエリア快適度値を代表するエリア快適度値基本統計量と、前記エリア環境データ値取得部が取得した前記エリア環境データ値を代表するエリア環境データ値基本統計量と、を算出するエリア基本統計量算出部を有していてもよい。前記エリア表示データ生成部は、前記エリア快適度値基本統計量の内のいずれか1つと、前記エリア環境データ値基本統計量の内のいずれか1つを合成してエリア統計量表示データを生成してもよい。また、前記表示部が、1つまたは複数の前記エリア統計量表示データを表示することとしてもよい。In the comfort degree display device of the present invention, an area comfort degree basic statistic representing the area comfort degree value of the user generated by the area comfort degree value generation unit and the area environmental data value acquisition unit An area basic statistic calculation unit may be provided to calculate an area environmental data value basic statistic representing the acquired area environmental data value. The area display data generation unit generates area statistics display data by combining any one of the area comfort value basic statistics and any one of the area environmental data values basic statistics. You may Further, the display unit may display one or more of the area statistic display data.
本発明の快適度表示装置において、前記エリア表示データ生成部は、前記(1)のグループの前記エリア快適度値基本統計量に含まれる2つの値のいずれか一方と、前記(6)のグループの前記エリア環境データ値基本統計量に含まれる2つの値のいずれか一方、或いは、前記(2)のグループの前記エリア快適度値基本統計量に含まれる2つの値のいずれか一方と、前記(7)のグループの前記エリア環境データ値基本統計量に含まれる2つの値のいずれか一方、或いは、前記(3)のグループの前記エリア快適度値基本統計量に含まれる2つの値のいずれか一方と、前記(8)のグループの前記エリア環境データ値基本統計量に含まれる2つの値のいずれか一方、或いは、前記(4)のグループの前記エリア快適度値基本統計量に含まれる2つの値のいずれか一方と、前記(9)のグループの前記エリア環境データ値基本統計量に含まれる2つの値のいずれか一方、或いは、前記(5)のグループの前記エリア快適度値基本統計量に含まれる2つの値のいずれか一方と、前記(10)のグループの前記エリア環境データ値基本統計量に含まれる2つの値のいずれか一方、を合成して前記エリア統計量表示データを生成することとしてもよい。In the comfort degree display device of the present invention, the area display data generation unit is configured to select one of two values included in the area comfort degree basic statistic of the group of (1) and the group of (6). And one of two values included in the area environmental data value basic statistic of the above, or one of two values included in the area comfort value basic statistic of the group (2); Either of two values included in the area environmental data value basic statistic of the group of (7), or any of two values included in the area comfort value basic statistic of the group of (3). Or one of two values included in the area environmental data value basic statistic of the group of (8), or included in the area comfort value basic statistic of the group of (4) Either one of the two values and one of the two values included in the area environmental data value basic statistic of the group of (9) or the area comfort value of the group of (5) The area statistic is displayed by combining one of two values included in the basic statistic and one of two values included in the area environmental data value basic statistic of the group of (10). Data may be generated.
このように、エリア快適度値基本統計量とエリア環境データ値基本統計量が表示されるため、空調管理者は、エリア毎の快適度と環境データとの関連性の傾向を把握でき、エリア毎の空調設備の交換、追設等の必要性を容易に判断できる。また、エリア快適度値基本統計量、エリア環境データ値基本統計量としては、快適度値、環境データ値のデータ群を代表する指標である平均値、中央値、最大値、最小値、最頻値を用いることで、データ群を包括的に把握することができる。As described above, since the area comfort value basic statistic and the area environmental data value basic statistic are displayed, the air conditioning manager can grasp the tendency of the relationship between the comfort degree and the environmental data for each area, and for each area It is possible to easily judge the necessity for replacement or additional installation of air conditioners. Also, as the area comfort value basic statistics and area environmental data values basic statistics, the comfort value, average value, median, maximum value, minimum value, mode which is an index representing a data group of environmental data values The data group can be comprehensively grasped by using the value.
本発明の快適度表示装置は、更に、前記エリア情報格納部に前記空調空間の前記エリアの構成情報を入力するエリア情報入力部を有することとしてもよい。The comfort level display device of the present invention may further include an area information input unit for inputting configuration information of the area of the air-conditioned space to the area information storage unit.
これにより、エリアの構成情報を容易に変更することができる。This makes it possible to easily change the area configuration information.
本発明の快適度表示装置は、更に、前記空調空間の機器に使用される電力データ値を取得する電力情報取得部を有していてもよい。前記表示データ生成部が、前記快適度値生成部で生成した前記ユーザの快適度値と、前記環境データ値取得部が取得した前記空調空間の環境データ値と、前記電力情報取得部が取得した電力データ値とを合成して前記表示データを生成することとしてもよい。The comfort level display device of the present invention may further include a power information acquisition unit that acquires a power data value used for the device in the air-conditioned space. The display data generation unit acquires the user comfort level value generated by the comfort level value generation unit, the environmental data value of the air-conditioned space acquired by the environmental data value acquisition unit, and the power information acquisition unit The display data may be generated by combining with the power data value.
これにより、空調管理者は、使用電力と快適度、環境データ値との関係を把握することができる。Thus, the air conditioning manager can grasp the relationship between the power consumption, the degree of comfort, and the environmental data value.
本発明の快適度表示装置は、更に、前記エリア快適度値生成部で生成した前記ユーザのエリア快適度値を代表するエリア快適度値基本統計量を算出するエリア基本統計量算出部と、前記エリア基本統計量算出部が算出する前記エリア快適度値基本統計量と、所定の閾値とを比較評価してエリア快適度評価を出力するエリア快適度評価部と、を有していてもよい。前記エリア表示データ生成部は、前記エリア快適度値生成部で生成した前記ユーザのエリア快適度値と、前記エリア環境データ値取得部が取得した前記エリア環境データ値と、前記エリア快適度評価部が出力した前記エリア快適度評価と、を合成して前記エリア表示データを生成することとしてもよい。The comfort degree display device according to the present invention further includes an area basic statistic calculation unit for calculating an area comfort degree basic statistic representing the area comfort degree value of the user generated by the area comfort degree value generation unit; An area comfort degree evaluation unit may be provided which compares the area comfort degree basic statistic calculated by the area basic statistic calculation unit with a predetermined threshold value and outputs an area comfort degree evaluation. The area display data generation unit includes the area comfort value of the user generated by the area comfort value generation unit, the area environmental data value acquired by the area environmental data value acquisition unit, and the area comfort evaluation unit. The area display data may be generated by combining the area comfort degree evaluations output by
これにより、複数のエリアの中から快適性の低いエリアを容易に識別表示できる。また、エリア快適度評価を用いて複数のエリアの中から快適性の低いエリアを表示させて、より容易に快適性の低いエリアを容易に識別表示できる。This makes it possible to easily identify and display an area of low comfort from among a plurality of areas. Further, the area with low comfortability can be displayed from among the plurality of areas using the area comfort degree evaluation, and the area with low comfortability can be easily identified and displayed.
本発明の快適度表示装置は、更に、前記ユーザの生体情報を格納する生体情報格納部と、前記ユーザの現在状態量と前記ユーザの現在位置とを取得するユーザ状態取得部と、を有していてもよい。前記快適度値生成部は、前記嗜好格納部に格納した前記ユーザの嗜好と、前記属性格納部に格納した前記ユーザの属性と、前記環境データ値取得部が取得した前記空調空間の環境データ値と、前記生体情報格納部に格納した前記ユーザの前記生体情報と、前記ユーザ状態取得部が取得した前記ユーザの現在状態量と前記ユーザの現在位置とに基づいて前記ユーザの前記空調空間における快適性を示す快適度値を生成することとしてもよい。The comfort level display device of the present invention further includes a biometric information storage unit for storing biometric information of the user, and a user condition acquisition unit for acquiring the current condition amount of the user and the current position of the user. It may be The comfort degree value generation unit may include the preference of the user stored in the preference storage unit, the attribute of the user stored in the attribute storage unit, and an environmental data value of the air-conditioned space acquired by the environmental data value acquisition unit. And comfort of the user in the air-conditioned space based on the biometric information of the user stored in the biometric information storage unit, the current state amount of the user acquired by the user status acquisition unit, and the current position of the user It is also possible to generate a comfort value indicating the sex.
これにより、例えば、歩行した後など、ユーザの状態が平常と異なる場合でも快適性を正確に表示することができる。As a result, it is possible to accurately display the comfort even when the state of the user is different from normal, for example, after walking.
本発明の快適度表示装置は、更に、前記快適度値生成部で生成した離散値である前記ユーザの快適度値を補完して時間または空間に対する連続値を算出し、前記環境データ値取得部が取得した離散値である前記空調空間の環境データ値を補完して時間または空間に対する連続値を算出する補完部を有していてもよい。前記表示データ生成部が、前記ユーザの快適度値の時間または空間に対する連続値のいずれか一方と、前記空調空間の環境データ値の時間または空間に対する連続値のいずれか一方とを合成して連続表示データを生成し、前記表示部が、前記連続表示データを表示してもよい。The comfort degree display device of the present invention further complements the comfort degree value of the user, which is a discrete value generated by the comfort degree value generation unit, to calculate a continuous value for time or space, and the environmental data value acquisition unit It may have a complementation part which complements the environmental data value of the above-mentioned air-conditioning space which is a discrete value which acquired the, and computes a continuous value to time or space. The display data generation unit combines and combines either one of time or space continuous values of the user's comfort level with either of time or space continuous values of environmental data values of the air-conditioned space Display data may be generated, and the display unit may display the continuous display data.
快適度値、環境データ値が連続線で表示されるので、表示が見やすくなり、空調管理者は、より容易に快適度と環境データとの関連性を把握できる。Since the comfort value and the environmental data value are displayed in a continuous line, the display is easy to view, and the air conditioning manager can more easily understand the relationship between the comfort and the environmental data.
本発明の快適度表示装置は、更に、前記ユーザの快適度値が快適限界範囲にない場合に異常を検出し、異常データを出力する異常検出部を有していてもよい。前記表示データ生成部は、前記異常検出部が出力した異常データと、前記ユーザの快適度値と、前記空調空間の環境データ値とを合成して異常表示データを生成し、前記表示部が、前記異常表示データを表示してもよい。The comfort degree display device of the present invention may further include an abnormality detection unit that detects an abnormality when the comfort degree value of the user is not within the comfort limit range, and outputs abnormal data. The display data generation unit generates abnormality display data by combining the abnormality data output from the abnormality detection unit, the comfort level value of the user, and the environmental data value of the air-conditioned space, and the display unit The abnormality display data may be displayed.
また、本発明の快適度表示装置は、更に、前記ユーザの快適度値が快適限界範囲にない場合に異常を検出し、異常データを出力する異常検出部を有していてもよい。前記表示データ生成部は、前記異常検出部が異常を検出した前記ユーザの快適度値を他のユーザの快適度値と識別できるように、前記ユーザの快適度値と前記空調空間の環境データ値とを合成して異常識別表示データを生成し、前記表示部が、前記異常識別表示データを表示してもよい。Furthermore, the comfort degree display device of the present invention may further include an abnormality detection unit that detects an abnormality and outputs abnormality data when the comfort degree value of the user is not within the comfort limit range. The display data generation unit may be configured to determine the comfort level of the user and the environmental data value of the air-conditioned space so that the comfort level of the user whose abnormality is detected may be distinguished from the comfort level of another user. And the abnormality identification display data may be generated, and the display unit may display the abnormality identification display data.
これにより、空調管理者が不快者の存在に早期に気づき、早期に空調設備の調整を行うことができる。As a result, the air conditioning manager notices the presence of the offender at an early stage, and the air conditioning system can be adjusted at an early stage.
本発明の快適度表示装置において、前記嗜好格納部は、タイプ別基準ユーザの空調環境に対する嗜好を格納する。前記属性格納部は、前記タイプ別基準ユーザの属性を格納し、前記空調空間の領域毎に、前記嗜好格納部に格納した前記タイプ別基準ユーザの嗜好と、前記属性格納部に格納した前記タイプ別基準ユーザの属性と、前記環境データ値取得部が取得した前記空調空間の環境データ値とに基づいて前記タイプ別基準ユーザの快適度値を生成してもよい。また、本発明の快適度表示装置は、更に、前記タイプ別基準ユーザの快適度値が所定範囲にある領域をタイプ別推奨領域に指定するタイプ別推奨領域生成部を有していてもよい。前記表示データ生成部が、前記快適度値生成部で生成した前記ユーザの快適度値と、前記タイプ別推奨領域と、前記空調空間の環境データ値とを合成してタイプ別推奨領域表示データを生成し、前記表示部が、前記タイプ別推奨領域表示データを表示してもよい。In the comfort degree display device of the present invention, the preference storage unit stores the preference for the air conditioning environment of the type-based reference user. The attribute storage unit stores the attribute of the standard user classified by type, and the preference of the standard user classified by type stored in the preference storage unit and the type stored in the attribute storage unit for each area of the air conditioning space The comfort level value of the standard user classified by type may be generated based on the attribute of the separate standard user and the environmental data value of the air-conditioned space acquired by the environmental data value acquisition unit. In addition, the comfort degree display device of the present invention may further include a type-wise recommended area generation unit that designates an area where the degree-of-comfort value of the type-based reference user is within a predetermined range as the type-wise recommended area. The display data generation unit combines the user comfort level value generated by the comfort level value generation unit, the type classified recommended area, and the environmental data value of the air-conditioned space, and displays classified type classified area data The display unit may generate and display the recommended area display data classified by type.
このように、暑がりタイプ、寒がりタイプ等のタイプ別に推奨領域を表示するので、ユーザが表示を見て自分の好みの場所に移動することを促すことができる。例えば、フリーアドレスオフィスの様に、ユーザがどの場所に着席してもよい場合、各人が好みに応じて着席すれば全体の快適度、生産性を向上させることができる。In this manner, the recommended area is displayed according to the type of heat type, cold type, etc., so that the user can be encouraged to view the display and move to his / her favorite location. For example, when a user may be seated at any place as in a free address office, the overall comfort and productivity can be improved if each person is seated according to his / her preference.
本発明の快適度表示装置は、更に、前記タイプ別推奨領域をプロジェクションマッピングまたは拡張現実で表示する移動先表示部を有していてもよい。The comfort level display device of the present invention may further include a destination display unit for displaying the type-by-type recommendation area in projection mapping or augmented reality.
前記タイプ別推奨領域をプロジェクションマッピングまたは拡張現実で表示することにより、ユーザが移動しやすくなり、全体の快適度、生産性をより向上させることができる。By displaying the type-by-type recommendation area in projection mapping or augmented reality, the user can be easily moved, and the overall comfort and productivity can be further improved.
本発明の快適度表示装置は、更に、前記空調空間の領域毎に、前記嗜好格納部に格納した前記ユーザの嗜好と、前記属性格納部に格納した前記ユーザの属性と、前記環境データ値取得部が取得した前記空調空間の環境データ値とに基づいて前記ユーザの快適度値を生成し、前記ユーザの快適度値が所定範囲にある領域をユーザ別推奨領域に指定するユーザ別推奨領域生成部を有していてもよい。前記表示データ生成部が、前記快適度値生成部で生成した前記ユーザの快適度値と、前記ユーザ別推奨領域と、前記空調空間の環境データ値とを合成してユーザ別推奨領域表示データを生成してもよい。前記表示部が、前記ユーザ別推奨領域表示データを表示してもよい。In the comfort degree display device according to the present invention, further, for each area of the air conditioning space, the preference of the user stored in the preference storage unit, the attribute of the user stored in the attribute storage unit, and acquisition of the environmental data value User's comfort level value is generated on the basis of the environmental data value of the air-conditioned space acquired by the unit, and the user's recommendation level area is designated as a user-specific recommendation area, wherein the user comfort level value is in a predetermined range You may have a part. The display data generation unit combines the user comfort degree value generated by the comfort degree value generation unit, the user-by-user recommendation area, and the environmental data value of the air-conditioned space, and displays the user-by-user recommendation area display data It may be generated. The display unit may display the user-by-user recommendation area display data.
このように、ユーザの嗜好やユーザの属性を考慮して、ユーザが空調空間の中のどの場所に行けばよいかを自動的にリコメンドするので、ユーザはディスプレイの表示等を確認することなく、容易に快適な位置に移動することができる。As described above, since the user automatically recommends where to go in the air-conditioned space in consideration of the user's preference and the user's attributes, the user can check the display etc. It can be easily moved to a comfortable position.
本発明の快適度表示装置は、更に、前記ユーザの現在状態量と前記ユーザの現在位置とを取得するユーザ状態取得部を有していてもよい。前記快適度値生成部は、前記嗜好格納部に格納した前記ユーザの嗜好と、前記属性格納部に格納した前記ユーザの属性と、前記環境データ値取得部が取得した前記空調空間の環境データ値と、前記ユーザ状態取得部が取得した前記ユーザの現在状態量と前記ユーザの現在位置とに基づいて前記ユーザの現在の快適性を示す現在快適度値を生成してもよい。本発明の快適度表示装置は、更に、前記現在快適度値が所定範囲にない場合には、前記ユーザの快適度値が所定範囲に入るまで前記ユーザの状態量を現在状態量から変更して、前記ユーザの嗜好と、前記ユーザの属性と、前記空調空間の環境データ値と、前記ユーザの現在位置とに基づいて前記ユーザの快適度値を繰り返し生成して、前記ユーザの快適度値が所定範囲に入る前記ユーザの変更状態量を確定し、前記ユーザの現在状態量と前記変更状態量の差に基づいて前記ユーザの推奨行動を生成する推奨行動生成部を有していてもよい。前記表示データ生成部は、前記快適度値生成部で生成した前記ユーザの前記現在快適度値と、前記空調空間の環境データ値と、前記推奨行動生成部が生成した前記推奨行動とを合成して推奨行動表示データを生成してもよい。前記表示部が、前記推奨行動表示データを表示してもよい。The comfort level display device of the present invention may further include a user state acquisition unit that acquires the current state amount of the user and the current position of the user. The comfort degree value generation unit may include the preference of the user stored in the preference storage unit, the attribute of the user stored in the attribute storage unit, and an environmental data value of the air-conditioned space acquired by the environmental data value acquisition unit. And a current comfort value indicating the current comfort of the user based on the current state amount of the user acquired by the user state acquisition unit and the current position of the user. The comfort degree display device of the present invention further changes the state quantity of the user from the current state quantity until the comfort degree value of the user falls within a predetermined range when the current comfort degree value is not within the predetermined range. The comfort value of the user is repeatedly generated based on the preference of the user, the attribute of the user, the environmental data value of the air conditioned space, and the current position of the user, and the comfort value of the user is You may have a recommendation action production | generation part which determines the change state quantity of the said user who enters into a predetermined range, and produces | generates the said user's recommendation action based on the difference of the user's present state quantity and the said change state quantity. The display data generation unit combines the current comfort value of the user generated by the comfort value generation unit, an environmental data value of the air-conditioned space, and the recommended action generated by the recommended action generation unit. Recommended action display data may be generated. The display unit may display the recommended action display data.
このように、ユーザの現在位置、現在状態量に基づいて、ユーザの快適性が向上する行動を推奨するので、ユーザの快適度、生産性を向上させることができる。As described above, since the action for improving the user's comfort is recommended based on the current position of the user and the current state quantity, it is possible to improve the user's comfort level and productivity.
本発明の快適度表示装置は、タイプ別基準ユーザの空調環境に対する嗜好を格納した嗜好格納部と、前記タイプ別基準ユーザの属性を格納する属性格納部と、空調空間の状況を表す環境データ値を取得する環境データ値取得部と、前記空調空間の領域毎に、前記嗜好格納部に格納した前記タイプ別基準ユーザの嗜好と、前記属性格納部に格納した前記タイプ別基準ユーザの属性と、前記環境データ値取得部が取得した前記空調空間の環境データ値とに基づいて前記タイプ別基準ユーザの快適度値を生成し、前記タイプ別基準ユーザの快適度値が所定範囲にある領域をタイプ別推奨領域に指定するタイプ別推奨領域生成部と、前記タイプ別推奨領域と、前記空調空間の環境データ値とを合成してタイプ別推奨領域表示データを生成する表示データ生成部と、前記タイプ別推奨領域表示データを表示する表示部と、を有することを特徴とする。The comfort degree display device according to the present invention includes: a preference storage unit storing preferences for the air conditioning environment of the standard user by type; an attribute storage unit storing the attributes of the standard user by type; and environmental data values representing the condition of the air conditioning space An environmental data value acquiring unit for acquiring the information, a preference of the standard user by type stored in the preference storage unit, and an attribute of the standard user by type stored in the attribute storage unit for each area of the air conditioning space; The comfort level value of the standard user classified by type is generated based on the environmental data value of the air conditioned space acquired by the environmental data value acquisition unit, and the area where the comfort degree value of the standard user classified by type is within a predetermined range is typed Display data for generating type-specific recommended area display data by combining the type-specific recommended area generation unit designated as another recommended area, the type-specific recommended area, and the environmental data value of the air-conditioned space And having a data generating unit, and a display unit for displaying the type-specific recommendation area display data.
このように、暑がりタイプ、寒がりタイプ等のタイプ別に推奨領域を表示するので、ユーザが表示を見て自分の好みの場所に移動することを促すことができる。In this manner, the recommended area is displayed according to the type of heat type, cold type, etc., so that the user can be encouraged to view the display and move to his / her favorite location.
本発明の快適度表示装置は、ユーザの空調環境に対する嗜好を格納した嗜好格納部と、前記ユーザの属性を格納する属性格納部と、空調空間の状況を表す環境データ値を取得する環境データ値取得部と、前記空調空間の領域毎に、前記嗜好格納部に格納した前記ユーザの嗜好と、前記属性格納部に格納した前記ユーザの属性と、前記環境データ値取得部が取得した前記空調空間の環境データ値とに基づいて前記ユーザの快適度値を生成し、前記ユーザの快適度値が所定範囲にある領域をユーザ別推奨領域に指定するユーザ別推奨領域生成部と、前記ユーザ別推奨領域と、前記空調空間の環境データ値とを合成してユーザ別推奨領域表示データを生成する表示データ生成部と、前記ユーザ別推奨領域表示データを表示する表示部と、を有することを特徴とする。The comfort degree display device according to the present invention includes: a preference storage unit storing a user's preference for an air conditioning environment; an attribute storage unit storing an attribute of the user; and an environmental data value acquiring an environmental data value representing a condition of the air conditioning space The acquisition unit, the preference of the user stored in the preference storage unit, the attribute of the user stored in the attribute storage unit, and the air conditioning space acquired by the environmental data value acquisition unit for each area of the air conditioning space A user-specific recommended area generation unit that generates the user's comfort level value based on the environmental data values and specifies an area where the user's comfort level value is within a predetermined range as the user-specific recommended area; A display data generation unit that combines an area and environmental data values of the air-conditioned space to generate user-specific recommended area display data, and a display unit that displays the user-specific recommended area display data And wherein the door.
このように、ユーザが空調空間の中のどの場所に行けばよいかを自動的にリコメンドするので、ユーザはディスプレイの表示等を確認することなく、容易に快適な位置に移動することができる。In this manner, the user can automatically move to a comfortable position without confirming the display etc., since the user automatically recommends which place in the air-conditioned space the user should go to.
本発明は、快適度と環境データとの関連性の把握を容易にし、適切な空調設備の管理を可能とする。The present invention facilitates understanding of comfort and relevance to environmental data, and enables appropriate management of air conditioning equipment.
以下、図面を参照しながら実施形態について説明する。Hereinafter, embodiments will be described with reference to the drawings.
<第1実施形態>
図1に示すように、第1実施形態の快適度表示装置100は、嗜好格納部101と、属性格納部102と、環境データ値取得部103と、快適度値生成部104と、表示データ生成部105と、表示部106とを含んでいる。快適度表示装置100は、図2に示す汎用コンピュータ10によって実現できる。First Embodiment
As shown in FIG. 1, the comfort
図2に示すように、汎用コンピュータ10は、情報処理を行うCPU21と、情報処理の際にデータを一時的に記憶するROM22、RAM23と、プログラムやユーザのデータ等を格納するハードディスクドライブ(HDD)24と、入力手段として設けられたマウス25と、キーボード26、及び表示装置として設けられたディスプレイ27とを含んでいる。CPU21とROM22とRAM23とHDD24とはデータバス30によって接続されている。また、マウス25とキーボード26とディスプレイ27とは入出力コントローラ28を介してデータバス30に接続されている。また、データバス30には通信手段として設けられたネットワークコントローラ29が接続されている。As shown in FIG. 2, the general-
快適度表示装置100の環境データ値取得部103、快適度値生成部104、表示データ生成部105は、図2に示す汎用コンピュータ10のハードウェアとCPU21で動作するプログラムとの協調動作により実現される。また、嗜好格納部101、属性格納部102は、図2に示す汎用コンピュータ10のHDD24によって実現される。表示部106はディスプレイ27によって実現される。嗜好格納部101、属性格納部102は、RAM23で実現されてもよい。また、嗜好格納部101、属性格納部102は、外部の記憶手段をネットワーク経由で利用することによって実現されてもよい。The environmental data
嗜好格納部101は、ユーザの空調環境に対する嗜好を格納する。空調環境に対する嗜好とは、例えば、温度に対する嗜好としての「暑がり」、「寒がり」、温度・風速に関する嗜好である「冷え症」、湿度に関する嗜好である「乾燥肌」等である。The
嗜好格納部101には図3に示すようなユーザ嗜好データベース901が格納されている。図3に示すように、ユーザ嗜好データベース901では、ユーザ名、ユーザID番号と、そのユーザが「暑がり」、「寒がり」、「冷え性」、「乾燥肌」の各項目に該当するどうかのデータがリンクされている。図3において「〇」は対応する項目に該当することを示し、「-」は対応する項目に該当しないことを示す。The
なお、「冷え性」、「乾燥肌」等は、ユーザの嗜好ではなく、人体の特性に依存するとも考えられる。しかし、冷え性」、「乾燥肌」等は、後述する属性情報のような客観性のある情報とは異なり、当該ユーザの主観的な情報と考えられる。このため、本実施形態では、冷え性」、「乾燥肌」等は、属性情報ではなく嗜好情報として扱うものとする。Note that “coldness”, “dry skin”, and the like are considered to be dependent on the characteristics of the human body, not the preference of the user. However, unlike the objective information such as attribute information described later, “coldness”, “dry skin” and the like are considered as subjective information of the user. For this reason, in the present embodiment, it is assumed that “coldness”, “dry skin” and the like are treated as preference information rather than attribute information.
属性格納部102は、ユーザの属性を格納する。ユーザの属性とは、例えば、ユーザの年齢、性別、身長、体重、体脂肪率、座席位置等である。属性格納部102には、ユーザ属性データベース902が格納されている。ユーザ属性データベース902では、図4に示すようにユーザ名、ユーザID番号と、そのユーザの年齢、性別、身長、体重、体脂肪率、座席位置等の属性情報がリンクされている。図7に示すように空調空間40の中に事務机41と椅子42とが2列×3段に配置されている場合、座席位置は、事務机41、椅子42の配置されている列名と段番号との組み合わせで表示されている。例えば、「A-1」の場合は、座席位置がA列1番であることを示す。The
環境データ値取得部103は、図7に示す空調空間40の状況を示す環境データ値を取得する。ここで、環境データ値とは、例えば、空調空間40の中の温度、湿度、風速等の値である。環境データ値取得部103は、温度センサ、湿度センサ、風速センサ等の各種センサによって各環境データ値を取得する。The environmental data
快適度値生成部104は、嗜好格納部101に格納されたユーザの嗜好と、属性格納部102に格納されたユーザの属性と、環境データ値取得部103が取得した空調空間40の環境データ値とに基づいて、ユーザの空調空間40における快適性を示す快適度値を生成する。The degree-of-comfort
快適度値生成部104は、快適性を示す指標であるPMVを用いて下記の式(1)によって快適度値を生成する。
快適度値=α×PMV+β×F-γ×R-δ ・・・・・・・・・ (1)
快適度値は、PMVと同様、0が中立、+1がやや暖かい、+2は暖かい、+3は暑いと感じることを示す。また、快適度値は、逆に-1はやや涼しい、-2は涼しい、-3は寒いと感じることを示す。The degree-of-comfort
Comfort value = α × PMV + β × F−γ × R−δ (1)
The degree of comfort value indicates that 0 is neutral, +1 is slightly warm, +2 is warm, and +3 is hot, as in PMV. Also, the degree of comfort indicates that -1 is somewhat cool, -2 is cool and -3 is cold.
PMVは、人間が暖かいと感じるか、寒いと感じるかを「7段階評価尺度による数値」で表す快適性指標である。PMVは、人体の熱的快適感に影響する要素として、温度、湿度、風速、輻射温度の4つの物理的要素と、着衣量、運動量の2つの人間側の要素の合成6つの要素を考慮した理論式(下記の式(2))によって計算される。ここで、4つの物理的要素は、環境データ値取得部103によって取得した値が用いられる。また、着衣量、運動量は、オフィスワークの際の標準的な着衣量、運動量が用いられる。なお、着衣量は、サーモカメラによって皮膚の温度と服の温度とを測定しその温度差から推定した値を用いるようにしてもよい。また、運動量は監視カメラ等の画像を分析して求めた値を用いるようにしてもよい。
PMV=(0.303e-0.036M+0.028L)×L ・・・・・ (2)
ここで、Lは、人体の熱負荷(W/m2)、Mは代謝量(W/m2)である。
PMVは、0が中立、+1がやや暖かい、+2は暖かい、+3は暑いと感じることを示す。また、PMVは、逆に-1はやや涼しい、-2は涼しい、-3は寒いと感じることを示す。-0.5<PMV<0.5がISOによるPMV値の推奨範囲とされている。The PMV is a comfort index that indicates whether a human feels warm or cold with "a numerical value according to the 7-point scale". PMV takes into consideration six physical factors of temperature, humidity, wind speed and radiation temperature, and a combination of six factors on the human side of clothing and momentum as factors affecting the thermal comfort of the human body. Calculated by the theoretical formula (Formula (2) below). Here, as the four physical elements, values acquired by the environmental data
PMV = (0.303e−0.036M + 0.028L) × L (2)
Here, L is the heat load (W / m2 ) of the human body, and M is the metabolic amount (W / m2 ).
PMV indicates that 0 is neutral, +1 is slightly warm, +2 is warm and +3 is hot. Also, PMV indicates that -1 is somewhat cool, -2 is cool and -3 is cold. The recommended range of PMV values according to ISO is -0.5 <PMV <0.5.
式(1)において、Fは嗜好情報の影響度、Rは属性情報の影響度である。また、α、β、γ、δは係数であり、ユーザの特性によって変更する。例えば、夏期であればα=1.23、β=-0.045、γ=-0.49、δ=1.05などと設定される。また、嗜好情報の影響度F及び属性情報の影響度Rは、それぞれ以下の式(3)、(4)のように算出される。
F=a×F1+b×F2+・・・ ・・・・・・・・ (3)
R=p×R1+q×R2+・・・ ・・・・・・・・ (4)
ここで、F1,F2,・・・は、「暑がり」、「寒がり」、「冷え性」、「乾燥肌」等のユーザの嗜好の各要素の度合いを示す数値である。嗜好情報の影響度Fは、嗜好情報に含まれる1又は複数の要素に基づき算出される。また、R1,R2,・・・は、「年齢」、「性別」、「身長」、「体重」、「体脂肪率」、「座席位置」等のユーザの属性の各要素の度合いを示す数値である。属性情報の影響度Rは、属性情報に含まれる1又は複数の要素に基づき算出される。また、a、b、・・・、p、q、・・・は係数である。In Formula (1), F is the influence degree of preference information, R is the influence degree of attribute information. Further, α, β, γ and δ are coefficients, which are changed according to the characteristics of the user. For example, in the summer, α = 1.23, β = −0.045, γ = −0.49, δ = 1.05, and the like. Further, the degree of influence F of preference information and the degree of influence R of attribute information are calculated as in the following formulas (3) and (4), respectively.
F = a × F1 + b × F2 +... (3)
R = p × R1 + q × R2 +... (4)
Here, F1 , F2 ,... Are numerical values indicating the degree of each factor of the user's preference such as “hot”, “cold”, “cold”, “dry skin” and the like. The degree of influence F of preference information is calculated based on one or more elements included in the preference information. Also, R1 , R2 ,... Indicate the degree of each element of the user's attributes such as “age”, “sex”, “height”, “weight”, “body fat percentage”, “seat position”, etc. It is a numerical value shown. The influence degree R of the attribute information is calculated based on one or more elements included in the attribute information. Further, a, b, ..., p, q, ... are coefficients.
なお、快適性を示す指標としてPMVに代えて、SET*(Standard new Effective Temperature、新標準有効温度)等を用いるようにしてもよい。SET*では、気温・湿度・気流・放射熱・着衣量をもとに、気流の無い相対湿度50%の場合と同じ体感となる気温で、快適性が表される。また、湿球黒球温度WBGT、有効温度ET、新有効温度ET*、OUT_SET*、作用温度OT、湿り作用温度HOT、標準湿り作用温度SHOT、修正湿り作用温度HOTV、修正新有効温度ETV、総合有効温度ETU、熱ストレス指数HSI、不快指数THI、温冷感指数TSI、PET、ETFe、UTCI、平均放射温度MRT、t*mrt、OUT_MRT、風冷指数WCI、修正有効温度CET等に基づいて快適度値を生成するようにしてもよい。It should be noted that SET* (Standard new Effective Temperature) may be used instead of PMV as an indicator of comfort. In SET* , based on air temperature, humidity, air flow, radiant heat, and amount of clothes, comfort is expressed at the same temperature as in the case of 50% relative humidity without air flow. In addition, wet bulb black ball temperature WBGT, effective temperature ET, new effective temperature ET* , OUT_SET* , action temperature OT, wet action temperature HOT, standard wet action temperature SHOT, corrected wet action temperature HOTV, corrected new effective temperature ETV, comprehensive Comfortable based on effective temperature ETU, heat stress index HSI, discomfort index THI, thermal sensation index TSI, PET, ETFe, UTCI, average radiation temperature MRT, t*mrt , OUT_MRT, wind cooling index WCI, correction effective temperature CET etc. A degree value may be generated.
湿球黒球温度WBGTは、熱中症予防のために作成された実験式である。湿球黒球温度WBGTでは、気温と湿度に加え、気流と放射も考慮されている。湿球黒球温度WBGTは、下記の式(5)で計算される。
WBGT(屋外)=0.7Tw+0.2Tg+0.1T ・・・ (5)
ここでT:乾球温度(℃)、Tw:自然湿球温度(℃)、Tg:黒球温度(℃)、Tw:暴露した自然湿球温度(℃)。Wet bulb black bulb temperature WBGT is an experimental formula created for heat stroke prevention. In addition to air temperature and humidity, air flow and radiation are also considered in the wet bulb black bulb temperature WBGT. The wet bulb black bulb temperature WBGT is calculated by the following equation (5).
WBGT (outdoor) = 0.7Tw + 0.2Tg + 0.1T (5)
T: dry bulb temperature (° C.), Tw: natural wet bulb temperature (° C.), Tg: black bulb temperature (° C.), Tw: exposed natural wet bulb temperature (° C.).
有効温度ETは、現実環境と同じ温熱感覚を与える相対湿度100%、無風時の気温である。新有効温度ET*は、気温、湿度、気流、放射、着衣量、代謝を総合的に評価できる熱平衡式に基づいた指標である。新有効温度ET*は、2ノードモデルにより発汗による体温調節機能を考慮した温度である。新有効温度ET*では、標準環境の相対湿度は50%である。新標準有効温度SET*は、相対湿度50%に加え、標準環境として風速0.135m/s及び代謝量M(met)を前提とする。また、新標準有効温度SET*は、以下の式(6)で表される標準着衣量を与え、異なった条件の温熱環境の比較を可能にする。
Icl・s=1.33 /(M+0.74)-0.095 ・・・ (6)The effective temperature ET is the temperature at the time of no wind, with a relative humidity of 100% giving the same thermal sensation as the real environment. The new effective temperature ET* is an index based on a thermal equilibrium equation that can comprehensively evaluate air temperature, humidity, air flow, radiation, clothing, and metabolism. The new effective temperature ET* is a temperature in consideration of the thermoregulatory function by perspiration according to the two-node model. At the new effective temperature ET* , the relative humidity of the standard environment is 50%. The new standard effective temperature SET* assumes 50% relative humidity and a wind speed of 0.135 m / s and a metabolic rate M (met) as a standard environment. Also, the new standard effective temperature SET* gives a standard clothing amount represented by the following equation (6), and enables comparison of thermal environments under different conditions.
Icl · s = 1.33 / (M + 0.74) −0.095 (6)
作用温度OTは、気温と放射のみを考慮した指標である。作用温度OTは、乾球温度Tと平均放射温度Trの加重平均値である。作用温度OTは、下記の式(7)で計算される。
OT=(hc×T+hr*Tr)/(hc+hr) ・・・ (7)
ここで、T:乾球温度(℃)、Tr:平均放射温度(℃)、hc:対流熱伝達率(W/℃m2)、hr:放射熱伝達率(W/℃m2)。The action temperature OT is an index considering only temperature and radiation. The action temperature OT is a weighted average value of the dry bulb temperature T and the average radiation temperature Tr. The action temperature OT is calculated by the following equation (7).
OT = (hc × T + hr * Tr) / (hc + hr ) (7)
Here, T: dry bulb temperature (° C.), Tr: average radiation temperature (° C.), hc : convection heat transfer coefficient (W / ° C. m2 ), hr : radiation heat transfer coefficient (W / ° C. m2 ) .
湿り作用温度HOTは、作用温度OTへの湿度の影響を評価できるようにした指標である。湿り作用温度HOTでは、現実の温熱環境におかれた人体からの熱損失量が皮膚からの蒸散による熱損失量と等しくなる相対湿度100%での気温が表現される。The wet working temperature HOT is an index that enables evaluation of the influence of humidity on the working temperature OT. The wet action temperature HOT represents the temperature at a relative humidity of 100% where the amount of heat loss from the human body placed in the actual thermal environment is equal to the amount of heat loss due to transpiration from the skin.
標準湿り作用温度SHOTでは、標準風速(0.1m/s)を用いて、湿り作用温度HOTに気流の影響が組み込まれている。標準湿り作用温度SHOTは、標準着衣量(0.6clo)、標準相対湿度(100%)の環境を基準としている。At the standard wet action temperature SHOT, the effect of air flow is incorporated into the wet action temperature HOT using a standard wind speed (0.1 m / s). The standard wet action temperature SHOT is based on an environment of standard clothing volume (0.6 clo) and standard relative humidity (100%).
修正湿り作用温度HOTVは、気流、放射、湿度の影響の温度換算値を、温熱風速場(TVF)、有効放射場(ERF)、減効湿度場(RHF)で表現できる指標である。修正湿り作用温度HOTVは、下記の式(8)で計算される。ただし、修正湿り作用温度HOTVには、日射及び伝導の影響は含まれていない。
HOTV=T+(TVF/Ktv)+(ERF/Ktv)+(RHF/Ktv) ・(8)
ここで、T:乾球温度(℃)、Ktv:人体の湿り総合熱伝達率(W/℃m2)である。The modified wet action temperature HOTV is an index that can express the temperature conversion value of air flow, radiation, and humidity by the thermal wind field (TVF), the effective radiation field (ERF), and the reduced-effect humidity field (RHF). The corrected wet action temperature HOTV is calculated by the following equation (8). However, the modified wetting temperature HOTV does not include the effects of solar radiation and conduction.
HOTV = T + (TVF / Ktv ) + (ERF / Ktv ) + (RHF / Ktv ) (8)
Here, T: dry bulb temperature (° C.), Ktv : wet human body total heat transfer coefficient (W / ° C. m2 ).
修正新有効温度ETVは、相対湿度100%を基準としているHOTVを相対湿度50%基準に変換した指標である。修正新有効温度ETVは、減効湿度場(RHF)に代わり、有効湿度場(EHF)を用いて定義される。ただし、修正新有効温度ETVには、日射及び伝導の影響は含まれていない。修正新有効温度ETVは、下記の式(9)で表される。
ETV=T+(TVF/hv)+(ERF/hv)+(EHF/hv) ・・ (9)
ここで、T:乾球温度(℃)、ho:基準対流熱伝導率(W/℃m2)、hr:放射熱伝達率(W/℃m2)、hv=ho×Fclo+hr×Fcl、Fclo:基準着衣の伝導効率(ND)、Fcl:着衣の伝導効率(ND)である。The modified new effective temperature ETV is an index obtained by converting HOTV based on 100% relative humidity to 50% relative humidity. The modified new effective temperature ETV is defined using the effective humidity field (EHF) instead of the reduced-effect humidity field (RHF). However, the modified new effective temperature ETV does not include the effects of solar radiation and conduction. The corrected new effective temperature ETV is expressed by the following equation (9).
ETV = T + (TVF / hv ) + (ERF / hv ) + (EHF / hv ) (9)
Where T: dry bulb temperature (° C.), ho : reference convective heat conductivity (W / ° C. m2 ), hr : radiant heat transfer coefficient (W / ° C. m2 ), hv = ho × F clo + hr x Fcl, Fclo: conduction efficiency of standard clothes (ND), Fcl: conduction efficiency of clothes (ND).
総合有効温度ETUは、日射と伝導の影響を組み込み、屋外熱環境にも不均一熱環境にも適用可能とした指標である。総合有効温度ETUは、下記の式(10)で表される。
ETU=tao+(ΣNUATFi/hu)+(ΣTVFi/hu)
+(ΣERFLi/hu)+(ΣTVFri/hu)
+(ΣERFSi/hu)+(ΣEHFi/hu)
+(ΣTVFei/hu)+(ΣSECFj/hu) ・・ (10)
ここで、tao:代表気温(℃)、NUATFi:代表気温と部位i周辺の気温との差の影響を表す不均一気温場(W/m2)、TVFi:人体に対する風速の影響を表す温熱風速場(W/m2)、ERFLi:人体に対する長波長放射の影響を表す長波長有効放射場(W/m2)、TVFri:評価対象の環境条件と基準条件との差によって生じる長波放射による有効な温度変化を表す場(W/m2)、ERFSi:人体に対する短波放射(日射)の影響を表す短波長有効放射場(W/m2)、FHFi:人体に対する湿度の影響を表す有効湿度場(W/m2)、TVFei:評価対象の環境条件と基準条件との差によって生じる蒸発による有効な水蒸気圧変化を表す場(W/m2)、SECFj:代表部材に基づいて人体に対する接触面での伝導の影響を表す標準有効伝導場(W/m2)、hu=hv×fn+hdo×fd、hv=hco×Fcleo+hr×Fcle、hdo:代表部材の熱コンダクタンス(W/m2)、fn:全人体皮膚面積に対する非接触面積の比(ND)、fd:全人体皮膚面積に対する接触面積の比(ND)、hco:基準条件における対流熱伝達率(W/Km2)、hr:放射熱伝達率(W/m2)、Fcleo:基準条件における有効伝熱効率(ND)、Fcle:着衣の有効伝熱効率(ND)。The total effective temperature ETU is an index that incorporates the effects of solar radiation and conduction and is applicable to both outdoor and non-uniform thermal environments. The total effective temperature ETU is expressed by the following equation (10).
ETU = tao + (Σ NUAT Fi / hu ) + (Σ TV Fi / hu )
+ (ΣERFLi / h u) + (ΣTVFri / h u)
+ (ΣERFSi / h u) + (ΣEHFi / h u)
+ (ΣTVFei / h u) + (ΣSECFj / h u) ·· (10)
Here, tao : representative temperature (° C.), NUATFi: non-uniform temperature field (W / m2 ) representing the effect of the difference between the representative temperature and the temperature around the site i, TVFi: thermal heat representing the effect of wind speed on the human body Wind speed field (W / m2 ), ERFLi: Long wavelength effective radiation field (W / m2 ) representing the effect of long wavelength radiation on human body, TVFri: Effective due to long wave radiation caused by difference between environmental condition to be evaluated and reference condition Field (W / m2 ) showing various temperature changes, ERFSi: Short wavelength effective radiation field (W / m2 ) showing the effect of shortwave radiation (solar radiation) on the human body, FHFi: effective humidity field showing the effect of humidity on the human body (W / m2 ), TVFei: A field (W / m2 ) representing the effective water vapor pressure change due to evaporation caused by the difference between the environmental condition to be evaluated and the reference condition (W / m2 ), SECFj: Based on the representative member Standard effective conduction field (W / m2 ) representing the effect of conduction on the contact surface, hu = hv × fn + hdo × fd , hv = hco × Fcleo + hr × F cle, hdo : Representative member Thermal conductance (W / m2 ), fn : ratio of non-contact area to whole human skin area (ND), fd : ratio of contact area to whole human skin area (ND), hco : convection at standard conditions Heat transfer coefficient (W / Km2 ), hr: radiative heat transfer coefficient (W / m2 ), Fcleo: effective heat transfer efficiency under standard conditions (ND), Fcle: effective heat transfer efficiency of dressing (ND).
熱ストレス指数HSIは、人体の水分蒸発に着目した指数である。熱ストレス指数HSIは、皮膚温を35℃に仮定した人体の熱平衡式より求める。熱ストレス指数HSIは、下記の式(11)で表される。
HIS(%)=(E/Emax)×100 ・・・・ (11)
ここで、E:人体が熱平衡を保つために必要な蒸発放散量(W/m2)、Emax:人体が完全に濡れた状態時の最大可能蒸発放熱量(W/m2)。The heat stress index HSI is an index focusing on water evaporation in the human body. The heat stress index HSI is determined from the thermal equilibrium equation of the human body assuming that the skin temperature is 35 ° C. The heat stress index HSI is represented by the following equation (11).
HIS (%) = (E / Emax) x 100 ... (11)
Here, E: Evaporative radiation amount (W / m2 ) necessary for the human body to maintain heat balance, Emax: Maximum possible evaporative heat radiation amount (W / m2 ) when the human body is completely wet.
不快指数THIは、気温と湿度を総合的に評価できる主観的経験的指標である。不快指数THIが70で10%の人が現在の環境を不快と感じる。不快指数THIが75で50%の人が現在の環境を不快と感じる。不快指数THIが80で100%の人が現在の環境を不快と感じる。不快指数THIは、下記の式(12)または、式(13)で計算される。
THI=0.72(Tv+Tw)+40.6 ・・・・ (12)
THI=0.81T+0.01RH(0.99T-14.3)+46.3 ・(13)
ここで、T:乾球温度(℃)、Tv:湿球温度(℃)、RH:相対湿度(%)。The discomfort index THI is a subjective empirical index that can comprehensively evaluate the temperature and humidity. Discomfort Index The THI is 70 and 10% of people feel the current environment offensive. Discomfort Index The THI is 75 and 50% of people feel the current environment offensive. Discomfort Index The THI is 80 and 100% of people feel the current environment offensive. The discomfort index THI is calculated by the following equation (12) or equation (13).
THI = 0.72 (Tv + Tw) +40.6... (12)
THI = 0.81 T + 0.01 RH (0.99 T-14.3) + 46.3 (13)
Here, T: dry bulb temperature (° C.), Tv: wet bulb temperature (° C.), RH: relative humidity (%).
温冷感指数TSIは、人体熱収支解析によらず、数値プログラムを用いる必要のない簡易な指標として提案された指標である。温冷感指数TSIでは、屋外における放射・風の影響が考慮されている。温冷感指数TSIは、下記の式(14)で計算される。
TSI=a1(√U+a2)×(Tb-To)+a3 ・・ (13)
ここで、U:風速(m/s)、To:作用温度(℃)、Tb:基準温度(36.8℃)、a1,a2,a3:無次元定数。Thermal sensation index TSI is an index proposed as a simple index that does not require the use of a numerical program, not based on human heat balance analysis. Thermal sensation index TSI takes into account the effects of radiation and wind in the open air. Thermal sensation index TSI is calculated by the following equation (14).
TSI = a1 (√U + a2) × (Tb−To) + a3 (13)
Here, U: wind speed (m / s), To: working temperature (° C.), Tb: reference temperature (36.8 ° C.), a1, a2, a3: non-dimensional constant.
PETは、PMVから発展させた指標で、欧州で多く用いられている。PETは、人体の熱収支に基づき、気温、放射、風速、湿度の影響を統合して表す。PET is an index developed from PMV and is widely used in Europe. PET is an integrated representation of the effects of temperature, radiation, wind speed, and humidity, based on the heat balance of the human body.
ETFeは、気温、風速、湿度、屋外での長波長放射、日射の他、姿勢の違いや接触している物質の表面温度も考慮された指標である。ETFeでは、各有効場を除す熱伝導率が風速の関数である。ETFeでは、風速と独立しているはずの日射による温度変化量が風速の影響を受ける。ETFeは、下記の式(14)で計算される。
EFTe=T+(TVFhta/hfL)+(ERFhtaL/hfL)
+(ECFhta/hfL)+(EHFETFe/hfL)
+(ERFhtaS/hfL) ・・・・・・・・・・・・ (14)
ここで、T:乾球温度(℃)、TVFhta:対流熱輸送に係る温熱風速場(W/m2)、ERFhtaL:屋外空間の長波長放射が考慮された長波長有効放射場(W/m2)、ECFhta:人体に対する接触面での伝導の影響を表す有効伝導場(W/m2)、EHFETFe:湿度の影響を表す有効湿度場(W/m2)、ERFhtaS:日射量の影響を表す屋外空間における短波長有効放射場(W/m2)、hfL:屋外における長波長放射を考慮した放射熱伝達率(W/m2k)。ETFe is an index that takes into consideration temperature difference, wind speed, humidity, long wavelength radiation outdoors, solar radiation, as well as the difference in posture and the surface temperature of the substance in contact. In ETFe, the thermal conductivity excluding each effective field is a function of wind speed. In ETFe, the temperature change due to solar radiation, which should be independent of the wind speed, is affected by the wind speed. ETFe is calculated by the following equation (14).
EFTe = T + (TVF hta / h fL) + (ERF htaL / h fL)
+ (ECFhta / hfL ) + (EHFETFe / hfL )
+ (ERFhtaS / hfL ) ·························································································································································································································································································· (14)
Where T: dry bulb temperature (° C.), TVFhta : thermal wind velocity field (W / m2 ) related to convective heat transfer, ERFhta L : long wavelength effective radiation field (W /M2 ), ECFhta : effective conduction field (W / m2 ) representing the influence of conduction on the contact surface with the human body, EHFET Fe : effective humidity field (W / m2 ) representing the influence of humidity, ERFhtaS : Short wavelength effective radiation field (W / m2 ), hfL : Radiant heat transfer coefficient (W / m2 k) considering long wavelength radiation in the outdoor space, which represents the influence of solar radiation.
UTCIは、国際生気象学会により提唱されている指標である。UTCIは、UTCI-Fiala MNモデルによる熱収支計算に基づき、気温、放射、風速、湿度の影響を統合して表わされる。UTCIでは、標準状態は、2.3MET(4km/hの歩行)、風速0.5m/s(観測高度10m)、気温と同等の平均放射温度、相対湿度50%(気温29℃より大きい場合は20hpa)と規定されている。UTCI is an index proposed by the International Society of Living Meteorology. UTCI is expressed by integrating the effects of temperature, radiation, wind speed, and humidity based on heat balance calculation using the UTCI-Fiala MN model. In UTCI, the standard condition is 2.3 MET (4 km / h walking), wind speed 0.5 m / s (observed altitude 10 m), average radiation temperature equivalent to air temperature,
平均放射温度MRTは、体感指標の算出の際に放射のパラメータとして用いられる。平均放射温度MRTは、周囲の全方向から受ける放射熱を平均化した周辺表面の平均温度表示を言う。平均放射温度MRTは、以下の式(15)で計算される。
tr=Σ(ti×Φi) ・・・・・・・・・・・・ (15)
ここで、ti:面i の表面温度(℃)、φi:面iの形態係数(ND)。The mean radiation temperature MRT is used as a parameter of radiation when calculating the sensation index. Mean radiation temperature MRT refers to an average temperature indication of the peripheral surface obtained by averaging radiant heat received from all directions of the surrounding. The mean radiation temperature MRT is calculated by the following equation (15).
tr = Σ (ti × Φi ) ...... (15)
Here, ti : surface temperature of the surface i (° C.), φi : form factor of the surface i (ND).
平均放射温度t*mrtは、日射を考慮した平均放射温度の一つである。平均放射温度t*mrtは、以下の式(16)で計算される。
t*mrt=[tmrt4+fp×ak×(I*/εp・σ)]0.25-273.2 ・(16)
ここで、tmrt:直達日射を含まない平均放射温度、fp:人体投影面積率(ND)、ak:短波長放射に対する吸収率(ND)、I*:法線面直達日射量(W/m2)、εp:着衣人体の放射率(=0.97(ND))、σ:ステファンボルツマン定数(5.67×10-8 (W/m2K4))。The average radiation temperature t*mrt is one of the average radiation temperatures considering solar radiation. The average radiation temperature t*mrt is calculated by the following equation (16).
t * mrt = [t mrt 4 + f p × a k × (I * / ε p · σ)] 0.25 -273.2 · (16)
Where tmrt : average radiation temperature not including direct solar radiation, fp : human body projected area ratio (ND), ak : absorptivity for short wavelength radiation (ND), I* : normal surface direct solar radiation (W / M 2), εp : Emissivity of the dressed human body (= 0.97 (ND)), σ: Stefan-Boltzmann constant (5.67 × 10⁻⁸ (W / m2 K4 )).
OUT_MRTは、日射を考慮した平均放射温度の一つである。OUT_SET*は、MRTの入力項にOUT_MRTを用いることで日射が加味された指標である。OUT_MRT is one of the average radiation temperatures in consideration of solar radiation. OUT_SET* is an index in which solar radiation is added by using OUT_MRT for the input term of MRT.
風冷指数WCIは、冬季の凍傷、低体温症予防に利用される指数である。風冷指数WCIは、次の式(17)のように、気温と風速の関数式から計算される。
WCI=(33-T)×(10.45+10U0.5-U) ・・・・ (17)
ここで、T:乾球温度(℃)、U:風速(m/s)。Wind and cold index WCI is an index used for winter frostbite and hypothermia prevention. The coldness index WCI is calculated from the functional equation of the air temperature and the wind velocity as the following equation (17).
WCI = (33-T) x (10. 45 + 10 U0.5- U) (17)
Here, T: dry bulb temperature (° C.), U: wind speed (m / s).
修正有効温度CETは、有効温度ETに周壁面の放射効果を加え、修正をおこなった指標である。修正有効温度CETでは、有効温度ETの乾球温度計の代わりにグローブ温度計が用いられる。The correction effective temperature CET is an index obtained by adding the radiation effect of the peripheral surface to the effective temperature ET and performing correction. In the modified effective temperature CET, a glove thermometer is used instead of the dry bulb thermometer of the effective temperature ET.
表示データ生成部105は、快適度値生成部104が生成した快適度値と環境データ値取得部103が取得した環境データ値とを重ね合わせて表示部106で表示できるように、2つのデータを合成する。そして、表示データ生成部105は、合成により得られたデータを表示データとして表示部106に出力する。The display
表示部106は、表示データ生成部105から入力された表示データを表示する。表示部106は、例えば、図2に示すディスプレイ27である。The
以上の様に構成された本実施形態の快適度表示装置100の動作と表示部106の表示を、図5-7を参照しながら説明する。The operation of the comfort
図5のステップS101、S102に示すように、快適度値生成部104は、嗜好格納部101からユーザの嗜好データを、属性格納部102からユーザの属性データを読み出す。また、図5のステップS103に示すように、快適度値生成部104は、環境データ値取得部103から環境データ値を取得する。そして、図5のステップS104に示すように、快適度値生成部104は、先に説明した式(1)から(4)を用いてユーザの快適度値を生成する。図5のステップS105に示すように、表示データ生成部105は、快適度値生成部104が生成した快適度値と環境データ値取得部103から取得した環境データ値とを合成して表示データを生成し、生成した表示データを表示部106に出力する。図5のステップS106に示すように、表示部106は、入力された表示データを表示する。As shown in steps S101 and S102 of FIG. 5, the degree-of-comfort
図6は、表示部106の表示の例を示す。図6は、図7にXY平面で示される空調空間40の中の特定の位置における温度の変化とユーザの快適度の時間変化を示す図である。ここで、空調空間40では、図7に示すように、床に事務机41と椅子42が配置され、天井に空調設備の吹き出し口43が配置されている。また、空調空間40は、パーティション44で仕切られている。事務机41、椅子42は、A列、B列の二列で1番から3番まで3段に配置されている。座席位置は、[列名-段番号]で表され、図6に示す、Point[A-1]は、A列1番の座席位置を示す。図6には、図7に示す空調空間40の中のA列1番の座席位置における温度の時間変化を示す実線Tが表示されている。また、図6には、図7に示す空調空間40の中のA列1番の座席位置における標準的なユーザAの快適度を示す破線aと、寒がりのユーザBの快適度を示す二点鎖線bと、暑がりのユーザCの快適度を示す一点鎖線cとが表示されている。ここで、標準的なユーザAは、「暑がり」でも「寒がり」でも「冷え性」でも「乾燥肌」でもなく、「年齢」、「身長」、「体重」、「体脂肪率」等がその会社の平均値のユーザである。寒がりのユーザBは、「寒がり」で「冷え性」で、「体重」、「体脂肪率」がその会社の標準よりも小さい女性のユーザである。暑がりのユーザCは、「暑がり」で、「体重」、「体脂肪率」がその会社の標準よりも大きい男性のユーザである。FIG. 6 shows an example of display on the
なお、実線Tで示す温度、破線a、二点鎖線b、一点鎖線cで示すユーザA、B、Cの各快適度値は時間に対する離散値である。しかしながら、図6では、各離散値を補完して滑らかな線として表示している。この補完については後で第4実施形態として説明する。The comfort values of the temperature indicated by the solid line T, the broken line a, the two-dot chain line b, and the users A, B, C indicated by the one-dot chain line c are discrete values with respect to time. However, in FIG. 6, each discrete value is complemented and displayed as a smooth line. This complementation will be described later as a fourth embodiment.
図6に示すように、温度の比較的高い時間帯では、一点鎖線cで示す暑がりのユーザCは、暖かく、あまり快適ではないと感じ、快適度値は+1程度になっている。一方、同じ温度でも、二点鎖線bで示す寒がりのユーザBは暑くもなく、寒くもなく快適な状況と感じ、快適度値は0程度となっている。また、標準的なユーザAの感じる快適度はユーザBとユーザCとの中間の0.2程度となっている。As shown in FIG. 6, in the relatively high temperature time zone, the user C with the heat indicated by the alternate long and short dash line c feels warm and not very comfortable, and the comfort value is about +1. On the other hand, even at the same temperature, the user B with a coldness indicated by a two-dot chain line b does not feel hot and feels a cold and comfortable situation, and the comfort value is about 0. Also, the standard degree of comfort felt by the user A is about 0.2, which is intermediate between the user B and the user C.
反対に、温度の比較的低い時間帯では、一点鎖線cで示す暑がりのユーザCは、暑くもなく、寒くもなく快適な状況と感じ、快適度値は0程度となっている。一方、同じ温度でも、二点鎖線bで示す寒がりのユーザBは、涼しく、あまり快適ではないと感じ、快適度値は-1程度になっている。また、標準的なユーザAの感じる快適度はユーザBとユーザCとの中間の-0.5程度となっている。On the other hand, in a relatively low temperature time zone, the user C of the heat indicated by the alternate long and short dash line c feels as a comfortable condition without being hot or cold, and the comfort value is about 0. On the other hand, even at the same temperature, the user B of the coldness indicated by the two-dot chain line b feels cool and not very comfortable, and the comfort value is about -1. In addition, the standard degree of comfort felt by the user A is about -0.5, which is intermediate between the user B and the user C.
図6の表示から、空調設備の管理者(空調管理者)は、ユーザA、B、Cの快適度値の変化と温度の相関関係を把握することができる。そして、例えば、座席位置A-1に暑がりのユーザCが着席している場合には、空調管理者は、座席位置A-1の温度が少し低めになるように空調設備の設定温度を調節することができる。また、逆に座席位置A-1に寒がりのユーザBが着席している場合には、空調管理者は、座席位置A-1の温度が少し高めになるように空調設備の設定温度を調整することができる。From the display of FIG. 6, the manager of the air conditioning facility (air conditioning manager) can grasp the correlation between the change in the degree of comfort value of the users A, B and C and the temperature. Then, for example, when a hot user C is seated at the seat position A-1, the air conditioning manager adjusts the set temperature of the air conditioner so that the temperature of the seat position A-1 becomes slightly lower. be able to. Conversely, when a cold user B is seated at the seat position A-1, the air conditioning manager adjusts the set temperature of the air conditioner so that the temperature of the seat position A-1 becomes slightly higher. can do.
また、快適度表示装置100は、図7に示すように、ある時刻におけるXY平面で示す空調空間40の中の温度分布の上に、その時刻における各座席位置に座っているユーザの快適度を示すマークを重ね合わせて表示部106に表示させることができる。先に説明したように、図7に示す空調空間40では、床に事務机41、椅子42が配置され、天井に空調設備の吹き出し口43が配置されている。また、空調空間40は、パーティション44で仕切られている。各椅子42の中央にはユーザの快適度を示す顔のマークが表示されている。図7において、笑顔のマークは、ユーザが快適と感じていることを示す。また、笑顔のマークは、その座席位置でのそのユーザの快適度値が-0.5から+0.5の範囲に対応する。また、口の両端を下げている不快顔のマークは、その座席位置でのそのユーザが暖かい、あるいは涼しいと感じていることを示す。換言すると、不快顔のマークは、ユーザが不快と感じていることを示す。不快顔のマークは、+1.5を超える快適度値、あるいは-1.5より小さい快適度値に対応する。また、通常の顔のマークは、ユーザがこれらの中間でやや暖かい、あるいは、やや涼しいと感じていることを示す。換言すると、通常の顔のマークは、ユーザが快適と不快の中間で、快適ではないが不快ではないと感じていることを示す。通常の顔のマークは、快適度値が0.5~1.5、-0.5~-1.5の間に対応する。このような表示により、空調管理者は、ある時刻において、空調空間40の中で温度がどのように分布しており、各ユーザがどのように感じているかを容易に認識できる。In addition, as shown in FIG. 7, the comfort
また、空調管理者は、図7に示す表示に基づいて、空調空間40の中のどの位置の設定温度を調整すれば良いかを容易に判断することができる。例えば、座席位置A-2のユーザが不快顔で表示されており、このユーザが「暑がり」の場合、空調管理者は、このユーザの座る座席位置A-2近傍への冷風量が多くなるように空調設備の設定を調整することができる。例えば、空調管理者は、ルーバの方向を変更する、または冷風の温度が低くなるように温度設定を下げるといった調整を行うことができる。また、逆に、例えば、座席位置A-2のユーザが「寒がり」、「冷え性」の場合、空調管理者は、このユーザの座る座席位置A-2近傍への冷風量が少なくなるように空調設備の設定を調整することができる。例えば、空調管理者は、ルーバの方向を変更する、または冷風の温度が高くなるように温度設定を上げるといった調整を行うことができる。Further, the air conditioning manager can easily determine which position in the
このように、本実施形態の快適度表示装置100は、快適度値と環境データ値とを表示部106に重ね合わせて表示するので、空調管理者は、快適度と環境データとの関連性を容易に把握することができる。このため、本実施形態の快適度表示装置100は、空調管理者が適切に空調設備の調整を行うことを可能にする。As described above, since the comfort
<第2、第3実施形態>
次に図8及び図9を参照しながら第2実施形態の快適度表示装置200を説明する。また、図10及び図11を参照しながら第3実施形態の快適度表示装置250を説明する。その後、図12から図15を参照しながら快適度表示装置200、250の表示例を説明する。Second and Third Embodiments
Next, the comfort
<第2実施形態>
図8に示すように、第2実施形態の快適度表示装置200では、図1を参照して説明した快適度表示装置100に基本統計量算出部207が追加されている。快適度表示装置200を構成する、嗜好格納部201、属性格納部202、環境データ値取得部203、快適度値生成部204、表示部206は、図1を参照して説明した快適度表示装置100の嗜好格納部101、属性格納部102、環境データ値取得部103、快適度値生成部104、表示部106と同様であるので、説明は省略する。Second Embodiment
As shown in FIG. 8, in the comfort
基本統計量算出部207は、快適度値基本統計量と環境データ値基本統計量とを算出すする。ここで、快適度値基本統計量は、快適度値生成部204で生成したユーザの快適度値を代表する基本統計量である。快適度値基本統計量は、以下の(1)から(5)のグループを有している。
(1)ユーザの快適度値の時間平均値または空間平均値
(2)ユーザの快適度値の時間中央値または空間中央値
(3)ユーザの快適度値の時間最大値または空間最大値
(4)ユーザの快適度値の時間最小値または空間最小値
(5)ユーザの快適度値の時間最頻値または空間最頻値The basic
(1) time average value or space average value of user comfort value (2) time median value or space median value of user comfort value (3) time maximum value or space maximum value of user comfort value (4 ) User's comfort value time minimum value or space minimum value (5) User's comfort value time mode value or space mode value
また、環境データ値基本統計量は、環境データ値取得部203が取得した空調空間40の環境データを代表する基本統計量である。環境データ値基本統計量は、以下の(6)から(10)のグループを有している。
(6)空調空間の環境データ値の時間平均値または空間平均値
(7)空調空間の環境データ値の時間中央値または空間中央値
(8)空調空間の環境データ値の時間最大値または空間最大値
(9)空調空間の環境データ値の時間最小値または空間最小値
(10)空調空間の環境データ値の時間最頻値または空間最頻値Further, the environmental data value basic statistic is a basic statistic representing the environmental data of the air-conditioned
(6) Temporal average value or spatial average value of environmental data values in air-conditioned space (7) Median time or median value of environmental data values in air-conditioned space (8) Maximum time or spatial maximum value of environmental data values in air-conditioned space Value (9) Temporal minimum value or spatial minimum value of environmental data value in air-conditioned space (10) Temporal mode value or spatial mode value of environmental data value in air-conditioned space
ここで、時間平均値とは、例えば、一日、一週間、一か月等の所定期間における各平均値である。また、空間平均値とは、ブロック内におけるユーザの快適度の平均値、あるいは、そのブロック内における環境データ値の平均値である。例えば、図7のXYで示す空調空間40をいくつかのブロックに区切る。そして、得られた各ブロックにおけるユーザの快適度の平均値、あるいは、各ブロックにおける環境データ値の平均値が空間平均値に相当する。つまり、空間平均値は、所定空間における平均値である。Here, a time average value is each average value in predetermined periods, such as one day, one week, one month, etc., for example. Further, the spatial average value is an average value of the user's comfort level in the block or an average value of environmental data values in the block. For example, the air-conditioned
同様に、時間中央値、空間中央値は、それぞれ所定期間、所定空間における中央値である。時間最大値、空間最大値は、それぞれ所定期間、所定空間における最大値である。時間最小値、空間最小値は、それぞれ所定期間、所定空間における最小値である。時間最頻値、空間最頻値は、それぞれ所定期間、所定空間における最頻値である。Similarly, the time median and the space median are median values in a predetermined space for a predetermined period, respectively. The time maximum value and the space maximum value are respectively maximum values in a predetermined space for a predetermined period. The time minimum value and the space minimum value are respectively minimum values in a predetermined space for a predetermined period. The temporal mode value and the spatial mode value are modes in a predetermined space for a predetermined period, respectively.
よく知られているように、平均値は、データの値をすべて足し、加算値をデータの個数で割った数値である。平均値は、データの分布の中心を表す指標として用いられることが多い。ただし、データが正規分布に近い場合は、平均値がデータの分布の中心を示すが、分布が偏っている場合には、必ずしもデータの分布の中心を示さない場合がある。中央値は、データを昇順に並べた場合の真ん中の値である。最頻値は、データの集合の中で、最も頻繁に現れる値である。平均値がデータの分布の中心を示さない場合には、中央値、最頻値を用いることによりデータの分布の中心をより正確に把握できる場合がある。また、最大値及び最小値は、データの値の広がりの幅を示す指標である。最大値及び最小値は、データの中の特異点を発見する際などに用いられる指標である。As is well known, the average value is a value obtained by adding all data values and dividing the added value by the number of data. The mean value is often used as an index that represents the center of the data distribution. However, if the data is close to a normal distribution, the mean value indicates the center of the data distribution, but if the distribution is biased, it may not necessarily indicate the center of the data distribution. The median is the middle value when the data is arranged in ascending order. The mode is the value that appears most frequently in the data set. When the mean value does not indicate the center of the data distribution, the center of the data distribution may be more accurately grasped by using the median and the mode value. Further, the maximum value and the minimum value are indexes indicating the width of the spread of the data value. The maximum value and the minimum value are indexes used when finding singular points in the data.
表示データ生成部205は、快適度値生成部204が生成したユーザの快適度値と、環境データ値取得部203が取得した空調空間40の環境データ値と、基本統計量算出部207が算出したユーザの快適度値を代表する快適度値基本統計量と空調空間40の環境データ値を代表する環境データ値基本統計量の内のいずれか1つまたは複数と、を合成して表示統合データを生成する。そして、表示データ生成部205は、生成した表示統合データをて表示部206に出力する。より詳細には、表示データ生成部205は、基本統計量算出部207が算出したユーザの快適度値の時間平均値、空間平均値、時間中央値、空間中央値、時間最大値、空間最大値、時間最小値、空間最小値、時間最頻値、空間最頻値、空調空間40の環境データ値の時間平均値、空間平均値、時間中央値、空間中央値、時間最大値、空間最大値、時間最小値、空間最小値、時間最頻値、空間最頻値、の内のいずれか1つまたは複数を、快適度値と環境データ値と合成し、合成により得られた表示統合データを表示部206に出力する。The display
次に図9を参照しながら快適度表示装置200の動作を説明する。以下では、基本統計量算出部207が、快適度値生成部204が生成した快適度値の時間平均値あるいは空間平均値と、環境データ値取得部203が取得した環境データ値の時間平均値あるいは空間平均値を算出する例を説明する。また、図5を参照して説明した快適度表示装置100の動作と同じステップは、各ステップに図5と同じ符号を付し、簡単に説明する。Next, the operation of the comfort
快適度値生成部204は、図9のステップS101~S103に示すように、ユーザの嗜好及び属性を読み出し、また、環境データ値を取得する。図9のステップS201に示すように、基本統計量算出部207は、快適度値基本統計量のグループ(1)の快適度値の時間平均値あるいは空間平均値を算出する。また、基本統計量算出部207は、図9のステップS202において、環境データ値基本統計量のグループ(6)の空調空間40の環境データ値の時間平均値あるいは空間平均値を算出する。As shown in steps S101 to S103 of FIG. 9, the degree-of-comfort
図9のステップS203に示すように、表示データ生成部205は、快適度値生成部204が生成したユーザの快適度値と、環境データ値取得部203が取得した空調空間40の環境データ値と、基本統計量算出部207が算出したユーザの快適度値の時間平均値または空間平均値と空調空間40の環境データ値の時間平均値または空間平均値の内のいずれか1つまたは複数と、を合成して表示統合データを生成し、生成した表示統合データを表示部206に出力する。そして、表示部206は、図9のステップS106に示すように、表示データ生成部205の生成した表示統合データを表示する。表示部206の表示例については、第3実施形態の快適度表示装置250の説明の後で説明する。As shown in step S203 of FIG. 9, the display
以上、基本統計量算出部207が平均値を算出する例を説明した。中央値を算出し、表示する場合には、図9のステップS201で、基本統計量算出部207は、快適度値基本統計量のグループ(2)の快適度値の時間中央値あるいは空間中央値を算出し、図9のステップS202において、基本統計量算出部207は、環境データ値基本統計量のグループ(7)の空調空間40の環境データ値の時間中間値あるいは空間中間値を算出する。同様に、最大値、最小値または最頻値を算出し、表示する場合には、基本統計量算出部207は、快適度値基本統計量のグループ(3)、(4)または(5)の快適度値の最大値、最小値または最頻値を算出し、図9のステップS202において、環境データ値基本統計量のグループ(8)、(9)または(10)の環境データ値の最大値、最小値または最頻値を算出する。他の動作については、先に説明した平均値を算出する場合と同様である。Heretofore, an example has been described in which the basic
また、表示部206は、快適度値と環境データ値の異なる基本統計量を組み合わせて表示してもよい。例えば、基本統計量算出部207が快適度値の時間平均値または空間平均値と、空調空間40の環境データ値の時間中間値あるいは空間中間値とを算出し、これらを表示部206に表示するようにしてもよい。Moreover, the
<第3実施形態>
図10及び図11に示すように、第3実施形態の快適度表示装置250の表示データ生成部255は、基本統計量算出部257が算出したユーザの快適度値を代表する快適度値基本統計量と空調空間40の環境データ値を代表する環境データ値基本統計量の内のいずれか1つまたは複数と、を合成して統計量表示データを生成して表示部256に出力する。表示データ生成部255は、快適度値生成部254の生成したユーザの快適度値、環境データ値取得部253が取得した環境データ値との合成は行わない。従って、快適度表示装置250は、表示部256に快適度の快適度値基本統計量と環境データの環境データ値基本統計量とのみを表示する。Third Embodiment
As shown in FIGS. 10 and 11, the display
ここで、快適度値基本統計量、環境データ値基本統計量は、先に説明したように、時間平均値、空間平均値、時間中央値、空間中央値、時間最大値、空間最大値、時間最小値、空間最小値、時間最頻値及び空間最頻値を含む。以下では、基本統計量算出部257が、快適度値生成部254が生成した快適度値の時間平均値あるいは空間平均値と、環境データ値取得部253が取得した環境データ値の時間平均値あるいは空間平均値を算出する例を説明する。Here, the comfort value basic statistics and environmental data values basic statistics are, as described above, time average value, space average value, time median value, space median value, time maximum value, time maximum value, space maximum value, time The minimum value, the spatial minimum value, the temporal mode value and the spatial mode value are included. In the following, the basic
また、快適度表示装置250を構成する、嗜好格納部251、属性格納部252、環境データ値取得部253、快適度値生成部254、表示部256は、図8を参照して説明した快適度表示装置200の嗜好格納部201、属性格納部202、環境データ値取得部203、快適度値生成部204、表示部206と同じであるので、説明は省略する。また、図11のステップS201、S202の動作は先に図9に示したステップS201、S202の動作と同じなので、説明は省略する。The
図11に示すように、快適度表示装置250は、図9のステップS203の表示統合データに代えて図11のステップS204において統計量表示データを生成する(ステップS204)。表示部256は、この統計量表示データを表示する(ステップS106)。As shown in FIG. 11, the comfort
<第2、第3実施形態の快適度表示装置200、250の表示例>
次に、第2、第3実施形態の快適度表示装置200、250の表示例について説明する。<Display Example of Comfort
Next, display examples of the comfort
図6は、第2実施形態の快適度表示装置200の表示例の一つである。先に説明したように、図6は、図7にXY平面で示される空調空間40の特定の位置である、A列、1番の座席位置A-1における温度と、ユーザA、B、Cの快適度の時間変化を示したものである。図6中の右側には、所定期間の平均温度と、ユーザ別の所定期間の快適度値の平均値の数値が表示されている。このように、図6では、快適度値生成部204の生成したユーザA、B、Cの快適度値の時間変化(破線a、二点鎖線b、一点鎖線c)が示される。また、図6では、環境データ値取得部203が取得した空調空間40の環境データ値の時間変化(実線T)が示される。更に、図6では、基本統計量算出部207が算出したユーザA、B、Cの快適度値の時間平均値と、空調空間40の環境データ値である温度の時間平均値とが示される。つまり、図6は、ユーザA、B、Cの快適度値の時間変化(破線a、二点鎖線b、一点鎖線c)、空調空間40の環境データ値の時間変化(実線T)及びユーザA、B、Cの快適度値の時間平均値と、空調空間40の環境データ値である温度の時間平均値とが合成された表示統合データを表示部206に出力した例を示す。このように、図6は、第2実施形態の快適度表示装置200の表示例の一つである。FIG. 6 is one of the display examples of the comfort
図7は、第2実施形態の快適度表示装置200の表示例の一つである。図7は、ある時刻におけるXY平面で示す空調空間40の中の温度分布の上に、その時刻における各座席位置に座っているユーザの快適度を示すマークを重ね合せて表示した例を示す。また、図7の右側には、所定期間の平均温度と、所定期間における全ユーザの快適度値の平均値が表示されている。このように、図7では、快適度値生成部204の生成した各ユーザの快適度値に対応したマークが示される。また、図7では、環境データ値取得部203が取得した空調空間40の温度分布が示される。つまり、図7は、基本統計量算出部207が算出した全ユーザの快適度値の空間平均値と、空調空間40の温度の空間平均値と、が合成された表示統合データを表示部206に出力した例を示す。このように、図7は、第2実施形態の快適度表示装置200の表示例の一つである。FIG. 7 is one of the display examples of the comfort
図12は、第3実施形態の快適度表示装置250の表示例の一つである。図12は、図6と同様、図7にXY平面で示される空調空間40の特定の位置であるA列1番の座席位置A-1における温度と、ユーザA、B、Cの快適度の一日毎の変化を示している。図12において、円形のプロット付きの実線Tは温度の変化を示す。三角のプロット付きの破線aは標準的なユーザAの快適度値の変化を示す。四角のプロット付きの二点鎖線bは「寒がり」のユーザBの快適度値の変化を示す。星形のプロット付きの一点鎖線cは、「暑がり」のユーザCの快適度値の変化を示す。先に説明した例と同様、標準的なユーザAは、「暑がり」でも「寒がり」でも「冷え性」でも「乾燥肌」でもなく、「年齢」、「身長」、「体重」、「体脂肪率」等がその会社の平均値のユーザである。寒がりのユーザBは、「寒がり」で「冷え性」で、「体重」、「体脂肪率」がその会社の標準よりも小さい女性のユーザである。暑がりのユーザCは、「暑がり」で、「体重」、「体脂肪率」がその会社の標準よりも大きい男性のユーザである。FIG. 12 is one of the display examples of the comfort
図12において、横軸は、8月1日~8月10日までの各日を示す。各プロットはそれぞれその日の平均値を示す。例えば、円形のプロットは、その日一日の平均温度を示す。三角、四角及び星形の各プロットは、その日一日の各ユーザA、B、Cの快適度値の平均値を示す。従って、図12は、基本統計量算出部257が算出した各ユーザの快適度値の一日の平均値と、空調空間40の環境データ値である温度の一日の平均値とが合成された統計量表示データを表示部256に出力した際の表示例である。また、図12の右側には、座席位置A-1における8月の一か月の平均温度と、各ユーザA、B、Cの8月の一か月の平均の快適度値と、が表示されている。In FIG. 12, the horizontal axis indicates each day from August 1st to August 10th. Each plot shows the average value of the day. For example, a circular plot shows the average temperature of the day and day. The triangular, square and star-shaped plots show the average value of the comfort value of each user A, B, C of the day. Therefore, in FIG. 12, the average value of the daily comfort level of each user calculated by the basic
また、図12に示す表示例では、日付バー下部にその日の天気を示す天気バーが設けられている。図12では、A列1番の座席位置A-1における温度と、ユーザA、B、Cの快適度の一日毎の変化が表示される。また、図12では、環境データ値の一つである天気の一日毎の変化が表示される。図12では、天気として、その一日を代表する天候状態を晴れ、曇り、雨等のマークで示している。Further, in the display example shown in FIG. 12, a weather bar indicating the weather on that day is provided at the bottom of the date bar. In FIG. 12, the change in the temperature at the seat position A-1 in row A and the degree of comfort of the users A, B and C on a daily basis is displayed. Moreover, in FIG. 12, the daily change of the weather which is one of the environmental data values is displayed. In FIG. 12, as weather, the weather conditions representing the day are indicated by marks such as sunny, cloudy, and rain.
このように、図12は、表示部256に快適度の平均値と環境データの平均値とのみを表示する快適度表示装置250の表示例を示すものである。なお、快適度表示装置200の表示データ生成部205において、快適度の平均値と環境データの平均値とのみを合成して統計量表示データを生成し、生成した統計量表示データを表示部206に表示させるようにしてもよい。Thus, FIG. 12 shows a display example of the comfort
また、図12のように快適度の平均値と環境データの平均値とのみが表示された場合において、例えば、空調管理者が特定の日、あるいは特定の時刻の空調空間40の中の温度分布と各ユーザの快適度値とを把握したい場合がある。そこで、図12に示す日付バーの日付部のクリックによって図13に示すようにその日の空調空間40の温度の分布と各ユーザの快適度値に対応するマークとを表示するようにしてもよい。図7と同様、図13において、笑顔のマークはユーザが快適と感じていることを示す。笑顔のマークは、快適度値が-0.5から+0.5の範囲に対応する。不快顔のマークはユーザが不快と感じている場合を示す。不快顔のマークは、+1.5を超える、快適度値あるいは-1.5より小さい快適度値に対応する。ユーザが快適と不快の中間で、快適ではないが不快ではないと感じていることを示す。通常の顔のマークは、快適度値が0.5~1.5、-0.5~-1.5の間に対応する。図13では、例えば、図12に示す「8/1」のように晴れている日の空調空間40の中での温度分布と各ユーザの快適度に対応したマークとが示されている。また、図13では、窓45の外に晴れのマークと日光が窓45から入射している状態が追加で表示されている。図14では、例えば、図12に示す「8/2」のように雨の日の空調空間40の中での温度分布と各ユーザの快適度に対応したマークとが示されている。ユーザの快適度値に対応するマークと快適度値との対応関係は図13と同様である。また、図14では、窓45の外に雨のマークを表示している。空調管理者は、図13に示す晴れの日の温度分布及びユーザの快適度の分布と、図14に示す雨の日の温度分布及びユーザの快適度の分布との差から、晴れの日と雨の日とで空調設備の調整を変化させることができる。Further, when only the average value of the comfort level and the average value of the environmental data are displayed as shown in FIG. 12, for example, the temperature distribution in the
なお、図13、図14において、ある一日の平均温度の分布と一日の平均快適度の分布とを表示するようにしてもよい。In FIG. 13 and FIG. 14, the distribution of the average temperature for a certain day and the distribution of the average degree of comfort for the day may be displayed.
図15は、第2実施形態の快適度表示装置200の表示例の一つである。図15では、4つの椅子52と1つのテーブル51で構成されるテーブルセット55が4つ配置されている。また、図15では、各テーブル51の上に空調設備の吹き出し口53が配置されている。そして、図15では、このような空調空間50の中の温度分布と、ユーザの快適度、平均快適度が表示されている。テーブルセット55は、A、Bの2列、1番、2番の2段に配置されている。図15において、各椅子52の中央の数字は、各椅子52の位置にいるユーザの快適度値を示す。また、テーブル51の中央の数字は、1つのテーブル51についている4人のユーザの快適度値の平均値をそのテーブルセット55の代表快適度値として表示している。図15の表示は、例えば、空調管理者がテーブルセット55の代表快適値が中立のゼロとなるように空調設備を調整する場合等に有効である。FIG. 15 is one of the display examples of the comfort
このように、快適度表示装置200、250は、快適度値基本統計量である時間平均値と環境データ値基本統計量である時間平均値とを重ね合わせて表示する。このため、空調管理者は、快適度と環境データとの関連性の傾向を把握することができ、空調設備の交換、追設等の必要性を容易に判断することができる。また、快適度表示装置200、250は、快適度値の空間平均値と環境データ値の空間平均値とを重ね合わせて表示する。このため、空調管理者は、快適度と環境データとの空間的な関連性の傾向を把握することができ、空調空間40、50の特定エリアの空調設備の交換やパーティション等のビル設備の追設等の必要性を容易に判断することができる。Thus, the comfort
また、快適度表示装置200、250は、平均値に代えて、中央値、最大値、最小値または最頻値を算出し、算出した値を表示することができる。これにより、空調管理者の空調設備の管理及びユーザの空調設備の利用を容易にすることができる。Further, the comfort
<第4実施形態>
次に、図16、17を参照しながら、第4実施形態の快適度表示装置300について説明する。図16に示すように、第4実施形態の快適度表示装置300では、図1を参照して説明した快適度表示装置100に補完部307が追加されている。快適度表示装置300を構成する、嗜好格納部301、属性格納部302、環境データ値取得部303、快適度値生成部304、表示部306は、図1を参照して説明した快適度表示装置100の嗜好格納部101、属性格納部102、環境データ値取得部103、快適度値生成部104、表示部106と同じであるので、説明は省略する。Fourth Embodiment
Next, the comfort
図16に示す補完部307は、図17のステップS301に示すように、快適度値生成部304で生成した離散値であるユーザの快適度値を補完して時間または空間に対する連続値を算出する。そして、図17のステップS302に示すように、補完部307は、環境データ値取得部303が取得した離散値である空調空間40の環境データ値を補完して時間または空間に対する連続値を算出する。また、表示データ生成部305は、図17のステップS303に示すように、ユーザの快適度値の時間または空間に対する連続値のいずれか一方と、空調空間40の環境データ値の時間または空間に対する連続値のいずれか一方とを合成して連続表示データを生成する。As shown in step S301 in FIG. 17, the
図6に示す実線T、破線a、二点鎖線b、一点鎖線cのように、快適度表示装置300は、時間に対する離散値である温度、各ユーザの快適度値を補完してそれぞれ連続した滑らかな曲線として表示する。Like the solid line T, the broken line a, the two-dot chain line b, and the one-dot chain line c shown in FIG. 6, the comfort
本実施形態の快適度表示装置300は、補完により離散データを連続線とすることにより、表示が見やすくなり、空調管理者は、より容易に快適度と環境データとの関連性を把握することができる。In the comfort
<第5実施形態>
次に、図18から図20を参照して第5実施形態の快適度表示装置400を説明する。Fifth Embodiment
Next, the comfort
図18に示すように、第5実施形態の快適度表示装置400では、図1に示す快適度表示装置100に異常検出部407が追加されている。快適度表示装置400を構成する、嗜好格納部401、属性格納部402、環境データ値取得部403、快適度値生成部404、表示部406は、図1を参照して説明した快適度表示装置100の嗜好格納部101、属性格納部102、環境データ値取得部103、快適度値生成部104、表示部106と同じであるので、説明は省略する。また、快適度表示装置400の動作を示す図19、20の内、図1を参照して説明した快適度表示装置100の動作と同じステップについては、図5と同じ符号を付し、そのステップの説明は省略する。As shown in FIG. 18, in the comfort
図18に示す異常検出部407は、ユーザの快適度値が快適限界範囲にない場合に異常を検出し、異常データを出力する。ここで、快適限界範囲は、暖かいまたは涼しいと感じる限界範囲である。快適限界範囲は、-2.0<快適度値<2.0である。快適度値が、-2.0を下回った場合、あるいは、2.0を超えた場合に、異常検出部407はユーザの快適度値が快適限界範囲にないと判断してもよい。快適限界範囲を超えることは、約70%以上の人間が不快と感じることに相当する。また、快適限界範囲を約50%以上の人間が不快と感じることとする場合は、例えば、快適限界範囲を、-1.5<快適度値<1.5に設定してもよい。The
図19のステップS401に示すように異常検出部407は、快適度値生成部404が生成した快適度値が先に説明した快適限界範囲にない場合には、快適度値生成部404の生成した快適度値を異常値と判断する。そして、異常検出部407は、図19のステップS402に進んで異常を検出する。更に、異常検出部407は、図19のステップS403に示すように異常データを出力する。そして、図19のステップS404に示すように、表示データ生成部405は、異常検出部407が出力した異常データと、快適度値生成部404が生成したユーザの快適度値と、空調空間40の環境データ値とを合成して異常表示データを生成する。そして、図19のステップS106に示すように、表示部406が異常表示データを表示する。As shown in step S401 in FIG. 19, the
図12に快適度表示装置400の表示例を示す。先に説明したように、図12は、第3実施形態の快適度表示装置250の表示例の一つであるが、図12の中の三角形の中に感嘆符!を表示したマーク(注意マーク)の部分が快適度表示装置400の表示例となっている。この場合、表示部406に表示される注意マークは異常検出部407の出力する異常データに相当する。A display example of the comfort
また、図20のステップS405に示すように、表示データ生成部405は、異常検出部407が出力した異常データに基づいて、快適度値生成部404が生成したユーザの快適度値の内で快適限界値範囲を超えている快適度値を他の快適度値と識別できるようにした異常識別表示データを作成してもよい。例えば、表示データ生成部405は、図12に示すように、対象の快適度値を示すプロットを点滅表示させる異常識別表示データを作成してもよい。
このように、快適度表示装置400の表示データ生成部405は、異常検出部407が異常を検出したユーザの快適度値を他のユーザの快適度値と識別できる異常識別表示データを、ユーザの快適度値と空調空間40の環境データ値とを合成して生成するようにしてもよい。In addition, as shown in step S405 in FIG. 20, the display
As described above, the display
このように、快適度表示装置400は、表示部406に快適度値が異常値であることを示す注意マークを表示する、または、プロットを点滅表示させることにより、空調管理者が不快者の存在に早期に気づき、早期に空調設備の調整を行うことができる。As described above, the comfort
<第6実施形態>
図21に示すように、第6実施形態の快適度表示装置500は、図1に示す快適度表示装置100の快適度値生成部104に代えてタイプ別推奨領域生成部507を有する。快適度表示装置500を構成する環境データ値取得部503、表示部506は、図1を参照して説明した快適度表示装置100の環境データ値取得部103、表示部106と同じである。Sixth Embodiment
As shown in FIG. 21, the comfort
図21に示す嗜好格納部501、属性格納部502は、それぞれ図1に示す嗜好格納部101、属性格納部102と同様、図3に示すユーザ嗜好データベース901、図4に示すユーザ属性データベース902を格納している。更に、嗜好格納部501は、ユーザ嗜好データベース901の中に、タイプ別基準ユーザの空調環境に対する嗜好を格納している。また、属性格納部502はユーザ属性データベース902の中にタイプ別基準ユーザの属性を格納している。The
ここで、タイプ別基準ユーザとは、「暑がり」、「寒がり」等で表されるユーザの各タイプの中の標準的な人物で、想定上の人物である。例えば、「暑がり」タイプのタイプ別基準ユーザとは、年齢、身長、体重、体脂肪率等の属性がその会社の平均値あるいは中央値であり、嗜好に「暑がり」と登録されているようなユーザである。また、「寒がり」タイプのタイプ別基準ユーザとは、年齢、身長、体重、体脂肪率等の属性がその会社の平均値あるいは中央値であり、嗜好に「寒がり」と登録されているようなユーザである。Here, the type-based reference user is a standard person in each type of user represented by “Heat”, “Cold”, etc., and is an assumed person. For example, with the standard user classified by type "Heat", attributes such as age, height, weight, body fat percentage, etc. are the average value or median value of the company, and "Heat" is registered in the preference. It is a user. In addition, with the standard user classified by type "Cold", attributes such as age, height, weight, and body fat percentage are the average value or median of the company, and "Cold" is registered in the preference Such a user.
タイプ別推奨領域生成部507は、空調空間40の領域毎にタイプ別基準ユーザの快適度値を生成する。また、タイプ別推奨領域生成部507は、タイプ別基準ユーザの快適度値が所定範囲にある領域をタイプ別推奨領域に指定する。ここで、所定範囲とは、例えば、約90%以上の人が快適と感じるような快適度値の範囲である。所定範囲を、-0.5<快適度値<0.5の範囲としてもよい。The type-specific recommended
表示データ生成部505は、タイプ別推奨領域と、空調空間40の環境データ値とを合成してタイプ別推奨領域表示データを生成し、生成したタイプ別推奨領域表示データを表示部506に出力する。The display
次に、図22を参照しながら快適度表示装置500の動作を説明する。まず、タイプ別推奨領域生成部507は、図22のステップS501に示すように、空調空間40の中の快適度値の計算を行う領域を設定する。タイプ別推奨領域生成部507は、例えば、図7に示すXYで表される空調空間40を格子状の領域に分割し、分割により得られた領域を快適度値の計算を行う領域に設定してもよい。また、タイプ別推奨領域生成部507は、例えば、椅子42の位置を中心にして座席位置毎に快適度値の計算を行う領域を設定してもよい。また、タイプ別推奨領域生成部507は、例えば、座席位置A-1の周囲を領域1、座席位置A-2の周囲を領域2のようにして、快適度値の計算を行う領域を設定してもよい。Next, the operation of the comfort
次に、タイプ別推奨領域生成部507は、図22のステップS502に示すように、嗜好格納部501からタイプ別基準ユーザの嗜好を読み出す。例えば、「暑がり」タイプのタイプ別基準ユーザの場合には、タイプ別推奨領域生成部507は、ユーザ嗜好データベース901から「暑がり」と規定されているユーザの嗜好を読み出す。次に、タイプ別推奨領域生成部507は、図22のステップS503に示すように、属性格納部502からタイプ別基準ユーザの属性を読み出す。例えば、「暑がり」タイプのタイプ別基準ユーザの場合には、ユーザ属性データベース902からその会社の平均的な体重、体脂肪率等のデータを読み出す。Next, the type-by-type recommendation
次に、タイプ別推奨領域生成部507は、図22のステップS103に示すように、環境データ値取得部503から空調空間40の中の設定領域の温度、湿度、風速、輻射温度等の環境データ値を取得する。Next, as shown in step S103 of FIG. 22, the type-specific recommended
次に、タイプ別推奨領域生成部507は、図22のステップS504に進んで、設定領域におけるタイプ別基準ユーザの快適度値を生成する。具体的には、タイプ別推奨領域生成部507は、図22のステップS103で環境データ値取得部503から取得した設定領域の温度、湿度、風速、輻射温度の4つの物理量と、予め設定した標準的な人間の着衣量、運動量とを用いて、式(2)により設定領域における標準的な人間のPMVを算出する。Next, the type-by-type recommendation
更に、タイプ別推奨領域生成部507は、嗜好格納部501、属性格納部502から読み出したタイプ別基準ユーザの嗜好、属性を用いて式(1)、(3)、(4)によりタイプ別基準ユーザの快適度値を生成する。Furthermore, the type-by-type recommendation
そして、タイプ別推奨領域生成部507は、図22に示すステップS505に進み、生成したタイプ別基準ユーザの快適度値が、所定範囲にあるかどうかを判断する。そして、タイプ別基準ユーザの快適度値が所定範囲にある場合には、タイプ別推奨領域生成部507は、図22のステップS505でYESと判断して図22のステップS506に進む。そして、タイプ別推奨領域生成部507は、設定した計算領域をタイプ別推奨領域に組み入れて図22のステップS507に進む。Then, the type-by-type recommendation
一方、図22のステップS505で、NOと判断した場合、タイプ別推奨領域生成部507は、設定した計算領域をタイプ別推奨領域に組み込まずに図22のステップS507に進む。On the other hand, if NO in step S505 in FIG. 22, the type-by-type recommendation
タイプ別推奨領域生成部507は、図22のステップS507において、空調空間40の全領域の計算が終了したかどうか判断する。全ての領域の計算が終了していない場合には、タイプ別推奨領域生成部507は、図22のステップS501に戻ってステップS501からステップS506を繰り返し実行する。In step S507 in FIG. 22, the type-specific recommended
そして、タイプ別推奨領域生成部507は、空調空間40の全ての領域でタイプ別基準ユーザの快適度値の生成とタイプ別推奨領域への組み入れ可否の判断を終了したら、図22のステップS508に進む。Then, when the generation of the type recommendation
表示データ生成部505は、図22のステップS508において、タイプ別推奨領域と、空調空間40の環境データ値とを合成してタイプ別推奨領域表示データを生成し、生成したタイプ別推奨領域表示データを表示部506に出力する。表示部506は、このタイプ別推奨領域表示データを表示する。The display
図23は、快適度表示装置500の表示部506の表示例である。図23では、タイプ別基準ユーザが快適と感じる範囲と、空調空間40の温度分布とが重ね合わされて表示されている。図23に示す斜めハッチングの領域は、温度が25.5℃から26.5℃の領域に対応しており、「暑がり」タイプのタイプ別基準ユーザが快適と感じる領域を示している。また、図23に示すクロスハッチング領域は、温度が26.5℃から27.5℃の領域に対応しており、「寒がり」タイプのタイプ別基準ユーザが快適と感じる領域を示している。FIG. 23 is a display example of the
このように、快適度表示装置500は、暑がりタイプ、寒がりタイプ等のタイプ別に推奨領域を表示するので、ユーザが表示を見て自分の好みの場所に移動することを促すことができる。例えば、フリーアドレスオフィスの様に、ユーザがどの場所に着席してもよい場合、各人が好みに応じて着席すれば全体の快適度、生産性を向上させることができる。As described above, the comfort
<第7実施形態>
次に、図24を参照しながら、第7実施形態の快適度表示装置550を説明する。図21を参照して説明した快適度表示装置500と同じ部分には、同じ符号を付して説明は省略する。Seventh Embodiment
Next, the comfort
図24に示すように、快適度表示装置550は、図21を参照して説明した快適度表示装置500に移動先表示部508が追加されている。移動先表示部508は、タイプ別推奨領域をプロジェクションマッピングまたは拡張現実で表示することができる。これにより、快適度表示装置550は、より効果的にユーザに移動を推奨することができる。As shown in FIG. 24, in the comfort
<第8実施形態>
次に図25を参照しながら、第8実施形態の快適度表示装置600を説明する。図25に示す快適度表示装置600は、図1に示す快適度表示装置100の快適度値生成部104に代えてユーザ別推奨領域生成部607を有する。快適度表示装置600を構成する嗜好格納部601、属性格納部602、環境データ値取得部603、表示部606は、図1を参照して説明した快適度表示装置100の嗜好格納部101、属性格納部102、環境データ値取得部103、表示部106と同様である。Eighth Embodiment
Next, the comfort
図26を参照しながら、快適度表示装置600の動作を説明する。ユーザ別推奨領域生成部607は、図26のステップS601に示すように、先に説明した快適度表示装置500と同様、空調空間40の中の快適度値の計算を行う領域を設定する。The operation of the comfort
次に、ユーザ別推奨領域生成部607は、図26のステップS101、S102に示すように、嗜好格納部601、属性格納部602から特定のユーザの嗜好、属性を読み出す。Next, as shown in steps S101 and S102 of FIG. 26, the user classified recommended
次に、ユーザ別推奨領域生成部607は、図26のステップS103に示すように、環境データ値取得部603から空調空間40の中の設定領域の温度、湿度、風速、輻射温度等の環境データ値を取得する。Next, as shown in step S103 of FIG. 26, the user-specific recommended
次に、ユーザ別推奨領域生成部607は、図26のステップS104に進んで、設定領域における特定のユーザの快適度値を生成する。具体的には、ユーザ別推奨領域生成部607は、図26のステップS103で環境データ値取得部503から取得した設定領域の温度、湿度、風速、輻射温度の4つの物理量と、オフィスワークの際の標準的な着衣量、運動量を用いて式(2)により設定領域における特定のユーザのPMVを算出する。なお、ユーザ別推奨領域生成部607は、着衣量として、サーモカメラによって測定された特定のユーザの皮膚の温度と服の温度との温度差から推定した値を用いるようにしてもよい。また、ユーザ別推奨領域生成部607は、運動量として、監視カメラ等の画像を分析して求めた値を用いるようにしてもよい。Next, the user-by-user recommendation
更に、ユーザ別推奨領域生成部607は、嗜好格納部501、属性格納部502から読み出した特定のユーザの嗜好、属性を用いて式(1)、(3)、(4)により特定のユーザの快適度値を生成する。Furthermore, the user-specific recommended
そして、ユーザ別推奨領域生成部607は、図26に示すステップS602に進み、生成した特定のユーザの快適度値が、所定範囲にあるかどうかを判断する。そして、特定のユーザの快適度値が所定範囲にある場合には、ユーザ別推奨領域生成部607は、図26のステップS602でYESと判断して図26のステップS603に進む。そして、ユーザ別推奨領域生成部607は、設定した計算領域をユーザ別推奨領域に組み入れて図26のステップS604に進む。Then, the user-by-user recommendation
一方、図26のステップS602で、NOと判断した場合、ユーザ別推奨領域生成部607は、設定した計算領域をユーザ別推奨領域に組み入れずに図26のステップS604に進む。On the other hand, if it is determined NO in step S602 in FIG. 26, the user recommendation
ユーザ別推奨領域生成部607は、図26のステップS604において、空調空間40の全領域の計算が終了したかどうか判断し、全ての領域の計算が終了していない場合には、図26のステップS601に戻ってステップS601からステップS603を繰り返し実行する。In
そして、ユーザ別推奨領域生成部607は、空調空間40の全ての領域で特定ユーザの快適度値の生成とユーザ別推奨領域への組み入れ可否の判断を終了したら、図26のステップS605に進む。Then, when the user-specific recommended
表示データ生成部605は、図26のステップS605において、ユーザ別推奨領域と、空調空間40の環境データ値とを合成してユーザ別推奨領域表示データを生成し、生成したユーザ別推奨領域表示データを表示部606に出力する。表示部606は、このユーザ別推奨領域表示データを表示する。The display
先に説明した図23は、快適度表示装置600の表示部606の表示例でもある。快適度表示装置600の表示では、図23に示す斜めハッチングの領域は、「暑がり」の特定のユーザCが快適と感じる領域を示す。また、図23に示すクロスハッチング領域は、「寒がり」の特定のユーザBが快適と感じる領域を示す。FIG. 23 described above is also a display example of the
このように、快適度表示装置600は、特定のユーザの嗜好や属性を考慮して特定のユーザが空調空間40の中のどの場所に行けばよいかを自動的にリコメンドする。このため、ユーザはディスプレイ27の表示等を確認することなく、容易に快適な位置に移動することができる。Thus, the comfort
<第9実施形態>
次に、図27を参照しながら、第9実施形態の快適度表示装置650を説明する。図25を参照して説明した快適度表示装置600と同じ部分には、同じ符号を付して説明は省略する。The Ninth Embodiment
Next, the comfort
図27に示すように、快適度表示装置650は、図25を参照して説明した快適度表示装置600に移動先表示部608が追加されている。移動先表示部608は、ユーザ別推奨領域をプロジェクションマッピングまたは拡張現実で表示することができる。これにより、快適度表示装置650は、より効果的にユーザに移動を推奨することができる。As shown in FIG. 27, in the comfort
<第10実施形態>
次に図28~図30を参照しながら、第10実施形態の快適度表示装置700を説明する。図28に示すように、快適度表示装置700では、図1を参照して説明した快適度表示装置100にユーザ状態取得部707と推奨行動生成部708とが追加されている。快適度表示装置700を構成する嗜好格納部701、属性格納部702、環境データ値取得部703、表示部706は、図1を参照して説明した快適度表示装置100の嗜好格納部101、属性格納部102、環境データ値取得部103、表示部106と同じである。Tenth Embodiment
Next, a comfort
ユーザ状態取得部707は、特定のユーザの現在の着衣量、運動量等の現在状態量と、特定のユーザの現在位置とを取得する。ユーザ状態取得部707は、着衣量として、例えば、サーモカメラによって測定された皮膚の温度と服の温度との温度差から求められた値を取得してもよい。また、ユーザ状態取得部707は、運動量、現在位置として、監視カメラの画像を分析して求められた値を取得してもよい。The user
快適度値生成部704は、嗜好格納部701に格納したユーザの嗜好と、属性格納部702に格納したユーザの属性と、環境データ値取得部703が取得した空調空間40の環境データ値と、ユーザ状態取得部707が取得したユーザの現在状態量とユーザの現在位置とに基づいてユーザの現在の快適性を示す現在快適度値を生成する。そして、快適度値生成部704は、生成した現在快適度値を表示データ生成部705と推奨行動生成部708に出力する。The degree-of-comfort
推奨行動生成部708は、快適度値生成部704から入力された現在快適度値が所定範囲にない場合に、ユーザの快適度値が所定範囲に入るユーザの変更状態量を確定する。具体的には、推奨行動生成部708は、ユーザの快適度値が所定範囲に入るまでユーザの状態量を現在状態量から変更し、ユーザの嗜好と、ユーザの属性と、空調空間40の環境データ値と、ユーザの現在位置とに基づいてユーザの快適度値を生成する動作を繰り返すことにより、ユーザの快適度値が所定範囲に入るユーザの変更状態量を確定する。そして、推奨行動生成部708は、ユーザの現在状態量と変更状態量の差に基づいてユーザの推奨行動を生成する。The recommended
表示データ生成部705は、快適度値生成部704で生成したユーザの現在快適度値と、環境データ値取得部703が取得した空調空間40の環境データ値と、推奨行動生成部708が生成した推奨行動とを合成して推奨行動表示データを生成する。そして、表示データ生成部705は、生成した推奨行動表示データを表示部706に出力する。The display
以下、図29を参照しながら、快適度表示装置700の動作を説明する。図29のステップS101からS103に示すように、快適度値生成部704は、嗜好格納部701、属性格納部702からユーザの嗜好、属性を読み出し、環境データ値取得部703から空調空間40の温度、湿度、風速等の環境データ値を取得する。また、快適度値生成部704は、図29のステップS701、S702に示すように、ユーザ状態取得部707から現在のユーザの着衣量、運動量等の現在状態量と、ユーザの現在位置とを取得する。Hereinafter, the operation of the comfort
図29のステップS703に示すように快適度値生成部704は、ユーザの現在快適度を生成する。具体的には、快適度値生成部704は、図29のステップS103で環境データ値取得部703から取得した空調空間40の温度、湿度、風速、輻射温度の4つの物理量と、図29のステップS701で取得したユーザの現在の着衣量、運動量とを用いて式(2)によりユーザの現在のPMVを算出する。As shown in step S703 of FIG. 29, the degree-of-comfort
更に、快適度値生成部704は、図29のステップS101、S102で嗜好格納部701、属性格納部702から読み出したユーザの嗜好、属性を用いて式(1)、(3)、(4)によりユーザの現在快適度値を生成する。そして、生成したユーザの現在快適度値を推奨行動生成部708と表示データ生成部705に出力する。Furthermore, the comfort level
推奨行動生成部708は、図29のステップS704に示すように、快適度値生成部704から入力されたユーザの現在快適度値が所定の範囲に有るかどうかを判断する。ここで所定範囲とは、例えば、約90%以上の人が快適と感じるような快適度値の範囲であり、-0.5<快適度値<0.5の範囲としてもよい。The recommended
推奨行動生成部708は、図29のステップS704でNOと判断した場合には、図29のステップS705に進んでユーザの状態量を現在状態量から変更する。例えば、ユーザの着衣量が標準的な着衣量よりも多い場合には、推奨行動生成部708は、着衣量を低減する。逆に、着衣量が標準的な着衣量よりも少ない場合には、推奨行動生成部708は、着衣量を増加する。そして、推奨行動生成部708は、図29のステップS706において、嗜好格納部701、属性格納部702からユーザの嗜好及び属性を読み出し、環境データ値取得部703から空調空間40の温度、湿度、風速等の環境データ値を取得し、変更したユーザの状態量である変更状態量を用いてユーザの快適度値を生成し、図29のステップS707に進む。If the recommended
推奨行動生成部708は、図29のステップS707において、ステップS706で生成したユーザの快適度値が所定範囲内かどうかを判断する。推奨行動生成部708は、図29のステップS707でNOと判断した場合には、図29のステップS705に戻ってユーザの状態量を変更してステップS706でユーザの快適度値を生成する。このように、推奨行動生成部708は、ユーザの快適度値が所定範囲内となるまで繰り返しユーザの状態量を変更してユーザの快適度値を生成する。そして、推奨行動生成部708は、図29のステップS707でYESと判断したら、図29のステップS708に進み、ユーザの変更状態量を確定させる。そして、推奨行動生成部708は、図29のステップS709において、ステップS701で取得したユーザの現在状態量と確定させたユーザの変更状態量との差に基づいて推奨行動を生成する。The recommended
推奨行動の生成の例を示すと以下の通りである。例えば、ユーザの現在快適度値が+2.0でユーザが暖かいと感じており、着衣量を現在状態量から低減した場合に快適度値が所定範囲に入った場合を仮定する。この場合には、ユーザが上着を脱ぐなどの行動により着衣量を低減することにより、快適な状態になると想定される。このため、推奨行動生成部708は、「上着を脱ぐと涼しくなります」という推奨行動を生成する。It is as follows when an example of generation of recommendation action is shown. For example, it is assumed that the current comfort level of the user is +2.0 and the user feels warm, and the comfort level falls within the predetermined range when the amount of clothes is reduced from the current state level. In this case, it is assumed that the comfortable state is obtained by reducing the amount of clothes by an action such as the user taking off the jacket. For this reason, the recommended
また、ユーザの現在快適度値が-2.0でユーザが涼しいと感じており、運動量を現在状態量から増加した場合に快適度値が所定範囲に入った場合を仮定する。この場合には、ユーザはしばらく座ったままでいることから涼しいと感じているので、運動量を増加させることにより、快適な状態になると想定される。このため、推奨行動生成部708は、「立ち上がって運動してみてください。暖かくなります。」という推奨行動を生成する。Also, it is assumed that the user's current comfort value is −2.0 and the user feels cool, and the comfort value falls within the predetermined range when the exercise amount is increased from the current state amount. In this case, since the user feels cool because he / she is sitting for a while, it is assumed that the user is comfortable by increasing the amount of exercise. For this reason, the recommended
表示データ生成部705は、図29のステップS709に示すように、環境データ値取得部703から取得した温度、湿度等の環境データ値と、快適度値生成部704から入力されたユーザの現在快適度値と、推奨行動生成部708から入力された推奨行動を合成して推奨行動表示データを生成する。そして、表示データ生成部705は、生成した推奨行動表示データを表示部706に出力する。表示部706は、図29のステップS106に示すように、推奨行動表示データを表示する。As shown in step S 709 of FIG. 29, the display
図30を参照しながら表示部706が表示する推奨行動表示データの例について説明する。図30に示すように、推奨行動表示データでは、図7と同様に空調空間40の温度分布中にユーザの現在快適度値に対応するマークが重ね合わされる。さらに、推奨行動表示データでは、ユーザへの推奨行動の文言が重ね合わされる。図30に示すように、ユーザは座席位置B-1に座っており、座席位置近傍の温度は、28.5℃程度である。ユーザの現在快適度値は、+2.0であり、ユーザは暖かいと感じている(マークは口の両端を下げた不快を示すものとなっている)。また、ユーザは、上着を着ている。そして、右上に推奨文言として「上着を脱ぐと涼しくなります」という推奨文言を表示してユーザが上着を脱ぐことを推奨している。An example of the recommended action display data displayed by the
このように、快適度表示装置700は、ユーザの現在位置、現在状態量に基づいて、ユーザの快適性が向上する行動を推奨するので、ユーザの快適度、生産性を向上させることができる。As described above, the comfort
<第11実施形態>
図31を参照しながら第11実施形態の快適度表示装置580について説明する。図31に示すように、快適度表示装置580では、図21を参照して説明した快適度表示装置500に図1を参照して説明した快適度表示装置100の快適度値生成部104と同様の快適度値生成部504が追加されている。タイプ別推奨領域生成部507の動作は図23を参照して説明した快適度表示装置500の動作と同様である。Eleventh Embodiment
The comfort
快適度表示装置580の表示データ生成部505は、快適度値生成部504で生成したユーザの快適度値と、タイプ別推奨領域生成部507で生成したタイプ別推奨領域と、環境データ値取得部503で取得した空調空間40の環境データ値とを合成してタイプ別推奨領域表示データを生成する。そして、表示データ生成部505は、生成したタイプ別推奨領域表示データを表示部506に出力する。The display
図32に快適度表示装置580の表示部506の表示例を示す。図32では、タイプ別基準ユーザが快適と感じる範囲と、空調空間40の温度分布と、各ユーザの快適度値に対応するマークとが重ね合わされている。図32に示す斜めハッチングの領域は、温度が25.5℃から26.5℃の領域に対応しており、「暑がり」タイプのタイプ別基準ユーザが快適と感じる領域を示している。また、図32に示すクロスハッチング領域は、温度が26.5℃から27.5℃の領域に対応しており、「寒がり」タイプのタイプ別基準が快適と感じる領域を示している。A display example of the
快適度表示装置580は、快適度表示装置500と同様の作用効果を奏する。The comfort
<第12実施形態>
図33を参照しながら第12実施形態の快適度表示装置680を説明する。図33に示すように、快適度表示装置680では、図25を参照して説明した快適度表示装置600に図1を参照して説明した快適度表示装置100の快適度値生成部104と同様の快適度値生成部604が追加されている。ユーザ別推奨領域生成部607の動作は図25を参照して説明した快適度表示装置600の動作と同じである。Twelfth Embodiment
The comfort
快適度表示装置680の表示データ生成部605は、快適度値生成部604で生成したユーザの快適度値と、ユーザ別推奨領域生成部607で生成したユーザ別推奨領域と、環境データ値取得部603で取得した空調空間40の環境データ値とを合成してユーザ別推奨領域表示データを生成する。そして、表示データ生成部605は、生成したユーザ別推奨領域表示データを表示部606に出力する。The display
快適度表示装置680の表示部606では、快適度表示装置580の表示部506と同様、図32に示すようにユーザ別推奨領域表示データが表示される。ただし、快適度表示装置680においては、図32に示すハッチング領域は、「暑がり」の特定のユーザCが快適と感じる領域を示す。また、図32に示すクロスハッチング領域は、「寒がり」の特定のユーザBが快適と感じる領域を示す。Similar to the
快適度表示装置680は、快適度表示装置600と同様の作用効果を奏する。The comfort
<第13実施形態>
図34を参照しながら第13実施形態の快適度表示装置800を説明する。図34に示すように、快適度表示装置800では、図1を参照して説明した快適度表示装置100に、エリア情報格納部808が追加されている。また、快適度表示装置800は、快適度値生成部104、環境データ値取得部103、表示データ生成部105に代えて、エリア快適度値生成部804、エリア環境データ値取得部803、エリア表示データ生成部805、表示部806を有する。13th Embodiment
The comfort
快適度表示装置800は、例えば、図36に示すように、空調空間40の複数のエリア451~454についてエリア快適度値と、エリア環境データ値を表示する。図36に示すように、空調空間40は、例えば、ビルの一つのフロアであり、各エリア451~454は、フロア内の一部である。各エリア451~454の床には事務机411~414と、椅子421~424とが配置され、天井には空調設備の吹き出し口431~434が配置されている。For example, as shown in FIG. 36, the comfort
エリア情報格納部808はエリア451~454の構成情報を格納している。エリア451~454の構成情報は、各エリアの位置、大きさなどのエリア451~454の配置、形状の情報を含む。また、エリア451~454の構成情報は、各エリア451~454に配置されている空調設備、室内機、温度センサ、湿度センサ、風速計等の配置の情報を含む。更に、エリア451~454の構成情報は、各エリア451~454の机の配置とそこに座っているユーザを特定する情報、例えば、氏名、従業員番号等の情報を含む。The area
エリア環境データ値取得部803は、図35のステップS801で、エリア情報格納部808に格納されたエリア451~454の構成情報を参照してエリア451~454の状況を表すエリア環境データ値をエリア毎に取得する。The area environment data value acquiring
エリア快適度値生成部804は、図35のステップS802において、図35のステップS101で嗜好格納部101から読み出したユーザの嗜好と、図35のステップS102で属性格納部102から読み出したユーザの属性と、エリア環境データ値取得部803が取得したエリア環境データ値とに基づいてユーザのエリア451~454における快適性を示すエリア快適度値を生成する。エリア快適度の生成方法は、先に説明した快適度表示装置100における生成方法と同様である。The area comfort
エリア表示データ生成部805は、図35のステップS803において、エリア快適度値生成部804で生成したユーザのエリア快適度値と、エリア環境データ値取得部803が取得したエリア環境データ値と、を合成してエリア表示データを生成する。表示部806は、図35のステップS804において、1つまたは複数のエリア表示データを表示する。In
図36は、表示部806の表示の一例を示す。図36は、ある時刻におけるXY平面で示す空調空間40の中の各エリア451~454の温度分布の上に、その時刻における各エリア451~454の各座席位置に座っているユーザの快適度を示すマークを重ね合わせた例を示す。図36のデータは、表示部806に表示される。図36では、各椅子421~424の中央にはユーザの快適度を示す顔のマークが表示されている。このような表示により、ある時刻において、空調空間40の各エリア451~454毎に温度がどのように分布しており、各エリア451~454の各ユーザがどのように感じているかを容易に認識できる。FIG. 36 shows an example of display on the
空調管理者は、図36に示す表示に基づいて、空調空間40の中のエリア451~454毎にどのように設定温度を調整すれば良いかを容易に判断することができる。Based on the display shown in FIG. 36, the air conditioning manager can easily determine how to adjust the set temperature for each of the
図37は、表示部806の他の表示の例を示す。図37は、図36に示す空調空間40の中の各エリア451~454の各特定の位置における温度の変化とユーザの快適度の時間変化を示す。図36に示すように、各エリア451~454には、それぞれ事務机411~414、椅子421~424がA列、B列の二列で1番から3番まで3段に配置されている。図37には、図36に示す空調空間40のエリア451~454毎に、A列1番の座席位置における温度の時間変化を示す実線T1~T4が示されている。また、図37には、標準的なユーザA1~A4の快適度を示す破線a1~a4と、寒がりのユーザB1~B4の快適度を示す二点鎖線b1~b4と、暑がりのユーザC1~C4の快適度を示す一点鎖線c1~c4とが示されている。FIG. 37 shows another display example of the
図37の表示から、空調管理者は、ユーザA1~A4、B1~B4、C1~C4の快適度値の変化と温度の相関関係をエリア451~454毎に把握することができ、各エリア451~454の空調設備の設定温度調整することができる。From the display of FIG. 37, the air conditioning manager can grasp the correlation between the change in the degree of comfort value of the users A1 to A4, B1 to B4 and C1 to C4 and the temperature for each of the
このように、本実施形態の快適度表示装置800は、エリア451~454毎のユーザのエリア快適度値と、エリア環境データ値とを合成してエリア表示データを生成し、生成したエリア表示データを表示する。このため、空調管理者は、エリア451~454毎に快適度と環境データとの関連性の傾向を把握でき、エリア毎の空調設備の交換、追設等の必要性を容易に判断することができる。As described above, the comfort
<第14実施形態>
図38に示すように、第14実施形態の快適度表示装置810では、図34を参照して説明した快適度表示装置800にエリア基本統計量算出部817が追加されている。快適度表示装置800を構成する、嗜好格納部101、属性格納部102、エリア環境データ値取得部803、エリア快適度値生成部804、表示部806は、図34を参照して説明した快適度表示装置800と同様であるので、説明は省略する。Fourteenth Embodiment
As shown in FIG. 38, in the comfort
エリア基本統計量算出部817は、エリア快適度値基本統計量とエリア環境データ値基本統計量とを算出する。ここで、エリア快適度値基本統計量は、エリア快適度値生成部804で生成したユーザのエリア快適度値を代表する基本統計量で、以下の(1)から(5)のグループを有している。
(1)ユーザのエリア快適度値の時間平均値または空間平均値
(2)ユーザのエリア快適度値の時間中央値または空間中央値
(3)ユーザのエリア快適度値の時間最大値または空間最大値
(4)ユーザのエリア快適度値の時間最小値または空間最小値
(5)ユーザのエリア快適度値の時間最頻値または空間最頻値The area basic
(1) user's area comfort value time average value or space average value (2) user's area comfort value time median value or space median value (3) user area comfort value time maximum value or space maximum value Value (4) The time minimum value or the space minimum value of the area comfort value of the user (5) the time mode or the space mode of the area comfort value of the user
また、エリア環境データ値基本統計量は、エリア環境データ値取得部803が取得した空調空間40の各エリア451~454のエリア環境データを代表する基本統計量で、以下の(6)から(10)のグループを有している。
(6)エリア環境データ値の時間平均値または空間平均値
(7)エリア環境データ値の時間中央値または空間中央値
(8)エリア環境データ値の時間最大値または空間最大値
(9)エリア環境データ値の時間最小値または空間最小値
(10)エリア環境データ値の時間最頻値または空間最頻値The area environmental data value basic statistic is a basic statistic representing the area environmental data of each
(6) Time average value or space average value of area environmental data value (7) Time median value or space median value of area environmental data value (8) Time maximum value or space maximum value of area environmental data value (9) Area environment value Temporal minimum value or spatial minimum value of data value (10) Area environmental data value temporal mode or spatial mode value
ここで、時間平均値とは、各エリア451~454の例えば、一日、一週間、一か月等の所定期間における各平均値である。また、空間平均値とは、空調空間40の各エリア451~454におけるユーザの快適度の平均値、あるいは、そのエリア451~454における環境データ値の平均値である。つまり、空間平均値は、各エリア451~454における平均値である。Here, the time average value is each average value in a predetermined period such as one day, one week, one month, etc. of each of the
同様に、時間中央値、空間中央値は、それぞれ各エリア451~454における中央値である。時間最大値、空間最大値は、それぞれ各エリア451~454における最大値である。時間最小値、空間最小値は、それぞれ各エリア451~454における最小値である。時間最頻値、空間最頻値は、それぞれ各エリア451~454における最頻値である。Similarly, the time median and the space median are medians in the
エリア表示データ生成部815は、エリア快適度値生成部804の生成したユーザのエリア快適度値と、エリア環境データ値取得部803が取得した空調空間40の各エリア451~454の各エリア環境データ値と、エリア基本統計量算出部817が算出したユーザのエリア快適度値を代表するエリア快適度値基本統計量と空調空間40の各エリア451~454の各エリア環境データ値を代表するエリア環境データ値基本統計量の内のいずれか1つまたは複数と、を合成して表示統合データを生成する。そして、エリア表示データ生成部815は、生成した表示統合データを表示部806に出力する。より詳細には、エリア表示データ生成部815は、エリア基本統計量算出部817が算出したユーザのエリア快適度値の時間平均値、空間平均値、時間中央値、空間中央値、時間最大値、空間最大値、時間最小値、空間最小値、時間最頻値、空間最頻値、エリア451~454のエリア環境データ値の時間平均値、空間平均値、時間中央値、空間中央値、時間最大値、空間最大値、時間最小値、空間最小値、時間最頻値、空間最頻値、の内のいずれか1つまたは複数と、エリア快適度値とエリア環境データ値とを合成して表示統合データを生成する。そして、エリア表示データ生成部815は、生成した表示統合データを表示部806に出力する。The area display
次に図39を参照しながら快適度表示装置810の動作を説明する。以下では、エリア基本統計量算出部817は、エリア快適度値生成部804が生成したエリア快適度値の時間平均値あるいは空間平均値と、エリア環境データ値取得部803が取得したエリア環境データ値の時間平均値あるいは空間平均値を算出する例を説明する。また、図35を参照して説明した快適度表示装置800の動作と同じステップについては、各ステップに図35と同じ符号を付し、説明は諸略する。Next, the operation of the comfort
図39のステップS810に示すように、エリア基本統計量算出部817は、エリア快適度値基本統計量のグループ(1)の快適度値の時間平均値あるいは空間平均値を算出する。また、エリア基本統計量算出部817は、図39のステップS811において、エリア環境データ値基本統計量のグループ(6)のエリア451~454のエリア環境データ値の時間平均値あるいは空間平均値を算出する。As shown in step S810 of FIG. 39, the area basic
図39のステップS813に示すように、エリア表示データ生成部815は、エリア快適度値生成部804の生成したユーザのエリア快適度値と、エリア環境データ値取得部803が取得したエリア451~454のエリア環境データ値と、エリア基本統計量算出部817が算出したユーザのエリア快適度値の時間平均値または空間平均値とエリア451~454のエリア環境データ値の時間平均値または空間平均値の内のいずれか1つまたは複数と、を合成してエリア表示統合データを生成する。エリア表示データ生成部815は、生成したエリア表示統合データを表示部806に出力する。そして、表示部806は、図39のステップS814に示すように、エリア表示データ生成部815の生成したエリア表示統合データを表示する。As shown in step S813 in FIG. 39, the area display
表示部806の表示例を図40に示す。図40では、先に図36を参照して説明した快適度表示装置800の表示にエリア451~454の平均温度と平均快適度の表が追加されている。A display example of the
以上、エリア基本統計量算出部817が平均値を算出する場合について説明した。中央値を算出し、中央値に基づくエリア表示統合データを表示する場合には、図39のステップS810で、エリア基本統計量算出部817が、エリア快適度値基本統計量のグループ(2)の快適度値の時間中央値あるいは空間中央値を算出する。また、エリア基本統計量算出部817が、図39のステップS811において、エリア環境データ値基本統計量のグループ(7)のエリア451~454のエリア環境データ値の時間中間値あるいは空間中間値を算出する。同様に、最大値、最小値及び最頻値のいずれかを算出し、最大値、最小値及び最頻値のいずれかに基づくエリア表示統合データを表示する場合には、エリア基本統計量算出部817が、快適度値基本統計量のグループ(3)、(4)、(5)の快適度値の最大値、最小値及び最頻値のいずれかを算出する。また、図39のステップS811において、エリア基本統計量算出部817が、エリア環境データ値基本統計量のグループ(8)、(9)、(10)のエリア環境データ値の最大値、最小値及び最頻値のいずれかを算出する。他の動作については、先に説明した平均値を算出する場合と同様である。Heretofore, the case has been described where the area basic
また、表示部806は、エリア快適度値とエリア環境データ値の異なるエリア基本統計量を組み合わせて表示してもよい。例えば、エリア基本統計量算出部817がエリア快適度値の時間平均値または空間平均値と、空調空間40のエリア451~454のエリア環境データ値の時間中間値あるいは空間中間値とを算出する。そして、エリア表示データ生成部815は、これらを表示部806に表示するようにしてもよい。Further, the
<第15実施形態>
図41に示すように、第15実施形態の快適度表示装置820のエリア表示データ生成部825は、エリア快適度値基本統計量の内のいずれか1つと、エリア環境データ値基本統計量の内のいずれか1つを合成してエリア統計量表示データを生成する。そして、表示部806が、1つまたは複数のエリア統計量表示データを表示する。エリア表示データ生成部825は、エリア快適度値生成部804の生成したユーザのエリア快適度値、エリア環境データ値取得部803の取得するエリア環境データ値との合成は行わない。従って、快適度表示装置820は、表示部806にエリア快適度のエリア快適度値基本統計量とエリア環境データのエリア環境データ値基本統計量とのみを表示する。The fifteenth embodiment
As shown in FIG. 41, the area display
以下では、エリア基本統計量算出部817は、エリア快適度値生成部804が生成したエリア快適度値の時間平均値あるいは空間平均値と、エリア環境データ値取得部803が取得したエリア環境データ値の時間平均あるいは空間平均を算出する例を説明する。In the following, the area basic
快適度表示装置810と同じ部位には、同じ符号を付して説明は省略する。また、図41において、図39を参照して説明した快適度表示装置810の動作と同じ動作には、同じステップ番号を付して説明は省略する。The same reference numerals are given to the same parts as the comfort
図42に示すように、快適度表示装置820は、図42のステップS820においてエリア統計量表示データを生成し、表示部806は、このエリア統計量表示データを表示する。As shown in FIG. 42, the comfort
図43は、第15実施形態の快適度表示装置820の表示例の一つである。図43は、図37と同様、図36に示す空調空間40の中の各エリア451~454の各特定の位置における温度の変化とユーザの快適度の変化を示す。図37で、横軸は時間であったが、図43での横軸は、日付であり、各プロットは、日毎のエリア快適度の平均値、平均温度を示す。従って、図43は、エリア基本統計量算出部817が算出した各ユーザの快適度値の一日の平均値と、各エリア451~454のエリア環境データ値である温度の一日の平均値とを合成して得られる統計量表示データを表示部806に出力した場合の表示例を示す。また、図43の右側には、各エリア451~454それぞれの座席位置A-1における一か月平均温度と、各ユーザA、B、Cの8月一か月の平均の快適度値と、が表示されている。FIG. 43 is one of the display examples of the comfort
このように、表示部806がエリア快適度値基本統計量とエリア環境データ値基本統計量を表示することにより、空調管理者は、エリア451~454毎の快適度と環境データとの関連性の傾向を把握することができる。このため、空調管理者は、エリア451~454毎の空調設備の交換、追設等の必要性を容易に判断することができる。また、エリア快適度値基本統計量、エリア環境データ値基本統計量としては、快適度値、環境データ値のデータ群を代表する指標である平均値、中央値、最大値、最小値、最頻値を用いることで、データ群を包括的に把握することができる。As described above, the
<第16実施形態>
図44に示すように、第16実施形態の快適度表示装置830では、図34を参照して説明した快適度表示装置800にエリア情報入力部839が追加されている。Sixteenth Embodiment
As shown in FIG. 44, in the comfort
先に説明したように、エリア情報格納部808には、エリア451~454の配置、形状の情報が格納されている。また、エリア情報格納部808には、各エリア451~454に配置されている空調設備、室内機、温度センサ、湿度センサ、風速計等の配置の情報が格納されている。更に、エリア情報格納部808には、各エリア451~454の机の配置とそこ座っているユーザを特定する情報、例えば、氏名、従業員番号等の情報が格納されている。これらの情報は、頻繁に変更されることが多い。快適度表示装置830のように、エリア情報入力部839を備えることにより、これらの情報が変更されても随時エリア情報格納部808の情報を更新することができ、常に適格な快適度の表示を行うことができる。As described above, the area
<第17実施形態>
図45に示す快適度表示装置840では、図1を参照して説明した快適度表示装置100に電力情報取得部841が追加されている。Seventeenth Embodiment
In the comfort
快適度表示装置840では、図46のステップS841において、電力情報取得部841が空調空間40の空調に使用される空調設備あるいは換気器、加湿器、除湿器など空調用機器及び照明等の他の機器に使用される電力データ値を取得する。次に、図46のステップS842において、表示データ生成部845が、快適度値生成部104が生成したユーザの快適度値と、環境データ値取得部103が取得した空調空間40の環境データ値と、電力情報取得部841が取得した電力データ値とを合成して表示データを生成する。生成した表示データは、表示部106で表示される。In the comfort
快適度表示装置840により、空調管理者は、使用電力と快適度、環境データ値との関係を把握することができる。The comfort
<第18実施形態>
図47に示すように、第18実施形態の快適度表示装置850では、図38を参照して説明した快適度表示装置810にエリア快適度評価部851が追加されている。Eighteenth Embodiment
As shown in FIG. 47, in the comfort
エリア快適度評価部851は、図48のステップS851で、エリア基本統計量算出部817が算出するエリア快適度値基本統計量と、所定の閾値とを比較評価してエリア快適度評価を出力する。エリア表示データ生成部855は、図48のステップS852で、エリア快適度値生成部804で生成したユーザのエリア快適度値と、エリア環境データ値取得部803が取得したエリア環境データ値と、エリア快適度評価部851が出力したエリア快適度評価と、を合成してエリア表示データを生成する。In step S851 of FIG. 48, the area comfort
これにより、快適度表示装置850は、複数のエリア451~454の中から快適性の低いエリアを容易に識別表示することができる。また、快適度表示装置850は、エリア快適度評価を用いて複数のエリア451~454の中から快適性の低いエリアを表示させて、より容易に快適性の低いエリアを識別表示できるようにしてもよい。As a result, the comfort
<第19実施形態>
図49に示すように、第19実施形態の快適度表示装置860では、図1に示す快適度表示装置100に生体情報格納部861、ユーザ状態取得部707が追加されている。Nineteenth Embodiment
As shown in FIG. 49, in the comfort
生体情報格納部861には、ユーザの生体情報、例えば、心拍数などが格納されている。ユーザ状態取得部707は、現在のユーザの心拍数等の生体情報とユーザの現在位置とを取得する。図50のステップS861において、ユーザ状態取得部707は、現在のユーザの心拍数等の生体情報とユーザの現在位置とを取得する。The biometric
快適度値生成部104は、図50のステップS101で読み出したユーザの嗜好と、図50のステップS102で読み出したユーザの属性と、図50のステップS103で環境データ値取得部103が取得した空調空間40の環境データ値に加えて、図50のステップS861でユーザ状態取得部707が取得した現在のユーザの心拍数等の生体情報とユーザの現在位置と生体情報格納部861に格納したユーザの生体情報とに基づいて、図50のステップS862において、ユーザの空調空間40における快適性を示す快適度値を生成する。The comfort level
快適度値生成部104は、例えば、ユーザが歩行の直後等には、通常よりも低い空調空間40の温度を基準にしてユーザの快適度値を生成する。これにより、例えば、歩行後など、ユーザの状態が平常と異なる場合でも快適性を正確に表示することができる。For example, immediately after the user walks, the comfort
以上説明したように、各実施形態の快適度表示装置は、快適度と環境データとの関連性の把握を容易にし、適切な空調設備の管理を可能とすることができる。As described above, the comfort degree display device of each embodiment can easily grasp the relevance between the degree of comfort and the environmental data, and can appropriately manage the air conditioning facility.
なお、本発明は以上説明した実施形態に限定されるものではなく、請求の範囲により規定されている本発明の技術的範囲ないし本質から逸脱することない全ての変更及び修正を包含するものである。The present invention is not limited to the embodiments described above, but includes all the changes and modifications without departing from the technical scope or the essence of the present invention defined by the claims. .
10 汎用コンピュータ、21 CPU、22 ROM、23 RAM、24 HDD、25 マウス、26 キーボード、27 ディスプレイ、28 入出力コントローラ、29 ネットワークコントローラ、30 データバス、40、50 空調空間、41,411~414 事務机、42、52、421~424 椅子、43、53、431~434 空調設備の吹き出し口、44 パーティション、45 窓、51 テーブル、55 テーブルセット、100、200、250、300、400、500、550、580、600、650、680、700、800、810、820、830、840、850、860 快適度表示装置、101、201、251、301、401、501、601、701 嗜好格納部、102、202、252、302、402、502、602、702 属性格納部、103、203、253、303、403、503、603、703 環境データ値取得部、104、204、254、304、404、504、604、704 快適度値生成部、105、205、255、305、405、505、605、705,845 表示データ生成部、106、206、256、306、406、506、606、706 表示部、207、257 基本統計量算出部、307 補完部、407 異常検出部、451~454 エリア、507 タイプ別推奨領域生成部、508、608 移動先表示部、607 ユーザ別推奨領域生成部、707 ユーザ状態取得部、708 推奨行動生成部、804 エリア快適度値生成部、805,815,825 エリア表示データ生成部、806 表示部、808 エリア情報格納部、817 エリア基本統計量算出部、839 エリア情報入力部、841 電力情報取得部、851 エリア快適度評価部、861 生体情報格納部、901 ユーザ嗜好データベース、902 ユーザ属性データベース。10 general-purpose computer, 21 CPU, 22 ROM, 23 RAM, 24 HDD, 25 mouse, 26 keyboard, 27 display, 28 input / output controller, 29 network controller, 30 data bus, 40, 50 air conditioned space, 41, 411 to 414 office work Desk, 42, 52, 421-424 Chair, 43, 53, 431-434 Air conditioner outlet, 44 partitions, 45 windows, 51 table, 55 table set, 100, 200, 250, 300, 400, 500, 550 580, 600, 650, 680, 700, 800, 810, 820, 830, 840, 850, 860 Comfort degree display device, 101, 201, 251, 301, 401, 501, 601, 701 Preference storage unit, 102 202, 252, 302, 402, 502, 602, 702 Attribute storage unit, 103, 203, 253, 303, 403, 503, 603, 703 Environment data value acquisition unit, 104, 204, 254, 304, 404, 504, 604, 704 Comfort value generation unit, 105, 205, 255, 305, 405, 505, 605, 705, 845 Display data generation unit, 106, 206, 256, 306, 406, 506, 606, 706 Display unit, 207 , 257 Basic statistic calculation unit, 307 complementation unit, 407 anomaly detection unit, 451 to 454 area, 507 type classified recommended area generation unit, 508, 608 move destination display unit, 607 user classified recommended area generation unit, 707 user state acquisition Part, 708 Recommended action generator, 804 Area comfort value generator, 8 5, 815, 825 area display data generation unit 806 display unit 808 area information storage unit 817 area basic statistic calculation unit 839 area information input unit 841 power information acquisition unit 851 area comfort evaluation unit 861 living body Information storage unit, 901 user preference database, 902 user attribute database.
Claims (28)
Translated fromJapanese前記ユーザの属性を格納する属性格納部と、
空調空間の状況を表す環境データ値を取得する環境データ値取得部と、
前記嗜好格納部に格納した前記ユーザの嗜好と、前記属性格納部に格納した前記ユーザの属性と、前記環境データ値取得部が取得した前記空調空間の環境データ値とに基づいて前記ユーザの前記空調空間における快適性を示す快適度値を生成する快適度値生成部と、
前記快適度値生成部で生成した前記ユーザの快適度値と、前記環境データ値取得部が取得した前記空調空間の環境データ値と、を合成して表示データを生成する表示データ生成部と、
前記表示データを表示する表示部と、
を有することを特徴とする快適度表示装置。A preference storage unit storing preferences of the user for the air conditioning environment;
An attribute storage unit for storing the attributes of the user;
An environmental data value acquisition unit for acquiring environmental data values representing the condition of the air conditioned space;
The user of the user based on the preference of the user stored in the preference storage unit, the attribute of the user stored in the attribute storage unit, and the environmental data value of the air-conditioned space acquired by the environmental data value acquisition unit. A comfort degree value generation unit that generates a comfort degree value indicating comfort in the air-conditioned space;
A display data generation unit that generates display data by combining the user comfort level value generated by the comfort level value generation unit and the environmental data value of the air-conditioned space acquired by the environmental data value acquisition unit;
A display unit for displaying the display data;
The comfort degree display device characterized by having.
前記快適度値生成部で生成した前記ユーザの快適度値を代表する快適度値基本統計量と、前記環境データ値取得部が取得した前記空調空間の環境データ値を代表する環境データ値基本統計量と、を算出する基本統計量算出部を有し、
前記表示データ生成部は、前記ユーザの快適度値と、前記空調空間の環境データ値と、前記快適度値基本統計量と前記環境データ値基本統計量の内のいずれか1つまたは複数と、を合成して表示統合データを生成し、
前記表示部が、前記表示統合データを表示する快適度表示装置。The comfort degree display device according to claim 1 further comprises:
Comfort value basic statistics representing the user comfort value generated by the comfort value generator and environmental data basic statistics representing environmental data values of the air-conditioned space acquired by the environmental data value acquiring unit Has a basic statistic calculation unit that calculates the amount
The display data generation unit may be any one or more of the user comfort value, the environmental data value of the air-conditioned space, the comfort value basic statistic, and the environmental data value basic statistic. To generate display integrated data,
The comfort degree display apparatus in which the said display part displays the said display integrated data.
前記基本統計量算出部が算出する前記快適度値基本統計量は、以下の(1)から(5)のグループを有し、
(1)前記ユーザの快適度値の時間平均値または空間平均値
(2)前記ユーザの快適度値の時間中央値または空間中央値
(3)前記ユーザの快適度値の時間最大値または空間最大値
(4)前記ユーザの快適度値の時間最小値または空間最小値
(5)前記ユーザの快適度値の時間最頻値または空間最頻値
前記基本統計量算出部が算出する前記環境データ値基本統計量は、以下の(6)から(10)のグループを有すること、
(6)前記空調空間の環境データ値の時間平均値または空間平均値
(7)前記空調空間の環境データ値の時間中央値または空間中央値
(8)前記空調空間の環境データ値の時間最大値または空間最大値
(9)前記空調空間の環境データ値の時間最小値または空間最小値
(10)前記空調空間の環境データ値の時間最頻値または空間最頻値
を特徴とする快適度表示装置。The comfort degree display device according to claim 2, wherein
The comfort value basic statistic calculated by the basic statistic calculation unit has the following groups (1) to (5),
(1) time average value or space average value of the user comfort value (2) time median or space median value of the user comfort value (3) time maximum value or space maximum of the user comfort value Value (4) Time minimum value or space minimum value of the user's comfort level value (5) time mode or spatial mode value of the user's level of comfort value The environmental data value calculated by the basic statistic calculation unit The basic statistics have the following groups (6) to (10),
(6) time average value or space average value of environmental data values of the air conditioned space (7) median time or median value of environmental data values of the air conditioned space (8) maximum time value of environmental data values of the air conditioned space Or space maximum value (9) time minimum value or space minimum value of environmental data value of the air conditioned space (10) comfort degree display device characterized by time mode or space mode of environmental data value of the air conditioned space .
前記表示データ生成部は、
前記ユーザの快適度値と、前記空調空間の環境データ値と、前記(1)のグループの前記快適度値基本統計量と前記(6)のグループの前記環境データ値基本統計量の内のいずれか1つまたは複数、
或いは、前記ユーザの快適度値と、前記空調空間の環境データ値と、前記(2)のグループの前記快適度値基本統計量と前記(7)のグループの前記環境データ値基本統計量の内のいずれか1つまたは複数、
或いは、前記ユーザの快適度値と、前記空調空間の環境データ値と、前記(3)のグループの前記快適度値基本統計量と前記(8)のグループの前記環境データ値基本統計量の内のいずれか1つまたは複数、
或いは、前記ユーザの快適度値と、前記空調空間の環境データ値と、前記(4)のグループの前記快適度値基本統計量と前記(9)のグループの前記環境データ値基本統計量の内のいずれか1つまたは複数、
或いは、前記ユーザの快適度値と、前記空調空間の環境データ値と、前記(5)のグループの前記快適度値基本統計量と前記(10)のグループの前記環境データ値基本統計量の内のいずれか1つまたは複数、
を合成して前記表示統合データを生成する快適度表示装置。The comfort degree display device according to claim 3, wherein
The display data generation unit
Any of the user comfort value, the environmental data value of the air-conditioned space, the comfort value basic statistic of the group (1), and the environmental data value statistic of the group (6) Or one or more
Alternatively, among the comfort degree value of the user, the environmental data value of the air conditioned space, the comfort degree basic statistic of the group of (2), and the environmental data value fundamental statistic of the group of (7) Any one or more of
Alternatively, among the comfort value of the user, the environmental data value of the air-conditioned space, the comfort value basic statistic of the group of (3), and the environmental data value basic statistic of the group of (8) Any one or more of
Alternatively, among the comfort level value of the user, the environmental data value of the air conditioned space, the comfort level basic statistic of the group of (4), and the environmental data value basic statistic of the group of (9) Any one or more of
Alternatively, among the comfort degree value of the user, the environmental data value of the air conditioned space, the comfort degree basic statistic of the group of (5), and the environmental data value fundamental statistic of the group of (10) Any one or more of
The comfort degree display device which synthesize | combines and produces | generates the said display integrated data.
前記快適度値生成部で生成した前記ユーザの快適度値を代表する快適度値基本統計量と、前記環境データ値取得部が取得した前記空調空間の環境データ値を代表する環境データ値基本統計量と、を算出する基本統計量算出部を有し、
前記表示データ生成部は、前記快適度値基本統計量の内のいずれか1つと、前記環境データ値基本統計量の内のいずれか1つを合成して統計量表示データを生成し、
前記表示部が、前記統計量表示データを表示する快適度表示装置。The comfort degree display device according to claim 1 further comprises:
Comfort value basic statistics representing the user comfort value generated by the comfort value generator and environmental data basic statistics representing environmental data values of the air-conditioned space acquired by the environmental data value acquiring unit Has a basic statistic calculation unit that calculates the amount
The display data generation unit generates statistics display data by combining any one of the comfort level basic statistics and any one of the environmental data value basic statistics.
The comfort degree display device in which the said display part displays the said statistic display data.
前記基本統計量算出部が算出する前記快適度値基本統計量は、以下の(1)から(5)のグループを有し、
(1)前記ユーザの快適度値の時間平均値または空間平均値
(2)前記ユーザの快適度値の時間中央値または空間中央値
(3)前記ユーザの快適度値の時間最大値または空間最大値
(4)前記ユーザの快適度値の時間最小値または空間最小値
(5)前記ユーザの快適度値の時間最頻値または空間最頻値
前記基本統計量算出部が算出する前記環境データ値基本統計量は、以下の(6)から(10)のグループを有すること、
(6)前記空調空間の環境データ値の時間平均値または空間平均値
(7)前記空調空間の環境データ値の時間中央値または空間中央値
(8)前記空調空間の環境データ値の時間最大値または空間最大値
(9)前記空調空間の環境データ値の時間最小値または空間最小値
(10)前記空調空間の環境データ値の時間最頻値または空間最頻値
を特徴とする快適度表示装置。The comfort degree display device according to claim 5, wherein
The comfort value basic statistic calculated by the basic statistic calculation unit has the following groups (1) to (5),
(1) time average value or space average value of the user comfort value (2) time median or space median value of the user comfort value (3) time maximum value or space maximum of the user comfort value Value (4) Time minimum value or space minimum value of the user's comfort level value (5) time mode or spatial mode value of the user's level of comfort value The environmental data value calculated by the basic statistic calculation unit The basic statistics have the following groups (6) to (10),
(6) time average value or space average value of environmental data values of the air conditioned space (7) median time or median value of environmental data values of the air conditioned space (8) maximum time value of environmental data values of the air conditioned space Or space maximum value (9) time minimum value or space minimum value of environmental data value of the air conditioned space (10) comfort degree display device characterized by time mode or space mode of environmental data value of the air conditioned space .
前記表示データ生成部は、
前記(1)のグループの前記快適度値基本統計量に含まれる2つの値のいずれか一方と、前記(6)のグループの前記環境データ値基本統計量に含まれる2つの値のいずれか一方、
或いは、前記(2)のグループの前記快適度値基本統計量に含まれる2つの値のいずれか一方と、前記(7)のグループの前記環境データ値基本統計量に含まれる2つの値のいずれか一方、
或いは、前記(3)のグループの前記快適度値基本統計量に含まれる2つの値のいずれか一方と、前記(8)のグループの前記環境データ値基本統計量に含まれる2つの値のいずれか一方、
或いは、前記(4)のグループの前記快適度値基本統計量に含まれる2つの値のいずれか一方と、前記(9)のグループの前記環境データ値基本統計量に含まれる2つの値のいずれか一方、
或いは、前記(5)のグループの前記快適度値基本統計量に含まれる2つの値のいずれか一方と、前記(10)のグループの前記環境データ値基本統計量に含まれる2つの値のいずれか一方、
を合成して前記統計量表示データを生成する快適度表示装置。The comfort degree display device according to claim 6, wherein
The display data generation unit
One of two values included in the comfort value basic statistic of the group of (1) and one of two values included in the environmental data value basic statistic of the group of (6) ,
Alternatively, any one of two values included in the comfort value basic statistic of the group (2) and any two values included in the environmental data value basic statistic of the group (7) Or one,
Alternatively, any one of two values included in the comfort value basic statistic of the group of (3) and any one of two values included in the environmental data value basic statistic of the group of (8) Or one,
Alternatively, any one of two values included in the comfort value basic statistic of the group of (4) and any two values included in the environmental data value basic statistic of the group of (9) Or one,
Alternatively, any one of two values included in the comfort value basic statistic of the group of the (5) and any one of two values included in the environmental data value basic statistic of the group of the (10) Or one,
The comfort degree display device which synthesize | combines and produces | generates said statistic display data.
前記空調空間は複数のエリアで構成され、
前記快適度表示装置は、更に、
前記空調空間の各エリアの構成情報を格納するエリア情報格納部と、
前記エリア情報格納部に格納された各エリアの構成情報を参照して各エリアの前記空調空間の状況を表すエリア環境データ値をエリア毎に取得するエリア環境データ値取得部と、
前記嗜好格納部に格納した前記ユーザの嗜好と、前記属性格納部に格納した前記ユーザの属性と、前記エリア環境データ値取得部が取得した前記エリア環境データ値とに基づいて前記ユーザの前記エリアにおける快適性を示すエリア快適度値を生成するエリア快適度値生成部と、
前記エリア快適度値生成部で生成した前記ユーザのエリア快適度値と、前記エリア環境データ値取得部が取得した前記エリア環境データ値と、を合成してエリア表示データを生成するエリア表示データ生成部と、を有し、
前記表示部が、1つまたは複数の前記エリア表示データを表示すること、
を特徴とする快適度表示装置。The comfort degree display device according to claim 1, wherein
The air conditioning space is composed of a plurality of areas,
The comfort degree display device further includes:
An area information storage unit for storing configuration information of each area of the air conditioned space;
An area environmental data value acquisition unit which acquires area environmental data values representing the condition of the air conditioned space of each area with reference to configuration information of each area stored in the area information storage unit;
The area of the user based on the preference of the user stored in the preference storage unit, the attribute of the user stored in the attribute storage unit, and the area environmental data value acquired by the area environmental data value acquisition unit An area comfort value generation unit that generates an area comfort value indicating comfort in
Area display data generation that generates area display data by combining the area comfort degree value of the user generated by the area comfort degree value generation unit and the area environment data value acquired by the area environment data value acquisition unit Have a department,
The display unit displaying one or more of the area display data;
Comfort degree display device characterized by.
前記エリア快適度値生成部で生成した前記ユーザのエリア快適度値を代表するエリア快適度値基本統計量と、前記エリア環境データ値取得部が取得した前記エリア環境データ値を代表するエリア環境データ値基本統計量と、を算出するエリア基本統計量算出部を有し、
前記エリア表示データ生成部は、前記ユーザのエリア快適度値と、前記エリア環境データ値と、前記エリア快適度値基本統計量と前記エリア環境データ値基本統計量の内のいずれか1つまたは複数と、を合成してエリア表示統合データを生成し、
前記表示部が、1つまたは複数の前記エリア表示統合データを表示する快適度表示装置。The comfort degree display device according to claim 8 further includes:
Area environment data representative of the area comfort value basic statistic that represents the area comfort value of the user generated by the area comfort value generation unit, and area environment data that represents the area environment data value acquired by the area environment data value acquisition unit An area basic statistic calculation unit that calculates a value basic statistic;
The area display data generation unit is any one or more of the area comfort value of the user, the area environment data value, the area comfort value basic statistic, and the area environment data value basic statistic. And generate area display integrated data,
The comfort level display device, wherein the display unit displays one or more of the area display integrated data.
前記エリア基本統計量算出部が算出する前記エリア快適度値基本統計量は、以下の(1)から(5)のグループを有し、
(1)前記ユーザのエリア快適度値の時間平均値または空間平均値
(2)前記ユーザのエリア快適度値の時間中央値または空間中央値
(3)前記ユーザのエリア快適度値の時間最大値または空間最大値
(4)前記ユーザのエリア快適度値の時間最小値または空間最小値
(5)前記ユーザのエリア快適度値の時間最頻値または空間最頻値
前記エリア基本統計量算出部が算出する前記エリア環境データ値基本統計量は、以下の(6)から(10)のグループを有すること、
(6)前記エリア環境データ値の時間平均値または空間平均値
(7)前記エリア環境データ値の時間中央値または空間中央値
(8)前記エリア環境データ値の時間最大値または空間最大値
(9)前記エリア環境データ値の時間最小値または空間最小値
(10)前記エリア環境データ値の時間最頻値または空間最頻値
を特徴とする快適度表示装置。The comfort degree display device according to claim 9, wherein
The area comfort value basic statistic calculated by the area basic statistic calculation unit has the following groups (1) to (5),
(1) time average value or space average value of the area comfort value of the user (2) time median or space median value of the area comfort value of the user (3) time maximum value of the area comfort value of the user Or the space maximum value (4) the time minimum value or the space minimum value of the area comfort value of the user (5) the time mode or space mode of the area comfort value of the user The area environmental data value basic statistic to be calculated has the following groups (6) to (10):
(6) time average value or space average value of the area environmental data value (7) time median value or space median value of the area environmental data value (8) time maximum value or space maximum value of the area environmental data value (9 A time minimum value or a space minimum value of the area environmental data value (10) A comfort degree display device characterized by a time mode or a spatial mode value of the area environmental data value.
前記エリア表示データ生成部は、
前記ユーザのエリア快適度値と、前記エリア環境データ値と、前記(1)のグループの前記エリア快適度値基本統計量と前記(6)のグループの前記エリア環境データ値基本統計量の内のいずれか1つまたは複数、
或いは、前記ユーザのエリア快適度値と、前記エリア環境データ値と、前記(2)のグループの前記エリア快適度値基本統計量と前記(7)のグループの前記エリア環境データ値基本統計量の内のいずれか1つまたは複数、
或いは、前記ユーザのエリア快適度値と、前記エリア環境データ値と、前記(3)のグループの前記エリア快適度値基本統計量と前記(8)のグループの前記エリア環境データ値基本統計量の内のいずれか1つまたは複数、
或いは、前記ユーザのエリア快適度値と、前記エリア環境データ値と、前記(4)のグループの前記エリア快適度値基本統計量と前記(9)のグループの前記エリア環境データ値基本統計量の内のいずれか1つまたは複数、
或いは、前記ユーザのエリア快適度値と、前記エリア環境データ値と、前記(5)のグループの前記エリア快適度値基本統計量と前記(10)のグループの前記エリア環境データ値基本統計量の内のいずれか1つまたは複数、
を合成して前記エリア表示統合データを生成する快適度表示装置。The comfort degree display device according to claim 10, wherein
The area display data generation unit
Among the area comfort value of the user, the area environmental data value, the area comfort value basic statistic of the group (1), and the area environmental data value fundamental statistic of the group (6) Any one or more,
Alternatively, the area comfort value of the user, the area environmental data value, the area comfort value basic statistic of the group of (2), and the area environmental data value basic statistic of the group of (7) Any one or more of
Alternatively, the area comfort value of the user, the area environmental data value, the area comfort value basic statistic of the group of (3), and the area environmental data value basic statistic of the group of (8) Any one or more of
Alternatively, the area comfort value of the user, the area environmental data value, the area comfort value basic statistic of the group of (4), and the area environmental data value basic statistic of the group of (9) Any one or more of
Alternatively, the area comfort value of the user, the area environmental data value, the area comfort value basic statistic of the group of (5), and the area environmental data value basic statistic of the group of (10) Any one or more of
The comfort degree display device which synthesize | combines and produces the said area display integrated data.
前記エリア快適度値生成部で生成した前記ユーザのエリア快適度値を代表するエリア快適度値基本統計量と、前記エリア環境データ値取得部が取得した前記エリア環境データ値を代表するエリア環境データ値基本統計量と、を算出するエリア基本統計量算出部を有し、
前記エリア表示データ生成部は、前記エリア快適度値基本統計量の内のいずれか1つと、前記エリア環境データ値基本統計量の内のいずれか1つを合成してエリア統計量表示データを生成し、
前記表示部が、1つまたは複数の前記エリア統計量表示データを表示する快適度表示装置。The comfort degree display device according to claim 8 further includes:
Area environment data representative of the area comfort value basic statistic that represents the area comfort value of the user generated by the area comfort value generation unit, and area environment data that represents the area environment data value acquired by the area environment data value acquisition unit An area basic statistic calculation unit that calculates a value basic statistic;
The area display data generation unit generates area statistics display data by combining any one of the area comfort value basic statistics and any one of the area environmental data values basic statistics. And
The comfort level display device, wherein the display unit displays one or more of the area statistic display data.
前記エリア基本統計量算出部が算出する前記エリア快適度値基本統計量は、以下の(1)から(5)を有し、
(1)前記ユーザのエリア快適度値の時間平均値または空間平均値
(2)前記ユーザのエリア快適度値の時間中央値または空間中央値
(3)前記ユーザのエリア快適度値の時間最大値または空間最大値
(4)前記ユーザのエリア快適度値の時間最小値または空間最小値
(5)前記ユーザのエリア快適度値の時間最頻値または空間最頻値
前記エリア基本統計量算出部が算出する前記エリア環境データ値基本統計量は、以下の(6)から(10)のグループを有すること、
(6)前記エリア環境データ値の時間平均値または空間平均値
(7)前記エリア環境データ値の時間中央値または空間中央値
(8)前記エリア環境データ値の時間最大値または空間最大値
(9)前記エリア環境データ値の時間最小値または空間最小値
(10)前記エリア環境データ値の時間最頻値または空間最頻値
を特徴とする快適度表示装置。The comfort degree display device according to claim 12, wherein
The area comfort value basic statistic calculated by the area basic statistic calculation unit has the following (1) to (5),
(1) time average value or space average value of the area comfort value of the user (2) time median or space median value of the area comfort value of the user (3) time maximum value of the area comfort value of the user Or the space maximum value (4) the time minimum value or the space minimum value of the area comfort value of the user (5) the time mode or space mode of the area comfort value of the user The area environmental data value basic statistic to be calculated has the following groups (6) to (10):
(6) time average value or space average value of the area environmental data value (7) time median value or space median value of the area environmental data value (8) time maximum value or space maximum value of the area environmental data value (9 A time minimum value or a space minimum value of the area environmental data value (10) A comfort degree display device characterized by a time mode or a spatial mode value of the area environmental data value.
前記エリア表示データ生成部は、
前記(1)のグループの前記エリア快適度値基本統計量に含まれる2つの値のいずれか一方と、前記(6)のグループの前記エリア環境データ値基本統計量に含まれる2つの値のいずれか一方、
或いは、前記(2)のグループの前記エリア快適度値基本統計量に含まれる2つの値のいずれか一方と、前記(7)のグループの前記エリア環境データ値基本統計量に含まれる2つの値のいずれか一方、
或いは、前記(3)のグループの前記エリア快適度値基本統計量に含まれる2つの値のいずれか一方と、前記(8)のグループの前記エリア環境データ値基本統計量に含まれる2つの値のいずれか一方、
或いは、前記(4)のグループの前記エリア快適度値基本統計量に含まれる2つの値のいずれか一方と、前記(9)のグループの前記エリア環境データ値基本統計量に含まれる2つの値のいずれか一方、
或いは、前記(5)のグループの前記エリア快適度値基本統計量に含まれる2つの値のいずれか一方と、前記(10)のグループの前記エリア環境データ値基本統計量に含まれる2つの値のいずれか一方、
を合成して前記エリア統計量表示データを生成する快適度表示装置。The comfort degree display device according to claim 13, wherein
The area display data generation unit
Any one of two values included in the area comfort value basic statistic of the group of the (1) and any one of two values included in the area environmental data value basic statistic of the group of the (6) Or one,
Alternatively, either one of two values included in the area comfort value basic statistic of the group of (2) and two values included in the area environmental data value basic statistic of the group of (7) Either one,
Alternatively, either one of two values included in the area comfort value basic statistic of the group of (3) and two values included in the area environmental data value basic statistic of the group of (8) Either one,
Alternatively, either one of two values included in the area comfort value basic statistic of the group of (4) and two values included in the area environmental data value basic statistic of the group of (9) Either one,
Alternatively, one of two values included in the area comfort value basic statistic of the group of the (5) and two values included in the area environmental data value basic statistic of the group of the (10) Either one,
The comfort degree display device which synthesize | combines and produces | generates the said area statistics display data.
前記エリア情報格納部に前記空調空間の前記エリアの構成情報を入力するエリア情報入力部を有する快適度表示装置。The comfort degree display device according to any one of claims 8 to 14, further comprising:
The comfort degree display apparatus which has an area information input part which inputs the structure information of the said area of the said air conditioned space in the said area information storage part.
前記空調空間の機器に使用される電力データ値を取得する電力情報取得部を有し、
前記表示データ生成部が、前記快適度値生成部で生成した前記ユーザの快適度値と、前記環境データ値取得部が取得した前記空調空間の環境データ値と、前記電力情報取得部が取得した電力データ値とを合成して前記表示データを生成する快適度表示装置。The comfort degree display device according to claim 1 further comprises:
It has an electric power information acquisition part which acquires electric power data value used for apparatus of the above-mentioned air-conditioning space,
The display data generation unit acquires the user comfort level value generated by the comfort level value generation unit, the environmental data value of the air-conditioned space acquired by the environmental data value acquisition unit, and the power information acquisition unit The comfort degree display device which synthesize | combines with an electric power data value and produces | generates said display data.
前記エリア快適度値生成部で生成した前記ユーザのエリア快適度値を代表するエリア快適度値基本統計量を算出するエリア基本統計量算出部と、
前記エリア基本統計量算出部が算出する前記エリア快適度値基本統計量と、所定の閾値とを比較評価してエリア快適度評価を出力するエリア快適度評価部と、を有し、
前記エリア表示データ生成部は、前記エリア快適度値生成部で生成した前記ユーザのエリア快適度値と、前記エリア環境データ値取得部が取得した前記エリア環境データ値と、前記エリア快適度評価部が出力した前記エリア快適度評価と、を合成して前記エリア表示データを生成する快適度表示装置。The comfort degree display device according to claim 8 further includes:
An area basic statistic calculation unit that calculates an area comfort value basic statistic representing the area comfort value of the user generated by the area comfort value generation unit;
The area comfort degree evaluation unit compares the area comfort degree basic statistic calculated by the area basic statistic calculation unit with a predetermined threshold value and outputs an area comfort degree evaluation.
The area display data generation unit includes the area comfort value of the user generated by the area comfort value generation unit, the area environmental data value acquired by the area environmental data value acquisition unit, and the area comfort evaluation unit. The comfort degree display device which synthesize | combines the said area comfort degree evaluation which was output, and produces | generates the said area display data.
前記ユーザの生体情報を格納する生体情報格納部と、
前記ユーザの現在状態量と前記ユーザの現在位置とを取得するユーザ状態取得部と、を有し、
前記快適度値生成部は、前記嗜好格納部に格納した前記ユーザの嗜好と、前記属性格納部に格納した前記ユーザの属性と、前記環境データ値取得部が取得した前記空調空間の環境データ値と、前記生体情報格納部に格納した前記ユーザの前記生体情報と、前記ユーザ状態取得部が取得した前記ユーザの現在状態量と前記ユーザの現在位置とに基づいて前記ユーザの前記空調空間における快適性を示す快適度値を生成する快適度表示装置。The comfort degree display device according to claim 1 further comprises:
A biometric information storage unit that stores biometric information of the user;
A user state acquisition unit that acquires the current state amount of the user and the current position of the user;
The comfort degree value generation unit may include the preference of the user stored in the preference storage unit, the attribute of the user stored in the attribute storage unit, and an environmental data value of the air-conditioned space acquired by the environmental data value acquisition unit. And comfort of the user in the air-conditioned space based on the biometric information of the user stored in the biometric information storage unit, the current state amount of the user acquired by the user status acquisition unit, and the current position of the user Comfort indicator that generates comfort values that indicate the nature.
前記快適度値生成部で生成した離散値である前記ユーザの快適度値を補完して時間または空間に対する連続値を算出し、前記環境データ値取得部が取得した離散値である前記空調空間の環境データ値を補完して時間または空間に対する連続値を算出する補完部を有し、
前記表示データ生成部が、前記ユーザの快適度値の時間または空間に対する連続値のいずれか一方と、前記空調空間の環境データ値の時間または空間に対する連続値のいずれか一方とを合成して連続表示データを生成し、
前記表示部が、前記連続表示データを表示する快適度表示装置。The comfort degree display device according to claim 1 further comprises:
In the air-conditioned space, which is a discrete value acquired by the environmental data value acquisition unit, which calculates a continuous value for time or space by complementing the comfort value of the user, which is a discrete value generated by the comfort value generation unit There is a complementing unit that complements environmental data values and calculates continuous values for time or space,
The display data generation unit combines and combines either one of time or space continuous values of the user's comfort level with either of time or space continuous values of environmental data values of the air-conditioned space Generate display data,
The comfort degree display device in which the said display part displays the said continuous display data.
前記ユーザの快適度値が快適限界範囲にない場合に異常を検出し、異常データを出力する異常検出部を有し、
前記表示データ生成部は、前記異常検出部が出力した異常データと、前記ユーザの快適度値と、前記空調空間の環境データ値とを合成して異常表示データを生成し、
前記表示部が、前記異常表示データを表示する快適度表示装置。The comfort degree display device according to claim 1 further comprises:
It has an abnormality detection unit that detects an abnormality when the comfort value of the user is not within the comfort limit range, and outputs abnormal data,
The display data generation unit generates abnormality display data by combining the abnormality data output from the abnormality detection unit, the comfort level value of the user, and the environmental data value of the air conditioned space.
The comfort degree display device in which the said display part displays the said abnormality display data.
前記ユーザの快適度値が快適限界範囲にない場合に異常を検出し、異常データを出力する異常検出部を有し、
前記表示データ生成部は、前記異常検出部が異常を検出した前記ユーザの快適度値を他のユーザの快適度値と識別できる異常識別表示データを、前記ユーザの快適度値と前記空調空間の環境データ値とを合成して生成し、
前記表示部が、前記異常識別表示データを表示する快適度表示装置。The comfort degree display device according to claim 1 further comprises:
It has an abnormality detection unit that detects an abnormality when the comfort value of the user is not within the comfort limit range, and outputs abnormal data,
The display data generation unit may include abnormality identification display data that can distinguish the comfort level value of the user whose abnormality detection section detects an abnormality with the comfort level value of another user, the comfort level value of the user, and the air conditioning space. Synthesize and generate environmental data values,
The comfort degree display device in which the said display part displays the said abnormality identification display data.
前記嗜好格納部は、タイプ別基準ユーザの空調環境に対する嗜好を格納し、
前記属性格納部は、前記タイプ別基準ユーザの属性を格納し、
前記快適度表示装置は、更に、
前記空調空間の領域毎に、前記嗜好格納部に格納した前記タイプ別基準ユーザの嗜好と、前記属性格納部に格納した前記タイプ別基準ユーザの属性と、前記環境データ値取得部が取得した前記空調空間の環境データ値とに基づいて前記タイプ別基準ユーザの快適度値を生成し、前記タイプ別基準ユーザの快適度値が所定範囲にある領域をタイプ別推奨領域に指定するタイプ別推奨領域生成部を有し、
前記表示データ生成部が、前記快適度値生成部で生成した前記ユーザの快適度値と、前記タイプ別推奨領域と、前記空調空間の環境データ値とを合成してタイプ別推奨領域表示データを生成し、
前記表示部が、前記タイプ別推奨領域表示データを表示する快適度表示装置。The comfort degree display device according to claim 1, wherein
The preference storage unit stores preferences for the air conditioning environment of the standard user classified by type,
The attribute storage unit stores attributes of the reference user classified by type,
The comfort degree display device further includes:
The preference of the standard user classified by type stored in the preference storage unit, the attribute of the standard user classified by type stored in the attribute storage unit, and the environment data value acquisition unit acquired for each area of the air conditioning space The type recommendation area which generates the comfort level value of the standard user by type based on the environmental data value of the air conditioning space, and designates the area where the comfort level value of the standard user by type is within the predetermined range as the type recommendation area. Has a generator,
The display data generation unit combines the user comfort level value generated by the comfort level value generation unit, the type classified recommended area, and the environmental data value of the air-conditioned space, and displays classified type classified area data Generate
The comfort degree display device in which the said display part displays the said recommendation area display data classified by type.
前記タイプ別推奨領域をプロジェクションマッピングまたは拡張現実で表示する移動先表示部を有する快適度表示装置。The comfort degree display device according to claim 22, further comprising:
The comfort degree display device which has a moving-destination display part which displays the said recommendation area classified by type by projection mapping or augmented reality.
前記空調空間の領域毎に、前記嗜好格納部に格納した前記ユーザの嗜好と、前記属性格納部に格納した前記ユーザの属性と、前記環境データ値取得部が取得した前記空調空間の環境データ値とに基づいて前記ユーザの快適度値を生成し、前記ユーザの快適度値が所定範囲にある領域をユーザ別推奨領域に指定するユーザ別推奨領域生成部を有し、
前記表示データ生成部が、前記快適度値生成部で生成した前記ユーザの快適度値と、前記ユーザ別推奨領域と、前記空調空間の環境データ値とを合成してユーザ別推奨領域表示データを生成し、
前記表示部が、前記ユーザ別推奨領域表示データを表示する快適度表示装置。The comfort degree display device according to claim 1 or 22, further,
The preference of the user stored in the preference storage unit, the attribute of the user stored in the attribute storage unit, and the environmental data value of the air conditioned space acquired by the environmental data value acquisition unit for each area of the air conditioned space And a user-specific recommended area generation unit that generates the user's comfort level value based on and the area where the user's comfort level value is within a predetermined range as the user-specific recommended area;
The display data generation unit combines the user comfort degree value generated by the comfort degree value generation unit, the user-by-user recommendation area, and the environmental data value of the air-conditioned space, and displays the user-by-user recommendation area display data Generate
The comfort degree display device in which the said display part displays the said recommendation area display data classified by user.
前記ユーザ別推奨領域をプロジェクションマッピングまたは拡張現実で表示する移動先表示部を有する快適度表示装置。The comfort degree display device according to claim 24 further comprises:
The comfort degree display device which has a moving-destination display part which displays the said user classified recommendation area by projection mapping or augmented reality.
前記ユーザの現在状態量と前記ユーザの現在位置とを取得するユーザ状態取得部を有し、
前記快適度値生成部は、前記嗜好格納部に格納した前記ユーザの嗜好と、前記属性格納部に格納した前記ユーザの属性と、前記環境データ値取得部が取得した前記空調空間の環境データ値と、前記ユーザ状態取得部が取得した前記ユーザの現在状態量と前記ユーザの現在位置とに基づいて前記ユーザの現在の快適性を示す現在快適度値を生成し、
前記快適度表示装置は、更に、
前記現在快適度値が所定範囲にない場合には、前記ユーザの快適度値が所定範囲に入るまで前記ユーザの状態量を現在状態量から変更して、前記ユーザの嗜好と、前記ユーザの属性と、前記空調空間の環境データ値と、前記ユーザの現在位置とに基づいて前記ユーザの快適度値を繰り返し生成して、前記ユーザの快適度値が所定範囲に入る前記ユーザの変更状態量を確定し、前記ユーザの現在状態量と前記変更状態量の差に基づいて前記ユーザの推奨行動を生成する推奨行動生成部を有し、
前記表示データ生成部は、前記快適度値生成部で生成した前記ユーザの前記現在快適度値と、前記空調空間の環境データ値と、前記推奨行動生成部が生成した前記推奨行動とを合成して推奨行動表示データを生成し、
前記表示部が、前記推奨行動表示データを表示する快適度表示装置。The comfort degree display device according to claim 1 further comprises:
A user state acquisition unit that acquires the current state amount of the user and the current position of the user;
The comfort degree value generation unit may include the preference of the user stored in the preference storage unit, the attribute of the user stored in the attribute storage unit, and an environmental data value of the air-conditioned space acquired by the environmental data value acquisition unit. And generating a current comfort value indicating the current comfort of the user based on the current state amount of the user acquired by the user state acquisition unit and the current position of the user.
The comfort degree display device further includes:
If the current comfort level is not within the predetermined range, the user's state quantity is changed from the current state quantity until the user's comfort level falls within the predetermined range, and the user's preference and the user's attributes The user's comfort level value is repeatedly generated based on the environmental data value of the air-conditioned space and the current position of the user, and the user's change state amount in which the user's comfort level value falls within a predetermined range And a recommended action generation unit configured to determine and generate a recommended action of the user based on a difference between the current state amount of the user and the change state amount,
The display data generation unit combines the current comfort value of the user generated by the comfort value generation unit, an environmental data value of the air-conditioned space, and the recommended action generated by the recommended action generation unit. Generate recommended action display data,
The comfort degree display device in which the said display part displays the said recommendation action display data.
前記タイプ別基準ユーザの属性を格納する属性格納部と、
空調空間の状況を表す環境データ値を取得する環境データ値取得部と、
前記空調空間の領域毎に、前記嗜好格納部に格納した前記タイプ別基準ユーザの嗜好と、前記属性格納部に格納した前記タイプ別基準ユーザの属性と、前記環境データ値取得部が取得した前記空調空間の環境データ値とに基づいて前記タイプ別基準ユーザの快適度値を生成し、前記タイプ別基準ユーザの快適度値が所定範囲にある領域をタイプ別推奨領域に指定するタイプ別推奨領域生成部と、
前記タイプ別推奨領域と、前記空調空間の環境データ値とを合成してタイプ別推奨領域表示データを生成する表示データ生成部と、
前記タイプ別推奨領域表示データを表示する表示部と、
を有することを特徴とする快適度表示装置。A preference storage unit storing preferences for the air conditioning environment of the standard user classified by type;
An attribute storage unit for storing an attribute of the reference user classified by type;
An environmental data value acquisition unit for acquiring environmental data values representing the condition of the air conditioned space;
The preference of the standard user classified by type stored in the preference storage unit, the attribute of the standard user classified by type stored in the attribute storage unit, and the environment data value acquisition unit acquired for each area of the air conditioning space The type recommendation area which generates the comfort level value of the standard user by type based on the environmental data value of the air conditioning space, and designates the area where the comfort level value of the standard user by type is within the predetermined range as the type recommendation area. A generation unit,
A display data generation unit configured to generate type recommendation area display data by combining the type recommendation area and the environmental data value of the air-conditioned space;
A display unit for displaying the recommended area display data classified by type;
The comfort degree display device characterized by having.
前記ユーザの属性を格納する属性格納部と、
空調空間の状況を表す環境データ値を取得する環境データ値取得部と、
前記空調空間の領域毎に、前記嗜好格納部に格納した前記ユーザの嗜好と、前記属性格納部に格納した前記ユーザの属性と、前記環境データ値取得部が取得した前記空調空間の環境データ値とに基づいて前記ユーザの快適度値を生成し、前記ユーザの快適度値が所定範囲にある領域をユーザ別推奨領域に指定するユーザ別推奨領域生成部と、
前記ユーザ別推奨領域と、前記空調空間の環境データ値とを合成してユーザ別推奨領域表示データを生成する表示データ生成部と、
前記ユーザ別推奨領域表示データを表示する表示部と、
を有することを特徴とする快適度表示装置。A preference storage unit storing preferences of the user for the air conditioning environment;
An attribute storage unit for storing the attributes of the user;
An environmental data value acquisition unit for acquiring environmental data values representing the condition of the air conditioned space;
The preference of the user stored in the preference storage unit, the attribute of the user stored in the attribute storage unit, and the environmental data value of the air conditioned space acquired by the environmental data value acquisition unit for each area of the air conditioned space And a user-specific recommended area generation unit that generates the user's comfort level value based on the user's preference level and designates an area where the user's comfort level value is in a predetermined range as the user-specific recommended area;
A display data generation unit that generates the user-by-user recommended area display data by combining the user-by-user recommended area and the environmental data value of the air-conditioned space;
A display unit for displaying the user-specific recommended area display data;
The comfort degree display device characterized by having.
Priority Applications (3)
| Application Number | Priority Date | Filing Date | Title |
|---|---|---|---|
| AU2018299309AAU2018299309A1 (en) | 2017-07-12 | 2018-06-28 | Comfort level display device |
| US16/622,114US11315295B2 (en) | 2017-07-12 | 2018-06-28 | Comfort level display apparatus that generates correlation information between user comfort levels and temperature changes |
| EP18831406.6AEP3633280B1 (en) | 2017-07-12 | 2018-06-28 | Comfort level display apparatus |
Applications Claiming Priority (4)
| Application Number | Priority Date | Filing Date | Title |
|---|---|---|---|
| JP2017-136079 | 2017-07-12 | ||
| JP2017136079 | 2017-07-12 | ||
| JP2018-093490 | 2018-05-15 | ||
| JP2018093490AJP7037432B2 (en) | 2017-07-12 | 2018-05-15 | Comfort display device |
Publications (1)
| Publication Number | Publication Date |
|---|---|
| WO2019013014A1true WO2019013014A1 (en) | 2019-01-17 |
Family
ID=65001672
Family Applications (1)
| Application Number | Title | Priority Date | Filing Date |
|---|---|---|---|
| PCT/JP2018/024709CeasedWO2019013014A1 (en) | 2017-07-12 | 2018-06-28 | Comfort level display device |
Country Status (2)
| Country | Link |
|---|---|
| US (1) | US11315295B2 (en) |
| WO (1) | WO2019013014A1 (en) |
Cited By (9)
| Publication number | Priority date | Publication date | Assignee | Title |
|---|---|---|---|---|
| JP2021124246A (en)* | 2020-02-05 | 2021-08-30 | 株式会社大林組 | Air conditioning system and control method for air conditioner |
| JPWO2021199381A1 (en)* | 2020-04-01 | 2021-10-07 | ||
| WO2021220391A1 (en)* | 2020-04-28 | 2021-11-04 | 三菱電機株式会社 | Information processing device and air conditioning system |
| CN115280355A (en)* | 2020-03-18 | 2022-11-01 | 三菱电机株式会社 | Comfort analysis device and instruction device for environmental control |
| CN115523657A (en)* | 2022-08-24 | 2022-12-27 | 青岛海尔空调器有限总公司 | Control method for air conditioner and air conditioner |
| WO2024048010A1 (en)* | 2022-08-29 | 2024-03-07 | パナソニックIpマネジメント株式会社 | Design method, program, and design system |
| JPWO2024084648A1 (en)* | 2022-10-20 | 2024-04-25 | ||
| WO2025099898A1 (en)* | 2023-11-09 | 2025-05-15 | 三菱電機株式会社 | Thermal sensation estimation apparatus, thermal sensation estimation method, and thermal sensation estimation program |
| JP7724452B2 (en) | 2023-02-08 | 2025-08-18 | パナソニックIpマネジメント株式会社 | Display method, terminal device, display system, and program |
Families Citing this family (6)
| Publication number | Priority date | Publication date | Assignee | Title |
|---|---|---|---|---|
| WO2019043834A1 (en)* | 2017-08-30 | 2019-03-07 | 三菱電機株式会社 | Air conditioning system control device |
| WO2020022123A1 (en)* | 2018-07-27 | 2020-01-30 | 日本電信電話株式会社 | Action optimization device, method and program |
| US12392520B2 (en)* | 2019-10-08 | 2025-08-19 | Ambi Labs Limited | HVAC control system and method |
| CN112432316B (en)* | 2020-11-23 | 2022-06-14 | 珠海格力电器股份有限公司 | Air conditioner control method and device, electronic equipment and storage medium |
| US11970047B2 (en)* | 2020-12-01 | 2024-04-30 | Haier Us Appliance Solutions, Inc. | Recreational vehicle air conditioner and methods of operation |
| CN113376327B (en)* | 2021-07-08 | 2023-01-17 | 海南海笙信息科技有限公司 | Environmental monitoring information management method and system based on big data |
Citations (9)
| Publication number | Priority date | Publication date | Assignee | Title |
|---|---|---|---|---|
| JPH0755226A (en)* | 1993-08-10 | 1995-03-03 | Hitachi Ltd | Comfort Sensing Device and Living Room Environmental Control Equipment Using the Device |
| JP2011089682A (en) | 2009-10-21 | 2011-05-06 | Hitachi Ltd | Area environment control system and method of controlling area environment |
| JP2011250027A (en)* | 2010-05-25 | 2011-12-08 | Panasonic Electric Works Co Ltd | Remote control device and information communication system |
| JP2012234356A (en)* | 2011-04-28 | 2012-11-29 | Takenaka Komuten Co Ltd | Behavior motivation device |
| JP2013104632A (en) | 2011-11-15 | 2013-05-30 | Stella Green Corp | Method for assessing comfort level distribution, system for assessing comfort level distribution, air conditioning control system, and computer program |
| JP2014123277A (en)* | 2012-12-21 | 2014-07-03 | Sony Corp | Display control system and recording medium |
| JP2014206779A (en)* | 2013-04-10 | 2014-10-30 | 大阪瓦斯株式会社 | Seat reservation system |
| WO2016103560A1 (en)* | 2014-12-25 | 2016-06-30 | パナソニックIpマネジメント株式会社 | Projector device |
| JP2016169925A (en)* | 2015-03-13 | 2016-09-23 | 株式会社東芝 | Indoor environment control device, indoor environment control method, and computer program |
Family Cites Families (15)
| Publication number | Priority date | Publication date | Assignee | Title |
|---|---|---|---|---|
| JP2011187030A (en) | 2010-03-11 | 2011-09-22 | Omron Corp | Environmental information providing device, cooperation system of the same, environmental information providing method, and display device |
| FR2960045B1 (en)* | 2010-05-12 | 2012-07-20 | Commissariat Energie Atomique | PERSONALIZED CONTROL OF THE THERMAL COMFORT OF AN OCCUPANT OF A BUILDING |
| US20110313579A1 (en)* | 2010-05-25 | 2011-12-22 | Cheuk Ting Ling | Method for Energy Saving On Electrical Systems Using Habit Oriented Control |
| US8090477B1 (en)* | 2010-08-20 | 2012-01-03 | Ecofactor, Inc. | System and method for optimizing use of plug-in air conditioners and portable heaters |
| US8843239B2 (en)* | 2010-11-19 | 2014-09-23 | Nest Labs, Inc. | Methods, systems, and related architectures for managing network connected thermostats |
| US8195313B1 (en)* | 2010-11-19 | 2012-06-05 | Nest Labs, Inc. | Thermostat user interface |
| CA2735614A1 (en)* | 2011-04-04 | 2012-10-04 | Ecobee Inc. | Programming simulator for an hvac controller |
| JP5755556B2 (en) | 2011-12-14 | 2015-07-29 | 三菱電機ビルテクノサービス株式会社 | Air conditioning control device, air conditioning control system, and air conditioning control program |
| JP5382152B2 (en) | 2012-01-31 | 2014-01-08 | 三菱電機株式会社 | Air conditioner |
| US9098096B2 (en)* | 2012-04-05 | 2015-08-04 | Google Inc. | Continuous intelligent-control-system update using information requests directed to user devices |
| US20140277765A1 (en) | 2013-03-15 | 2014-09-18 | University Of Southern California | Human-building interaction framework for personalized comfort driven system operations in buildings |
| US9996091B2 (en)* | 2013-05-30 | 2018-06-12 | Honeywell International Inc. | Comfort controller with user feedback |
| JP2015132443A (en) | 2014-01-15 | 2015-07-23 | 株式会社リコー | Device control system, control device, device control method, and program |
| JP6303731B2 (en) | 2014-03-31 | 2018-04-04 | ダイキン工業株式会社 | Thermal environment reproduction system |
| US11009248B2 (en)* | 2018-04-10 | 2021-05-18 | Air2O Inc. | Adaptive comfort control system |
- 2018
- 2018-06-28WOPCT/JP2018/024709patent/WO2019013014A1/ennot_activeCeased
- 2018-06-28USUS16/622,114patent/US11315295B2/enactiveActive
Patent Citations (9)
| Publication number | Priority date | Publication date | Assignee | Title |
|---|---|---|---|---|
| JPH0755226A (en)* | 1993-08-10 | 1995-03-03 | Hitachi Ltd | Comfort Sensing Device and Living Room Environmental Control Equipment Using the Device |
| JP2011089682A (en) | 2009-10-21 | 2011-05-06 | Hitachi Ltd | Area environment control system and method of controlling area environment |
| JP2011250027A (en)* | 2010-05-25 | 2011-12-08 | Panasonic Electric Works Co Ltd | Remote control device and information communication system |
| JP2012234356A (en)* | 2011-04-28 | 2012-11-29 | Takenaka Komuten Co Ltd | Behavior motivation device |
| JP2013104632A (en) | 2011-11-15 | 2013-05-30 | Stella Green Corp | Method for assessing comfort level distribution, system for assessing comfort level distribution, air conditioning control system, and computer program |
| JP2014123277A (en)* | 2012-12-21 | 2014-07-03 | Sony Corp | Display control system and recording medium |
| JP2014206779A (en)* | 2013-04-10 | 2014-10-30 | 大阪瓦斯株式会社 | Seat reservation system |
| WO2016103560A1 (en)* | 2014-12-25 | 2016-06-30 | パナソニックIpマネジメント株式会社 | Projector device |
| JP2016169925A (en)* | 2015-03-13 | 2016-09-23 | 株式会社東芝 | Indoor environment control device, indoor environment control method, and computer program |
Non-Patent Citations (1)
| Title |
|---|
| See also references ofEP3633280A4 |
Cited By (19)
| Publication number | Priority date | Publication date | Assignee | Title |
|---|---|---|---|---|
| JP7380276B2 (en) | 2020-02-05 | 2023-11-15 | 株式会社大林組 | Air conditioning system and air conditioner control method |
| JP2021124246A (en)* | 2020-02-05 | 2021-08-30 | 株式会社大林組 | Air conditioning system and control method for air conditioner |
| US11953220B2 (en) | 2020-03-18 | 2024-04-09 | Mitsubishi Electric Corporation | Comfort-analyzing device, environment-control command device, and comfort-analyzing method |
| CN115280355A (en)* | 2020-03-18 | 2022-11-01 | 三菱电机株式会社 | Comfort analysis device and instruction device for environmental control |
| US20230123057A1 (en)* | 2020-03-18 | 2023-04-20 | Mitsubishi Electric Corporation | Comfort-analyzing device, environment-control command device, and comfort-analyzing method |
| JPWO2021199381A1 (en)* | 2020-04-01 | 2021-10-07 | ||
| JP7199597B2 (en) | 2020-04-01 | 2023-01-05 | 三菱電機株式会社 | Air conditioning system and method for controlling air conditioner |
| US11802711B2 (en) | 2020-04-28 | 2023-10-31 | Mitsubishi Electric Corporation | Information processing device and air conditioning system |
| WO2021220391A1 (en)* | 2020-04-28 | 2021-11-04 | 三菱電機株式会社 | Information processing device and air conditioning system |
| JP7407915B2 (en) | 2020-04-28 | 2024-01-04 | 三菱電機株式会社 | Information processing equipment and air conditioning systems |
| JPWO2021220391A1 (en)* | 2020-04-28 | 2021-11-04 | ||
| CN115523657A (en)* | 2022-08-24 | 2022-12-27 | 青岛海尔空调器有限总公司 | Control method for air conditioner and air conditioner |
| WO2024048010A1 (en)* | 2022-08-29 | 2024-03-07 | パナソニックIpマネジメント株式会社 | Design method, program, and design system |
| JPWO2024084648A1 (en)* | 2022-10-20 | 2024-04-25 | ||
| WO2024084648A1 (en)* | 2022-10-20 | 2024-04-25 | 三菱電機株式会社 | Air conditioner and air conditioning method |
| JP7551013B2 (en) | 2022-10-20 | 2024-09-13 | 三菱電機株式会社 | Air conditioner and air conditioning method |
| JP7724452B2 (en) | 2023-02-08 | 2025-08-18 | パナソニックIpマネジメント株式会社 | Display method, terminal device, display system, and program |
| WO2025099898A1 (en)* | 2023-11-09 | 2025-05-15 | 三菱電機株式会社 | Thermal sensation estimation apparatus, thermal sensation estimation method, and thermal sensation estimation program |
| JP7738808B1 (en)* | 2023-11-09 | 2025-09-12 | 三菱電機株式会社 | Thermal sensation estimation device, thermal sensation estimation method, and thermal sensation estimation program |
Also Published As
| Publication number | Publication date |
|---|---|
| US11315295B2 (en) | 2022-04-26 |
| US20200134891A1 (en) | 2020-04-30 |
Similar Documents
| Publication | Publication Date | Title |
|---|---|---|
| WO2019013014A1 (en) | Comfort level display device | |
| JP7037432B2 (en) | Comfort display device | |
| Lau et al. | Dynamic response of pedestrian thermal comfort under outdoor transient conditions | |
| Al-ajmi | Thermal comfort in air-conditioned mosques in the dry desert climate | |
| Hwang et al. | Field experiments on thermal comfort in campus classrooms in Taiwan | |
| Staiger et al. | The perceived temperature–a versatile index for the assessment of the human thermal environment. Part A: scientific basics | |
| Rupp et al. | Predicting thermal comfort in office buildings in a Brazilian temperate and humid climate | |
| Alwetaishi | Impact of building function on thermal comfort: A review paper | |
| Zhang et al. | Thermal comfort investigation of naturally ventilated classrooms in a subtropical region | |
| Alfano et al. | The role of measurement accuracy on the thermal environment assessment by means of PMV index | |
| Al-ajmi et al. | Indoor thermal conditions and thermal comfort in air-conditioned domestic buildings in the dry-desert climate of Kuwait | |
| KR101650613B1 (en) | Method and apparatus for evaluating residence environment | |
| Shahzad et al. | Preferred vs neutral temperatures and their implications on thermal comfort and energy use: Workplaces in Japan, Norway and the UK | |
| Yu et al. | Utility of cooling overshoot for energy efficient thermal comfort in temporarily occupied space | |
| Peng et al. | Investigation of pregnant women thermal comfort in the waiting area of the hospital in South China, Guangzhou | |
| Höppe | Comfort requirements in indoor climate | |
| De Dear et al. | Indoor climate and thermal comfort in high-rise public housing in an equatorial climate: a field-study in Singapore | |
| Johansson | Urban thermal comfort in the tropics | |
| JP2009109034A (en) | Air conditioning control support data generation apparatus and air conditioning control support data generation method | |
| Adrian et al. | Models for the indices of thermal comfort | |
| Adekunle et al. | Estimation of Thermal Comfort Parameters of Building Occupants Based on Comfort Index, Predicted Mean Vote and Predicted Percent of Dissatisfied People in the North-West Zone of Nigeria | |
| KR101137662B1 (en) | PMV control methods of air handling unit | |
| Al-Azri et al. | Development of bioclimatic chart for passive building design in Muscat-Oman | |
| Chen et al. | Developing the methodology to investigate the thermal comfort of hot-humid climate under different ventilation modes | |
| Priya et al. | Significance of air movement for thermal comfort in educational buildings, case study of a classroom |
Legal Events
| Date | Code | Title | Description |
|---|---|---|---|
| 121 | Ep: the epo has been informed by wipo that ep was designated in this application | Ref document number:18831406 Country of ref document:EP Kind code of ref document:A1 | |
| ENP | Entry into the national phase | Ref document number:2018831406 Country of ref document:EP Effective date:20200103 | |
| NENP | Non-entry into the national phase | Ref country code:DE | |
| ENP | Entry into the national phase | Ref document number:2018299309 Country of ref document:AU Date of ref document:20180628 Kind code of ref document:A |