WO2017169444A1 - Solution analysis system - Google Patents
Solution analysis systemDownload PDFInfo
- Publication number
- WO2017169444A1 WO2017169444A1PCT/JP2017/007529JP2017007529WWO2017169444A1WO 2017169444 A1WO2017169444 A1WO 2017169444A1JP 2017007529 WJP2017007529 WJP 2017007529WWO 2017169444 A1WO2017169444 A1WO 2017169444A1
- Authority
- WO
- WIPO (PCT)
- Prior art keywords
- constant
- frequency
- measurement
- electrical impedance
- concentration
- Prior art date
- Legal status (The legal status is an assumption and is not a legal conclusion. Google has not performed a legal analysis and makes no representation as to the accuracy of the status listed.)
- Ceased
Links
Images


Classifications
- G—PHYSICS
- G01—MEASURING; TESTING
- G01N—INVESTIGATING OR ANALYSING MATERIALS BY DETERMINING THEIR CHEMICAL OR PHYSICAL PROPERTIES
- G01N21/00—Investigating or analysing materials by the use of optical means, i.e. using sub-millimetre waves, infrared, visible or ultraviolet light
- G01N21/17—Systems in which incident light is modified in accordance with the properties of the material investigated
- G01N21/25—Colour; Spectral properties, i.e. comparison of effect of material on the light at two or more different wavelengths or wavelength bands
- G01N21/31—Investigating relative effect of material at wavelengths characteristic of specific elements or molecules, e.g. atomic absorption spectrometry
- G01N21/35—Investigating relative effect of material at wavelengths characteristic of specific elements or molecules, e.g. atomic absorption spectrometry using infrared light
- G01N21/359—Investigating relative effect of material at wavelengths characteristic of specific elements or molecules, e.g. atomic absorption spectrometry using infrared light using near infrared light
- G—PHYSICS
- G01—MEASURING; TESTING
- G01N—INVESTIGATING OR ANALYSING MATERIALS BY DETERMINING THEIR CHEMICAL OR PHYSICAL PROPERTIES
- G01N27/00—Investigating or analysing materials by the use of electric, electrochemical, or magnetic means
- G01N27/02—Investigating or analysing materials by the use of electric, electrochemical, or magnetic means by investigating impedance
Definitions
- the present inventionrelates to a solution analysis system, and more particularly, to a solution analysis system that can be easily and quickly implemented, can be continuously monitored, and can individually analyze a plurality of types of ion concentrations.
- the component concentration of the solutionis measured by various methods.
- the measurement of ion concentrationis routinely performed in the agricultural field including plant culture nutrient solutions and the industrial field where plating and cleaning waste liquids are managed.
- Patent Document 1the molybdenum blue method, which is also adopted in JIS industrial standards, has been used.
- ion concentration by electric conductivityhas been possible only for ions in a solution of a single compound.
- One exampleis the measurement of salt concentration of sodium chloride.
- various ion concentrationscannot be measured individually.
- an object of the present inventionis to provide a solution analysis system that can be carried out simply and quickly, can be continuously monitored, and can individually analyze a plurality of types of ion concentrations.
- An electrical impedance measuring deviceand a control unit connected to the electrical impedance measuring device, In the detection unit of the electrical impedance measurement device, frequency-resistance characteristic data is detected by an electrical impedance method for a known solution whose concentration of the specific ion species is known, and the control is performed via the input / output unit of the electrical impedance measurement device.
- the control unitperforms multivariate analysis on the input frequency-resistance characteristic data to determine a plurality of constants corresponding to frequency measurement points, Next, a characteristic constant specific to a specific ion species is selected from the plurality of determined constants, Next, the selected constant and the frequency corresponding to the constant are stored in the storage unit as constant-frequency correspondence information, Based on the frequency in the constant-frequency correspondence information, the detection unit of the electrical impedance measurement device detects the measurement data by performing resistance measurement using an electrical impedance method for an unknown solution whose concentration of the specific ion species is unknown.
- the control unitcalculates a concentration of a specific ion species in the unknown solution based on the input measurement data and the constant of the constant-frequency correspondence information.
- the measured wavelength-absorbance spectrum datais detected and input to the control unit via the input / output units of the electrical impedance measurement device and the near-infrared spectroscopy measurement device,
- the controllerperforms multivariate analysis on the input frequency-resistance characteristic data and the wavelength-absorbance spectrum data, and determines a plurality of constants corresponding to frequency and wavelength measurement points, Next, a characteristic constant specific to a specific ion species is selected from the plurality of determined constants, Then, the selected constant and the frequency corresponding to the constant are stored in a storage unit as constant-frequency correspondence information, and the selected constant and the wavelength corresponding to the constant are stored in a storage unit, respectively.
- the concentration of the specific ion speciesis determined in each detection unit of the electrical impedance measurement device and the near-infrared spectroscopy measurement device.
- resistance measurement by the electrical impedance method and absorbance measurement by the near infrared spectroscopyare performed to detect the measurement data, and each input / output of the electrical impedance measurement device and the near infrared spectroscopy measurement device
- the control unitcalculates a concentration of a specific ion species in the unknown solution based on the input measurement data and the constant of the constant-frequency correspondence information and the constant-wavelength correspondence information.
- control unitpreferentially selects a constant corresponding to a measurement point having a large absolute value of a regression coefficient when selecting a characteristic constant specific to the specific ion species.
- Analysis system. 4The control unit may determine the number or percentage of the constants to be selected according to a predetermined analysis accuracy when selecting the characteristic constants specific to the specific ion species.
- the first aspect of the present inventionis a solution analysis system using the electrical impedance method
- the second aspectis a solution analysis system using both the electrical impedance method and near infrared spectroscopy.
- FIG. 1is a functional block diagram which shows an example of the solution analysis system which concerns on a 1st aspect.
- the solution analysis systemincludes an electrical impedance measuring device 1 and a control unit 3 connected to the electrical impedance measuring device 1.
- the electrical impedance measurement device 1is a device that performs electrical impedance measurement, and is configured to measure resistance (also referred to as impedance) while changing the frequency of the alternating voltage applied to the solution.
- the electrical impedance measuring device 1includes a detection unit 11 and an input / output unit 12.
- the detection unit 11detects the measured data, and the input / output unit 12 inputs and outputs data between the electrical impedance measuring device 1 and the control unit 3.
- the control unit 3includes a measurement point determination unit 31, a constant determination unit 32, a constant selection unit 33, a concentration calculation unit 34, an input / output unit 35, and a storage unit 36.
- the measurement point determination unit 31determines a measurement point related to measurement by the electrical impedance measurement device 1, for example, a measurement frequency in electrical impedance measurement.
- the constant determination unit 32determines a plurality of constants constituting a calibration model for calculating the concentration of the specific ion species in the unknown solution.
- the constant selection unit 33selects some or all of the determined constants.
- the concentration calculation unit 34calculates the concentration of the specific ion species in the unknown solution.
- the input / output unit 35inputs and outputs data between the control unit 3 and the electrical impedance measuring device 1.
- the storage unit 36stores data such as constants.
- the solution analysis systemincludes registration processing and concentration analysis processing. Hereinafter, each process will be described.
- a known solution with a known concentration of nitrogen-containing ionsis prepared.
- the concentration of nitrogen-containing ionsis determined from the blending amount of the nitrogen compound and is known.
- concentration of nitrogen-containing ionis determined by another methods, such as ion chromatography, and it is made known.
- the electrical impedance measuring device 1measures the known solution by an electrical impedance method.
- resistancealso referred to as impedance
- S10frequency-resistance characteristic data
- the acquired frequency-resistance characteristic dataincludes a plurality of (point L) frequencies f 1 to f L , a plurality of resistances X 1 to X L measured at each of the plurality of frequencies f 1 to f L , and measurement Data including the concentration of nitrogen-containing ions in the known solution subjected to the above.
- Lis set to, for example, 10 or more and 1000 or less.
- f 1 to f Lare respectively assigned to predetermined frequencies within this range.
- the measurement frequency range and assignmentare set by the measurement point determination unit 31 of the control unit 3.
- a plurality of known solutions having different concentrations of specific ion speciesare prepared, and the above-described measurement is performed on the plurality of known solutions to obtain a plurality of frequency-resistance characteristic data.
- those containing other ionic speciescan also be used as the known solution.
- the frequency-resistance characteristic datamay be data obtained by subjecting the measured data to a process such as a secondary differentiation process or a smoothing process.
- the acquired frequency-resistance characteristic datais input to the control unit 3.
- the control unit 3performs multivariate analysis on the acquired frequency-resistance characteristic data, and determines a plurality of constants corresponding to each frequency measurement point (S11).
- the constantis a constant constituting a calibration model for calculating the concentration of a specific ion species in an unknown solution.
- a calibration model for calculating the concentration of nitrogen-containing ions as the specific ion speciescan be expressed, for example, by the following equation.
- Y Nis the concentration of nitrogen-containing ions in the unknown solution
- X 1 to X Lare resistances measured at frequencies f 1 to f L
- a N1 to A NLare frequencies f 1 to f It is a constant corresponding to each of L.
- Multivariate analysiscan be performed by the constant determination unit 32 of the control unit 3.
- Software for performing multivariate analysiscan be obtained as a commercial product.
- a plurality of constants corresponding to the frequency measurement pointscan be determined.
- the plurality of determined constantscan be stored in the storage unit 36 as a preliminary data table associated with the corresponding measurement point.
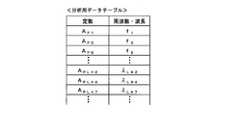
- FIG. 3shows an example of the preliminary data table.
- a plurality of determined constants A N1 , A N2 , A N3 ...Are measured points (frequencies) f 1 , f 2 , f 3. • is associated with
- control unit 3selects a characteristic constant specific to the specific ion species among the determined constants (S12).
- the constant selection unit 33 of the control unit 3converts the regression coefficients corresponding to the measurement points (frequencies) f 1 , f 2 , f 3 ... Of the preliminary data table into absolute values (S20). .
- FIG. 5 to 7are plots showing the relationship between the measurement point and the value of the regression coefficient.
- FIG. 5shows the case of nitrogen-containing ions
- FIG. 6shows the case of phosphorus ions
- FIG. 7shows the case of potassium ions.
- the value of the regression coefficientvaries in the positive and negative directions depending on the measurement point. Moreover, the state of the variation differs for each ion species, and a characteristic peculiar to the ion species is found.
- a constant corresponding to a measurement point (frequency) where the regression coefficient shows a large value in the positive and negative directionscan be selected as a characteristic constant unique to the specific ion species. Therefore, the absolute value of each regression coefficient is obtained, and a constant corresponding to a measurement point having a large absolute value of the regression coefficient is preferentially selected as a characteristic constant.
- the regression coefficient converted to an absolute valueis stored in the storage unit 36 as a constant selection data table associated with the corresponding measurement point.
- FIG. 8shows an example of a constant selection data table.
- It is associated with points (frequency) f 1 , f 2 , f 3 .
- a ′ N1 , A ′ N2 , A ′ N3 ...Are regression coefficients corresponding to the frequencies f 1 , f 2 , f 3 , respectively, and
- ...are regression coefficients converted into absolute values.
- the control unit 3sorts, for example, the constant selection data table in descending order of the absolute value of the regression coefficient, and preferentially selects the constant corresponding to the measurement point having the large absolute value of the regression coefficient (S21). For example, when 60% of the total number L of constants is selected, constants corresponding to 0.6 ⁇ L measurement points are selected in descending order of the absolute value of the regression coefficient.
- control unit 3stores an analysis data table including “constant-frequency correspondence information” including the selected constant and the frequency corresponding to the constant in the storage unit 36 (S13).
- FIG. 9shows an example of the analysis data table.
- the selected constants A N2 , A N3 , A N7 ...are associated with the corresponding measurement points (frequencies) f 2 , f 3 , f 7 , respectively. ing.
- the calibration model reconstructed based on the analysis data tablecan be expressed by the following equation.
- Y NA N2 X 2 + A N3 X 3 + A N7 X 7 ...
- the number of terms consisting of the product of the constant A and the measured value X in the above formulais reduced from L to 0.6 ⁇ L.
- the concentration Y Nmay be carried out measurements at 0.6 ⁇ L number of measurement points.
- a constant corresponding to a measurement point having an absolute value of a regression coefficient equal to or larger than an arbitrary threshold valuecan be selected.
- an arbitrary threshold valuefor example, a value obtained by multiplying an average value or maximum value of absolute values of the regression coefficients by an arbitrary value n can be set.
- the threshold(or any value n) can be set according to the number or percentage of constants to be selected.
- the total number L of constants before selectioncan be narrowed down to, for example, 10% to 90%.
- the number of constants after selectioncan be set to, for example, 5 or more and 500 or less.
- the constant selection unit 33preferably determines the number or percentage of constants to be selected according to a predetermined analysis accuracy. It is also preferred to store a plurality of analytical data tables with different numbers or percentages of selected constants. As an example, it is preferable to store a measurement accuracy priority analysis data table in which the number or percentage of selected constants is relatively large, and a quickness priority analysis data table in which the number of selected constants or percentage is relatively small. .
- the analysis data tablemay include a table in which all the constants in the preliminary data table are selected.
- control unit 3reads an analysis data table including constant-frequency correspondence information stored in the storage unit 36 (S30).
- control unit 3can be configured to select an analysis data table used for measurement from these. It is preferable to configure the analysis data table so that it can be selected according to the desired analysis accuracy.
- the electrical impedance measurement apparatus 1obtains measurement data by performing resistance measurement by an electrical impedance method at a measurement point of a frequency corresponding to a selected constant for an unknown solution in which the concentration of a specific ion species is unknown, 3 is input (S31).
- the measurement point determination unit 31 of the control unit 3performs measurement at the measurement point of the frequency corresponding to the selected constant, and performs measurement in the electrical impedance measurement device 1 so as to omit measurement at other measurement points. Can be controlled.
- the concentration calculation unit 34 of the control unit 3calculates the concentration of nitrogen-containing ions in the unknown solution based on the input measurement data of the unknown solution and the selected constant (S32).
- the control unit 3can display the calculated concentration of nitrogen-containing ions on an image display device (not shown) (S33).
- the specific ion species to be analyzedis a nitrogen-containing ion
- the present inventionis not limited to this.
- Other various ionic speciescan be analyzed in the same manner as nitrogen-containing ions.
- a calibration model for calculating the concentration of phosphorus-containing ions as the specific ion speciescan be represented by the following equation, for example.
- Y Pis the concentration of free phosphorus ions unknown solution
- X 1 ⁇ X Lis the measured resistance in the respective frequency f 1 ⁇ f L
- a P1 ⁇ A PL frequency f 1 ⁇ f LIs a constant corresponding to each of.
- constant calibration modelit can be substituted on the detected quantity model the measured data X 1 ⁇ X L measured for an unknown solution, to calculate the concentration Y P-containing phosphorus unknown solution.
- a calibration model for calculating the concentration of potassium ions as the specific ion speciescan be expressed, for example, by the following equation.
- Y Kis the concentration of potassium ions in the unknown solution
- X 1 to X Lare resistances measured at frequencies f 1 to f L
- a K1 to A KLare frequencies f 1 to f L. Is a constant corresponding to each of.
- a calibration model similar to that in the case of nitrogen-containing ionscan be configured, and the calibration model can be reconfigured by selecting constants as in the case of nitrogen-containing ions.
- the concentration of the nitrogen-containing ionsis calculated by substituting the measured data X 1 ⁇ X L measured for an unknown solution in the calibration model for the nitrogen-containing ion.
- the concentration of phosphorus ionsis calculated, and when substituted into a calibration model for potassium ions, the concentration of potassium ions is calculated.
- a plurality of ion species in the unknown solutioncan be analyzed by the calibration model corresponding to each of the plurality of ion species. That is, according to the present invention, not only a solution containing a single ionic species but also a solution containing a plurality of ionic species can be analyzed. At this time, since the same measurement data can be used together for the analysis of each ion species, the analysis can be performed quickly.
- the number of measurement points and the range of the measurement rangemay be different for each ion species.
- the solutioncan be analyzed more accurately after thinning out the constants.
- control unit 3includes a data processing unit (not shown) when performing the concentration estimation processing.
- the data processing unitspecifies a characteristic value of a characteristic waveform that will be described later.
- Concentration estimation processingincludes registration processing and estimated concentration analysis processing. Hereinafter, each of the registration process and the concentration analysis process will be described.
- the electrical impedance measuring apparatus 1acquires frequency-resistance characteristics by the electrical impedance method for a known solution containing nitrogen-containing ions at concentrations Y 1 to Y N that differ in stages (S41).
- a known solution having a known concentration of nitrogen-containing ionsis prepared in advance.
- the concentration of nitrogen-containing ionscan be determined from the compounding amount of the nitrogen compound and can be made known. Or when using the known solution sampled from arbitrary collection sources, the density
- Such a known solutionis measured by the electrical impedance method using the electrical impedance measuring device 1.
- the resistancealso referred to as impedance
- the frequency-resistance characteristicis acquired.
- the acquired frequency-resistance characteristicsinclude a plurality of (point L) frequencies f 1 to f L , a plurality of resistors X 1 to X L measured at each of the plurality of frequencies f 1 to f L , and measurement It contains data consisting of the concentration of specific ionic species in the known solution provided.
- Lis preferably set to 10 or more and 1000 or less.
- f 1 to f Lare respectively assigned to predetermined frequencies within this range.
- the frequency-resistance characteristicsare acquired for each of a plurality of known solutions having different concentrations.
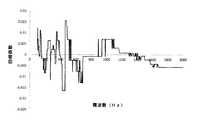
- FIG. 12shows an example of a plurality of acquired frequency-resistance characteristics. Here, a total of four frequency-resistance characteristics obtained for known solutions having concentrations Y 1 to Y 4 are shown.
- the densities Y 1 to Y 4are in a relationship of Y 1 ⁇ Y 2 ⁇ Y 3 ⁇ Y 4 , respectively. Then, as shown in FIG. 12, it can be seen that characteristic characteristic waveforms having density dependency appear in the densities Y 1 to Y 3 which are relatively low density.
- a characteristic characteristic waveform having a concentration dependencyappears between frequencies of about 300 to 400 Hz.
- at other frequenciesabout 300 Hz or less, about 400 Hz or more
- concentration dependencyis not recognized.
- such a characteristic waveform having concentration dependenceis referred to as a characteristic waveform derived from a specific ion species.
- the control unit 3acquires characteristic values P 1 to P N of the characteristic waveform derived from the specific ion species appearing in the frequency-resistance characteristics of the known solutions having the input concentrations Y 1 to Y N (S11).
- the data processing unitperforms the characteristic values P 1 to P of the specific characteristic waveforms at these concentrations Y 1 to Y 3 . 3 is specified.
- the peak value of the characteristic characteristic waveformis used as the characteristic value.
- the characteristic valueincreases as the concentration of ionic species decreases. Therefore, when the densities Y 1 to Y 4 are in the relationship of Y 1 ⁇ Y 2 ⁇ Y 3 ⁇ Y 4 , the characteristic values P 1 to P 4 are in the relationship of P 1 > P 2 > P 3 > P 4 .
- the data processing unitgenerates a data table in which the specified characteristic values P 1 to P 4 are associated with the densities Y 1 to Y 4 corresponding to the characteristic values.
- FIG. 13is a diagram conceptually illustrating an example of a data table.
- characteristic value P 1 and density Y 1 , characteristic value P 2 and density Y 2 , characteristic value P 3 and density Y 3are associated with each other.
- the generated data tableis stored in the storage unit 36 (S42).
- the electrical impedance measurement apparatus 1dilutes an unknown solution whose nitrogen-containing ion concentration is unknown, acquires frequency-resistance characteristics by the electrical impedance method, and inputs the frequency-resistance characteristics to the control unit 3 (S50).
- Wateris used for dilution, and pure water is particularly preferable.
- the method for diluting the unknown solutionis not particularly limited. For example, it is possible to prepare a plurality of unknown solutions that are diluted stepwise by separating a plurality of unknown solutions. In this case, electrical impedance measurement can be performed for a plurality of unknown solutions. Or you may make it perform an electrical impedance measurement in the process of diluting one unknown solution in steps.
- Control unit 3the frequency of the input unknown solution - Get characteristic value P D of said intrinsic characteristic waveforms in dilution rate D of intrinsic properties waveform described above into a resistance characteristic appears (P51).
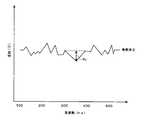
- FIG. 15shows an example of frequency-resistance characteristics of an unknown solution having a dilution ratio D.
- the data processing unitidentifies the characteristic values P D of said intrinsic characteristic waveforms in an unknown solution of such dilution D.
- the control unit 3selects the concentrations Y n ⁇ 1 and Y n (where Y n ⁇ ) among the characteristic values P 1 to P 4 corresponding to the concentrations Y 1 to Y 4 of the known solution in the data table stored in advance. 1 ⁇ a characteristic value P n-1 and P n corresponding to Y n and), the relationship P n ⁇ P D ⁇ P n-1 between the characteristic value P D of the unknown solution dilution ratio D If true, the concentration Y of the specific ion species in the undiluted unknown solution is calculated as Y n ⁇ 1 ⁇ D ⁇ Y ⁇ Y n ⁇ D (S52).
- Concentration calculation unit 34first sets the n characteristic values P n of the first known solution to be compared with the characteristic value P D of the unknown solution in 1 (S60). Thus, the subject to be compared to the first and the characteristic value P D of the unknown solution will characteristic value P 1.
- the characteristic values P 1 to P 4have a relationship of P 1 > P 2 > P 3 > P 4 . That is, as a characteristic value of the first known solution to be compared with the characteristic value P D of the unknown solution, the characteristic value P 1 indicating the largest value is selected.
- the concentration calculation unit 34determines whether or not P 1 > P D holds in the characteristic values P D and P 1 (S61).
- the concentration calculator 34calls the Y 2 and Y 1 to P 2 and P 1 from the corresponding previously stored data table in the storage unit 36 (S63).
- Y 1 ⁇ D and Y 2 ⁇ Dare calculated (S64). Accordingly, Y 1 ⁇ D ⁇ Y ⁇ Y 2 ⁇ D corresponding to P 2 ⁇ P D ⁇ P 1 can be calculated.
- the concentration Y of the specific ion species in the undiluted unknown solutionis in the range of Y 1 ⁇ D ⁇ Y ⁇ Y 2 ⁇ D.
- Y n and Y n ⁇ 1 corresponding to P n and P n ⁇ 1are called from the data table stored in advance in the storage unit 36 (S63). Then, Y n ⁇ 1 ⁇ D and Y n ⁇ D are calculated based on the called Y n and Y n ⁇ 1 and the dilution rate D (S64).
- the concentration Y of the specific ion species in the undiluted unknown solutionis in the range of Y n ⁇ 1 ⁇ D ⁇ Y ⁇ Y n ⁇ D.
- the concentration Y n-1 of nitrogen-containing ions in the known solutionis 8 ⁇ 10 ⁇ 5 mol / l
- the concentration Y nis 9 ⁇ 10 ⁇ 5 mol / l
- the dilution rate D of the unknown solutionis 30 times.
- the concentration calculation unit 34can calculate the concentration Y of the nitrogen-containing ions in the unknown solution as Y ⁇ Y 1 ⁇ D.
- the concentration calculation unit 34includes the content value in the unknown solution.
- the concentration Y of nitrogen ionscan be calculated as Y 4 ⁇ D ⁇ Y.
- an intrinsic characteristic waveform corresponding to nitrogen-containing ionsdoes not appear even when the unknown solution is diluted, it can be calculated that the unknown solution does not contain nitrogen-containing ions.
- the concentration analysis systemcan return to the (1-1) registration process of this process and start the process.
- the concentration range calculated in the concentration estimation processingcan be used in the processing of S21. That is, constant selection can be performed based on the concentration range. For example, when preferentially selecting from the larger absolute value of the constant, if the number to be selected is not pre-processed, and if it is 60%, the accuracy can be improved by using a constant of about 20%. Concentration analysis can be performed while keeping. That is, by performing this pre-processing, it is possible to maintain the accuracy of the concentration to be analyzed while reducing the amount of calculation used for the concentration analysis processing, and it is possible to perform a more accurate concentration analysis.
- the solution analysis system according to the second aspectis a solution analysis method using both the electrical impedance method and the near infrared spectroscopy.
- the solution analysis systembasically has the same configuration as the first aspect except that the measurement point in the first aspect includes a wavelength in the near-infrared spectroscopy in addition to the frequency in the electrical impedance method. Unless otherwise specified, the description of the first aspect can be incorporated.
- FIG. 17is a functional block diagram showing an example of the solution analysis system according to the second aspect.
- the solution analysis systemincludes an electrical impedance measurement device 1, a near infrared spectroscopy measurement device 2, and a control unit 3.
- the near-infrared spectrometer 2is a device that performs measurement by near-infrared spectroscopy, and is configured to measure absorbance while changing the wavelength of light applied to the solution.
- the near-infrared spectrometer 2includes a detection unit 21 and an input / output unit 22.
- the detection unit 21detects the measured data
- the input / output unit 22inputs and outputs data between the near-infrared spectrometer 2 and the control unit 3.
- the measurement point determination unit 31 of the control unit 3determines the measurement points related to the measurement by the electrical impedance measurement device 1 and the near infrared spectroscopy measurement device 2.
- the measurement point determination unit 31determines the measurement frequency in the electrical impedance measurement and the measurement wavelength in the near infrared spectroscopy measurement.
- the input / output unit 35inputs / outputs data between the control unit 3 and the electrical impedance measurement device 1 and between the control unit 3 and the near-infrared spectroscopy measurement device 2.
- the electrical impedance measuring apparatus 1measures a known solution having a known phosphorus-containing ion concentration by the electrical impedance method, and acquires frequency-resistance characteristic data (S10).
- the near-infrared spectrometer 2measures the known solution by near-infrared spectroscopy.
- the absorbanceis measured while changing the wavelength of light applied to the unknown solution, and wavelength-absorbance spectrum data is obtained.
- the acquired wavelength-absorbance spectrum dataincludes a plurality (M points) of wavelengths ⁇ L + 1 to ⁇ L + M, and a plurality of absorbances X L + 1 to X L + M measured at each of the plurality of wavelengths ⁇ L + 1 to ⁇ L + M.
- Mis set to 10 or more and 1000 or less.
- the measurementis performed by changing the wavelength within the range of visible light-near infrared light, preferably within the range of 300 nm to 1200 nm.
- each of ⁇ L + 1 to ⁇ L + Mis assigned to a predetermined wavelength within this range.
- the measurement wavelength range and assignmentare set by the measurement point determination unit 31 of the control unit 3.
- the frequency-resistance characteristic data and the wavelength-absorbance spectrum datamay be data obtained by subjecting the measured data to a process such as a secondary differentiation process or a smoothing process.
- the acquired frequency-resistance characteristic data and wavelength-absorbance spectrum dataare input to the control unit 3.
- the controller 3performs multivariate analysis on the acquired frequency-resistance characteristic data and the wavelength-absorbance spectrum data, and determines a plurality of constants corresponding to each measurement point of frequency and wavelength (S11).
- the calibration model according to the second aspectcan be expressed by the following equation, for example.
- Y Pis the concentration of free phosphorus ions unknown solution
- the alpha P frequency -a term corresponding to the resistance characteristic data
- beta P wavelength -a term corresponding to the absorbance spectrum data.
- ⁇ Pis the same as the component constituting the calibration model of the first aspect, and can be expressed as the following equation.
- X 1 to X Lare resistances measured at frequencies f 1 to f L , respectively, and A P1 to A PL are constants corresponding to the frequencies f 1 to f L , respectively.
- ⁇ Pcan be expressed as the following formula.
- ⁇ PA PL + 1 X L + 1 + A PL + 2 X L + 2 + A PL + 3 X L + 3 +... + A PL + M X L + M
- X L + 1 to X L + Mare absorbances measured at wavelengths ⁇ L + 1 to ⁇ L + M
- a PL + 1 to A PL + Mare constants corresponding to the wavelengths ⁇ L + 1 to ⁇ L + M , respectively.
- FIG. 18shows an example of the preliminary data table.
- the determined constantsA P1 , A P2 , A P3 ... A PL + 1 , A PL + 2 , A PL + 3.
- Wavelengthf 1 , f 2 , f 3 ... ⁇ L + 1 , ⁇ L + 2 , ⁇ L + 3 .
- control unitselects a characteristic constant specific to the specific ion species among the determined constants (S12).
- FIG. 19is a plot showing the relationship between each measurement point of frequency and wavelength and the value of the regression coefficient.
- frequencies and wavelengths that are different physical quantitiesare arranged on one axis (same axis), and the value of the regression coefficient is evaluated.
- regression coefficientshowing a large value in the positive and negative directions (regression coefficient having a large absolute value), and constants corresponding to measurement points of these regression coefficients are specific to the ion species. Can be preferentially selected as a characteristic constant.
- FIG. 20shows an example of a constant selection data table.
- ...are associated with corresponding measurement points (frequency and wavelength) f 1 , f 2 , f 3 ... ⁇ L + 1 , ⁇ L + 2 , ⁇ L + 3. It has been.
- FIG. 21shows an example of an analysis data table composed of constants selected based on the constant selection data table.
- the selected constantsA P1 , A P3 , A P5 ... A PL + 2 , A PL + 4 , A PL + 7.
- the analysis data tableis stored in the storage unit 36 (S13).
- the total number L + M of constants before selectioncan be narrowed down to, for example, 10% to 90% by selecting constants.
- the number of constants after selectioncan be set to, for example, 5 or more and 500 or less.
- the selection of the constant in the second modecan be performed by selecting a constant from one set of a constant corresponding to the measurement point related to the frequency and a constant corresponding to the measurement point related to the wavelength.
- selecting a constant from a set of constants corresponding to measurement points related to the frequencyselecting a constant from a set of constants corresponding to the measurement points related to the wavelength, and then individually The selected constants may be combined to be the selected constant.
- control unit 3reads an analysis data table including constant-frequency correspondence information and constant-wavelength correspondence information stored in the storage unit 36 (S30).
- the electrical impedance measurement apparatus 1uses an electrical impedance method at each measurement point of the frequency and wavelength corresponding to the selected constant in the read analysis data table for an unknown solution in which the concentration of the specific ion species is unknown. Measurement of resistance by NIR and absorbance measurement by near infrared spectroscopy are performed to obtain measurement data and input it to the control unit 3 (S31)
- the measurement point determination unit 31 of the control unit 3performs the measurement at the measurement point of the frequency corresponding to the selected constant, and omits the measurement at the other measurement points and the electrical impedance measurement device 1 and the near red.
- the measurement in the outer spectroscopic measurement device 2can be controlled.
- the concentration calculation unit 34 of the control unit 3calculates the concentration of phosphorus-containing ions in the unknown solution based on the input measurement data of the unknown solution and the selected constant in the read analysis data table ( S32).
- the control unit 3can display the calculated phosphorus-containing ion concentration on an image display device (not shown) (S33).
- the frequency-resistance characteristics acquired for the known solution and the unknown solutionmay have been subjected to standard normalization processing (also referred to as SNV (Standard Normal Variate) processing) that subtracts the frequency-resistance characteristics of pure water.
- standard normalization processingalso referred to as SNV (Standard Normal Variate) processing
- the specific ion species to be analyzedis not particularly limited, but nitrogen-containing ions (nitrate ions; NO 3 ⁇ , nitrite ions; NO 2 ⁇ , ammonium ions; NH 4 + ), phosphorus-containing ions (phosphates)
- nitrogen-containing ionsnitrate ions; NO 3 ⁇ , nitrite ions; NO 2 ⁇ , ammonium ions; NH 4 +
- phosphorus-containing ionsphosphates
- Preferable examplesinclude ions; PO 4 3 ⁇ ) and potassium ions (K + ).
- the unknown solution to be analyzedis not particularly limited, but is preferably organic waste, for example.
- organic wastea methane fermentation digestive liquid etc. can be mentioned preferably, for example.
- control unithas shown the case where the concentration of the specific ion species is displayed on the image display device.
- concentration of the specific ion speciesis displayed on the image display device.
- present inventionis not limited to this.
- the control unitcan be configured to control operations of other devices connected to the control unit based on the concentration of the specific ion species.
- the unit of concentration in the analysisis not particularly limited. For example, mol / l (number of moles / volume), mg / kg (weight / weight), mg / l (weight / volume), etc. ), Any unit combining physical quantities such as volume (volume) can be used. That is, the constant may be determined according to the unit to be used.
Landscapes
- Physics & Mathematics (AREA)
- Chemical & Material Sciences (AREA)
- Analytical Chemistry (AREA)
- Health & Medical Sciences (AREA)
- Life Sciences & Earth Sciences (AREA)
- Biochemistry (AREA)
- General Health & Medical Sciences (AREA)
- General Physics & Mathematics (AREA)
- Immunology (AREA)
- Pathology (AREA)
- Spectroscopy & Molecular Physics (AREA)
- Electrochemistry (AREA)
- Chemical Kinetics & Catalysis (AREA)
- Investigating Or Analyzing Materials By The Use Of Electric Means (AREA)
- Investigating Or Analysing Materials By Optical Means (AREA)
Abstract
Description
Translated fromJapanese本発明は、溶液分析システムに関し、より詳しくは、簡易且つ迅速に実施でき、連続的なモニタリングが可能であり、且つ複数種のイオン濃度を個別に分析できる溶液分析システムに関する。The present invention relates to a solution analysis system, and more particularly, to a solution analysis system that can be easily and quickly implemented, can be continuously monitored, and can individually analyze a plurality of types of ion concentrations.
昨今、様々な分野で溶液の成分含有量を把握する需要があり、種々の方法によって溶液の成分濃度の測定が行われている。
特に、イオン濃度の測定は、植物栽培養液等を初めとする農業分野や、メッキ、洗浄廃液等を管理する工業分野でも日常的に行われている。Recently, there is a demand for grasping the component content of a solution in various fields, and the component concentration of the solution is measured by various methods.
In particular, the measurement of ion concentration is routinely performed in the agricultural field including plant culture nutrient solutions and the industrial field where plating and cleaning waste liquids are managed.
例えば、農業分野では、メタン発酵消化液等のような有機系廃棄物を液肥等として使用する場合には、この廃液中のイオン種やイオン濃度を分析することが望まれ、リン酸イオン濃度を分析する方法として、JIS工業規格にも採用されているモリブデンブルー法が用いられてきた(特許文献1)。For example, in the agricultural field, when organic waste such as methane fermentation digestive juice is used as liquid fertilizer, etc., it is desirable to analyze the ion species and ion concentration in the waste liquid, and to reduce the phosphate ion concentration. As a method for analysis, the molybdenum blue method, which is also adopted in JIS industrial standards, has been used (Patent Document 1).
モリブデンブルー法のような化学分析は、試薬の添加等が必要なため工程が複雑であり、結果を得るまでに長時間を要するため、連続的なモニタリングは困難である。Chemical analysis such as the molybdenum blue method is complicated because it requires the addition of reagents and the like, and it takes a long time to obtain results, so continuous monitoring is difficult.
また、イオンクロマトグラフィーを用いたカラムから流出させてイオン種を個別に分離してから、電気伝導度によりイオン濃度を測定する方法もあるが、固形物(有機物)等の影響を避けるためにフィルターによる除去、分解の前準備が必要であり、簡易且つ迅速に測定ができない問題点があった。In addition, there is a method of measuring ion concentration by electric conductivity after separating ion species by flowing out from a column using ion chromatography, but in order to avoid the influence of solid matter (organic matter), etc. Removal and disassembly by preparation are necessary, and there is a problem that measurement cannot be performed easily and quickly.
さらに、電気伝導度によるイオン濃度の測定は、従来、単独の化合物による溶液内のイオンについてのみ可能であった。食塩の塩分濃度測定などがその一例であるが、複数の化合物が存在している場合には、各種のイオン濃度を個別に測定することができていないのが現状である。Furthermore, the measurement of ion concentration by electric conductivity has been possible only for ions in a solution of a single compound. One example is the measurement of salt concentration of sodium chloride. However, when a plurality of compounds are present, various ion concentrations cannot be measured individually.
そこで、本発明の課題は、簡易且つ迅速に実施でき、連続的なモニタリングが可能であり、且つ複数種のイオン濃度を個別に分析できる溶液分析システムを提供することにある。Therefore, an object of the present invention is to provide a solution analysis system that can be carried out simply and quickly, can be continuously monitored, and can individually analyze a plurality of types of ion concentrations.
また本発明の他の課題は、以下の記載によって明らかとなる。Further, other problems of the present invention will become apparent from the following description.
上記課題は、以下の各発明によって解決される。
1.
電気インピーダンス測定装置と、該電気インピーダンス測定装置に接続された制御部とを備え、
前記電気インピーダンス測定装置の検知部において、特定イオン種の濃度が既知である
既知溶液について、電気インピーダンス法により周波数-抵抗特性データを検知し、前記電気インピーダンス測定装置の入出力部を介して前記制御部に入力し、
前記制御部は、入力された前記周波数-抵抗特性データを多変量解析して、周波数の測定点に対応する複数の定数を決定し、
次いで、決定された前記複数の定数のうち、特定イオン種固有の特徴的な定数を選択し、
次いで、選択した前記定数と前記定数に対応する前記周波数とを定数-周波数対応情報として記憶部に記憶し、
前記定数-周波数対応情報のうちの前記周波数に基づき、前記電気インピーダンス測定装置の検知部において、特定イオン種の濃度が未知である未知溶液について、電気インピーダンス法による抵抗測定を行って測定データを検知し、前記電気インピーダンス測定装置の入出力部を介して前記制御部に入力し、
前記制御部は、入力された前記測定データと前記定数-周波数対応情報のうちの前記定数とに基づき、前記未知溶液における特定イオン種の濃度を算出することを特徴とする溶液分析システム。
2.
電気インピーダンス測定装置と、近赤外分光測定装置と、該電気インピーダンス測定装置及び該近赤外分光測定装置に接続された制御部とを備え、
前記電気インピーダンス測定装置及び前記近赤外分光測定装置のそれぞれの検知部において、特定イオン種の濃度が既知である既知溶液について、電気インピーダンス法により周波数-抵抗特性データと、近赤外分光法により測定された波長-吸光度スペクトルデータとを検知し、前記電気インピーダンス測定装置及び前記近赤外分光測定装置のそれぞれの入出力部を介して前記制御部に入力し、
前記制御部は、入力された前記周波数-抵抗特性データ及び前記波長-吸光度スペクトルデータを多変量解析して、周波数及び波長の測定点に対応する複数の定数を決定し、
次いで、決定された前記複数の定数のうち、特定イオン種固有の特徴的な定数を選択し、
次いで、選択した前記定数と前記定数に対応する前記周波数とを定数-周波数対応情報、及び選択した前記定数と前記定数に対応する前記波長とを定数-波長対応情報としてそれぞれ記憶部に記憶し、
前記定数-周波数対応情報及び前記定数-波長対応情報のうちの前記周波数及び前記波長に基づき、前記電気インピーダンス測定装置及び前記近赤外分光測定装置のそれぞれの検知部において、特定イオン種の濃度が未知である未知溶液について、電気インピーダンス法による抵抗測定及び近赤外分光法による吸光度測定を行ってそれぞれ測定データを検知し、前記電気インピーダンス測定装置及び前記近赤外分光測定装置のそれぞれの入出力部を介して前記制御部に入力し、
前記制御部は、入力された前記測定データと前記定数-周波数対応情報及び前記定数-波長対応情報のうちの前記定数とに基づき、前記未知溶液における特定イオン種の濃度を算出することを特徴とする溶液分析システム。
3.
前記制御部は、前記特定イオン種固有の特徴的な定数の選択に際して、回帰係数の絶対値が大きい測定点に対応する定数を優先的に選択することを特徴とする前記1又は2記載の溶液分析システム。
4.
前記制御部は、前記特定イオン種固有の特徴的な定数の選択に際して、所定の分析精度に応じて選択する前記定数の個数又はパーセンテージを決定することを特徴とする前記1~3の何れかに記載の溶液分析システム。The above problems are solved by the following inventions.
1.
An electrical impedance measuring device, and a control unit connected to the electrical impedance measuring device,
In the detection unit of the electrical impedance measurement device, frequency-resistance characteristic data is detected by an electrical impedance method for a known solution whose concentration of the specific ion species is known, and the control is performed via the input / output unit of the electrical impedance measurement device. Enter
The control unit performs multivariate analysis on the input frequency-resistance characteristic data to determine a plurality of constants corresponding to frequency measurement points,
Next, a characteristic constant specific to a specific ion species is selected from the plurality of determined constants,
Next, the selected constant and the frequency corresponding to the constant are stored in the storage unit as constant-frequency correspondence information,
Based on the frequency in the constant-frequency correspondence information, the detection unit of the electrical impedance measurement device detects the measurement data by performing resistance measurement using an electrical impedance method for an unknown solution whose concentration of the specific ion species is unknown. And input to the control unit via the input / output unit of the electrical impedance measuring device,
The control unit calculates a concentration of a specific ion species in the unknown solution based on the input measurement data and the constant of the constant-frequency correspondence information.
2.
An electrical impedance measuring device, a near-infrared spectrometer, and a control unit connected to the electrical impedance measuring device and the near-infrared spectrometer,
In each of the detection units of the electrical impedance measurement device and the near-infrared spectroscopy measurement device, a known solution having a known concentration of a specific ion species is subjected to frequency-resistance characteristic data by an electrical impedance method and near-infrared spectroscopy. The measured wavelength-absorbance spectrum data is detected and input to the control unit via the input / output units of the electrical impedance measurement device and the near-infrared spectroscopy measurement device,
The controller performs multivariate analysis on the input frequency-resistance characteristic data and the wavelength-absorbance spectrum data, and determines a plurality of constants corresponding to frequency and wavelength measurement points,
Next, a characteristic constant specific to a specific ion species is selected from the plurality of determined constants,
Then, the selected constant and the frequency corresponding to the constant are stored in a storage unit as constant-frequency correspondence information, and the selected constant and the wavelength corresponding to the constant are stored in a storage unit, respectively.
Based on the frequency and the wavelength of the constant-frequency correspondence information and the constant-wavelength correspondence information, the concentration of the specific ion species is determined in each detection unit of the electrical impedance measurement device and the near-infrared spectroscopy measurement device. For unknown solutions that are unknown, resistance measurement by the electrical impedance method and absorbance measurement by the near infrared spectroscopy are performed to detect the measurement data, and each input / output of the electrical impedance measurement device and the near infrared spectroscopy measurement device To the control unit via the unit,
The control unit calculates a concentration of a specific ion species in the unknown solution based on the input measurement data and the constant of the constant-frequency correspondence information and the constant-wavelength correspondence information. Solution analysis system.
3.
3. The solution according to 1 or 2, wherein the control unit preferentially selects a constant corresponding to a measurement point having a large absolute value of a regression coefficient when selecting a characteristic constant specific to the specific ion species. Analysis system.
4).
The control unit may determine the number or percentage of the constants to be selected according to a predetermined analysis accuracy when selecting the characteristic constants specific to the specific ion species. The solution analysis system described.
本発明によれば、簡易且つ迅速に実施でき、連続的なモニタリングが可能であり、且つ
複数種のイオン濃度を個別に分析できる溶液分析システムを提供することができる。According to the present invention, it is possible to provide a solution analysis system that can be carried out simply and quickly, can be continuously monitored, and can individually analyze a plurality of types of ion concentrations.
以下に、図面を参照して本発明を実施するための形態について説明する。Hereinafter, embodiments for carrying out the present invention will be described with reference to the drawings.
本発明の第1態様は電気インピーダンス法を用いた溶液分析システムであり、第2態様は電気インピーダンス法と近赤外分光法を併用した溶液分析システムである。以下に、まず第1態様について説明し、次いで第2態様について説明する。The first aspect of the present invention is a solution analysis system using the electrical impedance method, and the second aspect is a solution analysis system using both the electrical impedance method and near infrared spectroscopy. Below, a 1st aspect is demonstrated first and then a 2nd aspect is demonstrated.
1.第1態様
図1は、第1態様に係る溶液分析システムの一例を示す機能ブロック図である。1. 1st aspect FIG. 1: is a functional block diagram which shows an example of the solution analysis system which concerns on a 1st aspect.
図1に示すように、溶液分析システムは、電気インピーダンス測定装置1と、該電気インピーダンス測定装置1に接続された制御部3により構成されている。As shown in FIG. 1, the solution analysis system includes an electrical impedance measuring
電気インピーダンス測定装置1は、電気インピーダンス測定を行う装置であり、溶液に印加する交流電圧の周波数を変化させながら抵抗(インピーダンスともいう)を測定するように構成されている。The electrical
電気インピーダンス測定装置1は、検知部11と入出力部12とを備えている。検知部11は測定されたデータを検知し、入出力部12は電気インピーダンス測定装置1と制御部3との間でデータの入出力を行う。The electrical impedance measuring
制御部3は、測定点決定部31、定数決定部32、定数選択部33、濃度算出部34、入出力部35及び記憶部36を備えている。The
測定点決定部31は、電気インピーダンス測定装置1による測定に係る測定点、例えば、電気インピーダンス測定における測定周波数を決定する。定数決定部32は、未知溶液における特定イオン種の濃度を算出するための検量モデルを構成する複数の定数を決定する。定数選択部33は、決定された複数の定数から一部又は全部の定数を選択する。濃度算出部34は、未知溶液における特定イオン種の濃度を算出する。入出力部35は、制御部3と電気インピーダンス測定装置1との間で、データの入出力を行う。記憶部36は、定数等のデータを記憶する。The measurement
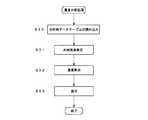
溶液分析システムは、登録処理及び濃度分析処理を含む。以下、各処理について説明する。The solution analysis system includes registration processing and concentration analysis processing. Hereinafter, each process will be described.
(1-1)登録処理
以下に、登録処理の例を図2に基づいて説明する。(1-1) Registration Process An example of the registration process will be described below with reference to FIG.
なお、以下の説明では、一例として、分析対象である特定イオン種が含窒素イオンである場合について主に説明する。In the following description, the case where the specific ion species to be analyzed is a nitrogen-containing ion will be mainly described as an example.
まず、含窒素イオンの濃度が既知である既知溶液を用意する。既知溶液を新規に調製する場合は、窒素化合物の配合量から含窒素イオンの濃度を決定し、既知とする。あるいは、任意の採取源からサンプリングされた既知溶液を用いる場合は、イオンクロマトグラフィー等の別法によって含窒素イオンの濃度を決定し、既知とする。First, a known solution with a known concentration of nitrogen-containing ions is prepared. When a known solution is newly prepared, the concentration of nitrogen-containing ions is determined from the blending amount of the nitrogen compound and is known. Or when using the known solution sampled from arbitrary collection sources, the density | concentration of nitrogen-containing ion is determined by another methods, such as ion chromatography, and it is made known.
電気インピーダンス測定装置1は、かかる既知溶液について、電気インピーダンス法により測定を行う。ここでは、未知溶液に印加する交流電圧の周波数を変化させながら抵抗(インピーダンスともいう)を測定し、周波数-抵抗特性データを取得する(S10)。The electrical
取得される周波数-抵抗特性データは、複数(L点)の周波数f1~fLと、これら複数の周波数f1~fLのそれぞれにおいて測定された複数の抵抗X1~XLと、測定に供した既知溶液における含窒素イオンの濃度とからなるデータを含んでいる。Lは例えば10以上1000以下に設定される。The acquired frequency-resistance characteristic data includes a plurality of (point L) frequencies f1 to fL , a plurality of resistances X1 to XL measured at each of the plurality of frequencies f1 to fL , and measurement Data including the concentration of nitrogen-containing ions in the known solution subjected to the above. L is set to, for example, 10 or more and 1000 or less.
例えば、周波数を100Hz~2000Hzの範囲内で変化させて測定することが好ましく、このとき、f1~fLは各々この範囲内の所定の周波数に割り当てられる。測定周波数の範囲及び割り当ての設定は、制御部3の測定点決定部31により行う。For example, it is preferable to measure by changing the frequency within a range of 100 Hz to 2000 Hz, and at this time, f1 to fL are respectively assigned to predetermined frequencies within this range. The measurement frequency range and assignment are set by the measurement
既知溶液として特定イオン種の濃度を互いに異ならせたものを複数用意し、これら複数の既知溶液について上述した測定を行い、周波数-抵抗特性データを複数取得する。また、既知溶液として、含窒素イオンの他に、他のイオン種を含むものを用いることもできる。A plurality of known solutions having different concentrations of specific ion species are prepared, and the above-described measurement is performed on the plurality of known solutions to obtain a plurality of frequency-resistance characteristic data. In addition to the nitrogen-containing ions, those containing other ionic species can also be used as the known solution.
周波数-抵抗特性データは、それぞれ、測定されたデータに2次微分処理やスムージング処理等の処理を施して得られたデータであってもよい。The frequency-resistance characteristic data may be data obtained by subjecting the measured data to a process such as a secondary differentiation process or a smoothing process.
取得された周波数-抵抗特性データは、制御部3に入力される。The acquired frequency-resistance characteristic data is input to the
制御部3は、取得した周波数-抵抗特性データを多変量解析して、周波数の各測定点に対応する複数の定数を決定する(S11)。The
定数というのは、未知溶液における特定イオン種の濃度を算出するための検量モデルを構成する定数である。The constant is a constant constituting a calibration model for calculating the concentration of a specific ion species in an unknown solution.
特定イオン種として含窒素イオンの濃度を算出するための検量モデルは、例えば下記式のように表すことができる。A calibration model for calculating the concentration of nitrogen-containing ions as the specific ion species can be expressed, for example, by the following equation.
YN=AN1X1+AN2X2+AN3X3+・・・+ANLXLYN = AN1 X1 + AN2 X2 + AN3 X3 +... + ANL XL
ここで、YNは未知溶液の含窒素イオンの濃度であり、X1~XLは周波数f1~fLのそれぞれにおいて測定された抵抗であり、AN1~ANLは周波数f1~fLのそれぞれに対応する定数である。 Here, YN is the concentration of nitrogen-containing ions in the unknown solution, X1 to XL are resistances measured at frequencies f1 to fL , and AN1 to ANL are frequencies f1 to f It is a constant corresponding to each ofL.
これら定数の決定は、既知溶液について取得された周波数-抵抗特性データを多変量解析して決定することができる。These constants can be determined by multivariate analysis of the frequency-resistance characteristic data obtained for the known solution.
多変量解析は、制御部3の定数決定部32により行うことができる。多変量解析を実行するソフトウェアは、市販品として入手することができる。Multivariate analysis can be performed by the
このようにして、周波数の測定点に対応する複数の定数を決定することができる。決定された複数の定数は、対応する測定点と関連付けられた予備データテーブルとして記憶部36に保存することができる。In this way, a plurality of constants corresponding to the frequency measurement points can be determined. The plurality of determined constants can be stored in the
図3は予備データテーブルの一例を示している。図3に示されるように、予備データテーブルにおいて、決定された複数の定数AN1、AN2、AN3・・・は、それぞれに対応する測定点(周波数)f1、f2、f3・・・と関連付けられている。FIG. 3 shows an example of the preliminary data table. As shown in FIG. 3, in the preliminary data table, a plurality of determined constants AN1 , AN2 , AN3 ...Are measured points (frequencies) f1 , f2 , f3. • is associated with
次いで、制御部3は、決定された複数の定数のうち、特定イオン種固有の特徴的な定数を選択する(S12)。Next, the
以下に、定数の選択を実行するための定数選択処理の例について、図4に基づいて詳しく説明する。Hereinafter, an example of constant selection processing for executing constant selection will be described in detail with reference to FIG.
まず、制御部3の定数選択部33は、上述した予備データテーブルの各測定点(周波数)f1、f2、f3・・・に対応する複数の回帰係数を絶対値化する(S20)。First, the
回帰係数を用いるのは、定数を選択する際に、特定イオン種固有の特徴的な定数を選択するためである。これについて、図5~図7を参照して説明する。The reason why the regression coefficient is used is to select characteristic constants specific to specific ion species when selecting constants. This will be described with reference to FIGS.
図5~図7は、それぞれ測定点と回帰係数の値の関係を示すプロットであり、図5は含窒素イオンの場合、図6は含リンイオンの場合、図7はカリウムイオンの場合である。5 to 7 are plots showing the relationship between the measurement point and the value of the regression coefficient. FIG. 5 shows the case of nitrogen-containing ions, FIG. 6 shows the case of phosphorus ions, and FIG. 7 shows the case of potassium ions.
各プロットからわかるように、回帰係数の値は測定点によって正負方向に変動している。また、その変動の様子は、イオン種ごとに異なっており、イオン種固有の特徴が見出される。As can be seen from each plot, the value of the regression coefficient varies in the positive and negative directions depending on the measurement point. Moreover, the state of the variation differs for each ion species, and a characteristic peculiar to the ion species is found.
ここで、回帰係数が正負方向に大きい値を示す測定点(周波数)に対応する定数を、特定イオン種固有の特徴的な定数として選択することができる。そのため、各回帰係数の絶対値を求め、回帰係数の絶対値の大きい測定点に対応する定数を特徴的な定数として優先的に選択する。Here, a constant corresponding to a measurement point (frequency) where the regression coefficient shows a large value in the positive and negative directions can be selected as a characteristic constant unique to the specific ion species. Therefore, the absolute value of each regression coefficient is obtained, and a constant corresponding to a measurement point having a large absolute value of the regression coefficient is preferentially selected as a characteristic constant.
絶対値化された回帰係数は、対応する測定点と関連付けられた定数選択用データテーブルとして記憶部36に保存する。The regression coefficient converted to an absolute value is stored in the
図8は定数選択用データテーブルの一例を示している。図8に示されるように、定数選択用データテーブルにおいて、絶対値化された複数の回帰係数|A’N1|、|A’N2|、|A’N3|・・・は、それぞれ対応する測定点(周波数)f1、f2、f3と関連付けられている。ここで、A’N1、A’N2、A’N3・・・は、それぞれ周波数f1、f2、f3・・・に対応する回帰係数であり、|A’N1|、|A’N2|、|A’N3|・・・は絶対値化された回帰係数である。FIG. 8 shows an example of a constant selection data table. As shown in FIG. 8, in the constant selection data table, a plurality of absolute regression coefficients | A ′N1 |, | A ′N2 |, | A ′N3 | It is associated with points (frequency) f1 , f2 , f3 . Here, A ′N1 , A ′N2 , A ′N3 ...Are regression coefficients corresponding to the frequencies f1 , f2 , f3 , respectively, and | A ′N1 |, | A ′N2 |, | A ′N3 |...Are regression coefficients converted into absolute values.
制御部3は、例えば定数選択用データテーブルを回帰係数の絶対値の大きい順にソートし、回帰係数の絶対値の大きい測定点に対応する定数から優先的に選択する(S21)。例えば、定数の総数Lの60%を選択する場合は、回帰係数の絶対値が大きい方から0.6×L個の測定点に対応する定数を選択する。The
これにより、定数選択処理が終了したことになる。This completes the constant selection process.
次いで、制御部3は、選択した定数と該定数に対応する周波数とからなる「定数-周波数対応情報」を含む分析用データテーブルを記憶部36に記憶する(S13)。Next, the
これにより、登録処理が終了したことになる。This completes the registration process.
図9は分析用データテーブルの一例を示している。図9に示されるように、分析用データテーブルにおいて、選択された定数AN2、AN3、AN7・・・は、それぞれ対応する測定点(周波数)f2、f3、f7と関連付けられている。FIG. 9 shows an example of the analysis data table. As shown in FIG. 9, in the analysis data table, the selected constants AN2 , AN3 , AN7 ...Are associated with the corresponding measurement points (frequencies) f2 , f3 , f7 , respectively. ing.
分析用データテーブルに基づいて再構成された検量モデルは、下記式で表すことができる。The calibration model reconstructed based on the analysis data table can be expressed by the following equation.
YN=AN2X2+AN3X3+AN7X7・・・YN = AN2 X2 + AN3 X3 + AN7 X7 ...
定数の総数Lの60%を選択した場合、上記式における定数Aと測定値Xの積からなる項の数はL個から0.6×L個に減少する。この場合、濃度YNを求めるためには、0.6×L個の測定点で測定を行えばよい。When 60% of the total number L of constants is selected, the number of terms consisting of the product of the constant A and the measured value X in the above formula is reduced from L to 0.6 × L. In this case, in order to determine the concentration YN may be carried out measurements at 0.6 × L number of measurement points.
これにより、定数選択前の予備データテーブルに基づく検量モデルを用いる際に必要であったL個の測定点を60%に減じることができ、分析を迅速化できる。This makes it possible to reduce the L measurement points required when using the calibration model based on the preliminary data table before the constant selection to 60%, thereby speeding up the analysis.
定数選択処理の他の例として、例えば、回帰係数の絶対値が任意の閾値以上の測定点に対応する定数を選択することもできる。任意の閾値としては、例えば、各回帰係数の絶対値の平均値あるいは最大値などに任意の値nを掛けた値等を設定できる。閾値(あるいは任意の値n)は、選択したい定数の個数又はパーセンテージに合わせて設定できる。As another example of the constant selection process, for example, a constant corresponding to a measurement point having an absolute value of a regression coefficient equal to or larger than an arbitrary threshold value can be selected. As an arbitrary threshold value, for example, a value obtained by multiplying an average value or maximum value of absolute values of the regression coefficients by an arbitrary value n can be set. The threshold (or any value n) can be set according to the number or percentage of constants to be selected.
定数選択によって、選択前の定数の総数Lを例えば10%~90%に絞り込むことができる。また、選択後の定数の個数は、例えば5以上500以下にすることができる。定 数 By selecting constants, the total number L of constants before selection can be narrowed down to, for example, 10% to 90%. The number of constants after selection can be set to, for example, 5 or more and 500 or less.
定数選択部33は、所定の分析精度に応じて選択する定数の個数又はパーセンテージを決定することが好ましい。選択された定数の個数又はパーセンテージの異なる複数の分析用データテーブルを保存することも好ましいことである。一例として、選択する定数の個数又はパーセンテージが比較的大きい測定精度優先の分析用データテーブルと、選択する定数の個数又はパーセンテージが比較的小さい迅速性優先の分析用データテーブルとを保存することが好ましい。また、分析用データテーブルとして、予備データテーブルにおける定数の全てを選択したものが含まれてもよい。The
(1-2)濃度分析処理
次に、濃度分析処理の例について図10に基づいて説明する。(1-2) Concentration Analysis Processing Next, an example of concentration analysis processing will be described with reference to FIG.
まず、制御部3は、記憶部36に保存された、定数-周波数対応情報を含む分析用データテーブルを読み込む(S30)。First, the
複数の分析用データテーブルが保存されている場合、制御部3は、これらの中から測定に用いる分析用データテーブルを選択可能に構成することができる。分析用データテーブルを所望する分析精度に応じて選択可能に構成することは好ましいことである。When a plurality of analysis data tables are stored, the
電気インピーダンス測定装置1は、特定イオン種の濃度が未知である未知溶液について、選択された定数に対応する周波数の測定点で、電気インピーダンス法による抵抗測定を行って測定データを取得して制御部3に入力する(S31)The electrical
このとき、制御部3の測定点決定部31は、選択された定数に対応する周波数の測定点において測定を行い、他の測定点における測定を省略するように、電気インピーダンス測定装置1における測定を制御することができる。At this time, the measurement
制御部3の濃度算出部34は、入力された未知溶液の測定データと、選択された定数とに基づいて、未知溶液における含窒素イオンの濃度を算出する(S32)。The
制御部3は、算出された含窒素イオンの濃度を図示しない画像表示装置に表示することができる(S33)。The
これにより、濃度分析処理が終了したことになる。This completes the concentration analysis process.
かかる溶液分析システムによれば、試薬の添加等が不要となるため簡易且つ迅速に実施でき、短時間で結果が得られるため連続的なモニタリングを好適に実現できる効果が得られる。According to such a solution analysis system, the addition of a reagent or the like is not required, so that it can be carried out easily and quickly, and the result can be obtained in a short time, so that an effect of suitably realizing continuous monitoring can be obtained.
以上の説明では、分析対象である特定イオン種が含窒素イオンである場合について主に説明したが、これに限定されるものではない。他の種々のイオン種についても含窒素イオンと同様に分析することができる。In the above description, the case where the specific ion species to be analyzed is a nitrogen-containing ion has been mainly described, but the present invention is not limited to this. Other various ionic species can be analyzed in the same manner as nitrogen-containing ions.
例えば、特定イオン種として含リンイオンの濃度を算出するための検量モデルは、例えば下記式のように表すことができる。For example, a calibration model for calculating the concentration of phosphorus-containing ions as the specific ion species can be represented by the following equation, for example.
YP=AP1X1+AP2X2+AP3X3+・・・+APLXLYP = AP1 X1 + AP2 X2 + AP3 X3 +... + APL XL
ここで、YPは未知溶液の含リンイオンの濃度であり、X1~XLは周波数f1~fLのそれぞれにおいて測定された抵抗であり、AP1~APLは周波数f1~fLのそれぞれに対応する定数である。 Here,Y P is the concentration of free phosphorus ions unknownsolution,X 1 ~ XL is the measured resistance in the respective frequencyf 1 ~ f L, A P1 ~ A
検量モデルの定数が決定されれば、未知溶液について測定された測定データX1~XLを該検量モデルに代入して、未知溶液の含リンイオンの濃度YPを算出することができる。If constant calibration model is determined, it can be substituted on the detected quantity model the measured data X1 ~ XL measured for an unknown solution, to calculate the concentration YP-containing phosphorus unknown solution.
また、特定イオン種としてカリウムイオンの濃度を算出するための検量モデルは、例えば下記式のように表すことができる。Also, a calibration model for calculating the concentration of potassium ions as the specific ion species can be expressed, for example, by the following equation.
YK=AK1X1+AK2X2+AK3X3+・・・+AKLXLYK = AK1 X1 + AK2 X2 + AK3 X3 +... + AKL XL
ここで、YKは未知溶液のカリウムイオンの濃度であり、X1~XLは周波数f1~fLのそれぞれにおいて測定された抵抗であり、AK1~AKLは周波数f1~fLのそれぞれに対応する定数である。 Here, YK is the concentration of potassium ions in the unknown solution, X1 to XL are resistances measured at frequencies f1 to fL , and AK1 to AKL are frequencies f1 to fL. Is a constant corresponding to each of.
即ち、他のイオン種の場合も、含窒素イオンの場合と同様の検量モデルを構成することができ、含窒素イオンの場合と同様に定数選択を行って検量モデルを再構成できる。That is, in the case of other ion species, a calibration model similar to that in the case of nitrogen-containing ions can be configured, and the calibration model can be reconfigured by selecting constants as in the case of nitrogen-containing ions.
図5~図7に示したように、イオン種によって検量モデルを構成する各定数の値が異なるため、イオン種ごとの濃度を決定することが可能になる。即ち、未知溶液について測定された測定データX1~XLを含窒素イオン用の検量モデルに代入すれば含窒素イオンの濃度が算出される。同じ測定データX1~XLを、含リンイオン用の検量モデルに代入すれば含リンイオンの濃度が算出され、カリウムイオン用の検量モデルに代入すればカリウムイオンの濃度が算出される。As shown in FIGS. 5 to 7, since the values of the constants constituting the calibration model differ depending on the ion species, it is possible to determine the concentration for each ion species. That is, the concentration of the nitrogen-containing ions is calculated by substituting the measured data X1 ~ XL measured for an unknown solution in the calibration model for the nitrogen-containing ion. By substituting the same measurement data X1 to XL into a calibration model for phosphorus ions, the concentration of phosphorus ions is calculated, and when substituted into a calibration model for potassium ions, the concentration of potassium ions is calculated.
従って、複数のイオン種のそれぞれに対応する検量モデルによって、未知溶液における複数のイオン種を分析することができる。即ち、本発明によれば、単一のイオン種を含む溶液だけでなく、複数のイオン種を含む溶液についても分析を行うことができる。このとき、同じ測定データを各イオン種の分析に併用できるため、分析を迅速に行うことができる。Therefore, a plurality of ion species in the unknown solution can be analyzed by the calibration model corresponding to each of the plurality of ion species. That is, according to the present invention, not only a solution containing a single ionic species but also a solution containing a plurality of ionic species can be analyzed. At this time, since the same measurement data can be used together for the analysis of each ion species, the analysis can be performed quickly.
測定点の個数や、測定域(周波数域)の範囲は、イオン種ごとに異なってもよい。The number of measurement points and the range of the measurement range (frequency range) may be different for each ion species.
複数のイオン種を分析する場合を想定すると、上述した定数選択において、複数のイオン種に対応する各検量モデルについて、同じ測定点に対応する定数を削除する(選択しない)ことが好ましい。これにより、複数のイオン種を分析する場合においても、当該測定点における測定を省略でき、分析の迅速化を好適に達成できる。Assuming the case of analyzing a plurality of ion species, in the above-described constant selection, it is preferable to delete (not select) the constants corresponding to the same measurement point for each calibration model corresponding to the plurality of ion species. Thereby, even when analyzing a plurality of ion species, the measurement at the measurement point can be omitted, and the speeding up of the analysis can be suitably achieved.
本態様において、溶液分析システムを用いる前処理として、濃度推定処理を行うことで、定数を間引きした上でより正確に溶液の分析を行うことができる。In this embodiment, by performing concentration estimation processing as preprocessing using the solution analysis system, the solution can be analyzed more accurately after thinning out the constants.
前処理としての濃度推定処理を説明する。The concentration estimation process as a pre-process will be described.
制御部3は、濃度推定処理を行うにあたり、図示しないデータ処理部を備えていることが好ましい。データ処理部は、後述する固有特性波形の特性値を特定する。It is preferable that the
濃度推定処理は、登録処理と推定濃度分析処理を含む。以下、登録処理と濃度分析処理の各々について説明する。Concentration estimation processing includes registration processing and estimated concentration analysis processing. Hereinafter, each of the registration process and the concentration analysis process will be described.
(1-3)登録処理
以下に、登録処理の例を図11に基づいて説明する。(1-3) Registration Process An example of the registration process will be described below with reference to FIG.
なお、以下の説明では、一例として、分析対象である特定イオン種が含窒素イオンである場合について主に説明する。In the following description, the case where the specific ion species to be analyzed is a nitrogen-containing ion will be mainly described as an example.
まず、電気インピーダンス測定装置1は、段階的に異なる濃度Y1~YNで含窒素イオンを含有する既知溶液について電気インピーダンス法により周波数-抵抗特性を取得する(S41)。First, the electrical
ここでは、予め含窒素イオンの濃度が既知である既知溶液を用意する。既知溶液を新規に調製する場合は、窒素化合物の配合量から含窒素イオンの濃度を決定し、既知とすることができる。あるいは、任意の採取源からサンプリングされた既知溶液を用いる場合は、イオンクロマトグラフィー等の別法によって含窒素イオンの濃度を決定し、既知とすることができる。Here, a known solution having a known concentration of nitrogen-containing ions is prepared in advance. When a known solution is newly prepared, the concentration of nitrogen-containing ions can be determined from the compounding amount of the nitrogen compound and can be made known. Or when using the known solution sampled from arbitrary collection sources, the density | concentration of nitrogen-containing ion can be determined and known by other methods, such as ion chromatography.
かかる既知溶液について、電気インピーダンス測定装置1を用いて、電気インピーダンス法により測定を行う。ここでは、未知溶液に印加する交流電圧の周波数を変化させながら抵抗(インピーダンスともいう)を測定し、周波数-抵抗特性を取得する。Such a known solution is measured by the electrical impedance method using the electrical
取得される周波数-抵抗特性は、複数(L点)の周波数f1~fLと、これら複数の周波数f1~fLのそれぞれにおいて測定された複数の抵抗X1~XLと、測定に供した既知溶液における特定イオン種の濃度とからなるデータを含んでいる。Lは10以上1000以下に設定されることが好ましい。The acquired frequency-resistance characteristics include a plurality of (point L) frequencies f1 to fL , a plurality of resistors X1 to XL measured at each of the plurality of frequencies f1 to fL , and measurement It contains data consisting of the concentration of specific ionic species in the known solution provided. L is preferably set to 10 or more and 1000 or less.
例えば、周波数を100Hz~2000Hzの範囲内で変化させて測定することが好ましく、このとき、f1~fLは各々この範囲内の所定の周波数に割り当てられる。For example, it is preferable to measure by changing the frequency within a range of 100 Hz to 2000 Hz, and at this time, f1 to fL are respectively assigned to predetermined frequencies within this range.
周波数-抵抗特性は、濃度の異なる複数の既知溶液のそれぞれについて取得される。The frequency-resistance characteristics are acquired for each of a plurality of known solutions having different concentrations.
図12に、取得された複数の周波数-抵抗特性の一例を示す。ここでは、濃度Y1~Y4の既知溶液について取得された計4つの周波数-抵抗特性を示している。FIG. 12 shows an example of a plurality of acquired frequency-resistance characteristics. Here, a total of four frequency-resistance characteristics obtained for known solutions having concentrations Y1 to Y4 are shown.
濃度Y1~Y4は、それぞれY1<Y2<Y3<Y4の関係にある。そして、図12に示すように、比較的低濃度である濃度Y1~Y3において濃度依存性のある特徴的な特性波形が現れていることがわかる。図12の例では、周波数300~400Hz程度の間で、濃度依存性のある特徴的な特性波形が現れている。一方、その他周波数(約300Hz以下、約400Hz以上)においては、濃度が異なっても波形が同じかほぼ同じであり、濃度依存性は認められない。本明細書では、かかる濃度依存性のある特徴的な波形について、特定イオン種に由来する固有特性波形という。The densities Y1 to Y4 are in a relationship of Y1 <Y2 <Y3 <Y4 , respectively. Then, as shown in FIG. 12, it can be seen that characteristic characteristic waveforms having density dependency appear in the densities Y1 to Y3 which are relatively low density. In the example of FIG. 12, a characteristic characteristic waveform having a concentration dependency appears between frequencies of about 300 to 400 Hz. On the other hand, at other frequencies (about 300 Hz or less, about 400 Hz or more), even if the concentration is different, the waveform is the same or almost the same, and concentration dependency is not recognized. In the present specification, such a characteristic waveform having concentration dependence is referred to as a characteristic waveform derived from a specific ion species.
かかる周波数-抵抗特性は、制御部3に入力される。Such frequency-resistance characteristics are input to the
制御部3は、入力された濃度Y1~YNの既知溶液の周波数-抵抗特性に出現する特定イオン種に由来する固有特性波形の特性値P1~PNを取得する(S11)。The
図12の例では、固有特性波形が出現しているのは濃度Y1~Y3であるから、データ処理部は、これら濃度Y1~Y3における該固有特性波形の特性値P1~P3を特定する。ここでは、特性値として、該固有特性波形のピーク値を用いている。また、固有特性波形が出現していない濃度Y4については、特性値P4=0と特定する。In the example of FIG. 12, since the characteristic characteristic waveforms appear in the concentrations Y1 to Y3 , the data processing unit performs the characteristic values P1 to P of the specific characteristic waveforms at these concentrations Y1 to Y3 .3 is specified. Here, the peak value of the characteristic characteristic waveform is used as the characteristic value. Further, the density Y4 at which the characteristic waveform does not appear is specified as the characteristic value P4 = 0.
特性値はイオン種が低濃度であるほど大きくなる。従って、濃度Y1~Y4がY1<Y2<Y3<Y4の関係にあるとき、特性値P1~P4はP1>P2>P3>P4の関係にある。The characteristic value increases as the concentration of ionic species decreases. Therefore, when the densities Y1 to Y4 are in the relationship of Y1 <Y2 <Y3 <Y4 , the characteristic values P1 to P4 are in the relationship of P1 > P2 > P3 > P4 .
データ処理部は、特定された特性値P1~P4を、該特性値に対応する濃度Y1~Y4と関連付けたデータテーブルを生成する。The data processing unit generates a data table in which the specified characteristic values P1 to P4 are associated with the densities Y1 to Y4 corresponding to the characteristic values.
図13はデータテーブルの一例を概念的に示す図である。FIG. 13 is a diagram conceptually illustrating an example of a data table.
図13に示すように、データテーブルにおいて、特性値P1と濃度Y1、特性値P2と濃度Y2、特性値P3と濃度Y3が、それぞれ関連付けられている。As shown in FIG. 13, in the data table, characteristic value P1 and density Y1 , characteristic value P2 and density Y2 , characteristic value P3 and density Y3 are associated with each other.
生成したデータテーブルは、記憶部36に保存される(S42)。The generated data table is stored in the storage unit 36 (S42).
これにより、登録処理が終了したことになる。This completes the registration process.
(1-4)推定濃度分析処理
次に、推定濃度分析処理の例について図14に基づいて説明する。(1-4) Estimated Concentration Analysis Processing Next, an example of estimated concentration analysis processing will be described with reference to FIG.
まず、電気インピーダンス測定装置1は、含窒素イオンの濃度が未知である未知溶液を希釈して電気インピーダンス法により周波数-抵抗特性を取得し、制御部3に入力する(S50)。First, the electrical
希釈には水が用いられ、特に純水が好ましい。未知溶液の希釈方法は格別限定されない。例えば、未知溶液を複数に分取して、段階的に希釈された複数の未知溶液を調製することができる。この場合、複数の未知溶液について電気インピーダンス測定を行うことができる。あるいは、1つの未知溶液を段階的に希釈する過程で電気インピーダンス測定を行うようにしてもよい。Water is used for dilution, and pure water is particularly preferable. The method for diluting the unknown solution is not particularly limited. For example, it is possible to prepare a plurality of unknown solutions that are diluted stepwise by separating a plurality of unknown solutions. In this case, electrical impedance measurement can be performed for a plurality of unknown solutions. Or you may make it perform an electrical impedance measurement in the process of diluting one unknown solution in steps.
制御部3は、入力された未知溶液の周波数-抵抗特性に上述した固有特性波形が出現する希釈率Dにおける該固有特性波形の特性値PDを取得する(P51)。
図15に、希釈率Dの未知溶液の周波数-抵抗特性の一例を示す。FIG. 15 shows an example of frequency-resistance characteristics of an unknown solution having a dilution ratio D.
図15に示すように、希釈率Dの未知溶液の周波数-抵抗特性に、既知溶液において出現したものと同様の含窒素イオンに由来する固有特性波形が現れていることがわかる。As shown in FIG. 15, it can be seen that a characteristic waveform derived from nitrogen-containing ions similar to that appearing in the known solution appears in the frequency-resistance characteristics of the unknown solution having the dilution ratio D.
データ処理部は、かかる希釈率Dの未知溶液における該固有特性波形の特性値PDを特定する。The data processing unit identifies the characteristic values PD of said intrinsic characteristic waveforms in an unknown solution of such dilution D.
次いで、制御部3は、予め保存したデータテーブルにおける既知溶液の濃度Y1~Y4に対応する特性値P1~P4のうち、濃度Yn-1及びYn(ここで、Yn-1<Ynとする)に対応する特性値Pn-1及びPnと、希釈率Dの前記未知溶液の特性値PDとの間にPn≦PD<Pn-1の関係が成り立つ場合に、希釈されていない前記未知溶液における前記特定イオン種の濃度YをYn-1×D<Y≦Yn×Dの範囲であると算出する(S52)。Next, the
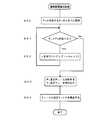
この推定濃度算出処理の例について、図16に基づいて説明する。An example of this estimated concentration calculation process will be described with reference to FIG.
濃度算出部34は、まず、未知溶液の特性値PDと対比される最初の既知溶液の特性値Pnのnを1に設定する(S60)。これにより、未知溶液の特性値PDと最初に対比される対象は、特性値P1になる。
上述したように、特性値P1~P4はP1>P2>P3>P4の関係にある。即ち、未知溶液の特性値PDと対比される最初の既知溶液の特性値として、一番大きい値を示す特性値P1が選択される。As described above, the characteristic values P1 to P4 have a relationship of P1 > P2 > P3 > P4 . That is, as a characteristic value of the first known solution to be compared with the characteristic value PD of the unknown solution, the characteristic value P1 indicating the largest value is selected.
次いで、濃度算出部34は、これら特性値PD、P1に、P1>PDが成り立つか判断する(S61)。Next, the
P1>PDが成り立つと判断する場合(S61のYES)、濃度算出部34は、nをカウントアップ(n=n+1)する(S62)。これにより、n=2になる。そして、濃度算出部34は、特性値PD、P2に、P2>PDが成り立つか判断する(S61)。
このようにして、未知溶液のPDに対して、nをカウントアップしながら既知溶液の特性値をP1、P2・・・の順に対比する。If it is determined that P1>P D is satisfied (YES in S61), the
Thus, for PD unknown solution, comparing the characteristic values of the known solutions in the order of P1, P2 ··· while counting up n.
例えば、濃度算出部34は、P2>PDが成り立たないと判断した場合(S61のNO)、P2≦PD<P1の関係が成り立つことになる。For example, when the
そして、濃度算出部34は、記憶部36に予め保存したデータテーブルからP2及びP1対応するY2及びY1を呼び出す(S63)。The
そして、Y1×D及びY2×Dを算出する(S64)。これにより、P2≦PD<P1と対応するY1×D<Y≦Y2×Dを算出できる。Then, Y1 × D and Y2 × D are calculated (S64). Accordingly, Y1 × D <Y ≦ Y2 × D corresponding to P2 ≦ PD <P1 can be calculated.
この結果、希釈されていない前記未知溶液における前記特定イオン種の濃度Yは、Y1×D<Y≦Y2×Dの範囲にあることがわかる。As a result, it is understood that the concentration Y of the specific ion species in the undiluted unknown solution is in the range of Y1 × D <Y ≦ Y2 × D.
即ち、Pn≦PD<Pn-1の関係が成り立つと、記憶部36に予め保存したデータテーブルからPn及びPn-1に対応するYn及びYn-1を呼び出し(S63)、呼び出されたYn及びYn-1と、希釈率Dとに基づきYn-1×D及びYn×Dを算出する(S64)。That is, when the relationship of Pn ≦ PD <Pn−1 is established, Yn and Yn−1 corresponding to Pn and Pn−1 are called from the data table stored in advance in the storage unit 36 (S63). Then, Yn−1 × D and Yn × D are calculated based on the called Yn and Yn−1 and the dilution rate D (S64).
つまり、S64により、希釈されていない前記未知溶液における前記特定イオン種の濃度Yが、Yn-1×D<Y≦Yn×Dの範囲であることがわかる。In other words, it can be seen from S64 that the concentration Y of the specific ion species in the undiluted unknown solution is in the range of Yn−1 × D <Y ≦ Yn × D.
例えば、既知溶液の含窒素イオンの濃度Yn-1が8×10⁻⁵mol/l、濃度Ynが9×10-5mol/lであり、未知溶液の希釈率Dが30倍であったと仮定した場合、希釈されていない未知溶液における含窒素イオンの濃度Y(mol/l)は、2.4×10-3mol/l<Y≦2.7×10-3mol/lの範囲であると算出される。For example, the concentration Yn-1 of nitrogen-containing ions in the known solution is 8 × 10⁻⁵ mol / l, the concentration Yn is 9 × 10⁻⁵ mol / l, and the dilution rate D of the unknown solution is 30 times. Assuming that the concentration Y (mol / l) of nitrogen-containing ions in the undiluted unknown solution is in the range of 2.4 × 10⁻³ mol / l <Y ≦ 2.7 × 10⁻³ mol / l It is calculated that
なお、未知溶液の特性値PDと最初の特性値P1(一番大きい値を有する)とで、P1>PDの関係が成り立たないと判断した場合、両者はP1≦PDの関係にあることから、濃度算出部34は、未知溶液における含窒素イオンの濃度Yを、Y≦Y1×Dであると算出することができる。If it is determined that the relationship of P1 > PD does not hold between the characteristic value PD of the unknown solution and the first characteristic value P1 (having the largest value), both of them satisfy P1 ≦ PD Because of the relationship, the
また、未知溶液の特性値PDと一番小さい値を有する既知溶液の特性値P4とに、P4>PDの関係が成り立つと判断した場合、濃度算出部34は、未知溶液における含窒素イオンの濃度Yを、Y4×D<Yであると算出することができる。When it is determined that the relationship P4 > PD holds between the characteristic value PD of the unknown solution and the characteristic value P4 of the known solution having the smallest value, the
また、未知溶液を希釈しても含窒素イオンに対応する固有特性波形が現れない場合、未知溶液は含窒素イオンを含まないと算出することができる。In addition, if an intrinsic characteristic waveform corresponding to nitrogen-containing ions does not appear even when the unknown solution is diluted, it can be calculated that the unknown solution does not contain nitrogen-containing ions.
以上のようにして、濃度推定処理が終わったら、濃度分析システムは、本処理の(1-1)登録処理に戻り、処理を開始することができる。As described above, when the concentration estimation process is completed, the concentration analysis system can return to the (1-1) registration process of this process and start the process.
そして、本処理の(1-2)濃度分析処理において、S21の処理の際に、濃度推定処理において算出された濃度範囲を用いることができる。すなわち、濃度範囲に基づき定数選択を行うようにすることができる。
例えば、定数の絶対値の大きいほうから優先的に選択する際に、選択される個数が、前処理を行わない場合は、60%だとしたら、20%程度の定数を用いることにより、精度を保ちつつ、濃度分析を行うことができる。
つまり、この前処理を行うことで、濃度分析処理に用いる算出量を減じつつ、分析される濃度の精度を保つことができ、より高精度の濃度分析を行うことができる。In the (1-2) concentration analysis processing of this processing, the concentration range calculated in the concentration estimation processing can be used in the processing of S21. That is, constant selection can be performed based on the concentration range.
For example, when preferentially selecting from the larger absolute value of the constant, if the number to be selected is not pre-processed, and if it is 60%, the accuracy can be improved by using a constant of about 20%. Concentration analysis can be performed while keeping.
That is, by performing this pre-processing, it is possible to maintain the accuracy of the concentration to be analyzed while reducing the amount of calculation used for the concentration analysis processing, and it is possible to perform a more accurate concentration analysis.
2.第2態様
次に、第2態様に係る溶液分析システムについて説明する。2. Second Aspect Next, a solution analysis system according to the second aspect will be described.
第2態様に係る溶液分析システムは、電気インピーダンス法と近赤外分光法を併用した溶液分析法である。The solution analysis system according to the second aspect is a solution analysis method using both the electrical impedance method and the near infrared spectroscopy.
第2態様に係る溶液分析システムは、第1態様における測定点として、電気インピーダンス法における周波数に加えて、近赤外分光法における波長を含むこと以外は、基本的に第1態様と同様の構成であり、特に断りのない限り第1態様についてした説明を援用することができる。The solution analysis system according to the second aspect basically has the same configuration as the first aspect except that the measurement point in the first aspect includes a wavelength in the near-infrared spectroscopy in addition to the frequency in the electrical impedance method. Unless otherwise specified, the description of the first aspect can be incorporated.
図17は、第2態様に係る溶液分析システムの一例を示す機能ブロック図である。FIG. 17 is a functional block diagram showing an example of the solution analysis system according to the second aspect.
図17に示すように、溶液分析システムは、電気インピーダンス測定装置1、近赤外分光測定装置2、及び、制御部3により構成されている。As shown in FIG. 17, the solution analysis system includes an electrical
近赤外分光測定装置2は、近赤外分光法により測定を行う装置であり、溶液に照射する光の波長を変化させながら吸光度を測定するように構成されている。The near-
近赤外分光測定装置2は、検知部21と入出力部22とを備えている。検知部21は測定されたデータを検知し、入出力部22は近赤外分光測定装置2と制御部3との間でデータの入出力を行う。The near-
第2態様において、制御部3の測定点決定部31は、電気インピーダンス測定装置1及び近赤外分光測定装置2による測定に係る測定点を決定する。測定点決定部31は、電気インピーダンス測定における測定周波数、及び、近赤外分光測定における測定波長を決定
する。In the second mode, the measurement
第2態様において、入出力部35は、制御部3と電気インピーダンス測定装置1との間、及び、制御部3と近赤外分光測定装置2との間で、データの入出力を行う。In the second mode, the input /
以下に、第2態様の溶液分析システムにおける登録処理及び濃度分析処理について説明する。Hereinafter, the registration process and the concentration analysis process in the solution analysis system of the second aspect will be described.
なお、以下の説明では、一例として、分析対象である特定イオン種が含リンイオンである場合について主に説明する。In the following description, the case where the specific ion species to be analyzed is a phosphorus-containing ion is mainly described as an example.
(2-1)登録処理
再び図2を参照して、第2態様の登録処理の例を説明する。(2-1) Registration Process With reference to FIG. 2 again, an example of the registration process of the second aspect will be described.
まず、電気インピーダンス測定装置1は、図2に示すフローに従い、含リンイオンの濃度が既知である既知溶液について、電気インピーダンス法により測定を行い、周波数-抵抗特性データを取得する(S10)。First, according to the flow shown in FIG. 2, the electrical
一方で、近赤外分光測定装置2は、かかる既知溶液について、近赤外分光法により測定を行う。ここでは、未知溶液に照射する光の波長を変化させながら吸光度を測定し、波長-吸光度スペクトルデータを取得する。On the other hand, the near-
取得される波長-吸光度スペクトルデータは、複数(M点)の波長λL+1~λL+Mと、これら複数の波長λL+1~λL+Mのそれぞれにおいて測定された複数の吸光度XL+1~XL+Mと、測定に供した既知溶液における特定イオン種の濃度とからなるデータを含んでいる。Mは例えば10以上1000以下に設定される。The acquired wavelength-absorbance spectrum data includes a plurality (M points) of wavelengths λL + 1 to λL + M, and a plurality of absorbances XL + 1 to XL + M measured at each of the plurality of wavelengths λL + 1 to λL + M. Data including the concentration of the specific ionic species in the known solution subjected to the above. For example, M is set to 10 or more and 1000 or less.
例えば、波長を可視光-近赤外光の範囲内、好ましくは300nm~1200nmの範囲内で変化させて測定する。このとき、λL+1~λL+Mは各々この範囲内の所定の波長に割り当てられる。測定波長の範囲及び割り当ての設定は、制御部3の測定点決定部31により行う。For example, the measurement is performed by changing the wavelength within the range of visible light-near infrared light, preferably within the range of 300 nm to 1200 nm. At this time, each of λL + 1 to λL + M is assigned to a predetermined wavelength within this range. The measurement wavelength range and assignment are set by the measurement
既知溶液として特定イオン種の濃度を互いに異ならせたものを複数用意し、これら複数の既知溶液について上述した測定を行い、周波数-抵抗特性データ及び波長-吸光度スペクトルデータを複数取得することができる。また、既知溶液として、含リンイオンの他に、他のイオン種を含むものを用いることもできる。It is possible to obtain a plurality of frequency-resistance characteristic data and wavelength-absorbance spectrum data by preparing a plurality of known solutions having different concentrations of specific ionic species and performing the above-described measurements on the plurality of known solutions. Further, as the known solution, a solution containing other ionic species in addition to phosphorus-containing ions can be used.
周波数-抵抗特性データ及び波長-吸光度スペクトルデータは、それぞれ、測定されたデータに2次微分処理やスムージング処理等の処理を施して得られたデータであってもよい。The frequency-resistance characteristic data and the wavelength-absorbance spectrum data may be data obtained by subjecting the measured data to a process such as a secondary differentiation process or a smoothing process.
取得された周波数-抵抗特性データ及び波長-吸光度スペクトルデータは、制御部3に入力される。The acquired frequency-resistance characteristic data and wavelength-absorbance spectrum data are input to the
制御部3は、取得した前記周波数-抵抗特性データ及び前記波長-吸光度スペクトルデータを多変量解析して、周波数及び波長の各測定点に対応する複数の定数を決定する(S11)。The
第2態様にかかる検量モデルは、例えば下記式のように表すことができる。The calibration model according to the second aspect can be expressed by the following equation, for example.
YP=αP+βPYP = αP + βP
ここで、YPは未知溶液の含リンイオンの濃度であり、αPは周波数-抵抗特性データに対応する項であり、βPは波長-吸光度スペクトルデータに対応する項である。 Here, YP is the concentration of free phosphorus ions unknown solution, the alphaP frequency - a term corresponding to the resistance characteristic data, betaP wavelength - a term corresponding to the absorbance spectrum data.
αPは、第1態様の検量モデルを構成する成分と同様であり、下記式のように表すことができる。αP is the same as the component constituting the calibration model of the first aspect, and can be expressed as the following equation.
αP=AP1X1+AP2X2+AP3X3+・・・+APLXLαP = AP1 X1 + AP2 X2 + AP3 X3 +... + APL XL
ここで、X1~XLは周波数f1~fLのそれぞれにおいて測定された抵抗であり、AP1~APLは周波数f1~fLのそれぞれに対応する定数である。 Here, X1 to XL are resistances measured at frequencies f1 to fL , respectively, and AP1 to APL are constants corresponding to the frequencies f1 to fL , respectively.
一方、βPは下記式のように表すことができる。On the other hand, βP can be expressed as the following formula.
βP=APL+1XL+1+APL+2XL+2+APL+3XL+3+・・・+APL+MXL+MβP = APL + 1 XL + 1 + APL + 2 XL + 2 + APL + 3 XL + 3 +... + APL + M XL + M
ここで、XL+1~XL+Mは波長λL+1~λL+Mのそれぞれにおいて測定された吸光度であり、APL+1~APL+Mは波長λL+1~λL+Mのそれぞれに対応する定数である。 Here, XL + 1 to XL + M are absorbances measured at wavelengths λL + 1 to λL + M , and APL + 1 to APL + M are constants corresponding to the wavelengths λL + 1 to λL + M , respectively.
これら定数の決定は、既知溶液について取得された周波数-抵抗特性データ及び波長-吸光度スペクトルデータを多変量解析して決定することができる。These constants can be determined by multivariate analysis of frequency-resistance characteristic data and wavelength-absorbance spectrum data acquired for a known solution.
このようにして、周波数及び波長の各測定点に対応する複数の定数を決定する。決定された複数の定数は、対応する測定点と関連付けられた予備データテーブルとして記憶部36に保存する。In this way, a plurality of constants corresponding to each measurement point of frequency and wavelength are determined. The determined plural constants are stored in the
図18は予備データテーブルの一例を示している。図18に示されるように、データテーブルにおいて、決定された複数の定数AP1、AP2、AP3・・・APL+1、APL+2、APL+3・・・は、それぞれ対応する測定点(周波数及び波長)f1、f2、f3・・・λL+1、λL+2、λL+3・・・と関連付けられている。FIG. 18 shows an example of the preliminary data table. As shown in FIG. 18, in the data table, the determined constants AP1 , AP2 , AP3 ... APL + 1 , APL + 2 , APL + 3. Wavelength) f1 , f2 , f3 ... ΛL + 1 , λL + 2 , λL + 3 .
次いで、制御部は、決定された複数の定数のうち、特定イオン種固有の特徴的な定数を選択する(S12)。Next, the control unit selects a characteristic constant specific to the specific ion species among the determined constants (S12).
図19は、周波数と波長の各測定点と回帰係数の値の関係を示すプロットである。このように、第2態様では、特定イオン種固有の特徴的な定数を選択するために、異なる物理量である周波数及び波長を一軸(同じ軸)上に並べて回帰係数の値を評価する。FIG. 19 is a plot showing the relationship between each measurement point of frequency and wavelength and the value of the regression coefficient. As described above, in the second aspect, in order to select a characteristic constant specific to a specific ion species, frequencies and wavelengths that are different physical quantities are arranged on one axis (same axis), and the value of the regression coefficient is evaluated.
図19に示すように、第2態様においても、正負方向に大きい値を示す回帰係数(絶対値の大きい回帰係数)が存在しており、これら回帰係数の測定点に対応する定数をイオン種固有の特徴的な定数として優先的に選択することができる。As shown in FIG. 19, also in the second mode, there is a regression coefficient showing a large value in the positive and negative directions (regression coefficient having a large absolute value), and constants corresponding to measurement points of these regression coefficients are specific to the ion species. Can be preferentially selected as a characteristic constant.
図20は、定数選択用データテーブルの一例を示している。図20に示されるように、定数選択用データテーブルにおいて、絶対値化された複数の回帰係数|A’P1|、|A’P2|、|A’P3|・・・|A’PL+1|、|A’PL+2|、|A’PL+3|・・・は、それぞれ対応する測定点(周波数及び波長)f1、f2、f3・・・λL+1、λL+2、λL+3・・・と関連付けられている。FIG. 20 shows an example of a constant selection data table. As shown in FIG. 20, in the constant selection data table, a plurality of regression coefficients converted into absolute values | A ′P1 |, | A ′P2 |, | A ′P3 |... | A ′PL + 1 | | A ′PL + 2 |, | A ′PL + 3 |... Are associated with corresponding measurement points (frequency and wavelength) f1 , f2 , f3 ... ΛL + 1 , λL + 2 , λL + 3. It has been.
図21は、定数選択用データテーブルに基づいて選択された定数により構成される分析用データテーブルの一例を示している。図21に示されるように、分析用データテーブルにおいて、選択された定数AP1、AP3、AP5・・・APL+2、APL+4、APL+7・・・は、それぞれ対応する測定点(周波数及び波長)f1、f3、f5・・・λL+2、λL+4、λL+7・・・と関連付けられている。即ち、分析用データテーブルは、定数-周波数対応情報と、定数-波長対応情報とを含んでいる。FIG. 21 shows an example of an analysis data table composed of constants selected based on the constant selection data table. As shown in FIG. 21, in the analysis data table, the selected constants AP1 , AP3 , AP5 ... APL + 2 , APL + 4 , APL + 7. Wavelength) f1 , f3 , f5 ... ΛL + 2 , λL + 4 , λL + 7 . That is, the analysis data table includes constant-frequency correspondence information and constant-wavelength correspondence information.
かかる分析用データテーブルは、記憶部36に保存される(S13)。The analysis data table is stored in the storage unit 36 (S13).
これにより、登録処理が終了したことになる。This completes the registration process.
第2態様において、定数選択によって、選択前の定数の総数L+Mを例えば10%~90%に絞り込むことができる。また、選択後の定数の個数は、例えば5以上500以下にすることができる。In the second aspect, the total number L + M of constants before selection can be narrowed down to, for example, 10% to 90% by selecting constants. The number of constants after selection can be set to, for example, 5 or more and 500 or less.
第2態様における定数の選択は、周波数に係る測定点に対応する定数と、波長に係る測定点に対応する定数とからなる1つの集合の中から、定数を選択することができる。あるいは、他の態様として、周波数に係る測定点に対応する定数からなる集合の中から定数を選択し、波長に係る測定点に対応する定数の集合の中から定数を選択した後、これら個別に選択された定数を合わせて、選択された定数としてもよい。The selection of the constant in the second mode can be performed by selecting a constant from one set of a constant corresponding to the measurement point related to the frequency and a constant corresponding to the measurement point related to the wavelength. Alternatively, as another aspect, after selecting a constant from a set of constants corresponding to measurement points related to the frequency, selecting a constant from a set of constants corresponding to the measurement points related to the wavelength, and then individually The selected constants may be combined to be the selected constant.
(2-2)濃度分析処理
再び図10を参照して、第2態様の濃度分析処理の例を説明する。(2-2) Concentration Analysis Process With reference to FIG. 10 again, an example of the concentration analysis process of the second aspect will be described.
まず、制御部3は、記憶部36に保存された、定数-周波数対応情報及び定数-波長対応情報を含む分析用データテーブルを読み込む(S30)。First, the
電気インピーダンス測定装置1は、特定イオン種の濃度が未知である未知溶液について、読み込まれた分析用データテーブルのうちの、選択された定数に対応する周波数及び波長の各測定点で、電気インピーダンス法による抵抗測定及び近赤外分光法による吸光度測定を行って測定データを取得して制御部3に入力する(S31)The electrical
このとき、制御部3の測定点決定部31は、選択された定数に対応する周波数の測定点において測定を行い、他の測定点における測定を省略するように、電気インピーダンス測定装置1及び近赤外分光測定装置2における測定を制御することができる。At this time, the measurement
制御部3の濃度算出部34は、入力された未知溶液の測定データと、読み込まれた分析用データテーブルのうちの選択された定数とに基づいて、未知溶液における含リンイオンの濃度を算出する(S32)。The
制御部3は、算出された含リンイオンの濃度を図示しない画像表示装置に表示することができる(S33)。The
これにより、濃度分析処理が終了したことになる。This completes the concentration analysis process.
既知溶液及び未知溶液について取得される周波数-抵抗特性は、純水の周波数-抵抗特性を差し引く標準正規化処理(SNV(Standard Normal Variate)処理ともいう)が施されたものであってもよい。The frequency-resistance characteristics acquired for the known solution and the unknown solution may have been subjected to standard normalization processing (also referred to as SNV (Standard Normal Variate) processing) that subtracts the frequency-resistance characteristics of pure water.
以上に説明した本発明の溶液分析システムによれば、試薬の添加等が必要なく、簡易且つ迅速に分析でき、連続的なモニタリングが可能であり、且つ複数種のイオン濃度を個別に分析できる効果が得られる。According to the solution analysis system of the present invention described above, it is possible to perform simple and rapid analysis without the addition of reagents and the like, continuous monitoring is possible, and the effect of individually analyzing a plurality of types of ion concentrations. Is obtained.
本発明において、分析の対象となる特定イオン種は格別限定されないが、含窒素イオン(硝酸イオン;NO3-、亜硝酸イオン;NO2-、アンモニウムイオン;NH4+)、含リンイオン(リン酸イオン;PO43-)、カリウムイオン(K+)等を好ましく挙げることができる。In the present invention, the specific ion species to be analyzed is not particularly limited, but nitrogen-containing ions (nitrate ions; NO3− , nitrite ions; NO2− , ammonium ions; NH4+ ), phosphorus-containing ions (phosphates) Preferable examples include ions; PO43− ) and potassium ions (K+ ).
また、分析の対象となる未知溶液は格別限定されないが、例えば有機系廃棄物等であることが好ましい。有機系廃棄物としては、例えばメタン発酵消化液等を好ましく挙げることができる。Further, the unknown solution to be analyzed is not particularly limited, but is preferably organic waste, for example. As an organic waste, a methane fermentation digestive liquid etc. can be mentioned preferably, for example.
以上の説明では、制御部が、特定イオン種の濃度を画像表示装置に表示する場合について示したが、これに限定されるものではない。制御部は、特定イオン種の濃度に基づいて、該制御部に接続された他の機器の動作を制御するように構成することができる。In the above description, the control unit has shown the case where the concentration of the specific ion species is displayed on the image display device. However, the present invention is not limited to this. The control unit can be configured to control operations of other devices connected to the control unit based on the concentration of the specific ion species.
分析における濃度の単位は格別限定されず、例えばmol/l(モル数/容積)、mg/kg(重量/重量)、mg/l(重量/容積)等のように、モル数、重量(質量)、容積(体積)等の物理量を組み合わせた任意の単位を用いることができる。即ち、用いる単位に合わせて定数を決定すればよい。The unit of concentration in the analysis is not particularly limited. For example, mol / l (number of moles / volume), mg / kg (weight / weight), mg / l (weight / volume), etc. ), Any unit combining physical quantities such as volume (volume) can be used. That is, the constant may be determined according to the unit to be used.
1:電気インピーダンス測定装置
2:近赤外分光測定装置
3:制御部1: Electrical impedance measurement device 2: Near infrared spectroscopy measurement device 3: Control unit
Claims (4)
Translated fromJapanese前記電気インピーダンス測定装置の検知部において、特定イオン種の濃度が既知である既知溶液について、電気インピーダンス法により周波数-抵抗特性データを検知し、前記電気インピーダンス測定装置の入出力部を介して前記制御部に入力し、
前記制御部は、入力された前記周波数-抵抗特性データを多変量解析して、周波数の測定点に対応する複数の定数を決定し、
次いで、決定された前記複数の定数のうち、特定イオン種固有の特徴的な定数を選択し、
次いで、選択した前記定数と前記定数に対応する前記周波数とを定数-周波数対応情報として記憶部に記憶し、
前記定数-周波数対応情報のうちの前記周波数に基づき、前記電気インピーダンス測定装置の検知部において、特定イオン種の濃度が未知である未知溶液について、電気インピーダンス法による抵抗測定を行って測定データを検知し、前記電気インピーダンス測定装置の入出力部を介して前記制御部に入力し、
前記制御部は、入力された前記測定データと前記定数-周波数対応情報のうちの前記定数とに基づき、前記未知溶液における特定イオン種の濃度を算出することを特徴とする溶液分析システム。An electrical impedance measuring device, and a control unit connected to the electrical impedance measuring device,
In the detection unit of the electrical impedance measurement device, frequency-resistance characteristic data is detected by an electrical impedance method for a known solution whose concentration of the specific ion species is known, and the control is performed via the input / output unit of the electrical impedance measurement device. Enter
The control unit performs multivariate analysis on the input frequency-resistance characteristic data to determine a plurality of constants corresponding to frequency measurement points,
Next, a characteristic constant specific to a specific ion species is selected from the plurality of determined constants,
Next, the selected constant and the frequency corresponding to the constant are stored in the storage unit as constant-frequency correspondence information,
Based on the frequency in the constant-frequency correspondence information, the detection unit of the electrical impedance measurement device detects the measurement data by performing resistance measurement using an electrical impedance method for an unknown solution whose concentration of the specific ion species is unknown. And input to the control unit via the input / output unit of the electrical impedance measuring device,
The control unit calculates a concentration of a specific ion species in the unknown solution based on the input measurement data and the constant of the constant-frequency correspondence information.
前記電気インピーダンス測定装置及び前記近赤外分光測定装置のそれぞれの検知部において、特定イオン種の濃度が既知である既知溶液について、電気インピーダンス法により周波数-抵抗特性データと、近赤外分光法により測定された波長-吸光度スペクトルデータとを検知し、前記電気インピーダンス測定装置及び前記近赤外分光測定装置のそれぞれの入出力部を介して前記制御部に入力し、
前記制御部は、入力された前記周波数-抵抗特性データ及び前記波長-吸光度スペクトルデータを多変量解析して、周波数及び波長の測定点に対応する複数の定数を決定し、
次いで、決定された前記複数の定数のうち、特定イオン種固有の特徴的な定数を選択し、
次いで、選択した前記定数と前記定数に対応する前記周波数とを定数-周波数対応情報、及び選択した前記定数と前記定数に対応する前記波長とを定数-波長対応情報としてそれぞれ記憶部に記憶し、
前記定数-周波数対応情報及び前記定数-波長対応情報のうちの前記周波数及び前記波長に基づき、前記電気インピーダンス測定装置及び前記近赤外分光測定装置のそれぞれの検知部において、特定イオン種の濃度が未知である未知溶液について、電気インピーダンス法による抵抗測定及び近赤外分光法による吸光度測定を行ってそれぞれ測定データを検知し、前記電気インピーダンス測定装置及び前記近赤外分光測定装置のそれぞれの入出力部を介して前記制御部に入力し、
前記制御部は、入力された前記測定データと前記定数-周波数対応情報及び前記定数-波長対応情報のうちの前記定数とに基づき、前記未知溶液における特定イオン種の濃度を算出することを特徴とする溶液分析システム。An electrical impedance measuring device, a near-infrared spectrometer, and a control unit connected to the electrical impedance measuring device and the near-infrared spectrometer,
In each of the detection units of the electrical impedance measurement device and the near-infrared spectroscopy measurement device, a known solution having a known concentration of a specific ion species is subjected to frequency-resistance characteristic data by an electrical impedance method and near-infrared spectroscopy. The measured wavelength-absorbance spectrum data is detected and input to the control unit via the input / output units of the electrical impedance measurement device and the near-infrared spectroscopy measurement device,
The controller performs multivariate analysis on the input frequency-resistance characteristic data and the wavelength-absorbance spectrum data, and determines a plurality of constants corresponding to frequency and wavelength measurement points,
Next, a characteristic constant specific to a specific ion species is selected from the plurality of determined constants,
Then, the selected constant and the frequency corresponding to the constant are stored in a storage unit as constant-frequency correspondence information, and the selected constant and the wavelength corresponding to the constant are stored in a storage unit, respectively.
Based on the frequency and the wavelength of the constant-frequency correspondence information and the constant-wavelength correspondence information, the concentration of the specific ion species is determined in each detection unit of the electrical impedance measurement device and the near-infrared spectroscopy measurement device. For unknown solutions that are unknown, resistance measurement by the electrical impedance method and absorbance measurement by the near infrared spectroscopy are performed to detect the measurement data, and each input / output of the electrical impedance measurement device and the near infrared spectroscopy measurement device To the control unit via the unit,
The control unit calculates a concentration of a specific ion species in the unknown solution based on the input measurement data and the constant of the constant-frequency correspondence information and the constant-wavelength correspondence information. Solution analysis system.
に応じて選択する前記定数の個数又はパーセンテージを決定することを特徴とする請求項1~3の何れかに記載の溶液分析システム。4. The control unit according to claim 1, wherein when selecting a characteristic constant specific to the specific ion species, the control unit determines the number or percentage of the constant to be selected according to a predetermined analysis accuracy. The solution analysis system described in 1.
Priority Applications (1)
| Application Number | Priority Date | Filing Date | Title |
|---|---|---|---|
| CN201780021972.0ACN109073579A (en) | 2016-03-30 | 2017-02-27 | Liquor analysis system |
Applications Claiming Priority (4)
| Application Number | Priority Date | Filing Date | Title |
|---|---|---|---|
| JP2016068918AJP6224151B2 (en) | 2016-03-30 | 2016-03-30 | Solution analysis system |
| JP2016-068919 | 2016-03-30 | ||
| JP2016068919AJP6224152B2 (en) | 2016-03-30 | 2016-03-30 | Solution analysis system |
| JP2016-068918 | 2016-03-30 |
Publications (1)
| Publication Number | Publication Date |
|---|---|
| WO2017169444A1true WO2017169444A1 (en) | 2017-10-05 |
Family
ID=59964223
Family Applications (1)
| Application Number | Title | Priority Date | Filing Date |
|---|---|---|---|
| PCT/JP2017/007529CeasedWO2017169444A1 (en) | 2016-03-30 | 2017-02-27 | Solution analysis system |
Country Status (2)
| Country | Link |
|---|---|
| CN (1) | CN109073579A (en) |
| WO (1) | WO2017169444A1 (en) |
Citations (5)
| Publication number | Priority date | Publication date | Assignee | Title |
|---|---|---|---|---|
| JP2003139765A (en)* | 2001-07-06 | 2003-05-14 | Sakae Shibusawa | Device for observing characteristic of soil |
| US20060214671A1 (en)* | 2004-02-16 | 2006-09-28 | Wooton David L | Fluid quality control using broad spectrum impedance spectroscopy |
| JP2008106326A (en)* | 2006-10-26 | 2008-05-08 | Hirama Rika Kenkyusho:Kk | Etching liquid management apparatus |
| JP2013057669A (en)* | 2007-03-01 | 2013-03-28 | F Hoffmann-La Roche Ag | System and method for operating electrochemical analyte sensor |
| JP2013542414A (en)* | 2010-09-09 | 2013-11-21 | エス.イー.エイ. メディカル システムズ インコーポレイテッド | System and method for intravenous drug management using immittance spectroscopy |
Family Cites Families (4)
| Publication number | Priority date | Publication date | Assignee | Title |
|---|---|---|---|---|
| JPS5267699A (en)* | 1975-12-03 | 1977-06-04 | Fujihira Kougiyou Kk | Measuring method and apparatus for organic acid contents |
| US7109729B2 (en)* | 2002-06-07 | 2006-09-19 | Exxonmobil Research And Engineering Company | Method for analysis of a working fluid using impedance spectroscopy |
| CN102192951A (en)* | 2010-03-03 | 2011-09-21 | 修谷鲁电子机器股份有限公司 | Ion concentration measuring circuit and ion current sensor |
| JP5044774B2 (en)* | 2010-07-26 | 2012-10-10 | 株式会社アタゴ | Salinity concentration measuring apparatus and salinity concentration measuring method |
- 2017
- 2017-02-27WOPCT/JP2017/007529patent/WO2017169444A1/ennot_activeCeased
- 2017-02-27CNCN201780021972.0Apatent/CN109073579A/enactivePending
Patent Citations (5)
| Publication number | Priority date | Publication date | Assignee | Title |
|---|---|---|---|---|
| JP2003139765A (en)* | 2001-07-06 | 2003-05-14 | Sakae Shibusawa | Device for observing characteristic of soil |
| US20060214671A1 (en)* | 2004-02-16 | 2006-09-28 | Wooton David L | Fluid quality control using broad spectrum impedance spectroscopy |
| JP2008106326A (en)* | 2006-10-26 | 2008-05-08 | Hirama Rika Kenkyusho:Kk | Etching liquid management apparatus |
| JP2013057669A (en)* | 2007-03-01 | 2013-03-28 | F Hoffmann-La Roche Ag | System and method for operating electrochemical analyte sensor |
| JP2013542414A (en)* | 2010-09-09 | 2013-11-21 | エス.イー.エイ. メディカル システムズ インコーポレイテッド | System and method for intravenous drug management using immittance spectroscopy |
Non-Patent Citations (1)
| Title |
|---|
| JORGE YANEZ HERAS ET AL.: "Chelating electrodes as taste sensor for the trace assessment of metal ions", SENSORS AND ACTUATORS B, vol. 145, 2010, pages 726 - 733, XP026964599* |
Also Published As
| Publication number | Publication date |
|---|---|
| CN109073579A (en) | 2018-12-21 |
Similar Documents
| Publication | Publication Date | Title |
|---|---|---|
| JP6089345B2 (en) | Multicomponent regression / multicomponent analysis of temporal and / or spatial series files | |
| CN103674838B (en) | A kind of fish fats content distribution detection method based on high light spectrum image-forming technology | |
| CN103674864B (en) | A kind of fish water content distribution detection method based on high light spectrum image-forming technology | |
| Lin et al. | Calibration set selection method based on the “M+ N” theory: application to non-invasive measurement by dynamic spectrum | |
| JP2006267111A (en) | Method for processing a set of spectra, in particular NMR spectra | |
| Karaman et al. | Sparse multi-block PLSR for biomarker discovery when integrating data from LC–MS and NMR metabolomics | |
| CN106018331B (en) | The method for estimating stability and pretreatment optimization method of multi-channel spectral system | |
| Chen et al. | FT-NIR spectroscopy and Whittaker smoother applied to joint analysis of duel-components for corn | |
| CN103472028A (en) | Method for determining content of components in blended fiber | |
| CN106951720A (en) | Soil nutrient model transfer method based on canonical correlation analysis and linear interpolation | |
| US9400868B2 (en) | Method computer program and system to analyze mass spectra | |
| CN112860577A (en) | Uncertainty evaluation method of measurement result | |
| de Souza et al. | Validation of the near infrared spectroscopy method for determining soil organic carbon by employing a proficiency assay for fertility laboratories | |
| JP2018504709A (en) | Automatic quantitative regression | |
| CN103868882A (en) | Method for determining contents of various components in asphalt | |
| WO2017169444A1 (en) | Solution analysis system | |
| JP6224152B2 (en) | Solution analysis system | |
| Zhao et al. | Rapid detection of benzoyl peroxide in wheat flour by using Raman scattering spectroscopy | |
| CN109063767A (en) | A kind of near infrared spectrum modeling method known together based on sample and variable | |
| EP3767280B1 (en) | Method for estimating production location | |
| Flåten et al. | Using design of experiments to select optimum calibration model parameters | |
| CN101140225B (en) | Method for detecting lead in scenting agent with AOTF near-infrared spectrometer | |
| US10852228B2 (en) | Calibration apparatus, calibration curve creation method, and independent component analysis method | |
| US10488329B2 (en) | Calibration apparatus, calibration curve creation method, and independent component analysis method | |
| JP2002506991A (en) | Automatic calibration method |
Legal Events
| Date | Code | Title | Description |
|---|---|---|---|
| NENP | Non-entry into the national phase | Ref country code:DE | |
| 121 | Ep: the epo has been informed by wipo that ep was designated in this application | Ref document number:17773989 Country of ref document:EP Kind code of ref document:A1 | |
| 122 | Ep: pct application non-entry in european phase | Ref document number:17773989 Country of ref document:EP Kind code of ref document:A1 |