WO2010073582A1 - Image enlarging device, method, integrated circuit, and program - Google Patents
Image enlarging device, method, integrated circuit, and programDownload PDFInfo
- Publication number
- WO2010073582A1 WO2010073582A1PCT/JP2009/007054JP2009007054WWO2010073582A1WO 2010073582 A1WO2010073582 A1WO 2010073582A1JP 2009007054 WJP2009007054 WJP 2009007054WWO 2010073582 A1WO2010073582 A1WO 2010073582A1
- Authority
- WO
- WIPO (PCT)
- Prior art keywords
- image
- resolution image
- unit
- interpolation
- pixel
- Prior art date
Links
Images


Classifications
- H—ELECTRICITY
- H04—ELECTRIC COMMUNICATION TECHNIQUE
- H04N—PICTORIAL COMMUNICATION, e.g. TELEVISION
- H04N1/00—Scanning, transmission or reproduction of documents or the like, e.g. facsimile transmission; Details thereof
- H04N1/40—Picture signal circuits
- H04N1/40068—Modification of image resolution, i.e. determining the values of picture elements at new relative positions
- G—PHYSICS
- G06—COMPUTING OR CALCULATING; COUNTING
- G06T—IMAGE DATA PROCESSING OR GENERATION, IN GENERAL
- G06T3/00—Geometric image transformations in the plane of the image
- H—ELECTRICITY
- H04—ELECTRIC COMMUNICATION TECHNIQUE
- H04N—PICTORIAL COMMUNICATION, e.g. TELEVISION
- H04N7/00—Television systems
- H04N7/01—Conversion of standards, e.g. involving analogue television standards or digital television standards processed at pixel level
- H04N7/0117—Conversion of standards, e.g. involving analogue television standards or digital television standards processed at pixel level involving conversion of the spatial resolution of the incoming video signal
- H04N7/012—Conversion between an interlaced and a progressive signal
- G—PHYSICS
- G09—EDUCATION; CRYPTOGRAPHY; DISPLAY; ADVERTISING; SEALS
- G09G—ARRANGEMENTS OR CIRCUITS FOR CONTROL OF INDICATING DEVICES USING STATIC MEANS TO PRESENT VARIABLE INFORMATION
- G09G2320/00—Control of display operating conditions
- G09G2320/02—Improving the quality of display appearance
- G09G2320/0242—Compensation of deficiencies in the appearance of colours
- G—PHYSICS
- G09—EDUCATION; CRYPTOGRAPHY; DISPLAY; ADVERTISING; SEALS
- G09G—ARRANGEMENTS OR CIRCUITS FOR CONTROL OF INDICATING DEVICES USING STATIC MEANS TO PRESENT VARIABLE INFORMATION
- G09G2340/00—Aspects of display data processing
- G09G2340/04—Changes in size, position or resolution of an image
- G09G2340/0407—Resolution change, inclusive of the use of different resolutions for different screen areas
- G—PHYSICS
- G09—EDUCATION; CRYPTOGRAPHY; DISPLAY; ADVERTISING; SEALS
- G09G—ARRANGEMENTS OR CIRCUITS FOR CONTROL OF INDICATING DEVICES USING STATIC MEANS TO PRESENT VARIABLE INFORMATION
- G09G5/00—Control arrangements or circuits for visual indicators common to cathode-ray tube indicators and other visual indicators
- H—ELECTRICITY
- H04—ELECTRIC COMMUNICATION TECHNIQUE
- H04N—PICTORIAL COMMUNICATION, e.g. TELEVISION
- H04N7/00—Television systems
- H04N7/01—Conversion of standards, e.g. involving analogue television standards or digital television standards processed at pixel level
- H04N7/0125—Conversion of standards, e.g. involving analogue television standards or digital television standards processed at pixel level one of the standards being a high definition standard
- H—ELECTRICITY
- H04—ELECTRIC COMMUNICATION TECHNIQUE
- H04N—PICTORIAL COMMUNICATION, e.g. TELEVISION
- H04N7/00—Television systems
- H04N7/01—Conversion of standards, e.g. involving analogue television standards or digital television standards processed at pixel level
- H04N7/0135—Conversion of standards, e.g. involving analogue television standards or digital television standards processed at pixel level involving interpolation processes
- H04N7/0142—Conversion of standards, e.g. involving analogue television standards or digital television standards processed at pixel level involving interpolation processes the interpolation being edge adaptive
Definitions
- the present inventionrelates to a display device that enlarges an input low-resolution image in accordance with the resolution of a display device, an image output device such as a printer that enlarges and outputs a low-resolution image, and one image in a moving image.
- the present inventionrelates to an image enlarging method performed by an apparatus for increasing the resolution of a low-resolution image, such as an imaging apparatus that generates a still image by enlarging the image.
- Typical techniquesinclude the nearest neighbor method, the bilinear method, and the bicubic convolution method disclosed in Non-Patent Document 1.
- the nearest neighbor methoda pixel having a low resolution closest to the interpolation pixel position is selected, and an interpolation pixel value is determined.
- the bilinear methodthe interpolation pixel value is determined by performing linear interpolation based on the distance between the interpolation pixel position and the four pixels of the low-resolution image surrounding the interpolation pixel position.
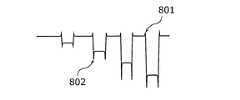
- FIG. 8is a diagram of an example in which overshoot and undershoot occur due to edge enhancement.
- the level value of a part of the horizontal line of the imageis cut out, and it can be seen that an overshoot 801 and an undershoot 802 are generated around the edge.
- the edge enhancement by the high frequency enhancement filteris performed, the image is sharp, but as a side effect, there is a problem that the image is visually deteriorated such as the periphery of the edge of the image is shining. .
- FIG. 48is a diagram showing the technique of Patent Document 1.
- FIG. 48is a diagram showing the technique of Patent Document 1.
- Patent Document 1A means for solving the side effect of edge enhancement in resolution conversion is disclosed in Patent Document 1.
- Patent Document 1A means for solving the side effect of edge enhancement in resolution conversion is disclosed in Patent Document 1.
- reference numeral 2901denotes an original image (input image) of a low resolution image to be subjected to resolution conversion.
- Reference numeral 2902denotes information about interpolation processing related to resolution conversion, such as the number of pixels to be interpolated.
- Reference numeral 2903denotes an enhancement coefficient determination unit that determines filter coefficients for performing edge enhancement based on the information 2902.
- Reference numeral 2904denotes an edge-enhanced image generation unit that performs edge enhancement using the determined enhancement coefficient.
- Reference numeral 2905denotes an interpolation pixel generating unit that generates an interpolation pixel by interpolating a pixel value at a specified position from an edge-enhanced low-resolution image.
- Reference numeral 2906denotes a comparison unit that compares the target pixel of the input image 2901 with the output value of the interpolation pixel generation unit 2905 and outputs a value indicating the degree of weighting of each pixel value according to the comparison result. is there.
- Reference numeral 2909denotes information for designating a range of peripheral pixels of the target pixel for detecting the maximum value and the minimum value of the pixel values.
- the comparison unit 2906calculates a value indicating the degree of weighting based on the information 2909.
- the weighting / composing unit 2907then weights the target pixel on the low-resolution image input from the input image 2901 and the output of the interpolation pixel generating unit 2905 according to the weighting output from the comparison unit 2906.
- itis a synthesis unit that performs synthesis.
- the maximum value and minimum value detection pixel range (information 2909) input to the comparison unit 2906is n.
- a pixel value having the maximum level from the pixels in the range of the neighboring pixel positions (i ⁇ n + 1, j ⁇ n + 1) to (i + n, j + n)is detected, and the maximum value and the minimum value are passed to the weighting synthesis unit 2907 as weighting coefficients.
- the weighting synthesis unit 2907calculates an output pixel based on the weighting coefficient that is the output of the comparison unit 2906.
- Pi, jis set when the output Pi, j of the interpolation pixel generation unit 2905 is within the range between the maximum value and the minimum value, and the maximum when Pi, j is larger than the maximum value.
- the minimum valueis output.
- Patent Document 1has the following drawbacks.
- Oneis that after the edge enhancement is performed by the edge enhancement image generation unit 2904 and the interpolation interpolation is performed by the interpolation pixel generation unit 2905, the expansion interpolation process is affected by the noise component enhanced by the edge enhancement. It is a problem.
- the otheris a problem that occurs because values are cut at the maximum and minimum values around the pixel of interest.
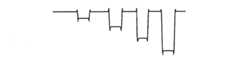
- FIG. 9is an image diagram of an image signal processed by the technique of Patent Document 1.
- FIG. 9shows the level value of a part of the horizontal line of the image cut out as in FIG.
- no overshoot or undershoot (overcorrection) as shown in FIG. 8occurs and the edge angle is steep, but in the case of a natural image, this signal is an unnatural image.
- a fine texture portionsuch as turf or leaves is such a signal, it becomes a solid oil painting and unnatural picture by subjective evaluation.
- Patent Document 1when the technique of Patent Document 1 is applied to a natural image, there is no choice but to reduce the degree of edge enhancement by reducing the coefficient in the enhancement coefficient determination unit 2903 so that it does not become unnatural. In this case, since the inclination of the edge portion does not stand up sufficiently, the reduction effect of reducing blur due to enlargement becomes small.
- a first object of the present inventionis to provide a natural and low-blurring enlargement process by suppressing blurring that occurs during resolution conversion and suppressing generation of unnatural edges during edge correction.
- Patent Document 1has the following drawbacks.
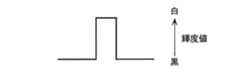
- FIG. 49is an image diagram of an image signal processed by the technique of Patent Document 1.
- the upper and lower portionsindicate signal level values, and the upper portion is white and the lower portion is black.
- the horizontal directionindicates the pixel position.
- FIG. 50shows an example in which the same part as FIG. 49 is enlarged by linear interpolation.
- the edgeis sharpened, and no overshoot or undershoot is generated.
- the sloped portion in FIG. 50is white or black, and white and black are thick.
- both black and whiteare thicker by the same width, but humans feel that white is thicker.
- whiteis an expanded color, and humans feel that white ones are larger than white ones of the same size.
- Thisis a phenomenon generally known as human visual characteristics. For example, in order to make it look the same in the case of a meteorite used for Go, the white stone is made smaller by about 0.3 mm. Thus, when the bright color and the dark color have the same thickness, the brighter one gets a thicker impression. This is particularly noticeable in enlargement processing.
- the present inventionhas been made in view of the above problems, and a second object of the present invention is to provide an enlargement process that suppresses the appearance of white visually appearing when the edges are sharply corrected in the enlargement process.
- an image enlarging apparatusis an image enlarging apparatus that inputs a low resolution image and outputs a high resolution image that is higher in resolution than the low resolution image.
- An interpolation unitthat inputs and generates an interpolated image having the number of pixels of the high-resolution image; and a feature-value analyzing unit that analyzes a feature amount of the low-resolution image and outputs the feature amount for each pixel of the high-resolution image;
- a correction amount calculation unitthat inputs the feature amount output by the feature amount analysis unit and the low-resolution image and calculates a correction amount for each pixel of the high-resolution image; and a calculation by the correction amount calculation unit
- the correction unit and the interpolation image generated by the interpolation unitto generate a first high-resolution image; and the first high-resolution output from the combination unit
- the feature amount analysis unit Recorrectionis performed again using the feature amount generated, and the corrected second high-resolution image is generated, and the generated second high-resolution image
- this image enlargement apparatusmay have a part or all of technical matters such as the following image enlargement apparatus A1.
- the image enlarging apparatus A1includes an interpolation unit that generates a temporary high-resolution image by interpolation in a process of enlarging and generating a high-resolution image from a low-resolution image; From the resolution image, extract the feature amount according to the strength of the inclination, and calculate the feature amount corresponding to each pixel of the high resolution image, and adjust the correction amount of the edge component by the feature amount,
- a correction amount calculation unitthat outputs a correction amount corresponding to each pixel of the high resolution image, a high resolution image generated by the interpolation unit, a synthesis unit that combines the correction amount calculated by the correction amount calculation unit, and a feature amount
- the correction value of each pixel of the high resolution image synthesized by the synthesis unitis determined, and the result of the correction again is output as a high resolution image.
- the correction amount calculated by the correction amount calculation unitis too large, and the portion where the overshoot or undershoot has occurred in the edge portion (overcorrection component) can be adjusted again. It is possible to generate a natural enlarged image with clear and few shoots.
- the feature values output by the feature value analysis unitare the tilt amount, the upper limit threshold value, and the lower limit threshold value.
- the amount of correctionis small and the amount of inclination is medium
- an adjustmentsuch as increasing the correction amount is possible in a portion such as turf.
- the upper and lower thresholdsas feature values, it becomes easier to identify the parts where overshoots and undershoots occur (overcorrected parts), and these shoots can be corrected appropriately. It becomes possible.
- the first inclination amount input to the correction amount calculation unitis different from the second inclination amount input to the recorrection unit. Accordingly, the correction amount calculation unit that determines the edge enhancement amount and the recorrection unit that suppresses the chute at the edge portion can be operated according to different standards. For example, edge enhancement is performed by setting the first inclination amount to the inclination of the portion corresponding to the edge of the narrow image portion, and the second inclination amount to the inclination corresponding to the inclination amount of the edge of the wide portion of the image. Is performed only in the vicinity of the edge, and the chute suppression process can be performed in a wide area around the edge.
- the image enlarging device B1includes an interpolation unit that generates a temporary high-resolution image by interpolation in a process of enlarging and generating a high-resolution image from a low-resolution image; From the resolution image, extract the feature amount according to the strength of the inclination, and calculate the feature amount corresponding to each pixel of the high resolution image, and adjust the correction amount of the edge component by the feature amount, A correction amount calculation unit that outputs a correction amount corresponding to each pixel of the high-resolution image, a high-resolution image generated by the interpolation unit, a synthesis unit that combines the correction amounts calculated by the correction amount calculation unit, and interpolation generation by interpolation Using the pixel value of the high-resolution image and the threshold value calculated from the feature amount, the correction value of each pixel of the high-resolution image synthesized by the synthesis unit is determined, and the result of the correction again is used as the high-resolution image. Output.
- the correction amount calculated by the correction amount calculation unitis too large, and a portion where an overshoot or undershoot has occurred in the edge portion (overcorrection component) can be adjusted again, clearly. Moreover, a natural enlarged image with few shoots can be generated.
- the feature values output by the feature value analysis unitare the tilt amount, the upper limit threshold value, and the lower limit threshold value.
- the amount of correctionis small and the amount of inclination is medium
- an adjustmentsuch as increasing the correction amount is possible in a portion such as turf.
- the upper and lower thresholdsas feature values, it becomes easier to identify overshoot and undershoot parts (overcorrection components) and correct these shoots appropriately. It becomes possible.
- the difference between the upper and lower thresholds of the pixel of the high resolution image output from the feature amount analysis unit and the pixel value of the high resolution image output from the interpolation unitis calculated, and the synthesis unit
- the output pixel value exceeds a threshold determined from the difference between the upper and lower threshold values and the pixel value output from the interpolation unitthe pixel value output from the synthesis unit is corrected, and the result Is output.
- the image enlarging apparatus C1determines the first interpolated pixel position corresponding to each pixel of the high resolution image in the process of enlarging and generating the high resolution image from the low resolution image.
- An interpolation pixel position generation unitto generate, an interpolation unit to generate an interpolation pixel corresponding to the first interpolation pixel position, and a low-resolution image and a change in pixel values around the interpolation pixel position from the first interpolation pixel position
- a white thinning unitthat corrects the interpolation pixel position to generate a second interpolation pixel position, a correction amount calculation unit that calculates a correction amount corresponding to the second interpolation pixel position, and a pixel value interpolated by the interpolation unit
- a combining unitthat combines the correction amounts to generate an output pixel value.
- the interpolation pixel positionis changed from the first interpolation pixel position, so that the edge emphasis center is shifted, and as a result Bright parts, especially white can be thinned.
- an interpolation pixel position generation unitthat generates a first interpolation pixel position corresponding to each pixel of the high-resolution image;
- An interpolation unitthat generates an interpolation pixel corresponding to the interpolation pixel position, a feature amount analysis unit that calculates a feature amount corresponding to the first interpolation pixel position, an interpolation pixel position from the low-resolution image and the first interpolation pixel position
- a white thinning unitthat generates a second interpolation pixel position by correcting an interpolation pixel position according to a change in peripheral pixel values;
- a correction amount calculation unitthat calculates a correction amount corresponding to the second interpolation pixel position;
- a combination unitthat combines the pixel value interpolated by the interpolation unit and the correction amount to generate a combined pixel value, and a re-correction unit that correct
- the second inventioncan generate an image with less overshoot and undershoot in addition to the first invention.
- overshoot and undershootare recorrected, the edges become flat and the white line appears to be thicker.
- the correction amountis calculated using the second interpolation pixel position calculated in white thinning, Since the color near white is thinned, white can be prevented from appearing thick.
- the second interpolation pixel position corrected by the white thinning unitis also used in the calculation of the feature amount.
- the control position of the recorrection processis also shifted according to the second interpolation pixel position, so that the thickness of the white line can be finely controlled.
- the correction amount calculated by the correction amount calculation unitcan be adjusted again for a portion in which an edge portion has an overshoot or undershoot because the correction amount is too large. A natural enlarged image with few shoots can be generated.
- FIG. 1is a configuration diagram of an image enlargement unit according to Embodiment A1.
- FIG. 2is a configuration diagram of a system equipped with an image enlargement unit.
- FIG. 3is a diagram illustrating coefficients of the inclination detection filter in the embodiment A1.
- FIG. 4is a diagram illustrating coefficients of the inclination detection filter in the embodiment A1.
- FIG. 5is a diagram illustrating a first example of a Laplacian filter used for edge extraction.
- FIG. 6is a diagram illustrating a second example of a Laplacian filter used for edge extraction.
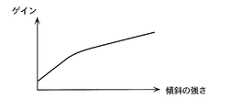
- FIG. 7is a diagram illustrating a graph for gain calculation in the embodiment A1.
- FIG. 8is a diagram illustrating an image in which a chute has occurred.
- FIG. 8is a diagram illustrating an image in which a chute has occurred.
- FIG. 9is a diagram showing an example in which the occurrence of shoots is suppressed by the conventional technique.
- FIG. 10is a diagram illustrating an example in which the occurrence of shoots is suppressed.
- FIG. 11Ais a diagram illustrating an example of an output image in the embodiment A1.
- FIG. 11Bis a diagram illustrating an example of an output image in the embodiment A1.
- FIG. 11Cis a diagram illustrating an example of an output image in the embodiment A1.
- FIG. 11Dis a diagram illustrating an example of an output image in the embodiment A1.
- FIG. 12is a block diagram when a YCbCr signal is input in the embodiment A1.
- FIG. 13is a block diagram when a YCbCr signal is input in the embodiment A1.
- FIG. 14is a block diagram when inputting RGB signals in the embodiment A1.
- FIG. 15is a configuration diagram of the image enlargement apparatus according to Embodiment A2.
- FIG. 16is a diagram illustrating an example of a pixel position at the time of double enlargement according to Embodiment A2.
- FIG. 17is a flowchart of Embodiment A2.
- FIG. 18is a configuration diagram of the image enlargement unit of Embodiment A2.
- FIG. 19is a configuration diagram of the feature amount analysis unit according to Embodiment A2.
- FIG. 20is a diagram illustrating block division of 4 ⁇ 4 pixels into 2 ⁇ 2 pixels according to Embodiment A2.
- FIG. 21is a diagram illustrating region determination according to the embodiment A2.
- FIG. 21is a diagram illustrating region determination according to the embodiment A2.
- FIG. 22Ais a diagram illustrating area division for region determination in Embodiment A2.
- FIG. 22Bis a diagram illustrating area division for region determination in Embodiment A2.
- FIG. 22Cis a diagram illustrating area division for region determination in Embodiment A2.
- FIG. 22Dis a diagram illustrating area division for region determination in Embodiment A2.
- FIG. 23is a configuration diagram of a correction amount calculation unit according to Embodiment A2.
- FIG. 24is an explanatory diagram of the interpolation positions px and py according to Embodiment A2.
- FIG. 25is a diagram for explaining interpolation in the embodiment A2.
- FIG. 26is a relationship diagram between grad0 and the gain in the embodiment A2.
- FIG. 27is a diagram illustrating the relationship between grad1 and gain in Embodiment A2.
- FIG. 28is a relationship diagram between grad1 and the clip value in the embodiment A2.
- FIG. 29is a configuration diagram of an image enlargement unit of Embodiment B1.
- FIG. 30Ais a diagram illustrating an example of processing of the re-correction unit in the embodiment B1.
- FIG. 30Bis a diagram illustrating an example of processing of the re-correction unit in the embodiment B1.
- FIG. 31is a configuration diagram of an image enlargement unit of Embodiment B2.
- FIG. 32Ais a diagram for explaining the difference in output waveform due to the constant E.
- FIG. 32Bis a diagram illustrating the difference in output waveform due to the constant E.
- FIG. 32Ais a diagram for explaining the difference in output waveform due to the constant E.
- FIG. 32Cis a diagram illustrating the difference in output waveform due to the constant E.
- FIG. 33is a configuration diagram of the image enlargement unit of the embodiment C1.
- FIG. 34is a flowchart of the process performed by the interpolation pixel position generation unit according to Embodiment C1.
- FIG. 35is a flowchart of the process of the white thinning unit according to Embodiment C1.
- FIG. 36is a first diagram illustrating an example of an output image in the embodiment C1.
- FIG. 37is a second diagram illustrating an example of an output image in the embodiment C1.
- FIG. 38is a configuration diagram of the image enlargement apparatus according to Embodiment C2.
- FIG. 39is a configuration diagram of the image enlargement unit of the embodiment C2.
- FIG. 40is a configuration diagram of the white thinning section of the embodiment C2.
- FIG. 41is a diagram illustrating a correction direction of the white thinning unit according to Embodiment C2.
- FIG. 42is a diagram illustrating the oblique direction correction of the white thinning unit in the embodiment C2.
- FIG. 43is a configuration diagram of a feature amount analysis unit according to Embodiment C2.
- FIG. 44is a configuration diagram of the correction amount calculation unit of the embodiment C2.
- FIG. 45is a diagram illustrating a recorrection unit and data processed by the recorrection unit.
- FIG. 46is a flowchart of processing in the embodiment C.
- FIG. 47is a diagram illustrating data processed in the embodiment C.
- FIG. 48is a configuration diagram of a conventional image enlargement apparatus.
- FIG. 49is a diagram illustrating an example of an output signal of a conventional image enlargement apparatus.
- FIG. 50is a diagram of an example of an output signal when enlarged by linear interpolation processing.
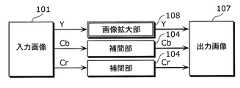
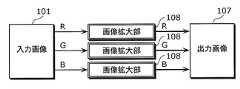
- the image enlargement apparatus 108includes an image enlargement apparatus 108A (FIG. 1 and the like) according to Embodiment A, an image enlargement apparatus 108B (FIG. 29 and the like) according to Embodiment B, and an image enlargement apparatus 108C according to Embodiment C. (FIG. 33 etc.) is a superordinate concept of each image enlarging device.
- the image enlarging device 108(such as the image enlarging device 108A) according to the embodiment inputs a low-resolution image (input image 101) and outputs a high-resolution image (output image 107) having a higher resolution than the low-resolution image.
- An image enlarging apparatuswherein the low-resolution image is input, and an interpolation unit (such as the interpolation unit 104) that generates an interpolation image (such as the interpolation image OL in FIG. 18) having the number of pixels of the high-resolution image; Analyzing a feature quantity of the image and outputting the feature quantity (grad1, grad0, MIN, MAX, etc. in FIG.
- a correction amount calculation unit(a correction amount calculation unit 103 or the like) that inputs the feature amount output by the feature amount analysis unit and the low resolution image and calculates a correction amount for each pixel of the high resolution image. ) And the correction amount calculated by the correction amount calculation unit and the interpolation image generated by the interpolation unit, the first high-resolution image (FIG. 11B, one-dot chain line in the lower part of FIG. 45) And the first high-resolution image output by the combining unit using the feature amount generated by the feature amount analyzing unit again.
- a corrected second high-resolution image(FIG. 11D, solid line data at the bottom of FIG. 45, etc.) is generated, and the generated second high-resolution image is output from the image enlargement apparatus.
- An image enlargement apparatusincluding a correction unit (such as a re-correction unit 106).
- Embodiment Aincludes embodiment A1 and embodiment A2.
- FIG. 1is a block diagram of an image enlargement unit (image enlargement apparatus) 108A according to Embodiment A1.
- image enlargement unit 108Ais one of the subordinate concepts of the image enlargement device 108 (described above).
- reference numeral 101denotes a low resolution input image (original image, low resolution image).
- Reference numeral 102denotes a feature amount analysis unit that outputs a feature amount corresponding to each pixel of the high resolution image (output image, second high resolution image) 107 output from the low resolution input image by the image enlargement unit 108A. is there.
- 103calculates the correction amount of the edge component in accordance with the feature amount output from the feature amount analysis unit 102, that is, calculates the correction amount of each pixel of the high-resolution image 107 to be output. Is a correction amount calculation unit that outputs.
- Reference numeral 104denotes an interpolation unit that inputs the low-resolution input image 101 and generates an image (interpolated image) having the same number of pixels as the high-resolution image 107 to be output.
- 105receives the pixel of the high-resolution image (interpolated image) output from the interpolation unit 104, and also receives the correction amount corresponding to the pixel from the correction amount calculation unit 103.
- the combining unitoutputs the first corrected pixel (first high-resolution image) after correction (first correction).
- Reference numeral 106denotes a combination result (first corrected pixel) output by the combining unit 105 based on the feature amount corresponding to the first corrected pixel output from the combining unit 105 received from the feature amount analysis unit 102.
- the re-correction unitperforms re-correction (second correction) and outputs the second corrected pixel (second high-resolution image).
- Reference numeral 107denotes an output high-resolution image (second high-resolution image).
- Reference numeral 108Adenotes a high-resolution image 107 (second high-resolution image) obtained by inputting the low-resolution image 101 and enlarging the input low-resolution image 101.
- An image enlargement unitthat outputs (image).
- the image enlargement unit 108Amay specifically be an integrated circuit.
- Each of the feature amount analysis unit 102 and the likemay be a functional block (circuit) mounted on the integrated circuit.
- the image enlargement unit 108Amay be a computer.
- Each functional blockmay be a functional block of a function realized by executing software by the computer.
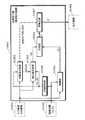
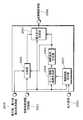
- FIG. 2shows an example of a system incorporating the image enlargement unit 108A.
- reference numeral 201denotes an input unit for inputting an image.
- a tuner 202inputs a TV signal to the input unit 201.
- Reference numeral 203denotes an external terminal for inputting video to the input unit 201.
- Reference numeral 204denotes a memory card such as an SD card on which moving images and still images are recorded.
- Reference numeral 205denotes a memory such as a DRAM used as a primary storage device of this system.
- a processor 206controls the entire system.
- Reference numeral 207denotes a decoding unit that decodes an image input by the input unit 201 when the image is a compressed image.
- a display unit 208outputs the decoded image to the video driver 209.
- Reference numeral 209denotes a video driver for outputting an image output from the display unit 208 to a display device 211 such as liquid crystal, plasma, or CRT.
- Reference numeral 210denotes a hard disk (HDD) that is a secondary storage device that stores images and the like.
- HDDhard disk
- a compressed image input from the input unit 201 or stored in the hard disk 210is sent to the decoding unit 207 under the control of the processor 206, and after being decoded by the decoding unit 207, directly or directly in the memory.
- the display unit 208converts the received format of the decoded image (the input image 101 in FIG. 1) into a format suitable for the display device 211, and converts the converted image (the output image 107) into the video driver 209.
- the video driver 209displays the output image 107 sent to the display device 211.
- 1is implemented as a process (function block) for enlarging the input image 101 on the output image 107 having the resolution of the display device 211 in the display unit 208, for example.
- itis implemented as a software process (function block) in the processor 206.
- the enlarged imagecan be encoded again, and the encoded image can be used for writing back to the hard disk 210 or the like.
- the feature amount analysis unit 102calculates and outputs the feature amount for each enlarged pixel output from the interpolation unit 104 (S462 in FIG. 46). That is, the feature amount of each pixel of the enlarged high-resolution image is calculated.
- the data to be output as the feature amountis the position around the position in the high resolution image corresponding to the interpolation pixel position (high definition position) where the interpolation unit 104 performs interpolation (position of the low resolution image, low definition position).
- the strength of the inclinationfor example, grad0 and grad1 in FIG. 18
- the upper limit value and the lower limit valueMIN, MAX
- the feature amountincludes the strength of the inclination and the upper limit value and the lower limit value specified from the low-resolution image.
- FIG. 3is a diagram showing an example of a differential filter in the horizontal direction for detecting a vertical line.
- FIG. 4is a diagram showing an example of a differential filter in the vertical direction for detecting a horizontal line.
- the largest pixel valueis set as the upper limit value and the smallest value is set as the lower limit value in the low-resolution image n ⁇ n pixels around the interpolation pixel position (low-definition position).
- the strength of the gradient, the upper limit value, and the lower limit valueare calculated and output by the feature amount analysis unit 102 as feature amounts.
- the correction amount calculation unit 103calculates a correction amount according to the edge degree of the pixel corresponding to the interpolation pixel position (S463 in FIG. 46).
- the correction amount calculation unit 103first calculates an edge component of the low-definition position using each pixel value of the low-resolution input image 101 corresponding to the periphery of the interpolation pixel position (low-definition position). At this time, the high-definition position corresponding to the edge portion in the low-resolution image is specified from the plurality of high-definition positions.
- FIG. 5is a diagram showing a first example of a Laplacian filter.
- FIG. 6is a diagram illustrating a second example of a Laplacian filter.
- edge component extraction methoda method using a Laplacian filter shown in FIG. 5 or 6 is used.
- a pixel at an interpolated pixel position(a high-definition position, for example, a position of a decimal coordinate value) in a high-resolution image does not exist in a low-resolution image (for example, only pixels having integer coordinate values). For this reason, when these filters are applied, a pixel (integer coordinate value position) in the vicinity of the same position as the interpolation pixel position (high-definition position) (for example, a decimal coordinate position in the low-resolution image) is provided. 3 ⁇ 3 filter processing centering on).
- the edge componentis extracted, that is, after the high-definition position of the edge portion is specified, the edge component is extracted using the strength of the inclination calculated by the feature amount analysis unit 102 (feature amount, for example, grad0 in FIG. 18). Calculate the degree of edge enhancement.
- FIG. 7is a diagram illustrating an example of gain in the case where the amount of gain to be applied to the extracted edge component is adjusted according to the strength of the inclination (feature amount).
- the correction amountis increased in the portion where the inclination is strong, and the correction amount is decreased in the portion where the inclination is small.
- the correction amountis increased in the portion where the inclination is strong, and the correction amount is decreased in the portion where the inclination is small.
- the correction amount calculation unit 103extracts an edge component from the low resolution image, and outputs a correction amount corresponding to each pixel of the high resolution image, the magnification of which is adjusted by a gain according to the strength of the inclination.
- the correction amount calculation unit 103calculates the correction amount of the high-definition position where the edge is emphasized by being added to the high-definition position.
- the interpolating unit 104interpolates a high-resolution image (for example, the interpolated image OL in FIG. 18 and FIG. 11A) from the low-resolution image (input image 101) using a bilinear method, a bicubic convolution method, or the like. It is generated by enlargement (S461 in FIG. 46). In addition, since these general expansion techniques are not the gist of the embodiment, detailed description thereof is omitted. As the interpolation unit 104, it is possible to use a conventional enlarged interpolation technique.
- a high resolution image (interpolated image) before edge enhancementis calculated from the low resolution image by the interpolation unit 104.
- the correction amount (difference value) corresponding to each pixel of the high-resolution image calculated by the correction amount calculation unit 103is added to the high-resolution image (interpolated image, FIG. 11A) generated by the interpolation unit 104.
- an image in which the edge is emphasized(first high-resolution image, data of a one-dot chain line in the lower part of FIG. 11B and FIG. 45) is generated (S464 in FIG. 46).
- an image including an overshoot and undershoot (overcorrection component in edge enhancement) as shown in FIG. 8is generated.
- the re-correction unit 106performs re-correction (second correction) on the high-resolution image (the data indicated by the alternate long and short dash line in FIG. 11B and FIG. 45) after the edge enhancement, and the second correction is performed.
- the high-resolution image (solid line data in FIG. 11D and FIG. 45) after calculationis calculated by the recorrection unit 106.
- the output pixel value of the combining unit 105is Xx, y, the upper limit value is Ux, y, and the lower limit at the pixel position (x, y) of the high-resolution image (FIG. 11B, the one-dot chain line in FIG. 45) after edge enhancement.
- the re-correction unit 106calculates the first correction value Px, y (broken line data) by the following calculation (see the upper part of FIG. 45) (FIG. 46).
- Cis a constant within a range of 0.0 to 1.0, which is set in advance in the C multiple value calculation unit 1061.
- each of the four horizontal lines in FIG. 45shows the values at the maximum points of Xx and y as an example.
- the portion exceeding the upper limit value (Ux, y) and the lower limit value (Lx, y)is multiplied by C, and Px, y multiplied by C (Data shown by broken lines in FIG. 11C and FIG. 45) is calculated.
- Cis set to 1.0 or less, as a result, the second correction is performed on the portion exceeding the upper limit and the lower limit (overcorrection component), and becomes smaller.
- the re-correction unit 106further corrects the first correction value Px, y (data shown by the broken line in FIG. 11C and FIG. 45) by the calculation of the following (Equation A2), and the second correction value P 'x, y (data shown by solid lines in FIG. 11D and FIG. 45) is calculated (S465B (S465c) in FIG. 46, threshold clip unit 1062 in FIG. 45).
- Tis a preset constant.
- min (a, b)is a function that selects the smaller one of a and b.
- the configuration of the re-correction unit 106 shown in the upper part of FIG. 45that is, the configuration having two parts of the C-fold value calculation unit 1061 and the threshold clip unit 1062, is merely an example, and other configurations are adopted. May be.
- Equation A2converts overshoot and undershoot components exceeding T to T. That is, the portion of the shoot (overshoot or undershoot) exceeding the constant T is clipped (clipped) and removed.
- the re-correction unit 106outputs the second correction value P′x, y (data in FIG. 11D, solid line in FIG. 45) (S465d in S465B in FIG. 46, threshold clip unit 1062 in FIG. 45).
- the re-correction unit 106for example, for each of a plurality of pixels of the high-resolution image (first high-resolution image) generated by the combining unit 105 after the edge is emphasized, (Xx, This processing (S465a to S465d in FIG. 46) is performed for y). As a result, a re-corrected high-resolution image (second high-resolution image) in which the plurality of pixels are corrected again is generated.
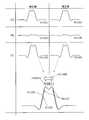
- FIG. 11A to 11Dare diagrams showing images in the image enlargement unit 108.
- FIG. 11A to 11Dare diagrams showing images in the image enlargement unit 108.
- FIG. 11is the figure which observed the pixel value of the specific horizontal direction of the image like FIG.8,9,10, and a horizontal axis shows a horizontal pixel position and a vertical axis
- shaftshows each horizontal pixel position. The pixel value in is shown.
- FIG. 11Ais an image (interpolated image) that is interpolated and enlarged by the interpolation unit 104 by the bicubic convolution method. Since the processing of the bicubic convolution method includes an edge-emphasized component, a slight shoot component is generated in the vicinity of the edge as shown in FIG. 11A.
- FIG. 11Bis an image (first high-resolution image, one-dot chain line and Xx, y in FIG. 45) to which the output of the correction amount calculation unit 103 has been added by the synthesis unit 105. At this point, a larger chute is generated around the edge than in FIG. 11A.
- the one-dot chain line, the broken line, and the solid line graph in the lower part of FIG. 45are schematic views of the graphs of FIGS. 11B, 11C, and 11D, respectively. Refer to FIG. 11B etc. suitably about the detail of each graph of the lower stage of FIG.
- FIG. 11Cshows the result of applying the processing of (Equation A1) with C being 0.25 (dashed line data, Px, y in FIG. 45). As shown in FIG. 11C, it can be seen that the shoot component is smaller than that of FIG. 11B and the sharpness of the edge is larger than that of FIG. 11A.
- T4 (solid line data in FIG. 45, P′x, y).
- FIG. 11Dit can be seen that only a part of the remaining portion of the chute remaining in FIG. 11C is clipped, and the entire image is not removed, and the image is similar to the signal of FIG. 11A.
- the blurring of the edgeis suppressed because the sharpness of the edge is larger than that in FIG. 11A.
- FIG. 11Dsince the shoot component remains, an unnatural solid picture is not produced, and shoots around the edge are suppressed.
- Embodiment A1blurring due to enlargement processing (see FIG. 11A) is reduced by edge enhancement (see data of the dashed-dotted line, broken line, and solid line in FIGS. 11B to 11D and 45).
- edge enhancementsee data of the dashed-dotted line, broken line, and solid line in FIGS. 11B to 11D and 45.
- FIG. 11Dsolid line data P′x, y in FIG. 11D
- a natural videocan be displayed without losing the sharpness of the video.
- the image enlargement device 108(image enlargement device 108A) includes an interpolation unit (interpolation unit 104), an edge enhancement unit (combination unit 105), and a recorrection unit (recorrection unit 106).
- the interpolation unitcalculates a high-resolution interpolation image (FIG. 11A) obtained by enlarging the low-resolution image (input image 101).
- the edge enhancement unitcalculates the first high-resolution image (FIG. 11B, one-dot chain line in the lower part of FIG. 45, Xx, y) in which the edge of the calculated interpolation image is enhanced.
- the re-correction unitis a component that causes the periphery of the edge to shine in the first high-resolution image (for example, the component of the shoot in FIG. Among the first component (the component removed by C-fold and clipping) and the second component (other components) constituting the above, only the first component is removed. As a result, a second high-resolution image from which only the first component is removed (solid line data in FIGS. 11D and 45) is calculated.
- the synthesizing unitadds the correction amount to the pixel value in the interpolated image (FIG. 11A), thereby enhancing the first high resolution in which the edge in the interpolated image is enhanced.
- An image(FIG. 11B, the data of the alternate long and short dash line in FIG. 45) may be generated.
- the re-correction unitmultiplies an overcorrection component (for example, a shoot portion in FIG. 11B) by highlighting the edge that illuminates the periphery of the edge in the first high-resolution image. (C multiple value calculation unit 1061 in FIG. 45, S465A in FIG. 46, 0 ⁇ C ⁇ 1). Then, the re-correction unit performs clipping on the component that has been C-folded (threshold clip unit 1062, S465B in FIG. 46), thereby generating the second high-resolution image that has been C-folded and clipped. Also good.
- an overcorrection componentfor example, a shoot portion in FIG. 11B
- the re-correction unitincreases the inclination of the location of the overcorrection component indicated by the feature amount output from the feature amount analysis unit (on the right side of the horizontal axis in FIGS. 27 and 28), A smaller value may be specified as C (vertical axis in FIG. 27), and a smaller width may be specified as the clip width T (vertical axis in FIG. 28).
- the overcorrection componentmay be a component that causes stickiness when all of the overcorrection components (all of the shoot components) are removed from the first high-resolution image.
- the feature amount output by the feature amount analysis unitis a component that is removed by clipping at the value C and the clip at the width T among the overcorrected components (the first component described above). ) May be specified, the value C and the width T at which the stickiness does not occur may be specified.
- the re-correction unitcalculates the value C and the width T specified by the feature amount (see FIGS. 27 and 28), C times the calculated value C, and the calculated By performing clipping with the width T, the second high-resolution image from which only the component removed based on the value C and the width T is removed may be generated.
- the interpolation pixel generation unit 2905performs interpolation on the edge-enhanced image. Even in this interpolation processing, some edge enhancement is performed, so that edge enhancement is further performed after edge enhancement, so that the image quality deteriorates.
- the amount of correctionis added by the combining unit 105, the interpolation is performed by the interpolation unit 104 before the edge enhancement is performed, and the interpolation is performed after the edge enhancement. Deterioration in image quality is avoided, and a sufficiently high image quality can be obtained.
- 12 and 13are examples of processing when the color space of the image to be processed is YCbCr.
- each interpolation unit 104is equivalent to the interpolation unit 104 in FIG. 1
- the image enlargement unit 108is equivalent to the image enlargement unit 108 in FIG. 1.
- only the luminance component Yis processed by the image enlarging unit 108, and the color difference components Cb and Cr are subjected to conventional enlargement processing.
- the processing amountcan be expected to be reduced by applying the conventional processing to the color difference component while providing the above-described effect. .
- FIG. 13is a diagram illustrating an example in which the processing of the image enlargement unit 108 is performed on all components of YCbCr. In the image enlargement unit 108, each component can be processed individually as shown in the figure.
- FIG. 14shows an example of processing when the color space of the image to be processed is an RGB space.
- the same effect as in the embodiment A1can be obtained by applying the image enlargement unit 108 to each component individually.
- FIG. 15is a block diagram of an image enlargement apparatus 1500 according to Embodiment A2.
- 1501is an interpolation position x
- yis an pixel selection unit that selects 6 ⁇ 6 pixels around the interpolation position x, y1501.
- Reference numeral 1503denotes a decimal point position calculation unit that extracts the decimal point parts px and py of the interpolation positions x and y1501, and 1504 inputs 6 ⁇ 6 pixels of the input image and the decimal point positions px and py, and pixel values of the interpolation positions x and y1501 Is an image enlarging unit that calculates and outputs the calculated pixel value.
- Reference numeral 107denotes a high-resolution image after enlargement processing.
- the image enlargement apparatus 1500is also one of the subordinate concepts of the image enlargement apparatus 108 (described above).
- the image enlargement unit 1504is a superordinate concept of the image enlargement unit 1504A of the embodiment A2, the image enlargement unit 1504B of B2 (FIG. 31), and the image enlargement unit 1504C of C2 (FIG. 38).
- the image enlargement unit 1504corresponds to one of the subordinate concepts of the image enlargement apparatus 108.
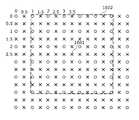
- FIG. 16is a diagram showing the relationship between the interpolation position x, y1501, the low-resolution input image 101, and the high-resolution output image 107.
- FIG. 16shows an example in which the enlargement ratio is 2.0 times in both the horizontal and vertical directions.
- a circle markindicates the pixel position of the low resolution image
- a cross markindicates the pixel position to be interpolated as the high resolution image. That is, in the example of FIG. 16, the input pixel is composed of pixels indicated by ⁇ marks, and the output high-resolution image is composed of pixels indicated by both ⁇ marks and X marks.
- the numbers in the figureindicate the interpolation position (x, y), and the position of the pixel marked with ⁇ in the input low resolution image is (0, 0) (1, 0) (2, 0). .. (1, 0) (1, 1)... Further, the position of the pixel marked with x is a position including a decimal point position such as (0.5, 0) (1.5, 0).
- FIG. 17is a flowchart (S1701 to S1713) of processing for generating the high-resolution output image 107 from the low-resolution input image 101 by the image enlargement apparatus 1500 of FIG.
- the pixel selection unit 1502calculates dx and dy which are the increase amounts of the interpolation position of the enlarged image (S1702). This can be calculated from (size A3) from the sizes of the input image 101 and the output image 107.
- Sw and Share the width and height of the input image
- Dw and Dhare the width and height of the output image.
- the pixel selection unit 1502initializes the interpolation position y (S1703), and also initializes the interpolation position x (S1704).
- the initialization position where the initialization is performeddetermines the initial phase at the time of enlargement.
- the pixel selection unit 1502obtains peripheral 6 ⁇ 6 pixels including the four pixels adjacent to the interpolation positions x and y from the input image 101 (S1705).
- the interpolation positionis a position 1601
- the decimal point position calculation unit 1503calculates the decimal point positions px and py of the interpolation positions x and y (S1706).
- the image enlargement unit 1504Aexecutes image enlargement processing using these as inputs (S1707).
- the image enlargement processwill be described later in detail.
- an output pixel value corresponding to the interpolation positionis output, and this is stored in the image enlargement unit 1504A as an output pixel value corresponding to the interpolation position (S1708).
- the pixel selection unit 1502 or the likeupdates the interpolation position by dx in the horizontal direction (S1709).
- the processing from S1705is repeated (S1710: No).
- the interpolation position in the vertical directionis updated by dy, for example, the pixel selection unit 1502 or the like is updated (S1711).
- the processing from S1704is repeated (S1712: No). If the number of output lines is the number of output lines, the process ends (S1712: Yes). Through the above processing, an enlarged high-resolution image is generated.
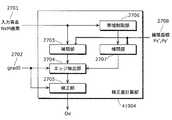
- FIG. 18shows a processing flow of the image enlargement unit 1504A that performs the image enlargement process in S1707.
- the image enlargement processwill be described in detail with reference to FIG.
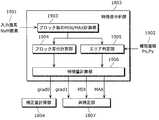
- FIG. 19shows details of the processing of the feature quantity analysis unit 1803 of FIG.
- the feature amount analysis unit 1803inputs N ⁇ M pixels around the interpolation position (see S1705 in FIG. 17) and px, py (S1706, see interpolation coordinates px, py1802 in FIG. 18) in the input image 101.
- Grad0, grad1, MIN, MAXare output as feature quantities.
- the feature amount analysis unit 1803first calculates the pixel value for each 2 ⁇ 2 pixel block. The maximum value and the minimum value are calculated by the MIN / MAX calculation unit 1903 for each block.
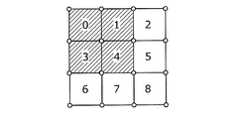
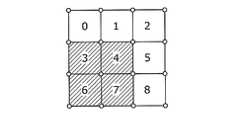
- FIG. 20is a diagram showing division into nine 2 ⁇ 2 pixel blocks.
- the 2 ⁇ 2 pixel blockis a block that divides 4 ⁇ 4 pixels into 9 blocks every 2 ⁇ 2 pixels, as shown in FIG. In FIG. 20, circles indicate pixels, and numbers from 0 to 8 are block numbers.
- the block difference calculation unit 1904calculates a difference DIFFn for each block.
- the calculation formula for DIFFnis as follows (Equation A5).
- the area determination unit 1905calculates 2 ⁇ 2 pixel blocks used for MIN and MAX calculation and DX and DY used for interpolation from the interpolation coordinates px and py (S1706 in FIG. 17).
- FIG. 21is a diagram showing the relationship among 4 ⁇ 4 pixels, px, py, and interpolation pixels.
- decimal point components of the interpolation positions x and yare px and py, 0.0 ⁇ px and py ⁇ 1.0, and the positions of px and py are within the shaded area in FIG.
- MINn and MAXn used for interpolationare changed as shown in FIG. 22 depending on which area of a, b, c, and d in FIG.
- blocks indicated by diagonal lines in FIG. 22Aindicate MINn and MAXn selected when px and py are present in the area of FIG.
- Blocks indicated by diagonal lines in FIG. 22Bindicate MINn and MAXn selected when px and py are present in the area b of FIG.
- Blocks indicated by diagonal lines in FIG. 22Cindicate MINn and MAXn selected when px and py exist in the area c of FIG.
- Blocks indicated by diagonal lines in FIG. 22Dindicate MINn and MAXn selected when px and py exist in the area d in FIG.
- Equation A6is an equation for obtaining MI0, MI1, MI2, MI3 and MA0, MA1, MA2, MA3, DX, DY. That is, MINn of the selected 2 ⁇ 2 pixel block is used as MI0 to MI3, and MAXn of the selected 2 ⁇ 2 pixel block is used as MA0 to MA3.
- the other DX and DY equationsare the same as in this example.
- the feature amount calculation unit 1906calculates grad0, grad1, MIN, MAX from DIFFn calculated by the block difference calculation unit 1904 and MI0 to 3, MA0 to 3, DX, and DY calculated by the area determination unit.
- (Expression A7)shows the calculation formula.
- max ()is a function that returns the maximum value among the values of a plurality of elements in "()”
- C0is a constant.
- grad0 and grad1are clipped within the range of pixel values.
- the feature amount analysis unit 1803outputs grad0, grad1, MIN, MAX (S462 in FIG. 46).
- grad1is affected by the largest maximum and minimum values in the block compared to grad0. For this reason, if there is a large inclination in the 4 ⁇ 4 pixels, grad1 shows a large value. That is, grad1 tends to take a larger value than grad0.
- the output of the feature quantity analysis unit 1803is not limited to this.
- the maximum value in 4 ⁇ 4 pixelsis MAX
- the minimum valueis MIN
- MAX-MINis grad1.
- MAX4-MIN4may be set to grad0.
- the reference pixels used for enlargement interpolationare the same, MAX, MIN, grad0, and grad1 are fixed, so that the block boundary may be conspicuous at high magnification enlargement. Then, the same effect as this embodiment can be expected.
- FIG. 23shows details of the processing of the correction amount calculation unit 1804 in FIG.
- NM pixels 2301 (S1705 in FIG. 17) around the interpolation position of the input image 101 (FIG. 15) and grad0 (grad02302 in FIG. 23) calculated by the feature amount analysis unit 1803 are input.
- the correction amount Oeis output.
- the band limiting unit 2306generates a band-limited 4 ⁇ 4 pixel using 6 ⁇ 6 input pixels (N ⁇ M pixel 2301 in FIG. 23).
- a horizontal / vertical 3 ⁇ 3 tap low-pass filterLPF
- +1 pixelis required on the top, bottom, left, and right in order to generate a 4 ⁇ 4 pixel LPF result.
- the input of the correction amount calculation unit 1804is 6 ⁇ 6 pixels.
- the band limiting methodis not limited to 3 ⁇ 3 taps, and a multi-tap filter can be used. In this case, the number of input pixels increases, but the characteristics of the band limiting filter can be improved.
- the LPF process in the horizontal directionmay be followed by the LPF process in the vertical direction, or conversely, the LPF process may be performed in the vertical direction and then the LPF filter may be applied in the horizontal direction. . In either case, the same effect can be expected.
- Interpolator 2303 and interpolator 2307obtain pixel values at positions that are ⁇ 1 pixel away from interpolation positions px and py by interpolation calculation.
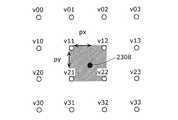
- FIG. 24is a diagram showing the positions of the pixels at the interpolation positions px and py when the input pixel value of 4 ⁇ 4 is v00 to v33.
- FIG. 25is a diagram showing eight locations i00 to i22.
- the positions that are ⁇ 1 pixel away from the pixel position 2308are eight positions i00, i01, i02, i10, i12, i20, i21, and i22 shown in FIG.
- the interpolation unit 2303calculates nine pixel values including px and py positions using the input 4 ⁇ 4 pixels.
- the interpolation unit 2307uses the 4 ⁇ 4 pixels band-limited by the band-limiting unit 2306 to calculate nine pixel values including the px and py positions by interpolation.
- a bilinear methodAs a method of interpolation, a bilinear method, a bicubic convolution method, or the like can be used. However, when processing is performed in a 4 ⁇ 4 pixel range, the bilinear method is appropriate. In addition, when processing by the bicubic convolution method, it is preferable to perform processing in a pixel range larger than 6 ⁇ 6 pixels.
- the edge extraction unit 2304extracts edge components using the output result of the interpolation unit 2303 or the interpolation unit 2307.
- the result of the interpolation unit 2303 or the interpolation unit 2307is used to extract the edge component depending on the value of grad0 indicating the strength of the gradient.
- grad0indicating the strength of the gradient.
- edge extractionis performed using the result of the interpolation unit 2303
- grad0is large
- edge extractionis performed using the result of the band-limited interpolation unit 2307.
- a coefficient as shown in FIG. 6may be multiplied by i00 to i22.
- the edge extraction using the coefficients shown in FIG. 6is an example of processing, and for example, the edge components may be extracted using the coefficients shown in FIG. 5 or other coefficients.
- the strength and band of the edge component to be extractedcan be changed by changing the filter coefficient.
- the correction unit 2305calculates the correction amount Oe (FIG. 18) using the edge component extracted by the edge extraction unit 2304 and grad0 (S463 in FIG. 46).
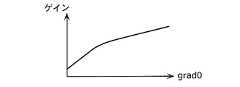
- FIG. 26is an example of a table for obtaining a gain from grad0.
- the horizontal axisis grad0 and the vertical axis is gain.
- the graphis such that the gain is small in the portion where the slope is small, that is, grad0 is small, and the gain is increased in the portion where the slope is large.
- a portion with a small inclinationis a noise component.
- increasing the gain in this portionemphasizes noise.
- the part with a small inclinationit is set as a restrained feeling.
- the reliability of the edgeis high in the portion where the slope is large, the slope is further increased by applying a strong gain.
- the relationship between grad0 and gainmay be set freely. For example, it may be set so that the middle part of grad0 is the highest, or may be set such that there are mountains at some places. Further, the relationship between grad0 and gain may be expressed by a mathematical expression or may be given by a table. In order to reduce the amount of the table, only some points may be retained and interpolation may be performed by linear interpolation or curve interpolation.
- the correction amount calculation unit 1804outputs a result obtained by multiplying the extracted edge component by gain as Oe.
- the correction amount calculation unit 1804interpolates and calculates pixel values at pixel positions corresponding to ⁇ 1 pixel of the interpolation positions Px and Py, and extracts edge components using the calculated nine pixels. ing.
- the value of the pixel position corresponding to ⁇ 1 pixel of the interpolation positions Px and Pyis a pixel position existing in the high-resolution image after enlargement if the enlargement ratio is 2.0 times.
- the pixel positiondoes not exist in the image. For example, in the case of 2.5 times, pixel positions of 0, 0.4, 0.8, 1.2, 1.6, 2, 2.4, 2.8. Pixels will be interpolated.
- pixels at pixel positions corresponding to 0.6 and 2.6 corresponding to ⁇ 1 pixel of the pixel position at the interpolation position of 1.6are not generated by enlargement.
- the edge componentis extracted by interpolating a pixel at a position of ⁇ 1 pixel, so that the edge position is extracted using the pixel values of the image before and after the enlargement.
- the correction amount calculation unit 1804includes non-linear processing such as coring and table lookup. Since such processing is included, the result does not match when the enlargement is performed after edge enhancement or when the edge enhancement is performed after enlargement.
- the calculation of edge correction amountsoften includes such non-linear processing. However, when processing is performed in order, the result of non-linear processing may adversely affect subsequent processing. There is.
- by calculating the correction amount of the number of pixels of the high-resolution image directly from the low-resolution imageit is possible to suppress undesirable side effects that occur when the enlargement process and the edge enhancement process are sequentially performed. ing.
- edge extractionis performed after nine pixels have been generated by interpolation.
- a determinant that simultaneously performs interpolation generation and edge extractionmay be prepared in advance and converted at once.
- the conversionis performed at once, it is possible to omit useless calculations, and it is possible to realize with a small hardware configuration or calculation amount.
- the interpolation unit 1805(FIG. 18) interpolates the pixel values at the pixel positions Px and Py from the input 6 ⁇ 6 pixels 1801 and the interpolation coordinates Px and Py1802, and outputs an interpolated image OL (S461 in FIG. 46). ). Interpolation by the interpolation unit 1805 is performed by a bilinear method, a bicubic convolution method, or the like. Note that these enlargement techniques are general techniques, and are not the main points of the present embodiment, so detailed description thereof will be omitted.
- Equation A8is a calculation formula of this O.
- the re-correction unit 1807corrects the pixel value using the pixel value O combined by the combining unit 1806 and the feature amounts grad1, MIN, MAX calculated by the feature amount analysis unit 1803, and the corrected pixel value O 'Is output (S465 in FIG. 46).
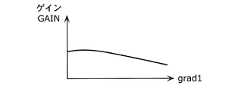
- FIG. 27shows the relationship between grad1 and GAIN.
- FIG. 28shows the relationship between grad1 and LIMIT.
- LIMITis set to be large when grad1 is small, and LIMIT is set to be small when grad1 is large (S465c in FIG. 46, threshold clip unit 1062 in FIG. 45).
- the clip by LIMITis made clear (strong) in a portion where grad1 is large, that is, a portion including a strong edge component, so that a clear image is obtained.
- clippingis not so much, so that unnatural feeling caused by cutting the chute can be suppressed.
- 27 and 28are examples of settings, and the relationship between grad1 and GAIN and LIMIT can be set freely by the user.
- a video(FIG. 10) with a natural and strong shoot without a sharp edge.
- a shoot(FIG. 8) that occurs when edge enhancement is performed before and after enlargement is not generated, and an unnatural image (FIG. 9) due to the absence of a shoot is not generated.
- an image enlarging apparatus(an image enlarging apparatus 108, an image enlarging unit 1504, an image enlarging apparatus 1500) that inputs a low resolution input image and inputs a high resolution output image analyzes the feature quantity of the input image
- a feature quantity analysis unit(feature quantity analysis unit 102, feature quantity analysis unit 1803) that generates a feature quantity of the number of pixels of the resolution image and a low resolution input image are input, and the number of high resolution pixels based on the feature quantity
- a correction amount calculation unit(correction amount calculation unit 103, correction amount calculation unit 1804) that calculates and outputs an edge correction amount
- an interpolation unit(interpolation unit 104, which generates an enlarged image (interpolated image) by interpolation)
- An interpolation unit 1805), a synthesis unit for synthesizing the interpolated image and the correction amount(the synthesis unit 105, the synthesis unit 1806), input the feature amount and the combined pixel value, and perform correction again to match
- this image enlarging apparatusit is possible to achieve both of suppression of blurring, suppression of shining around the edge, and avoiding stickiness of the image, and the image quality can be sufficiently and reliably improved.
- Embodiment Bwill be described with reference to the drawings.
- the embodiment Bis a modification of the embodiment A.
- the same description as that described aboveis appropriately omitted.
- the above-described figuresFIGS. 1 to 29
- the same reference numerals as those of the above-described configurationsare used as appropriate, or the same names as the names of the above-described configurations are used as appropriate. .
- the re-correction unitis configured to output the first high-resolution image (FIGS. 32A, 30B, and 30B) 47 is a threshold value obtained from the feature amount generated by the feature amount analysis unit and the interpolation image (Ix, y in FIGS. 30A, 30B, and 47) output from the interpolation unit. 30A, 30B, and U′x, y in FIG. 47), and the corrected second high-resolution image (thick solid line in FIG. 30B, wide pitch in FIGS. 32C and 47).
- Thisis an image enlargement device that generates a thick broken line).
- FIG. 29is a block diagram of the image enlargement unit 108B (subordinate concept (example) of the image enlargement unit 108) in the embodiment B1.
- reference numeral 101denotes a low-resolution input image (original image)
- 102denotes each pixel of a high-resolution image (first high-resolution image and second high-resolution image) output from the low-resolution input image 101.
- Thisis a feature quantity analysis unit that outputs a feature quantity corresponding to.
- 103calculates the correction amount of the edge component according to the feature amount output from the feature amount analysis unit 102, calculates the correction amount of each pixel of the high-resolution image (second high-resolution image) to be output, and outputs This is a correction amount calculation unit.
- An interpolation unit 104receives the low-resolution input image 101 and generates an image (interpolated image) having the same number of pixels as the number of pixels of the high-resolution image to be output.
- Reference numeral 105receives the pixel of the high-resolution image (interpolated image) output from the interpolation unit 104, receives the correction amount corresponding to the pixel from the correction amount calculation unit 103, and receives the corrected pixel (first high-resolution image). It is a combining unit that outputs.
- Reference numeral 106denotes a synthesis result (first output) output from the synthesis unit 105 using the threshold value calculated from the feature amount corresponding to the output pixel received from the feature amount analysis unit 102 and the pixel value generated by the interpolation unit 104.
- a re-correction unitthat re-corrects and outputs a high-resolution image.
- Reference numeral 107denotes an output high resolution image (second high resolution image).
- Reference numeral 108Bdenotes an image enlargement unit that inputs a low resolution image and outputs a high resolution image (second high resolution image).
- the output pixel value of the synthesizing unit 105 corresponding to the pixel position (x, y) of the high resolution image (first high resolution image)is calculated by Xx, y (dotted line data in FIG. 47) and the feature amount analysis unit 102.
- the upper limit valueis Ux, y (data of a thin one-dot chain line with a narrow pitch in FIG. 47)
- the lower limit valueis Lx, y
- the pixel value (interpolated image) generated by the interpolation unit 104is Ix, y (solid line in FIG. 47).
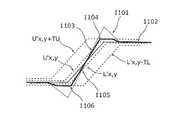
- the re-correction unit 106calculates the upper limit threshold value U′x, y (thin broken line data with a narrow pitch in FIG.
- U′x, yis the distance from Ix, y to the portion (Ux, y ⁇ Ix, y) from Ux, y to Ix, y (portion ⁇ ) ((Ux, y ⁇ Ix, y y) ⁇ ⁇ ) has a distance subtracted from Ux, y.
- an arrow line from the interpolation unit 104 to the recorrection unit 106is used to calculate such U′x, y.
- Ix, yis acquired from the interpolation unit 104 (interpolation unit 1805) by the re-correction unit 106 (re-correction unit 1807).
- the recorrection unit 106After calculating U′x, y, L′ x, y and TU, TL by (Equation B1), the recorrection unit 106 (C multiple value calculation unit 1061 in FIG. 45, S465 in FIG. 46) The correction value Px, y is calculated by the calculation of B2).
- the calculated correction value Px, yis shown in FIG. 47 as correction value Px, y (B) 1102 (thick broken line data with a wide pitch).
- Cis a preset constant in the range of 0.0 to 1.0.
- Px, y (B)is not the correction value Px, y (Px, y (B)) in this embodiment B1, but the correction value Px, y described above in the embodiment A (FIG. 47 shows a thick dotted line with a wide pitch). That is, Px, y (B) is a value smaller than the above-described Px, y (A) by the above-mentioned (Ux, y ⁇ Ix, y) ⁇ ⁇ (a thick broken line arrow in FIG. 47). See line).
- the correction value Px, yis further corrected by the calculation of (Equation B3) to calculate the second correction value P′x, y (a flat portion near the maximum point of Px, y (B)).
- min (a, b)is a function that selects the smaller one of a and b.
- Equation B3converts overshoot and undershoot components exceeding TU and TL (value M1) into TU or TL.
- the re-correction unit 106outputs the second correction value P'x, y (Px, y (B) in FIG. 47) (S465d in FIG. 46, threshold clip unit 1062 in FIG. 45).
- FIG. 30Aillustrates the relationship between Ux, y, Lx, y, Ix, y, U'x, y, L'x, y, TU, and TL.
- each relationshipis as shown in FIG. 30A.
- U′x, y and L′ x, yare values closer to Ix, y than Ux, y and Lx, y (see FIG. 47), and the output of the combining unit 105 is U′x, y.
- FIG. 30Bis an example in which correction is performed using (Equation B2) and (Equation B3).
- FIG. 47is a graph schematically showing FIG. 30B. For details of FIG. 47, refer to FIG. 30B as appropriate.
- a broken line 1101(dotted line data in FIG. 47) indicated by a dotted line (circle) is an output of the combining unit 105
- a broken line 1102(bold broken line data in FIG. 47 having a wide pitch) is indicated by a thick solid line. This is an output of the recorrection unit 106.
- a broken line (solid line data in FIG. 47) indicated by a thin solid lineis an output Ix, y of the interpolation unit 104, and broken lines are U′x, y, L′ x, y, U′x, y + TU, L′ x, y ⁇ TL (data of a thin one-dot chain line with a narrow pitch in FIG. 47, data of a two-dot chain line of the value M1).
- the slope of the outputis changed from the point 1105 that becomes L′ x, y or less, and the output 1 is clipped to L′ x, y-TL at the point 1106 that becomes L′ x, y ⁇ TL or less.
- overshoot and undershootare suppressed with respect to the signal (Xx, y, dotted line data in FIG. 47) of the combining unit 105 shown by 1101, and an image with a strong edge inclination is obtained. Generated.
- the correction of the inclination of the edgeis performed before the upper limit value or the lower limit value, the unnaturalness caused by setting the inclination can be suppressed.
- Embodiment B1it is possible to provide a natural image in which blurring due to enlargement processing is reduced by edge enhancement and generation of shoots due to edge enhancement is suppressed. As a result, even when a low-resolution image is enlarged, a natural video can be displayed without losing the sharpness of the video.
- a point 1103x in FIG. 47indicates a point according to Px, y (A) in the embodiment A1 corresponding to the point 1103 in the embodiment B1.
- the range 106yindicates a range flattened by correction with Px, y (B), and the range 106yC indicates a range flattened by correction with Px, y (A).
- the re-correction unituses the third component ((Xx, y ⁇ Ix, y) in FIG. 47 as at least a part of the first component to be removed.
- X ⁇is removed from the first high-resolution image (dotted lines in FIGS. 32A, 30B, and 47).
- This third componentis obtained by removing the third component, thereby flattening the second high-resolution image (see Px, y (A), etc. in FIG. 32B and FIG. 47) when the third component is not removed.
- Second high-resolution image(range Px, y in FIGS. 32C and 47) having a flat range (range 106y in FIG. 32C, Px, y (B), etc.) narrower than the range (range 106yC). (B)) is a component to be generated.
- the flat rangebecomes a narrower range (range 106y) than the original range (range 106yC), and the image stickiness is more sufficiently suppressed, and higher image quality can be obtained.
- the synthesis unit(the synthesis unit 105, the edge enhancement unit) adds the pixel value of the interpolation image (Ix, y in FIGS. 30A and 47, thin solid line in FIG. 30B) generated by the interpolation unit to the pixel value.
- the correction amountmay be added.
- the first high-resolution image(dotted line in FIG. 30B and FIG. 47) in which the edge in the interpolation image is emphasized may be generated.
- the re-correction unitis set based on the difference among over-correction components (shoot components) in the edge enhancement that illuminates the periphery of the edge in the first high-resolution image.
- the second high-resolution image(thick solid line in FIG. 30B, Px, y (B in FIG. 30B) from which the specified component is removed from the threshold value (see U′x, y in FIGS. 30A, 30B, and 47). )) May be generated.
- the re-correction unitperforms the second high-resolution image (Px in FIGS. 32B and 47) generated when the first value (Ux, y in FIGS. 30A and 47) is specified as the threshold.
- FIG. 31shows the flow of processing of the image enlargement unit 1504B (FIG. 15) that performs the image enlargement processing of S1707 (FIG. 17) in Embodiment B2.
- the image enlargement process in the embodiment B2will be described in detail with reference to FIG.
- the image enlargement apparatus 1500(FIG. 15) according to Embodiment B2 includes the image enlargement unit 1504B shown in FIG.
- the pixel value O (first high-resolution image) synthesized by the synthesis unit 1806, the pixel value OL (interpolated image) calculated by the interpolation unit 1805, and the feature amount analysis unit 1803are calculated.
- the pixel value O (first high resolution image) synthesized by the synthesis unit 1806is corrected, and the corrected pixel value O ′ (second high resolution image) is output. To do.
- E(the above ⁇ ) in (Equation B4) to (Equation B6) is a constant.
- GAIN (C described above) and LIMIT (T)are parameters calculated from grad1 by the C multiplication value calculation unit 1061 or the threshold clip unit 1062 in FIG.
- Equation B4is a point NMIN (L′ x, y) at which the slope of O is changed using MIN (Lx, y), LIMIT and OL (Ix, y) and a constant E, and the lower limit clip value LLIM (TL) is a mathematical formula calculated by the recorrection unit 1807.
- Equation B5uses MAX (Ux, y), LIMIT and OL, and constant E to re-correct NMAX (U'x, y) for changing the slope of O and the upper limit clip value ULIM (TU).
- Thisis a mathematical formula calculated by the unit 1807.
- the constant Eis 0.0 to 1.0. If E is reduced, if there is even a slight difference from the interpolated enlargement pixel value OL, the inclination is adjusted (Px, y (B) in FIG. 47), and E is set to 1.0. Then, the correction is performed only for the portion exceeding MIN and MAX (Px, y (A) in FIG. 47). Note that if the constant E is set to 0.5 or less, the change of the slope becomes faster, and the unnaturalness can be further reduced by raising the edge.
- FIG. 32Ais a diagram illustrating an output (Xx, y in FIG. 47) of the synthesis unit 1806.
- the horizontal axisindicates the pixel position in the horizontal direction of the image
- the vertical axisindicates the pixel value at each pixel position.
- FIG. 32B(Px, y (A) in FIG. 47) and FIG. 32C (Px, y (B) in FIG. 47) are both generated in FIG. 32A (Xx, y in FIG. 47). It can be seen that the over or undershoot component is suppressed and the edge is steep.
- 32C (Px, y (B) in FIG. 47)is narrower than the range 106yC in FIG. 47 while maintaining the inclination of the edge as compared with FIG. 32B (Px, y (A) in FIG. 47). As indicated by the range 106yC, the effect of flattening the upper portion is reduced. Therefore, in FIG. 32C (Px, y (B) in FIG. 47), the periphery of the edge has a natural shape and a clear image compared to FIG. 32B (Px, y (A) in FIG. 47). .
- Embodiment Cwill be described with reference to the drawings.
- the embodiment Cis also a modification of the embodiment A.
- the details of Embodiment Cmay be the same as Embodiment B.
- An image enlargement apparatus(an image enlargement apparatus 108C, an image enlargement unit 1504C, or the like) according to Embodiment C inputs image sizes or enlargement ratios of the low resolution image and the high resolution image (the enlargement ratio and the low enlargement ratio).
- Interpolation pixel position generation unit 110that generates a first interpolation pixel position, the low-resolution image (input image 101), and the first interpolation pixel position are input, and the first A white thinning unit that corrects the first interpolation pixel position according to a change in a pixel value around the interpolation pixel position and generates a second interpolation pixel position in which the first interpolation pixel position is corrected.
- a white thinning unit 109), and the correction amount calculation unit (correction amount calculation unit 103)inputs and outputs the second interpolation pixel position and the low resolution image.
- the correction amount of each pixel of the image imageis calculated, and the interpolation unit (interpolation unit 104) inputs the low-resolution image and the first interpolation pixel position, and the input first interpolation pixel position
- the pixel value corresponding tois calculated by interpolation, and the interpolated image (FIG. 36 and FIG. 37 (a)) having the calculated pixel value is generated at the first interpolation pixel position.
- the feature amount analysis unitanalyzes each feature amount of the low resolution image at the first interpolation pixel position (position by the interpolation pixel position generation unit 110) and outputs each of the second high resolution images to be output.
- a feature amount for a pixelis output, and a correction amount calculation unit receives and outputs the feature amount from the second interpolation pixel position, the low-resolution image, and the first interpolation pixel position.
- the correction amount of each pixel of the high-resolution imagemay be calculated.
- the feature amount analysis unitanalyzes the feature amount of the low resolution image at the second interpolation pixel position (position by the white thinning unit 41909) and outputs each pixel of the second high resolution image to be output.
- the correction amount calculation unitinputs and outputs the feature amount from the second interpolation pixel position, the low-resolution image, and the second interpolation pixel position. A correction amount of each pixel of the high resolution image may be calculated.
- FIG. 33is a block diagram of the image enlargement unit 108C (subordinate concept (example) of the image enlargement unit 108) in the embodiment C1.
- reference numeral 101denotes a low resolution input image (original image)
- 102denotes a high resolution image (first high resolution image, second high resolution image) output from the low resolution input image 101.
- Itis a feature amount analysis unit that outputs a feature amount corresponding to a pixel.
- 110is an interpolation pixel that receives the enlargement ratio or the image size of the input image 101 and the output image 107, and generates a first interpolation pixel position for interpolating each pixel of the high-resolution image according to the size. It is a position generation unit.
- Reference numeral 109denotes a white thin line for correcting and calculating the second interpolation pixel position in which the first interpolation pixel position is corrected from the input image 101 and the first interpolation pixel position generated by the interpolation pixel position generation unit 110.
- Reference numeral 103denotes a high resolution that calculates and outputs an edge component correction amount corresponding to the second interpolation pixel position calculated by the white thinning unit 109 according to the feature amount output by the feature amount analysis unit 102. It is a correction amount calculation unit that outputs a correction amount of each pixel of the image (second high-resolution image).
- An input image 101 having a low resolution and an image having the same number of pixels as the high-resolution image to be output (interpolation)are input by inputting the low-resolution input image 101 and the first interpolation pixel position before correction by the white thinning unit 109.
- Reference numeral 105receives a pixel of the high-resolution image (interpolated image) output from the interpolation unit 104 and receives a correction amount corresponding to the pixel from the correction amount calculation unit 103 and corrects the pixel (first high-resolution image). Is a synthesizing unit that outputs.
- Reference numeral 106denotes a recorrection unit that recorrects and outputs the synthesis result (first high-resolution image) output from the synthesis unit 105 based on the feature amount corresponding to the output pixel received from the feature amount analysis unit 102.
- Reference numeral 107denotes an output high-resolution image (output image, second high-resolution image), and 108C inputs a low-resolution image (input image 101) to input a high-resolution image (output image 107, second high-resolution image).
- An image enlargement unitthat outputs (image).
- the interpolation pixel position generation unit 110receives the enlargement ratio or the size of the input image and the size of the output image as parameters, and calculates the interpolation pixel position (first interpolation pixel position) using these parameters.
- the enlargement ratiois calculated based on the ratio of the image sizes.
- the input enlargement factoris used as it is.
- the input enlargement ratiosare the horizontal and vertical enlargement ratios.
- bothare the same, only one enlargement ratio is required.
- FIG. 34shows a flow for calculating the interpolation pixel position from the horizontal and vertical enlargement ratios (S3401 to S3410).
- the interpolation pixel position generation unit 110first calculates horizontal and vertical movement widths dx and dy (S3402).
- dx and dycan be calculated from the enlargement ratio.
- the interpolation pixel position (x, y)is initialized to an initial value (0, 0) (S3403).
- 0is set here, but if it is not desired to change the center of the image at the time of enlargement, it may be set to -0.25 and -0.25. In this way, the initial value is changed depending on the phase of the image to be generated as a high resolution image.
- (x, y)is output as the first interpolation pixel position (S3404).
- the outputis clipped to 0 and output.
- the horizontal interpolation position xis shifted by dx (S3405). If the result x shifted by dx is smaller than the horizontal size of the input image, the process returns to S3404 (S3406: Yes). When the horizontal size is exceeded (S3406: No), x is initialized to an initial value (S3407), and dy is added to y and updated (S3408).
- the first interpolation pixel position corresponding to the size of the high resolution imageis generated.
- the calculation method of the first interpolation pixel positionhere is an example, and the same effect as in the present embodiment can be expected even by using a general interpolation position calculation method used for enlargement processing. .
- the conditions of S3406 and S3409may be set such that the number of output interpolation pixel positions exceeds the horizontal size and the vertical size of the output image, respectively.
- the white thinning unit 109receives the low-resolution image (input image 101) and the first interpolation pixel position generated by the interpolation pixel position generation unit 110, and the second interpolation pixel position is corrected.
- the interpolated pixel positionis output.
- FIG. 35is a flow of white thinning processing (S3501 to S3512).
- the first interpolation pixel position (x, y)is input (S3502).
- the pixel position of the input image 101 adjacent to the first interpolation pixel position (x, y)is calculated (S3503).
- a pixel having the maximum and minimum pixel valuesis checked (S3504).
- the positions of the pixels having the maximum and minimum pixel valuesare two positions shifted in the horizontal direction (S3505: Yes)
- the correction amount in the x directionis calculated and x is corrected (S3506, S3507). ). This correction is such that x is shifted toward the pixel position having the minimum value.
- the amount of shiftis determined by the difference between the maximum and minimum values. For example, when the difference is large, x is shifted more, and when the difference is small, processing is performed so as not to move.
- the corrected (x, y)is output as the corrected second interpolation pixel position (x ′, y ′) (S3511).
- the direction of the inclination at the first interpolation pixel position in the input image 101is specified. Then, the position moved from the first interpolation pixel position in the specified direction toward the minimum pixel side, that is, the direction toward the darker side, is specified as the second interpolation pixel position.
- the second interpolation pixel position (x, y)is corrected in the dark direction when the difference between the maximum value and the minimum value of the adjacent pixels is large, that is, in the portion where the brightness difference is large. It will be.
- the area of the bright partis narrowed, and as a result, the white part can be thinned.
- the same position as the first interpolation pixel positionmay be specified as the second interpolation pixel position.
- the feature amount analysis unit 102calculates and outputs the feature amount for each enlarged pixel output from the interpolation unit 104.
- What is output as the feature quantityis the strength of the inclination around the position of the low-resolution image corresponding to the interpolation pixel position (for example, the first interpolation pixel position), and the upper limit value and lower limit value of the peripheral pixels.
- the strength of the inclination2 ⁇ 2 pixels of the pixel of the low resolution image adjacent to the interpolation pixel position are extracted, and the horizontal and vertical differential components dx and dy are obtained by the filters of FIG. 3 and FIG. There are methods such as making the strength of the slope.
- a sobel filter or a prewitt filtermay be used, and the method is not limited to this method.
- the upper limit value and the lower limit valuethe largest pixel value is set as the upper limit value and the smallest value is set as the lower limit value in the low-resolution image n ⁇ n pixels around the interpolation pixel position.
- the strength of the slope, the upper limit value, and the lower limit valueare calculated and output as feature values.
- the first interpolated pixel position before correctionis input as the interpolated pixel position input to the feature amount analyzing unit 102.
- the second interpolated pixel position corrected by the white thinning unit 109is used. These interpolation pixel positions may be input. In this case, since the lower limit value and the upper limit value are also shifted in the corrected second interpolation pixel position direction, stronger correction can be performed.
- the correction amount calculation unit 103calculates a correction amount according to the edge degree of the pixel corresponding to the second interpolation pixel position. First, the correction amount calculation unit 103 calculates an edge component using the second interpolation pixel position corrected by the white thinning unit 109 and the pixel value of the low-resolution input image. As an edge component extraction method, for example, the Laplacian filter shown in FIG. 5 or FIG. 6 is used. Note that a pixel at an interpolation pixel position (for example, a decimal position) does not exist in a low-resolution image (for example, composed only of pixels at an integer position). After calculating the pixel value at each pixel position (for example, integer position), 3 ⁇ 3 filter processing is performed.
- the degree of enhancement of the edge extracted by the correction amount calculation unit 103is calculated using the strength of the inclination calculated by the feature amount analysis unit 102.
- the output correction amountbecomes uneven in the bright and dark directions. As a result, the balance between the white and black correction amounts can be changed.
- the correction amount calculated at the corrected relatively dark second interpolation pixel positionis not the correction amount calculated at the first interpolation pixel position as the correction amount of the relatively bright first interpolation pixel position. Identified.
- the interpolation unit 104generates a high-resolution image (interpolated image) from the low-resolution image (input image 101) by interpolation enlargement using a bilinear method, a bicubic convolution method, or the like.
- a bilinear methode.g., a bicubic convolution method
- these general expansion techniquesare not the gist of this embodiment, detailed description thereof is omitted.
- a conventionally used enlarged interpolation techniquecan be used as the technique of the interpolation unit 104.
- the interpolation unit 104does not use the second interpolation pixel position corrected by the white thinning unit 109. This is because if the corrected result is used as the pixel position of the interpolation unit 104, the jagged feeling is emphasized at the edge portion where the white changes to black. Therefore, the interpolation unit 104 uses the first interpolation pixel position before correction generated by the interpolation pixel position generation unit 110.
- the recorrection unit In 106the first correction value Px, y is calculated by the above-described calculation (the number A1).
- the first correction value Px, yis further corrected to calculate the second correction value P′x, y by the above-described operation (numerical value A2).
- the recorrection unit 106outputs the second correction value P′x, y.
- an enlarged image in which the white portion is thinned and undershoot and overshoot are suppressedis output.
- FIG. 36is a diagram showing data in a process until synthesis.
- FIG. 37is a diagram showing data in the process up to re-correction.
- FIG. 36 and FIG. 37show data when the interpolation pixel position is not corrected by the white thinning process, and after correction (right column) shows the data when the interpolation pixel position is corrected. Data is shown.
- the output (a) of the interpolation unit 104, the output (b) of the correction amount calculation unit 103, the output (c) of the synthesis unit 105, and the output of the re-correction unit 106(( d)).
- the output (d) of the recorrection unit 106is a result when T is 0.
- the horizontal directionindicates the pixel position
- the vertical directionindicates the pixel value. The pixel value represents a brighter color as it goes up, and a darker color as it goes down.
- FIG. 37shows an example up to the output (c) of the combining unit 105.
- (B)is an output of the correction amount calculation unit 103.
- pixel position correctionis performed (right column)
- a relatively bright correction amountis specified in the left column where pixel position correction is not performed.
- the dark correction amount at the second interpolation pixel positionis not performed.
- the dark correction amount portionbecomes narrower. Since such pixel position correction is performed, the convex portion above 41104 in the right column is narrower than 41103 in the left column in (b).
- (C)shows the result of combining (a) and (b), but it can be seen that the bright part 41106R of the right column 41106 is narrower than the bright part 41105R of the left column 41105 in the upper stage. (See 41107 at the bottom.) For this reason, the white part appears to be thin.
- FIG. 37 (d)shows the result of the recorrection by the recorrection unit 106.
- the width of the bright portions of the recorrected signals 1207 and 1208is narrower in the portion 1208R when the pixel position is corrected (right column) than in the other portion 1207R. (1209).
- the bright component after enlargementis thinned so as to eliminate the impression that white is thick, which is likely to occur particularly when edge correction is performed in accordance with the enlargement process.
- Edge correctioncan be realized.
- an enlarged image (output image 107) that is visually balancedcan be generated.
- the enlargement processmay be completed by the process up to the combining unit 105. Also in this case, the effect that the white line does not appear thick can be obtained.
- the image enlarging device 108(image enlarging device 108C) includes the white thinning unit (white thinning unit 109).
- the white thinning unitcorrects the first interpolation pixel position to the second interpolation pixel position, thereby enhancing the edge with the correction amount (41104 in FIG. 36) calculated from the corrected second interpolation pixel position.
- the edge enhancement unit(compositing unit 105) is caused to calculate the first high-resolution image that has been subjected to, and the operation of the edge enhancement unit is controlled. By this control, the edge enhancement unit calculates a first high-resolution image (signal 41106) in which the white portion (portion 41106R in FIG. 36) included is narrower than the white portion (portion 41105R) when the control is not performed.
- the white thinning unitcauses the re-correction unit 106 to perform re-correction on the first high-resolution image in which the white portion is narrowed, and the re-correction unit 106 operates.
- the second high-resolution image(the signal 1208 in FIG. 37 (d)) whose white portion (the portion 1208R in FIG. 37) is narrower than the white portion (the portion 1207R) when the control is not performed is generated. Calculated by the recorrection unit 106.
- FIG. 38is a block diagram of an image enlargement apparatus 1500 provided with an image enlargement unit 1504C according to Embodiment C2.
- reference numeral 101denotes an input image
- 1601denotes a first interpolation pixel position x
- ydenotes a pixel selection unit that selects 6 ⁇ 6 pixels around the first interpolation pixel position x, y.
- Reference numeral 1603denotes a decimal point position calculation unit that extracts the decimal point parts px and py of the first interpolation pixel position x and y, and 1504C inputs 6 ⁇ 6 pixels of the input image and the decimal point positions px and py, and the first interpolation pixel position
- An image enlargement unitthat calculates and outputs pixel values (second high-resolution image) of x and y.
- Reference numeral 107denotes a second high-resolution image after the enlargement process.
- FIG. 39shows a processing flow of the image enlarging unit 1504C (FIG. 38) that performs the image enlarging process of S1707 in FIG. 17 in the embodiment C2.
- the image enlargement process of the embodiment C2will be described in detail with reference to FIG.
- FIG. 40is a diagram showing details of the processing of the white thinning unit 41909 in FIG.
- the tilt direction determination unit 2003calculates the tilt direction from the input pixel.
- FIG. 41is a diagram for explaining a method of detecting the tilt direction.
- the white circleis the adjacent pixel at the first interpolation pixel position
- the black circleis the maximum value among the adjacent pixels
- the shaded circleis the minimum value among the adjacent pixels (See S3504 in FIG. 35).
- all the pixelsare white circles.
- the arrow in FIG. 41indicates the direction from the minimum value to the maximum value.
- the arrowis horizontal, only the horizontal direction is corrected.
- the arrowis vertical, only the vertical direction is corrected. Both vertical corrections are performed.
- the tilt direction determination unit 2003 shown hereis an example, and the tilt direction may be determined based on the result of applying the filter illustrated in FIG. 3 or FIG. 4 to adjacent pixels.
- the interpolation position correction amount calculation unit 2004calculates a correction amount from the difference between the maximum value and the minimum value. In the calculation of the correction amount, when the result of the tilt direction determination unit 2003 is correction only in the horizontal direction, only the correction amount of x is correct, and in the case of correction in the vertical direction, only the correction amount of y is diagonal. For this, the correction amounts for both x and y are calculated (see S3505 to S3510 in FIG. 35).
- correction amount calculationfor example, there are methods such as (number C1) and (number C2).
- AXis a horizontal correction amount
- AYis a vertical correction amount
- K and Lare constants.
- CLIPindicates that the calculation result is clipped in the range of 0 to L.
- the calculation by (Equation C1) and (Equation C2)is performed, and the correction amount for the direction in which no correction is performed is zero.
- AX0.
- K0.
- K0.
- FIG. 42is a diagram showing a problem that occurs in the calculation of the correction amount.
- FIG. 42Ashows an example in which the correction amounts AX and AY are set based on (Equation C1) and (Equation C2).
- the correction amounthas a square shape with the origin as the center, and in the case of correction in the oblique direction (2201), the correction amount is about 1.414 times longer than that in the horizontal and vertical correction only. .
- the interpolation position correction amount calculation unit 2004adjusts AX and AY so as to come to a position on the circumference as indicated by 2202 in FIG. 42B according to the lengths of AX and AY. This prevents excessive correction in the oblique direction.
- This correctionrequires an operation using a trigonometric function, but a simpler method is to use AX, AY when the four patterns shown in FIGS. 41 (d), (g), (j), and (m) are matched. May be multiplied by 1 / ⁇ 2.
- the interpolation position correction unit 2005performs correction by adding AX and AY to the interpolation coordinates Px and Py, respectively (Equation C3).
- each of Px and Pyis normalized to a range of 0 to 1.
- Px ′CLIP (0, Px + AX, 255).
- the corrected second interpolation coordinates Px ′ and Py ′(second interpolation pixel position, interpolation coordinates 2006 in FIG. 40) are calculated.
- FIG. 43shows details of the processing of the feature quantity analysis unit 41903 of FIG.
- the feature amount analysis unit 41903first sets the maximum and minimum pixel values for each 2 ⁇ 2 pixel block. Is calculated by the MIN / MAX calculator 42303 for each block.
- the 2 ⁇ 2 pixel blockis a block that divides 4 ⁇ 4 pixels into 9 blocks every 2 ⁇ 2 pixels, as shown in FIG. In FIG. 20, the circles indicate pixels, and the numbers from 0 to 8 are block numbers.
- the block difference calculation unit 42304calculates a difference DIFFn for each block.
- the calculation formula of DIFFnis as described above (Equation A5).
- the area determination unit 42305calculates blocks used for MIN and MAX calculation and DX and DY used for interpolation from the corrected interpolation coordinates (second interpolation pixel positions) px ′ and py ′.
- FIG. 21 described aboveshows the relationship among 4 ⁇ 4 pixels, px ′, py ′, and interpolation pixels. Since the decimal point components at the second interpolation pixel position are px ′ and py ′, 0.0 ⁇ px and py ⁇ 1.0, and px ′ and py ′ are in the shaded range in FIG.
- Blocks indicated by diagonal lines in FIG. 22Aindicate MINn and MAXn that are selected when px ′ and py ′ are present in the area of FIG.
- Blocks indicated by hatching in FIG. 22Bindicate MINn and MAXn selected when px ′ and py ′ are present in the area of FIG.
- Blocks indicated by diagonal lines in FIG. 22Cindicate MINn and MAXn selected when px ′ and py ′ exist in the area c of FIG. 21.
- Blocks indicated by diagonal lines in FIG. 22Dindicate MINn and MAXn selected when px ′ and py ′ exist in the area d of FIG. 21.
- Equation C4is an expression for obtaining MI0, MI1, MI2, MI3 and MA0, MA1, MA2, MA4, DX, DY.
- the feature amount calculation unit 42306calculates grad0, grad1, MIN, MAX from DIFFn calculated by the block difference calculation unit 42304 and MI0-3, MA0-3, DX, DY calculated by the area determination unit.
- the corrected second interpolation coordinates (second interpolation pixel positions) Px ′ and Py ′are input to the feature amount analysis.
- the first interpolation coordinates (first interpolation pixel before interpolation)are input.
- Position) decimal point components Px and Pymay be input.
- FIG. 44shows details of the processing of the correction amount calculation unit 41904 in FIG. 39 (see FIG. 23).
- the interpolation unit 2703 and the interpolation unit 2707obtain the pixel value at a position that is ⁇ 1 pixel away from the corrected interpolation position (second interpolation pixel position) px ′, py ′ by interpolation calculation.
- FIG. 24 described aboveshows the positions of the pixels at the interpolation positions px ′ and py ′ when the input pixel value of 4 ⁇ 4 is v00 to v33.
- Positions that are ⁇ 1 pixel away from the pixel position 2308 of the interpolation position px ′ and py ′ that are the second interpolation pixel positionsare i00, i01, i02, i10, i12, i20, i21, and i22 shown in FIG. There will be 8 places.
- the interpolation unit 2703uses the input 4 ⁇ 4 pixels and nine pixel values including the positions px ′ and py ′, and the interpolation unit 2707 uses the 4 ⁇ 4 pixels band-limited by the band-limiting unit 2706. , Px ′, and py ′, nine pixel values are calculated by interpolation.
- the correction amount calculation unit 41904uses the corrected second pixel position (second interpolation pixel position) to calculate the edge component, thereby obtaining a thickness corresponding to the brightness of the edge. Adjustments can be made. Thereby, the balance of the correction amount of the edge in the white portion and the black portion can be changed, and the thickness can be controlled.
- the interpolation unit 41905(FIG. 39) interpolates the pixel value using the input 6 ⁇ 6 pixel 41901 and the decimal point positions Px and Py41902 of the first pixel position (first interpolation pixel position) before correction. To output an interpolation image OL.
- the re-correction unit 41907corrects the pixel value using the pixel value O (first high-resolution image) combined by the combining unit 41906 and the feature amounts grad1, MIN, MAX calculated by the feature amount analysis unit,
- the corrected pixel value O ′(second high resolution image) is output.
- FIG. 27shows the relationship between grad1 and GAIN. In the figure, the gain is increased when grad1 is small, and the gain is decreased as grad1 is increased.
- FIG. 28shows the relationship between grad1 and LIMIT.
- LIMITis large when grad1 is small
- LIMITis small when grad1 is large.
- the recorrection unit 41907may be set to use a constant (at least one of GAIN and LIMIT) corresponding to the feature amount.
- a settingmay be made in which LIMIT corresponding to the feature amount is used.
- a natural and strong shoot without a sharp edge(FIG. 37). 1208) can be generated. Further, by calculating the feature amount and the correction amount using the corrected second interpolation pixel position, the white portion is thinned as after correction (signal 1208 in the right column) in FIG. be able to. As a result, edge tilt correction is performed normally, and the phenomenon of white appearing thick due to the illusion effect that occurs when black and white become thick by the same width is reduced. Black and white balance can be maintained.
- an image enlargement deviceimage enlargement device 108C, image enlargement unit 1504C
- the feature amount of the input imageis analyzed, and the number of pixels of the high-resolution image
- the function for generating the feature amountfeature amount analysis unit 102
- the function for calculating the first interpolation pixel position from the enlargement ratiointerpolation pixel position generation unit 110
- a functionwhite thinning section 109 for generating a second interpolation pixel position corrected by a difference in pixel values of a plurality of adjacent images (see FIG.
- a function (re-correction unit 106) that performs correction according to the input image by performing correction againis provided.
- the image enlargement apparatus, the image enlargement method, and the program according to the embodimentcan be applied when the resolution of the output device is higher than the resolution of the input image.
- the present inventioncan be applied to a case where a low-resolution image is enlarged and printed on a printer having a high-resolution output function or a digital camera or a digital zoom of a movie.
Landscapes
- Engineering & Computer Science (AREA)
- Computer Graphics (AREA)
- Multimedia (AREA)
- Signal Processing (AREA)
- Physics & Mathematics (AREA)
- General Physics & Mathematics (AREA)
- Theoretical Computer Science (AREA)
- Image Processing (AREA)
- Editing Of Facsimile Originals (AREA)
Abstract
Description
Translated fromJapanese本発明は、入力された低解像度画像を、表示デバイスの解像度に合わせて拡大する表示装置や、低解像度の画像を拡大して出力するプリンタ等の画像出力装置、動画像中の一枚の画像を拡大して静止画像を生成する撮影装置等、低解像度の画像を高解像度化する装置で行う画像拡大方法に関する。The present invention relates to a display device that enlarges an input low-resolution image in accordance with the resolution of a display device, an image output device such as a printer that enlarges and outputs a low-resolution image, and one image in a moving image. The present invention relates to an image enlarging method performed by an apparatus for increasing the resolution of a low-resolution image, such as an imaging apparatus that generates a still image by enlarging the image.
従来より、入力した低解像度画像を高解像度画像に変換する補間拡大手法として、様々な方法が提案されている。代表的な手法としては、非特許文献1にも開示されている、ニアレストネイバ法、バイリニア法、バイキュービックコンボリューション法などがある。ニアレストネイバ法においては、補間画素位置に、最も近い低解像度の画素を選択して、補間画素値を決定する。バイリニア法では、補間画素位置を囲む、低解像度画像の画素4点と、補間画素位置との距離により線形内挿して、補間画素値を決定する。バイキュービックコンボリューション法では、補間画素位置を囲む、低解像度画像の周辺N×N画素から、標本化関数(f(x)=sinc(x))を用いて補間画素値を求める。Conventionally, various methods have been proposed as an interpolation enlargement method for converting an input low resolution image into a high resolution image. Typical techniques include the nearest neighbor method, the bilinear method, and the bicubic convolution method disclosed in
これらの方式には、以下に示す欠点がある。ニアレストネイバ法では、補間画素値が、補間画素位置の近辺にある低解像度の画素値であるため、拡大率が上がると視覚的なブロックが目立ってしまい、画質的に劣化した感じとなる。また、バイリニア法、バイキュービックコンボリューション法では、ニアレストネイバ法のような、ブロックの発生は抑えられるが、ボケた画質になってしまう。These methods have the following drawbacks. In the nearest neighbor method, since the interpolation pixel value is a low-resolution pixel value in the vicinity of the interpolation pixel position, a visual block becomes conspicuous when the enlargement ratio is increased, and the image quality is deteriorated. Further, in the bilinear method and the bicubic convolution method, the occurrence of blocks as in the nearest neighbor method can be suppressed, but the image quality becomes blurred.
これを解決するための手段として、補間拡大の前後で、高域強調フィルタを用いたエッジ強調処理を施す方法がよく用いられる。しかしながら、エッジ強調を行った場合には、画像のエッジ近辺に、オーバーシュートまたはアンダーシュートと呼ばれる不自然な部分が発生する。As a means for solving this, a method of performing edge enhancement processing using a high frequency enhancement filter before and after interpolation enlargement is often used. However, when edge enhancement is performed, an unnatural portion called overshoot or undershoot occurs near the edge of the image.
図8は、エッジ強調によりオーバーシュートとアンダーシュートが発生した例の図である。FIG. 8 is a diagram of an example in which overshoot and undershoot occur due to edge enhancement.
この図は、画像の水平ラインの一部のレベル値を切り取って図示したものであるが、これを見ると、エッジ周辺の部分に、オーバーシュート801とアンダーシュート802が発生しているのがわかる。このように、高域強調フィルタによるエッジ強調を施した場合には、画像がくっきりする反面、副作用として、画像のエッジ周辺が光ってしまうなどの視覚的に劣化した画像となってしまう問題がある。In this figure, the level value of a part of the horizontal line of the image is cut out, and it can be seen that an overshoot 801 and an undershoot 802 are generated around the edge. . As described above, when the edge enhancement by the high frequency enhancement filter is performed, the image is sharp, but as a side effect, there is a problem that the image is visually deteriorated such as the periphery of the edge of the image is shining. .
図48は、特許文献1の技術を示す図である。FIG. 48 is a diagram showing the technique of
解像度変換におけるエッジ強調の副作用を解決する手段が特許文献1に開示されている。以下、図48を用いて、特許文献1の技術の説明を行う。A means for solving the side effect of edge enhancement in resolution conversion is disclosed in
図48において、2901は、解像度変換を行う対象となる低解像度画像の元画像(入力画像)である。また、2902は、補間する画素数など、解像度の変換に係わる補間処理についての情報である。また、2903は、情報2902に基づき、エッジ強調を行うためのフィルタ係数を決定する強調係数決定部である。また、2904は、決定した強調係数を用いてエッジ強調を行うエッジ強調画像生成部である。また、2905は、エッジ強調された低解像度画像から、指定位置における画素値を内挿補間して、補間画素を生成する補間画素生成部である。また、2906は、入力画像2901の注目画素と、補間画素生成部2905の出力値とを比較し、その比較の結果に応じて、各画素値の重み付けの度合いを示す値を出力する比較部である。また、2909は、画素値の最大値と最小値を検出する、注目画素の周辺画素の範囲を指定するための情報である。ここで、比較部2906は、この情報2909に基づいて、重み付けの度合いを示す値を算出する。そして、重み付け合成部2907は、比較部2906の出力である重み付けに応じて、入力画像2901から入力された、低解像度画像上の注目画素と、補間画素生成部2905の出力に対して重み付けをして、合成を行う合成部である。48,
以下、比較部2906と、重み付け合成部2907の処理について詳しく説明する。比較部2906に入力される最大値、最小値検出画素範囲(情報2909)をnとする。このとき、注目画素位置(i,j)をおいた場合、その近傍画素位置(i-n+1,j-n+1)~(i+n,j+n)の範囲の画素から、最大のレベルとなる画素値と、最小のレベルとなる画素値を検出し、最大値と最小値とを、重み付け係数として重み付け合成部2907に渡す。重み付け合成部2907では、比較部2906の出力である重み係数に基づき、出力画素を計算する。具体的には、補間画素生成部2905の出力Pi,jが、最大値と最小値との範囲内である場合には、Pi,jを、最大値よりもPi,jが大きい場合は、最大値を、最小値よりもPi,jが小さい場合には最小値をそれぞれ出力する。Hereinafter, processing of the
これにより、エッジ強調によるオーバーシュート、アンダーシュート(過補正)を発生させることなくエッジのボケを抑えた拡大処理を実現している。This realizes enlargement processing that suppresses blurring of edges without causing overshoot and undershoot (overcorrection) due to edge enhancement.
しかしながら、特許文献1の方式には以下に示す欠点がある。1つは、エッジ強調画像生成部2904でエッジ強調を施した後に、補間画素生成部2905で拡大補間を行うため、エッジ強調で強調されたノイズ成分などの影響を拡大補間処理が受けてしまうという問題である。もう1つは、注目画素周辺の最大値・最小値で値をカットしてしまうために発生する問題である。However, the method of
図9は、特許文献1の技術により処理した画像信号のイメージ図である。FIG. 9 is an image diagram of an image signal processed by the technique of
図9では、図8と同様に画像の水平ラインの一部のレベル値を切り取って図示したものである。図9では、図8のようなオーバーシュートやアンダーシュート(過補正)は発生しておらず、エッジの角度も急峻になっているが、自然画の場合には、この信号は不自然な映像となることが多い。例えば、芝目や木の葉などの細かなテクスチャ部分がこのような信号になっている場合、ベタついた油絵的な絵となり、主観的な評価で不自然な絵となってしまう。このため自然画に特許文献1の技術を適用する場合には、不自然にならないように、強調係数決定部2903での係数を小さくして、エッジ強調の度合いを小さめにするしかない。この場合、エッジの部分の傾斜が十分立たないため、拡大によるボケが減少する減少効果が小さくなってしまう。FIG. 9 shows the level value of a part of the horizontal line of the image cut out as in FIG. In FIG. 9, no overshoot or undershoot (overcorrection) as shown in FIG. 8 occurs and the edge angle is steep, but in the case of a natural image, this signal is an unnatural image. Often. For example, when a fine texture portion such as turf or leaves is such a signal, it becomes a solid oil painting and unnatural picture by subjective evaluation. For this reason, when the technique of
本発明は、解像度変換時に発生するボケを抑制し、かつ、エッジ補正時の、不自然なエッジの生成を抑制することで、自然でかつボケの少ない拡大処理を提供することを第1の目的とする。A first object of the present invention is to provide a natural and low-blurring enlargement process by suppressing blurring that occurs during resolution conversion and suppressing generation of unnatural edges during edge correction. And
また、しかしながら、特許文献1の方式には以下に示す欠点もある。However, the method of
図49は、特許文献1の技術により処理した画像信号のイメージ図である。FIG. 49 is an image diagram of an image signal processed by the technique of
図49において、上下が信号のレベル値を示しており、上が白色、下が黒色となる。また、水平方向は画素位置を示す。49. In FIG. 49, the upper and lower portions indicate signal level values, and the upper portion is white and the lower portion is black. The horizontal direction indicates the pixel position.
図50は、図49と同じ部分を線形補間により拡大を施した場合の例である。FIG. 50 shows an example in which the same part as FIG. 49 is enlarged by linear interpolation.
図49では、図50に比べて、エッジを急峻にしながら、オーバーシュートやアンダーシュートを発生させていない。しかしながら、エッジが急峻になったため、図50で傾斜があった部分が白または黒となり、白と黒がそれぞれ太くなっている。信号レベル的には、黒も白も同じ幅だけ太くなっているが、人間の感覚的に白の太くなっているような印象を受ける。これは、白が膨張色であることが原因で、人間は同じ大きさの白いものと黒いものでは、白いものの方が大きく感じる。これは人間の視覚特性として一般的に知られている現象で、たとえば囲碁に使う碁石では同じ大きさに見せるために、白石のほうを0.3mmほど小さくしている。このように、明るい色と暗い色が同じ太さである場合、明るい方が、より太い印象を受けてしまう。特に拡大処理では、これが顕著になる。In FIG. 49, compared to FIG. 50, the edge is sharpened, and no overshoot or undershoot is generated. However, since the edge becomes steep, the sloped portion in FIG. 50 is white or black, and white and black are thick. In terms of signal level, both black and white are thicker by the same width, but humans feel that white is thicker. This is because white is an expanded color, and humans feel that white ones are larger than white ones of the same size. This is a phenomenon generally known as human visual characteristics. For example, in order to make it look the same in the case of a meteorite used for Go, the white stone is made smaller by about 0.3 mm. Thus, when the bright color and the dark color have the same thickness, the brighter one gets a thicker impression. This is particularly noticeable in enlargement processing.
このため、特許文献1の技術で処理した場合、視覚的には明るい色、特に白が太くなってしまったように見えるという問題がある。For this reason, when processing is performed with the technique of
本発明は、上記問題を鑑みたもので、拡大処理においてエッジを急峻に補正した場合に発生する、視覚的に白が太く見えてしまうことを抑制する拡大処理を提供することを第2の目的とする。The present invention has been made in view of the above problems, and a second object of the present invention is to provide an enlargement process that suppresses the appearance of white visually appearing when the edges are sharply corrected in the enlargement process. And
上記の課題に鑑みて、本発明の画像拡大装置は、低解像度画像を入力し、前記低解像度画像に比べて高解像度な高解像度画像を出力する画像拡大装置であって、前記低解像度画像を入力し、前記高解像度画像の画素数の補間画像を生成する補間部と、前記低解像度画像の特徴量を分析し、前記高解像度画像の各画素に対する前記特徴量を出力する特徴量分析部と、前記特徴量分析部により出力された前記特徴量と、前記低解像度画像とを入力し、前記高解像度画像の各画素に対する補正量を計算する補正量計算部と、前記補正量計算部で計算された前記補正量と、前記補間部で生成された前記補間画像とを合成して、第1の前記高解像度画像を生成する合成部と、前記合成部により出力された第1の前記高解像度画像を、前記特徴量分析部により生成された前記特徴量を用いて再度、補正し、補正された第2の前記高解像度画像を生成し、生成された第2の前記高解像度画像を、当該画像拡大装置から出力させる再補正部とを備えた画像拡大装置である。In view of the above problems, an image enlarging apparatus according to the present invention is an image enlarging apparatus that inputs a low resolution image and outputs a high resolution image that is higher in resolution than the low resolution image. An interpolation unit that inputs and generates an interpolated image having the number of pixels of the high-resolution image; and a feature-value analyzing unit that analyzes a feature amount of the low-resolution image and outputs the feature amount for each pixel of the high-resolution image; A correction amount calculation unit that inputs the feature amount output by the feature amount analysis unit and the low-resolution image and calculates a correction amount for each pixel of the high-resolution image; and a calculation by the correction amount calculation unit The correction unit and the interpolation image generated by the interpolation unit to generate a first high-resolution image; and the first high-resolution output from the combination unit The feature amount analysis unit Recorrection is performed again using the feature amount generated, and the corrected second high-resolution image is generated, and the generated second high-resolution image is output from the image enlargement apparatus. And an image enlarging apparatus.
この画像拡大装置は、具体的には、例えば、以下の画像拡大装置A1等の技術事項の一部又は全部を有してもよい。Specifically, this image enlargement apparatus may have a part or all of technical matters such as the following image enlargement apparatus A1.
上記第1の目的を達成するために、画像拡大装置A1では、低解像度画像から高解像度画像を拡大補間して生成する過程において、補間により、仮の高解像度画像を生成する補間部と、低解像度画像から、傾斜の強さに応じた特徴量を抽出し、高解像度画像の各画素に対応した特徴量を計算する特徴量分析部と、特徴量により、エッジ成分の補正量を調整し、高解像度画像の各画素に対応する補正量を出力する補正量計算部と、補間部で生成した高解像度画像と、補正量計算部で計算した補正量を合成する合成部と、特徴量により、合成部で合成された高解像度画像の各画素の補正値を決定し、再度補正を行った結果を、高解像度画像として出力する。In order to achieve the first object, the image enlarging apparatus A1 includes an interpolation unit that generates a temporary high-resolution image by interpolation in a process of enlarging and generating a high-resolution image from a low-resolution image; From the resolution image, extract the feature amount according to the strength of the inclination, and calculate the feature amount corresponding to each pixel of the high resolution image, and adjust the correction amount of the edge component by the feature amount, By a correction amount calculation unit that outputs a correction amount corresponding to each pixel of the high resolution image, a high resolution image generated by the interpolation unit, a synthesis unit that combines the correction amount calculated by the correction amount calculation unit, and a feature amount, The correction value of each pixel of the high resolution image synthesized by the synthesis unit is determined, and the result of the correction again is output as a high resolution image.
これにより補正量計算部で計算された補正量が大きすぎて、エッジ部分における、オーバーシュートやアンダーシュートといったものが発生してしまった部分(過補正の成分)について、再度調整することができ、くっきりかつシュートの少ない自然な拡大画像を生成できる。As a result, the correction amount calculated by the correction amount calculation unit is too large, and the portion where the overshoot or undershoot has occurred in the edge portion (overcorrection component) can be adjusted again. It is possible to generate a natural enlarged image with clear and few shoots.
画像拡大装置A2では、特徴量分析部が出力する特徴量が、傾斜量、上限の閾値、下限の閾値である。傾斜量により、補正量計算部と再補正部で行う補正量の調整を行うことで、例えば、小さな傾斜量の部分、つまりノイズなどの部分では、補正量を小さく、傾斜量が中くらいの部分、例えば芝目などの部分では、補正量を大きくといった調整が可能となる。また、上限と下限の閾値を特徴量として出力することで、オーバーシュートやアンダーシュートの発生している部分(過補正の部分)の特定が行いやすくなり、これらのシュートを適切に補正することが可能となる。In the image enlarging apparatus A2, the feature values output by the feature value analysis unit are the tilt amount, the upper limit threshold value, and the lower limit threshold value. By adjusting the correction amount performed by the correction amount calculation unit and the re-correction unit according to the amount of inclination, for example, in a portion with a small amount of inclination, that is, a portion such as noise, the amount of correction is small and the amount of inclination is medium For example, an adjustment such as increasing the correction amount is possible in a portion such as turf. Also, by outputting the upper and lower thresholds as feature values, it becomes easier to identify the parts where overshoots and undershoots occur (overcorrected parts), and these shoots can be corrected appropriately. It becomes possible.
画像拡大装置A3では、補正量計算部に入力される第1の傾斜量と、再補正部に入力される第2の傾斜量が異なる。これにより、エッジ強調量を決定する補正量計算部と、エッジ部分のシュートを抑える再補正部で、異なる基準により動作を行わせることが可能になる。例えば、第1の傾斜量を、狭い画像部分のエッジに対応した部分の傾斜に、第2の傾斜量を、画像の広い部分のエッジの傾斜量に対応した傾斜にすることで、エッジの強調については、エッジの近辺のみ行い、シュート抑制処理については、エッジ周囲の広いエリアで行うことが可能になる。In the image enlarging apparatus A3, the first inclination amount input to the correction amount calculation unit is different from the second inclination amount input to the recorrection unit. Accordingly, the correction amount calculation unit that determines the edge enhancement amount and the recorrection unit that suppresses the chute at the edge portion can be operated according to different standards. For example, edge enhancement is performed by setting the first inclination amount to the inclination of the portion corresponding to the edge of the narrow image portion, and the second inclination amount to the inclination corresponding to the inclination amount of the edge of the wide portion of the image. Is performed only in the vicinity of the edge, and the chute suppression process can be performed in a wide area around the edge.
上記第1の目的を達成するために、画像拡大装置B1では、低解像度画像から高解像度画像を拡大補間して生成する過程において、補間により、仮の高解像度画像を生成する補間部と、低解像度画像から、傾斜の強さに応じた特徴量を抽出し、高解像度画像の各画素に対応した特徴量を計算する特徴量分析部と、特徴量により、エッジ成分の補正量を調整し、高解像度画像の各画素に対応する補正量を出力する補正量計算部と、補間部で生成した高解像度画像と、補正量計算部で計算した補正量を合成する合成部と、補間で補間生成した高解像度画像の画素値と、特徴量から計算される閾値を用いて、合成部で合成された高解像度画像の各画素の補正値を決定し、再度補正を行った結果を高解像度画像として出力する。In order to achieve the first object, the image enlarging device B1 includes an interpolation unit that generates a temporary high-resolution image by interpolation in a process of enlarging and generating a high-resolution image from a low-resolution image; From the resolution image, extract the feature amount according to the strength of the inclination, and calculate the feature amount corresponding to each pixel of the high resolution image, and adjust the correction amount of the edge component by the feature amount, A correction amount calculation unit that outputs a correction amount corresponding to each pixel of the high-resolution image, a high-resolution image generated by the interpolation unit, a synthesis unit that combines the correction amounts calculated by the correction amount calculation unit, and interpolation generation by interpolation Using the pixel value of the high-resolution image and the threshold value calculated from the feature amount, the correction value of each pixel of the high-resolution image synthesized by the synthesis unit is determined, and the result of the correction again is used as the high-resolution image. Output.
これにより補正量計算部で計算された補正量が大きすぎて、エッジ部分にオーバーシュートやアンダーシュートといったものが発生してしまった部分(過補正の成分)について、再度調整することができ、くっきりかつシュートの少ない自然な拡大画像を生成できる。As a result, the correction amount calculated by the correction amount calculation unit is too large, and a portion where an overshoot or undershoot has occurred in the edge portion (overcorrection component) can be adjusted again, clearly. Moreover, a natural enlarged image with few shoots can be generated.
画像拡大装置B2では、特徴量分析部が出力する特徴量が傾斜量、上限の閾値、下限の閾値である。傾斜量により、補正量計算部と再補正部で行う補正量の調整を行うことで、例えば、小さな傾斜量の部分、つまりノイズなどの部分では、補正量を小さく、傾斜量が中くらいの部分、例えば芝目などの部分では、補正量を大きくといった調整が可能となる。また、上限と下限の閾値を特徴量として出力することで、オーバーシュートやアンダーシュートの発生している部分(過補正の成分)の特定が行いやすくなり、これらのシュートを適切に補正することが可能となる。In the image enlarging apparatus B2, the feature values output by the feature value analysis unit are the tilt amount, the upper limit threshold value, and the lower limit threshold value. By adjusting the correction amount performed by the correction amount calculation unit and the re-correction unit according to the amount of inclination, for example, in a portion with a small amount of inclination, that is, a portion such as noise, the amount of correction is small and the amount of inclination is medium For example, an adjustment such as increasing the correction amount is possible in a portion such as turf. In addition, by outputting the upper and lower thresholds as feature values, it becomes easier to identify overshoot and undershoot parts (overcorrection components) and correct these shoots appropriately. It becomes possible.
画像拡大装置B3では、特徴量分析部から出力された高解像度画像の画素の上限と下限の閾値のそれぞれと、補間部が出力した高解像度画像の画素値との差を計算し、合成部が出力した画素値が、上限および下限のそれぞれの前記閾値と、補間部の出力した画素値との間の差から決まる閾値を超えた場合に、合成部の出力した画素値の補正を行い、結果を出力する。これにより、エッジ周辺での補正を、上限値または下限値を超える前から行うことができ、強いエッジ周辺のエッジの傾斜変化をより細かく制御することが可能になる。In the image enlarging apparatus B3, the difference between the upper and lower thresholds of the pixel of the high resolution image output from the feature amount analysis unit and the pixel value of the high resolution image output from the interpolation unit is calculated, and the synthesis unit When the output pixel value exceeds a threshold determined from the difference between the upper and lower threshold values and the pixel value output from the interpolation unit, the pixel value output from the synthesis unit is corrected, and the result Is output. Thereby, the correction around the edge can be performed before the upper limit value or the lower limit value is exceeded, and the change in the inclination of the edge around the strong edge can be controlled more finely.
上記第2の目的を達成するために、画像拡大装置C1では、低解像度画像から高解像度画像を拡大補間して生成する過程において、高解像度画像の各画素に対応する第1の補間画素位置を生成する補間画素位置生成部と、第1の補間画素位置に対応する補間画素を生成する補間部と、低解像度画像と第1の補間画素位置から補間画素位置周辺の画素値の変化に応じて補間画素位置を修正して第2の補間画素位置を生成する白細線化部と、第2の補間画素位置に対応する補正量を計算する補正量計算部と、補間部で補間された画素値と補正量を合成して出力画素値を生成する合成部を備える。In order to achieve the second object, the image enlarging apparatus C1 determines the first interpolated pixel position corresponding to each pixel of the high resolution image in the process of enlarging and generating the high resolution image from the low resolution image. An interpolation pixel position generation unit to generate, an interpolation unit to generate an interpolation pixel corresponding to the first interpolation pixel position, and a low-resolution image and a change in pixel values around the interpolation pixel position from the first interpolation pixel position A white thinning unit that corrects the interpolation pixel position to generate a second interpolation pixel position, a correction amount calculation unit that calculates a correction amount corresponding to the second interpolation pixel position, and a pixel value interpolated by the interpolation unit And a combining unit that combines the correction amounts to generate an output pixel value.
補正量計算部に白細線化部で補正した第2の補間画素位置を用いることで、第1の補間画素位置とは補間画素位置が変わるため、エッジ強調の中心がずれるようになり、結果として明るい部分、特に白を細くすることができる。By using the second interpolation pixel position corrected by the white thinning unit in the correction amount calculation unit, the interpolation pixel position is changed from the first interpolation pixel position, so that the edge emphasis center is shifted, and as a result Bright parts, especially white can be thinned.
画像拡大装置C2では、低解像度画像から高解像度画像を拡大補間して生成する過程において、高解像度画像の各画素に対応する第1の補間画素位置を生成する補間画素位置生成部と、第1の補間画素位置に対応する補間画素を生成する補間部と、第1の補間画素位置に対応する特徴量を計算する特徴量分析部と、低解像度画像と第1の補間画素位置から補間画素位置周辺の画素値の変化に応じて補間画素位置を修正して第2の補間画素位置を生成する白細線化部と、第2の補間画素位置に対応する補正量を計算する補正量計算部と、補間部で補間された画素値と補正量を合成して合成した画素値を生成する合成部と、再補正部では合成部の出力結果を特徴量を用いて再度補正し補正された第2の高解像度画像を生成する。In the image enlarging device C2, in the process of enlarging and generating a high-resolution image from a low-resolution image, an interpolation pixel position generation unit that generates a first interpolation pixel position corresponding to each pixel of the high-resolution image; An interpolation unit that generates an interpolation pixel corresponding to the interpolation pixel position, a feature amount analysis unit that calculates a feature amount corresponding to the first interpolation pixel position, an interpolation pixel position from the low-resolution image and the first interpolation pixel position A white thinning unit that generates a second interpolation pixel position by correcting an interpolation pixel position according to a change in peripheral pixel values; a correction amount calculation unit that calculates a correction amount corresponding to the second interpolation pixel position; A combination unit that combines the pixel value interpolated by the interpolation unit and the correction amount to generate a combined pixel value, and a re-correction unit that corrects and corrects the output result of the combination unit again using the feature amount. A high-resolution image is generated.
特徴量による再補正を行なうことで、第2の発明では、第1の発明に加えて、オーバーシュートやアンダーシュートの少ない画像を生成できる。オーバーシュートやアンダーシュートを再補正した場合、エッジが平坦になるため白線がより太く見えるようになるが、白細線化で計算した第2の補間画素位置を利用して補正量を計算することで、白付近の色が細線化されるため、白が太く見えてしまうことを抑制することができる。By performing re-correction with the feature amount, the second invention can generate an image with less overshoot and undershoot in addition to the first invention. When overshoot and undershoot are recorrected, the edges become flat and the white line appears to be thicker. However, by calculating the correction amount using the second interpolation pixel position calculated in white thinning, Since the color near white is thinned, white can be prevented from appearing thick.
画像拡大装置C3では、特徴量の計算においても白細線化部で補正した第2の補間画素位置を用いる。これにより、再補正処理の制御位置も第2の補間画素位置にしたがってずれるようになるため、白線の太さを細かくコントロールできるようになる。In the image enlargement apparatus C3, the second interpolation pixel position corrected by the white thinning unit is also used in the calculation of the feature amount. As a result, the control position of the recorrection process is also shifted according to the second interpolation pixel position, so that the thickness of the white line can be finely controlled.
まず、本発明によれば、補正量計算部で計算された補正量が大きすぎてエッジ部分にオーバーシュートやアンダーシュートといったものが発生してしまった部分について、再度調整することができ、くっきりかつシュートの少ない自然な拡大画像を生成できる。First, according to the present invention, the correction amount calculated by the correction amount calculation unit can be adjusted again for a portion in which an edge portion has an overshoot or undershoot because the correction amount is too large. A natural enlarged image with few shoots can be generated.
また、本発明によれば、拡大処理時にエッジの先鋭化処理により白が視覚的に太く見えてしまうという現象を抑制できる。Further, according to the present invention, it is possible to suppress the phenomenon that white appears visually thick due to the sharpening process of the edge during the enlargement process.
以下、図面を参照しつつ、実施の形態に係る画像拡大装置(画像拡大部)108について説明する。画像拡大装置108は、実施の形態Aに係る画像拡大装置108A(図1等)と、実施の形態Bに係る画像拡大装置108B(図29等)と、実施の形態Cに係る画像拡大装置108C(図33等)との各画像拡大装置の上位概念である。Hereinafter, the image enlargement apparatus (image enlargement unit) 108 according to the embodiment will be described with reference to the drawings. The
実施形態に係る画像拡大装置108(画像拡大装置108Aなど)は、低解像度画像(入力画像101)を入力し、前記低解像度画像に比べて高解像度な高解像度画像(出力画像107)を出力する画像拡大装置であって、前記低解像度画像を入力し、前記高解像度画像の画素数の補間画像(図18の補間画像OLなど)を生成する補間部(補間部104など)と、前記低解像度画像の特徴量を分析し、前記高解像度画像の各画素に対する前記特徴量(図18のgrad1、grad0、MIN、MAX等)を出力する特徴量分析部(特徴量分析部102など)と、前記特徴量分析部により出力された前記特徴量と、前記低解像度画像とを入力し、前記高解像度画像の各画素に対する補正量を計算する補正量計算部(補正量計算部103など)と、前記補正量計算部で計算された前記補正量と、前記補間部で生成された前記補間画像とを合成して、第1の前記高解像度画像(図11B、図45下段の一点鎖線のデータなど)を生成する合成部(合成部105など)と、前記合成部により出力された第1の前記高解像度画像を、前記特徴量分析部により生成された前記特徴量を用いて再度、補正し、補正された第2の前記高解像度画像(図11D、図45下段の実線のデータなど)を生成し、生成された第2の前記高解像度画像を、当該画像拡大装置から出力させる再補正部(再補正部106など)とを備えた画像拡大装置である。The image enlarging device 108 (such as the
<<実施の形態A>>
以下、実施形態Aを、図面を参照しながら説明する。なお、実施形態Aは、実施形態A1と、実施形態A2とを含む。<< Embodiment A >>
Hereinafter, Embodiment A will be described with reference to the drawings. Embodiment A includes embodiment A1 and embodiment A2.
(実施の形態A1)
図1は、実施形態A1における画像拡大部(画像拡大装置)108Aのブロック図である。(Embodiment A1)
FIG. 1 is a block diagram of an image enlargement unit (image enlargement apparatus) 108A according to Embodiment A1.
なお、画像拡大部108Aは、画像拡大装置108(先述)の下位概念の1つである。Note that the
図1において、101は、低解像度の入力画像(元画像、低解像度画像)である。また、102は、低解像度の入力画像から画像拡大部108Aが出力する高解像度画像(出力画像、第2の高解像度画像)107の各画素に対応する特徴量を各々出力する特徴量分析部である。103は、特徴量分析部102の出力した特徴量に応じて、エッジ成分の補正量を計算し、すなわち、出力する高解像度画像107の各画素の補正量を計算し、計算された各補正量を出力する補正量計算部である。104は、低解像度の入力画像101を入力して、出力する高解像度画像107と同じ画素数の画像(補間画像)を生成する補間部である。105は、補間部104から出力された高解像度画像(補間画像)の画素を受け取るのと共に、その画素に対応する補正量を補正量計算部103から受け取り、その画素に対してその補正量での補正(第1の補正)をした、第1の補正後の画素(第1の高解像度画像)を出力する合成部である。106は、特徴量分析部102から受け取った、合成部105が出力する第1の補正後の画素に対応する特徴量によって、合成部105が出力した合成結果(第1の補正後の画素)に、再補正(第2の補正)をして、第2の補正後の画素(第2の高解像度画像)を出力する再補正部である。107は、出力される高解像度画像(第2の高解像度画像)、108Aは、低解像度画像101を入力して、入力された低解像度画像101を拡大した高解像度画像107(第2の高解像度画像)を出力する画像拡大部である。In FIG. 1,
なお、画像拡大部108Aは、具体的には集積回路でもよい。そして、特徴量分析部102等のそれぞれは、この集積回路に実装された機能ブロック(回路)であってもよい。また、画像拡大部108Aは、コンピュータでもよい。そして、それぞれの機能ブロックは、このコンピュータがソフトウェアを実行することにより実現する機能の機能ブロックであってもよい。Note that the
図2は、この画像拡大部108Aを組み込んだシステムの例である。FIG. 2 shows an example of a system incorporating the
図2において、201は、画像を入力する入力部である。202は、入力部201にTV信号を入力するチューナーである。203は、入力部201に映像を入力する外部端子である。204は、動画や静止画が記録されたSDカードなどのメモリカードである。205は、このシステムの一次記憶装置として利用される、DRAMなどのメモリである。206は、このシステムの全体を制御するプロセッサである。207は、入力部201で入力された画像が圧縮画像である場合に、その画像の復号を行う復号部である。208は、復号された画像をビデオドライバ209に出力する表示部である。209は、液晶、プラズマ、CRTなどの表示デバイス211に、表示部208により出力された画像を出力するためのビデオドライバである。210は、画像等を蓄積する二次記憶装置であるハードディスク(HDD)である。In FIG. 2,
このシステムでは、入力部201から入力され、またはハードディスク210に格納された圧縮画像が、プロセッサ206による制御により、復号部207に送られ、復号部207により復号された後に、直接、または、メモリを介して表示部208に送られる。表示部208では、受け取った、復号された画像(図1の入力画像101)のフォーマットを、表示デバイス211にあわせたフォーマットに変換し、この変換後の画像(出力画像107)を、ビデオドライバ209に送り、ビデオドライバ209が表示デバイス211に、送られた出力画像107の表示を行う。このシステムにおいて、図1に示す画像拡大部108Aは、例えば、表示部208内での、表示デバイス211の解像度の出力画像107に、入力画像101を拡大するための処理(の機能ブロック)として実装され、または、プロセッサ206でのソフトウェア処理(の機能ブロック)として実装される。なお、どちらの形式に実装した場合でも、拡大した画像を再び符号化して、符号化後の画像を、ハードディスク210等に書き戻す等の用途に利用することも可能な実装とする。In this system, a compressed image input from the
以下、図1の画像拡大部108Aの処理について説明する。Hereinafter, the processing of the
(特徴量分析部)
特徴量分析部102では、補間部104の出力する、拡大後の各画素に対する特徴量を各々計算し、出力する(図46のS462)。すなわち、拡大後の高解像度画像のそれぞれの画素の特徴量が各々算出される。特徴量として出力するデータは、高解像度画像における、補間部104が補間を行う補間画素位置(高精細位置)に対応する位置(低解像度画像の位置、低精細位置)における、その位置の周辺の傾斜の強さ(例えば、図18のgrad0及びgrad1)と、その位置の周辺画素の上限値と下限値(MIN、MAX)である。特徴量は、これら、低解像度画像から特定される、傾斜の強さ、および、上限値と下限値とを含む。(Feature Analysis)
The feature
図3は、垂直の線を検出するための、水平方向での微分のフィルタの例を示す図である。FIG. 3 is a diagram showing an example of a differential filter in the horizontal direction for detecting a vertical line.
図4は、水平な線を検出するための、垂直方向での微分のフィルタの例を示す図である。FIG. 4 is a diagram showing an example of a differential filter in the vertical direction for detecting a horizontal line.
上記のように特徴量に含まれる、傾斜の強さを特定する方法としては、補間画素位置(低精細位置)に隣接する、低解像度画像の画素の2×2画素を抽出し、抽出された2×2画素から、図3および図4のフィルタにより、水平および垂直の微分成分dxとdyを求め、どちらか大きな方を、特徴量である傾斜の強さと特定するなどの方法がある。なお、傾斜の強さの計算方法としては、sobelフィルタまたはprewittフィルタなどを用いる方法などでもよく、この方法に限定されるものではない。As a method of specifying the strength of the inclination included in the feature amount as described above, 2 × 2 pixels of the low-resolution image pixels adjacent to the interpolation pixel position (low-definition position) are extracted and extracted. There is a method in which horizontal and vertical differential components dx and dy are obtained from 2 × 2 pixels by the filters of FIGS. 3 and 4 and the larger one is specified as the strength of the gradient, which is a feature amount. In addition, as a method of calculating the strength of inclination, a method using a sobel filter or a prewitt filter may be used, and the method is not limited to this method.
また、上限値と下限値としては、補間画素位置(低精細位置)の周辺の、低解像度画像n×n画素の中で、最も大きな画素値を上限値、最も小さな値を下限値として設定する。In addition, as the upper limit value and the lower limit value, the largest pixel value is set as the upper limit value and the smallest value is set as the lower limit value in the low-resolution image n × n pixels around the interpolation pixel position (low-definition position). .
以上により、傾斜の強さと、上限値、下限値との3つが、特徴量として特徴量分析部102により計算され、出力される。As described above, the strength of the gradient, the upper limit value, and the lower limit value are calculated and output by the feature
(補正量計算部)
補正量計算部103では、補間画素位置に対応する画素のエッジ度合いに応じた補正量を計算する(図46のS463)。補正量計算部103では、まず、補間画素位置(低精細位置)の周辺に対応する、低解像度の入力画像101の各画素値を用いて、その低精細位置のエッジ成分を計算する。このとき、複数の高精細位置のうちから、低解像度画像でのエッジの部分に対応する高精細位置が特定される。(Correction amount calculator)
The correction
図5は、ラプラシアンフィルタの第1の例を示す図である。FIG. 5 is a diagram showing a first example of a Laplacian filter.
図6は、ラプラシアンフィルタの第2の例を示す図である。FIG. 6 is a diagram illustrating a second example of a Laplacian filter.
エッジ成分の抽出方法としては、図5または図6に示すラプラシアンフィルタなどを用いる方法が利用される。As an edge component extraction method, a method using a Laplacian filter shown in FIG. 5 or 6 is used.
なお、高解像度画像における補間画素位置(高精細位置、例えば小数の座標値の位置)の画素は、低解像度画像(例えば、整数の座標値の画素のみを有する)には存在しない。このため、これらのフィルタを施す場合には、補間画素位置(高精細位置)と同じ位置(例えば、低解像度画像における、小数の座標の位置)の近傍の画素(整数の座標値の位置を有する)を中心とした3×3のフィルタ処理が行われることになる。Note that a pixel at an interpolated pixel position (a high-definition position, for example, a position of a decimal coordinate value) in a high-resolution image does not exist in a low-resolution image (for example, only pixels having integer coordinate values). For this reason, when these filters are applied, a pixel (integer coordinate value position) in the vicinity of the same position as the interpolation pixel position (high-definition position) (for example, a decimal coordinate position in the low-resolution image) is provided. 3 × 3 filter processing centering on).
エッジ成分が抽出され、つまり、エッジの部分の高精細位置が特定された後、特徴量分析部102で計算した傾斜の強さ(特徴量、例えば、図18のgrad0)を用いて、抽出したエッジの強調度合いを計算する。After the edge component is extracted, that is, after the high-definition position of the edge portion is specified, the edge component is extracted using the strength of the inclination calculated by the feature amount analysis unit 102 (feature amount, for example, grad0 in FIG. 18). Calculate the degree of edge enhancement.
図7は、傾斜の強さ(特徴量)に応じて、抽出したエッジ成分に対して掛けるゲインの量を調整する場合のゲインの例を示す図である。FIG. 7 is a diagram illustrating an example of gain in the case where the amount of gain to be applied to the extracted edge component is adjusted according to the strength of the inclination (feature amount).
この例では、傾斜が強い部分では補正量を大きく、傾斜が小さい部分では補正量を小さくしている。このような調整を行うことで、傾斜が小さい部分である、ノイズのような小さな傾斜の信号の補正量を小さくすることができる。In this example, the correction amount is increased in the portion where the inclination is strong, and the correction amount is decreased in the portion where the inclination is small. By performing such adjustment, it is possible to reduce the correction amount of a signal having a small inclination such as noise, which is a portion having a small inclination.
以上のように、補正量計算部103では、低解像度画像からエッジ成分を抽出し、傾斜の強さに応じたゲインにより倍率調整した、高解像度画像の各画素に対応した補正量を出力する。As described above, the correction
すなわち、それぞれの高精細位置について、その高精細位置に足されることにより、エッジの強調がされる、その高精細位置の補正量が各々補正量計算部103により算出される。That is, for each high-definition position, the correction
(補間部)
補間部104では、バイリニア法やバイキュービックコンボリューション法等を用いて、低解像度画像(入力画像101)から、高解像度の画像(例えば、図18の補間画像OL、図11Aなど参照)を、補間拡大により生成する(図46のS461)。なお、これらの一般的な拡大技術は、実施形態の骨子ではないので、詳しい説明を省略する。補間部104としては、従来から用いられている拡大補間技術を利用することが可能である。(Interpolation part)
The interpolating
すなわち、低解像度画像から、エッジ強調がされる前の高解像度画像(補間画像)が、補間部104により算出される。That is, a high resolution image (interpolated image) before edge enhancement is calculated from the low resolution image by the
(合成部)
合成部105では、補間部104で生成した高解像度画像(補間画像、図11A)に、補正量計算部103で計算した、高解像度画像の各画素に対応した補正量(差分値)を足し込んで、エッジが強調された画像(第1の高解像度画像、図11B、図45下段の一点鎖線のデータ)を生成する(図46のS464)。この時点においては、図8に示すような、オーバーシュートとアンダーシュート(エッジ強調における過補正の成分)が含まれた画像が生成される。(Synthesizer)
In the
(再補正部)
再補正部106では、合成部105が出力した、エッジ強調が施された高解像度画像(図11B等)と、特徴量分析部102が出力した、高解像度画像のそれぞれの画素に対応した上限値、下限値(特徴量)を入力し、合成部105が出力した高解像度画像(図11B)の再補正を行う(図46のS465)。(Re-correction part)
In the
すなわち、エッジ強調がされた後の高解像度画像(図11B、図45の一点鎖線のデータ)に対して再補正(第2の補正)が再補正部106により行われ、第2の補正がされた後の高解像度画像(図11D、図45の実線のデータ)が再補正部106により算出される。That is, the
以下、再補正の手順について説明を行う。Hereinafter, the re-correction procedure will be described.
エッジ強調がされた後の高解像度画像(図11B、図45の一点鎖線)の画素位置(x,y)における、合成部105の出力画素値をXx,y、上限値をUx,y,下限値をLx,yとした時、再補正部106では、次の(数A1)の演算により(図45上段参照)、第1の補正値Px,y(破線のデータ)を計算する(図46のS465A(S465a、S465b)、図45上段のC倍値算出部1061)。なお、この数式(数A1)において、Cは、予めC倍値算出部1061に設定された、0.0~1.0の範囲内の定数である。The output pixel value of the combining
なお、図45における4本の水平線(上から順に一点鎖線、破線、実線、実線)のそれぞれは、Xx,yの極大点での値を一例として示す。In addition, each of the four horizontal lines in FIG. 45 (the one-dot chain line, the broken line, the solid line, and the solid line in order from the top) shows the values at the maximum points of Xx and y as an example.
(数A1)
Xx,y > Ux,yのとき、 Px,y=Ux,y + (Xx,y - Ux,y)× C
Xx,y < Lx,yのとき、 Px,y=Lx,y - (Lx,y - Xx,y)× C
それ以外のとき、 Px,y=Xx,y(Number A1)
When Xx, y> Ux, y, Px, y = Ux, y + (Xx, y−Ux, y) × C
When Xx, y <Lx, y, Px, y = Lx, y− (Lx, y−Xx, y) × C
Otherwise, Px, y = Xx, y
この計算により、上限値(Ux,y)と下限値(Lx,y)を超えた部分(例えば、図45における、極大点の近傍の部分)が、C倍され、C倍されたPx,y(図11C、図45の破線のデータ)が算出される。ここで、Cは1.0以下に設定するため、結果として、上限と下限を超えた部分(過補正の成分)に第2の補正がされて、小さくなることになる。By this calculation, the portion exceeding the upper limit value (Ux, y) and the lower limit value (Lx, y) (for example, the portion in the vicinity of the maximum point in FIG. 45) is multiplied by C, and Px, y multiplied by C (Data shown by broken lines in FIG. 11C and FIG. 45) is calculated. Here, since C is set to 1.0 or less, as a result, the second correction is performed on the portion exceeding the upper limit and the lower limit (overcorrection component), and becomes smaller.
次に、下記の(数A2)の演算により、再補正部106は、第1の補正値Px,y(図11C、図45の破線のデータ)をさらに修正して、第2の補正値P’x,y(図11D、図45の実線のデータ)を計算する(図46のS465B(S465c)、図45の閾値クリップ部1062)。なお、この数式において、Tは予め設定された定数である。また、min(a,b)は、aとbのうちどちらか小さい方を選択する関数である。Next, the
なお、図45の上段に示される再補正部106の構成、つまり、C倍値算出部1061と閾値クリップ部1062との2つの部分を有する構成は、単なる一例であり、他の構成が採られてもよい。Note that the configuration of the
(数A2)
Px,y > Ux,yのとき、 P’x,y=Ux,y + min(Px,y - Ux,y ,T)
Px,y < Lx,yのとき、 P’x,y=Lx,y - min(Lx,y - Px,y ,T)
それ以外のとき、 P’x,y=Px,y(Number A2)
When Px, y> Ux, y, P′x, y = Ux, y + min (Px, y−Ux, y, T)
When Px, y <Lx, y, P'x, y = Lx, y-min (Lx, y-Px, y, T)
Otherwise, P'x, y = Px, y
(数A2)により、定数Tを超える、オーバーシュートとアンダーシュートとの成分がTに変換される。すなわち、シュート(オーバーシュート又はアンダーシュート)における、定数Tを越える部分がクリップ(クリッピング)され、除去される。(Equation A2) converts overshoot and undershoot components exceeding T to T. That is, the portion of the shoot (overshoot or undershoot) exceeding the constant T is clipped (clipped) and removed.
再補正部106では、この第2の補正値P’x,y(図11D、図45の実線のデータ)を出力する(図46のS465BのS465d、図45の閾値クリップ部1062)。The
なお、再補正部106は、例えば、合成部105により生成された、エッジが強調された後の高解像度の画像(第1の高解像度画像)の複数の画素のそれぞれについて、その画素(Xx,y)についての、この処理(図46のS465a~S465d)を行う。これにより、それら複数の画素がそれぞれ再補正されれた、再補正後の高解像度の画像(第2の高解像度画像)が生成される。The
図11A~図11Dは、画像拡大部108における画像を示す図である。11A to 11D are diagrams showing images in the
以上の処理により、実施の形態A1によれば、アンダーシュートとオーバーシュートを抑えた拡大画像(出力画像107)が画像拡大部108Aにより出力されることになる。以下、図11A~図11Dを利用しながら、処理の過程の信号の変化と、処理の流れについて説明する。なお、図11は、図8,9,10と同様に、画像の、特定の水平方向の画素値を観測した図であり、横軸が水平画素位置を、縦軸が、それぞれの水平画素位置における画素値を示している。Through the above processing, according to the embodiment A1, an enlarged image (output image 107) in which undershoot and overshoot are suppressed is output by the
図11Aは、補間部104において、バイキュービックコンボリューション法により補間拡大された画像(補間画像)である。バイキュービックコンボリューション法の処理は、エッジ強調的な成分を含んでいるため、図11Aのようにエッジ近辺に若干のシュート成分が発生している。FIG. 11A is an image (interpolated image) that is interpolated and enlarged by the
図11Bは、合成部105により、補正量計算部103の出力が加算された画像(第1の高解像度画像、図45の一点鎖線およびXx,y)である。この時点では、図11Aに比べて、エッジ周辺に大きなシュートが発生している。なお、図45下段の一点鎖線、破線、実線のグラフは、それぞれ、図11B、図11C、図11Dのグラフを模式的にしたものである。図45下段の各グラフの詳細については、適宜、図11B等を参照されたい。FIG. 11B is an image (first high-resolution image, one-dot chain line and Xx, y in FIG. 45) to which the output of the correction
図11Cは、Cを0.25として、(数A1)の処理を適用した結果(図45の破線のデータ、Px,y)である。図11Cに示すように、図11Bに比べてシュート成分が小さくなり、かつエッジの急峻さは、図11Aに比べて大きくなっていることがわかる。FIG. 11C shows the result of applying the processing of (Equation A1) with C being 0.25 (dashed line data, Px, y in FIG. 45). As shown in FIG. 11C, it can be seen that the shoot component is smaller than that of FIG. 11B and the sharpness of the edge is larger than that of FIG. 11A.
図11Dは、T=4として(数A2)の処理を適用した結果(図45の実線のデータ、P’x,y)である。図11Dでは、図11Cで残っていたシュートの残りのうちの一部がクリップされるだけで、全部が除去されることはなく、図11Aの信号に近いイメージになっていることがわかる。また、図11Aに比べて、エッジの急峻さは大きくなっていることより、エッジのボケは抑制されていることがわかる。また、図11Dにおいても、シュート成分は残っているため、不自然なベタ絵にならず、かつ、エッジ周辺のシュートは抑制されている。FIG. 11D shows the result of applying the processing of (Equation A2) with T = 4 (solid line data in FIG. 45, P′x, y). In FIG. 11D, it can be seen that only a part of the remaining portion of the chute remaining in FIG. 11C is clipped, and the entire image is not removed, and the image is similar to the signal of FIG. 11A. In addition, it can be seen that the blurring of the edge is suppressed because the sharpness of the edge is larger than that in FIG. 11A. Also in FIG. 11D, since the shoot component remains, an unnatural solid picture is not produced, and shoots around the edge are suppressed.
以上のように、実施の形態A1によれば、拡大処理によるボケ(図11A参照)を、エッジ強調により緩和しつつ(図11B~図11D、図45の一点鎖線、破線、実線のデータ参照)、かつ、エッジ強調によるシュートの発生を抑制した自然な映像(図11D、図45の実線のデータ、P’x,y)を提供することができる。これにより、低解像度画像を拡大した場合でも、映像の先鋭感を失うことなく自然な映像を表示することが可能になる。As described above, according to Embodiment A1, blurring due to enlargement processing (see FIG. 11A) is reduced by edge enhancement (see data of the dashed-dotted line, broken line, and solid line in FIGS. 11B to 11D and 45). In addition, it is possible to provide a natural image (FIG. 11D, solid line data P′x, y in FIG. 11D) in which the occurrence of shoots due to edge enhancement is suppressed. As a result, even when a low-resolution image is enlarged, a natural video can be displayed without losing the sharpness of the video.
このように、画像拡大装置108(画像拡大装置108A)は、補間部(補間部104)と、エッジ強調部(合成部105)と、再補正部(再補正部106)とを備える。As described above, the image enlargement device 108 (
補間部は、低解像度画像(入力画像101)が拡大された高解像度の補間画像(図11A)を算出する。The interpolation unit calculates a high-resolution interpolation image (FIG. 11A) obtained by enlarging the low-resolution image (input image 101).
エッジ強調部は、算出された補間画像のエッジが強調された第1の高解像度画像(図11B、図45下段の一点鎖線、Xx,y)を算出する。The edge enhancement unit calculates the first high-resolution image (FIG. 11B, one-dot chain line in the lower part of FIG. 45, Xx, y) in which the edge of the calculated interpolation image is enhanced.
再補正部は、第1の高解像度画像における、エッジの周辺が光ることを生じる成分(例えば、図11Bのシュートの成分、Ux,y(図45下段等)を越える成分、過補正の成分)を構成する、第1成分(C倍およびクリップによって除去された成分)および第2成分(他の成分)のうちで、前記第1成分のみを除去する。これにより、当該第1成分のみが除去された第2の高解像度画像(図11D、図45の実線のデータ)が算出される。The re-correction unit is a component that causes the periphery of the edge to shine in the first high-resolution image (for example, the component of the shoot in FIG. Among the first component (the component removed by C-fold and clipping) and the second component (other components) constituting the above, only the first component is removed. As a result, a second high-resolution image from which only the first component is removed (solid line data in FIGS. 11D and 45) is calculated.
これにより、エッジの強調により、エッジのボケが抑制される。他方、上記の第1成分が除去されて、エッジの周辺が光って見えるのが回避される。そして、こうして、エッジのボケが抑制でき、かつ、エッジの周辺が光ることが回避できるにも関わらず、第1成分のみが除去されて、除去がされ過ぎてしまうことが回避される。これにより、図45における比較的狭い範囲106xに示されるように、第2の高解像度画像における平坦な範囲が、従来例等における範囲(例えば範囲106xC)よりも狭くなるなどして、ベタついた不自然な画像が生じることが回避できる。これにより、ボケの抑制と、エッジの周辺が光ることの抑制と、画像のベタつきの抑制とが両立できて、画質が、十分かつ確実に向上できる。This prevents edge blurring due to edge enhancement. On the other hand, the first component is removed, and it is avoided that the periphery of the edge appears to shine. Thus, although the blurring of the edge can be suppressed and the periphery of the edge can be avoided, only the first component is removed and the excessive removal is avoided. As a result, as shown in a relatively
なお、前記合成部(合成部105、エッジ強調部)は、前記補間画像(図11A)における画素値に前記補正量を足すことにより、前記補間画像におけるエッジが強調された第1の前記高解像度画像(図11B、図45下段の一点鎖線のデータ)を生成してもよい。The synthesizing unit (the synthesizing
そして、前記再補正部は、第1の前記高解像度画像における、前記エッジの周辺を光らせる、前記エッジの強調での過補正の成分(例えば、図11Bにおけるシュートの部分)を、C倍してもよい(図45のC倍値算出部1061、図46のS465A、0<C<1)。そして、再補正部は、C倍がされた当該成分にクリップを行う(閾値クリップ部1062、図46のS465B)ことにより、C倍およびクリップがされた第2の前記高解像度画像を生成してもよい。Then, the re-correction unit multiplies an overcorrection component (for example, a shoot portion in FIG. 11B) by highlighting the edge that illuminates the periphery of the edge in the first high-resolution image. (C multiple
また、前記再補正部は、前記特徴量分析部により出力される前記特徴量により示される、前記過補正の成分の箇所の傾きが大きいほど(図27、図28の横軸のより右側)、前記C(図27の縦軸)として、より小さい値を、前記クリップの幅T(図28の縦軸)として、より小さい幅をそれぞれ特定してもよい。In addition, the re-correction unit increases the inclination of the location of the overcorrection component indicated by the feature amount output from the feature amount analysis unit (on the right side of the horizontal axis in FIGS. 27 and 28), A smaller value may be specified as C (vertical axis in FIG. 27), and a smaller width may be specified as the clip width T (vertical axis in FIG. 28).
さらに、前記過補正の成分は、当該過補正の成分の全て(シュートの成分の全て)が第1の前記高解像度画像から除去された場合には、ベタつきが生じる成分であってもよい。Furthermore, the overcorrection component may be a component that causes stickiness when all of the overcorrection components (all of the shoot components) are removed from the first high-resolution image.
そして、前記特徴量分析部により出力される前記特徴量は、前記過補正の成分のうちで、当該値CでのC倍および当該幅Tでのクリップにより除去される成分(上記の第1成分)のみが除去された場合には、前記ベタつきが生じない値C及び幅Tを特定してもよい。The feature amount output by the feature amount analysis unit is a component that is removed by clipping at the value C and the clip at the width T among the overcorrected components (the first component described above). ) May be specified, the value C and the width T at which the stickiness does not occur may be specified.
そして、前記再補正部は、前記特徴量により特定される前記値Cおよび前記幅Tを各々算出し(図27、図28参照)、算出された前記値CによるC倍と、算出された前記幅Tによるクリップとを行うことにより、当該値Cおよび当該幅Tに基いて除去される前記成分のみを除去した第2の前記高解像度画像を生成してもよい。Then, the re-correction unit calculates the value C and the width T specified by the feature amount (see FIGS. 27 and 28), C times the calculated value C, and the calculated By performing clipping with the width T, the second high-resolution image from which only the component removed based on the value C and the width T is removed may be generated.
なお、従来技術(図48)においては、エッジ強調画像生成部2904により画像にエッジ強調がされた後に、エッジ強調がされた画像に対して補間画素生成部2905により補間がされる。そして、この補間の処理でも、多少のエッジ強調がされるので、エッジ強調の後に、更にエッジ強調がされるため、画質が劣化してしまう。In the prior art (FIG. 48), after the edge enhancement is performed on the image by the edge enhancement
これに対して、画像拡大装置108では、合成部105により、補正量が足されて、エッジ強調がされる前に、補間部104により補間がされて、エッジ強調の後に補間がされることによる画質の劣化が回避され、更に十分に高い画質が得られる。On the other hand, in the
(実施の形態A1の変形)
実施の形態A1においては、各画素は1つの画素値であるとして説明を行った。しかしながら、カラー画像では、赤(R)、緑(G),青(B)や、輝度(Y)、色差(Cb,Cr)といった、多次元の色空間で、その画像の内容が示されることが多い。ここでは、RGBやYCbCrといった色空間において、本技術を適応する方法について説明する。(Modification of Embodiment A1)
In the embodiment A1, description has been made assuming that each pixel has one pixel value. However, in a color image, the contents of the image are shown in a multidimensional color space such as red (R), green (G), blue (B), luminance (Y), and color difference (Cb, Cr). There are many. Here, a method of applying the present technology in a color space such as RGB or YCbCr will be described.
図12および図13は、処理する画像の色空間がYCbCrの場合の処理の例である。12 and 13 are examples of processing when the color space of the image to be processed is YCbCr.
図12において、それぞれの補間部104は、図1の補間部104と同等のもの、画像拡大部108は、図1の画像拡大部108と同等のものである。図12のシステムでは、輝度成分Yのみ、画像拡大部108による処理を実施し、色差成分CbおよびCrについては、従来の拡大の処理を施す。このように、視覚的に効果の高い輝度成分だけに、本技術の処理を施すことで、先述した効果を出しつつ、色差成分には従来の処理を施すことで、処理量の削減が期待できる。12, each
また、図13は、YCbCrのすべての成分に対して、画像拡大部108の処理を施す例を示す図である。画像拡大部108においては、図のように、各成分個別に処理することが可能である。FIG. 13 is a diagram illustrating an example in which the processing of the
図14は、処理する画像の色空間がRGB空間の場合の処理の例である。FIG. 14 shows an example of processing when the color space of the image to be processed is an RGB space.
なお、RGB空間の場合は、図14のように、各成分すべてに画像拡大部108の処理を施すのがよいが、例えばG成分のみといった、1つの成分のみに処理を行うことも可能である。In the case of the RGB space, as shown in FIG. 14, it is preferable to perform the processing of the
以上のように、多次元の色空間で定義されるカラー画像についても、画像拡大部108を各成分個別に施すことで、実施の形態A1と同様の効果を出すことができる。As described above, even for a color image defined in a multidimensional color space, the same effect as in the embodiment A1 can be obtained by applying the
(実施の形態A2)
実施の形態A2について、図を参照しながら説明を行う。(Embodiment A2)
The embodiment A2 will be described with reference to the drawings.
図15は、実施の形態A2における画像拡大装置1500のブロック図である。FIG. 15 is a block diagram of an
図15において、101は、入力画像、1501は、補間位置x,y、1502は、補間位置x,y1501の周辺6x6画素を選択する画素選択部である。また、1503は、補間位置x,y1501の小数点部分px,pyを取り出す小数点位置計算部、1504は、入力画像の6x6画素と、小数点位置px,pyを入力し、補間位置x,y1501の画素値を計算して、計算された画素値を出力する画像拡大部である。107は、拡大処理後の高解像度画像である。15, 101 is an input image, 1501 is an interpolation position x, y, and 1502 is a pixel selection unit that selects 6 × 6 pixels around the interpolation position x, y1501.
なお、画像拡大装置1500も、画像拡大装置108(先述)の下位概念の1つである。また、画像拡大部1504は、実施の形態A2の画像拡大部1504A、B2の画像拡大部1504B(図31)、C2の画像拡大部1504C(図38)の上位概念である。画像拡大部1504も、画像拡大装置108の下位概念の1つに該当する。Note that the
図16は、補間位置x,y1501と、低解像度の入力画像101、高解像度の出力画像107の関係を示す図である。FIG. 16 is a diagram showing the relationship between the interpolation position x, y1501, the low-
図16においては、拡大率が水平方向・垂直方向共に2.0倍の場合の例を示す。図16において、○印が、低解像度画像の画素位置を示し、×印が、高解像度画像として補間される画素位置を示している。つまり、図16の例では、入力画素は○印で示される画素で構成され、出力される高解像度画像は、○印と×印の両方で示される画素で構成されることになる。図中の数字は、補間位置(x,y)を示しており、入力される低解像度画像に存在する○印の画素の位置は、(0,0)(1,0)(2,0)・・・(1,0)(1,1)・・・などの、整数位置となる。また、×印の画素の位置は、(0.5,0)(1.5,0)・・といった、小数点位置を含んだ位置となる。FIG. 16 shows an example in which the enlargement ratio is 2.0 times in both the horizontal and vertical directions. In FIG. 16, a circle mark indicates the pixel position of the low resolution image, and a cross mark indicates the pixel position to be interpolated as the high resolution image. That is, in the example of FIG. 16, the input pixel is composed of pixels indicated by ◯ marks, and the output high-resolution image is composed of pixels indicated by both ◯ marks and X marks. The numbers in the figure indicate the interpolation position (x, y), and the position of the pixel marked with ○ in the input low resolution image is (0, 0) (1, 0) (2, 0). .. (1, 0) (1, 1)... Further, the position of the pixel marked with x is a position including a decimal point position such as (0.5, 0) (1.5, 0).
図17は、図15の画像拡大装置1500で、低解像度の入力画像101から、高解像度の出力画像107を生成する処理のフローチャート(S1701~S1713)である。FIG. 17 is a flowchart (S1701 to S1713) of processing for generating the high-
拡大処理では、まず、拡大画像の補間位置の増加量であるdx,dyを、例えば画素選択部1502等が計算する(S1702)。これは、入力画像101と出力画像107とのサイズから、(数A3)により計算できる。なお、式中のSw、Shは、入力画像の幅と高さ、Dw,Dhは、出力画像の幅と高さである。In the enlargement process, first, for example, the
(数A3)
dx=Sw/Dw
dy=Sh/Dh(Number A3)
dx = Sw / Dw
dy = Sh / Dh
なお、(数A3)によりdx、dyを計算するとするが、dx、dyの計算方法はこれに限るわけではない。例えば、(数A4)で計算されるdx、dyを利用しても同様の効果が期待できる。(数A4)は、特に拡大率が高倍率の場合に有効である。It should be noted that although dx and dy are calculated by (Equation A3), the calculation method of dx and dy is not limited to this. For example, the same effect can be expected by using dx and dy calculated by (Equation A4). (Equation A4) is particularly effective when the magnification ratio is high.
(数A4)
dx=(Sw-1)/Dw
dy=(Sh-1)/Dh(Number A4)
dx = (Sw-1) / Dw
dy = (Sh-1) / Dh
(数A3)の計算によると、拡大率が2倍である場合にはdx=0.5、dy=0.5が計算結果となる。According to the calculation of (Equation A3), when the enlargement ratio is double, dx = 0.5 and dy = 0.5 are the calculation results.
次に、例えば画素選択部1502等が、補間位置yを初期化し(S1703)、また、補間位置xを初期化する(S1704)。初期化がされる初期化位置が、拡大時の初期位相を決めることになるが、ここではx=0、y=0を設定するとする。なお、拡大後の画像の中心がずれないようにしたい場合には、x=-0.25、y=-0.25を設定すればよい。Next, for example, the
続いて、補間位置x、yに隣接する4画素を中心に含む周辺6×6画素を、入力画像101から画素選択部1502が取得する(S1705)。図16を例にして説明すると、例えば、補間位置が1601の位置である場合、1602の点線で示す範囲にある、補間位置1601と隣接する4画素を中心とした周辺6×6画素の入力画素を取得する。Subsequently, the
次に、補間位置x、yの小数点位置px、pyを小数点位置計算部1503が計算する(S1706)。図16の1601が補間位置の場合、x=3.5、y=2.5であるので、px、pyは、これから整数部分を取り除いたpx=0.5、py=0.5となる。Next, the decimal point
補間位置周辺の6×6画素の入力画像を取得し(S1705)、px、pyを計算した後(S1706)、これらを入力として、画像拡大処理を画像拡大部1504Aが実行する(S1707)。なお、画像拡大処理については、後で詳しく説明する。画像拡大処理の結果、補間位置に対応する出力画素値が出力されるので、これを、補間位置に対応する出力画素値として画像拡大部1504Aが格納する(S1708)。After obtaining an input image of 6 × 6 pixels around the interpolation position (S1705), calculating px and py (S1706), the
次に、補間位置を、水平方向にdxだけ、画素選択部1502等が更新する(S1709)。出力した水平方向の画素数が、出力画素数(幅)に満たない場合、S1705からの処理を繰り返す(S1710:No)。Next, the
水平方向の画素数が出力画素数である場合には(S1710:Yes)、垂直方向の補間位置をdyだけ、例えば画素選択部1502等が更新する(S1711)。出力したライン数が、出力ライン数(高さ)に満たない場合、S1704からの処理を繰り返す(S1712:No)。出力したライン数が出力ライン数である場合には、処理を終了する(S1712:Yes)。以上の処理により、拡大された高解像度画像が生成される。When the number of pixels in the horizontal direction is the number of output pixels (S1710: Yes), the interpolation position in the vertical direction is updated by dy, for example, the
図18は、S1707の画像拡大処理を行う画像拡大部1504Aの処理の流れを示したものである。以降、図18を用いて画像拡大処理について詳しく説明する。FIG. 18 shows a processing flow of the
なお、実施の形態A1の画像拡大部108Aの詳細な点は、例えば、この画像拡大部1504Aにおける通りである。Note that the detailed points of the
(特徴量分析部)
図19は、図18の特徴量分析部1803の処理の詳細を示したものである。(Feature Analysis)
FIG. 19 shows details of the processing of the feature
特徴量分析部1803では、入力画像101における、補間位置の周辺N×M画素(図17のS1705等参照)と、px、py(S1706、図18の補間座標px,py1802参照)とを入力し、特徴量として、grad0,grad1,MIN,MAXを出力する。なお、ここでは、入力である周辺N×M画素は、N=M=4画素での16画素として説明を行うが、これより小さい、または大きな範囲での画素により特徴量を計算してもよい。The feature
画像拡大部1504Aに入力された6×6画素1801(図18)のうち、中央の4×4画素が入力されると、特徴量分析部1803では、まず2×2画素ブロック毎の画素値の最大値と最小値を、ブロック毎のMIN/MAX計算部1903で計算する。Of the 6 × 6 pixels 1801 (FIG. 18) input to the
図20は、9つの2×2画素ブロックへの分割を示す図である。FIG. 20 is a diagram showing division into nine 2 × 2 pixel blocks.
2×2画素ブロックとは、図20に示すように、4×4画素を、2×2画素毎に、9ブロックに分割するブロックである。図20では、○印が画素、0~8までの数字が、ブロックの番号である。ここでは、各ブロックの最大値と最小値を、MINn、MAXn(n=0,1,2,3,...,8であり、図20のブロック番号に対応)とする。ブロック差分計算部1904では、各ブロック毎の差分DIFFnを計算する。DIFFnの計算式は(数A5)のとおりである。The 2 × 2 pixel block is a block that divides 4 × 4 pixels into 9 blocks every 2 × 2 pixels, as shown in FIG. In FIG. 20, circles indicate pixels, and numbers from 0 to 8 are block numbers. Here, the maximum value and the minimum value of each block are MINn and MAXn (n = 0, 1, 2, 3,..., 8 corresponding to the block numbers in FIG. 20). The block
(数A5)
DIFFn=MAXn-MINn(Number A5)
DIFFn = MAXn−MINn
また、エリア判定部1905では、補間座標px、py(図17のS1706)から、MIN,MAXの計算に使う2×2画素ブロックと、補間に利用するDX,DYを計算する。Further, the
図21は、4×4画素と、px、pyと、補間画素の関係を示した図である。FIG. 21 is a diagram showing the relationship among 4 × 4 pixels, px, py, and interpolation pixels.
補間位置x,yの小数点成分がpx、pyなので、0.0≦px、py<1.0となり、px、pyの位置は、図21斜線の範囲内となる。Since the decimal point components of the interpolation positions x and y are px and py, 0.0 ≦ px and py <1.0, and the positions of px and py are within the shaded area in FIG.
px、pyが、図21のa,b,c,dのどのエリアにあるかで、補間に利用するMINn、MAXnを、図22のように変える。MINn and MAXn used for interpolation are changed as shown in FIG. 22 depending on which area of a, b, c, and d in FIG.
すなわち、図22Aの斜線で示されるブロックは、図21のaのエリアにpx、pyがある場合に選択されるMINn、MAXnを示している。図22Bの斜線で示されるブロックは、図21のbのエリアにpx、pyがある場合に選択されるMINn、MAXnを示している。図22Cの斜線で示されるブロックは、図21のcのエリアにpx、pyがある場合に選択されるMINn、MAXnを示している。図22Dの斜線で示されるブロックは、図21のdのエリアにpx、pyがある場合に選択されるMINn、MAXnを示していている。That is, blocks indicated by diagonal lines in FIG. 22A indicate MINn and MAXn selected when px and py are present in the area of FIG. Blocks indicated by diagonal lines in FIG. 22B indicate MINn and MAXn selected when px and py are present in the area b of FIG. Blocks indicated by diagonal lines in FIG. 22C indicate MINn and MAXn selected when px and py exist in the area c of FIG. Blocks indicated by diagonal lines in FIG. 22D indicate MINn and MAXn selected when px and py exist in the area d in FIG.
これにより、補間位置x,yの近傍における、2×2画素ブロックが選択される。Thereby, a 2 × 2 pixel block in the vicinity of the interpolation position x, y is selected.
(数A6)は、MI0、MI1,MI2,MI3と、MA0,MA1,MA2、MA3,DX,DYを求める式である。すなわち、MI0~MI3として、選択された2×2画素ブロックのMINnが用いられ、MA0~MA3として、選択された2×2画素ブロックのMAXnが用いられる。なお、(数A6)において、「DX=Px+0.5」とあるのは、2×2画素ブロックにおける左列の2つのブロック(例えば0と3)の中心のx座標までの、補間位置x,yのx座標からの距離と、右列の2つのブロック(1と4など)の中心のx座標までの距離の2つの距離の比を示す。他のDX,DYの式についても、この例と同様である。(Equation A6) is an equation for obtaining MI0, MI1, MI2, MI3 and MA0, MA1, MA2, MA3, DX, DY. That is, MINn of the selected 2 × 2 pixel block is used as MI0 to MI3, and MAXn of the selected 2 × 2 pixel block is used as MA0 to MA3. In (Equation A6), “DX = Px + 0.5” means that the interpolation position x, up to the x coordinate of the center of two blocks (for example, 0 and 3) in the left column in the 2 × 2 pixel block. The ratio of the two distances, the distance from the x coordinate of y to the x coordinate of the center of the two blocks (such as 1 and 4) in the right column, is shown. The other DX and DY equations are the same as in this example.
(数A6)
aのエリアの場合)
MI0=MIN0
MI1=MIN1
MI2=MIN3
MI3=MIN4
MA0=MAX0
MA1=MAX1
MA2=MAX3
MA3=MAX4
DX=Px+0.5
DY=Py+0.5
bのエリアの場合)
MI0=MIN1
MI1=MIN2
MI2=MIN4
MI3=MIN5
MA0=MAX1
MA1=MAX2
MA2=MAX4
MA3=MAX5
DX=Px-0.5
DY=Py+0.5
cのエリアの場合)
MI0=MIN3
MI1=MIN4
MI2=MIN6
MI3=MIN7
MA0=MAX3
MA1=MAX4
MA2=MAX6
MA3=MAX7
DX=Px+0.5
DY=Py-0.5
dのエリアの場合)
MI0=MIN4
MI1=MIN5
MI2=MIN7
MI3=MIN8
MA0=MAX4
MA1=MAX5
MA2=MAX7
MA3=MAX8
DX=Px-0.5
DY=Py-0.5(Number A6)
(For area a)
MI0 = MIN0
MI1 = MIN1
MI2 = MIN3
MI3 = MIN4
MA0 = MAX0
MA1 = MAX1
MA2 = MAX3
MA3 = MAX4
DX = Px + 0.5
DY = Py + 0.5
(In the case of area b)
MI0 = MIN1
MI1 = MIN2
MI2 = MIN4
MI3 = MIN5
MA0 = MAX1
MA1 = MAX2
MA2 = MAX4
MA3 = MAX5
DX = Px−0.5
DY = Py + 0.5
(C area)
MI0 = MIN3
MI1 = MIN4
MI2 = MIN6
MI3 = MIN7
MA0 = MAX3
MA1 = MAX4
MA2 = MAX6
MA3 = MAX7
DX = Px + 0.5
DY = Py-0.5
(d area)
MI0 = MIN4
MI1 = MIN5
MI2 = MIN7
MI3 = MIN8
MA0 = MAX4
MA1 = MAX5
MA2 = MAX7
MA3 = MAX8
DX = Px−0.5
DY = Py-0.5
特徴量計算部1906では、ブロック差分計算部1904で計算したDIFFn、エリア判定部で計算したMI0~3,MA0~3、DX,DYから、grad0,grad1,MIN,MAXを算出する。The feature
(数A7)に算出式を示す。なお、(数A7)において、max()は、「()」の中の複数の要素の値の中の、最大の値を返す関数、C0は定数とする。また、grad0とgrad1は、画素値の範囲内にクリップされるものとする。(Expression A7) shows the calculation formula. In (Equation A7), max () is a function that returns the maximum value among the values of a plurality of elements in "()", and C0 is a constant. Also, grad0 and grad1 are clipped within the range of pixel values.
(数A7)
MAX=(1-dy)((1-dx)・MA0+dx・MA1)+dy((1-dx)・MA2+dx・MA3)
MIN=(1-dy)((1-dx)・MI0+dx・MI1)+dy((1-dx)・MI2+dx・MI3)
grad0=(MAX-MIN)・C0
grad1=((MAX-MIN)+max(DIFF0、DIFF1,...,DIFF8))・C0/2(Equation A7)
MAX = (1-dy) ((1-dx) .MA0 + dx.MA1) + dy ((1-dx) .MA2 + dx.MA3)
MIN = (1-dy) ((1-dx) .MI0 + dx.MI1) + dy ((1-dx) .MI2 + dx.MI3)
grad0 = (MAX-MIN) · C0
grad1 = ((MAX−MIN) + max (DIFF0, DIFF1,..., DIFF8)) · C0 / 2
以上のように、特徴量分析部1803では、grad0,grad1,MIN,MAXを出力する(図46のS462)。As described above, the feature
ここで、(数A7)によれば、grad1は、grad0に比べて、ブロック内の一番大きな最大値と最小値の影響を受けることになる。このため、4×4画素内に大きな傾斜があると、grad1は、大きな値を示すようになる。つまり、grad1は、grad0よりも大きな値をとりやすくなる。Here, according to (Equation A7), grad1 is affected by the largest maximum and minimum values in the block compared to grad0. For this reason, if there is a large inclination in the 4 × 4 pixels, grad1 shows a large value. That is, grad1 tends to take a larger value than grad0.
なお、特徴量分析部1803の出力としては、これに限るものではなく、例えば、4×4画素中(図22A~22D参照)の最大値をMAX,最小値をMINとし、MAX-MINをgrad1に、MAX4-MIN4をgrad0に設定してもよい。この場合は、拡大補間に利用する参照画素が同じ間は、MAX,MIN,grad0、grad1が固定となってしまうため、高倍率拡大でブロック境界が目立つことがあるが、2倍程度の拡大倍率では、本実施の形態と同様の効果が期待できる。Note that the output of the feature
(補正量計算部)
図23は、図18の補正量計算部1804の処理の詳細を示したものである。(Correction amount calculator)
FIG. 23 shows details of the processing of the correction
補正量計算部1804では、入力画像101(図15)の補間位置の周辺N×M画素2301(図17のS1705)と、特徴量分析部1803で計算したgrad0(図23のgrad02302)を入力し、補正量Oeを出力する。なお、ここではN=M=6画素として説明を行うが、このN、Mでの範囲より小さい、または、大きな範囲を利用してOeを算出してもよい。In the correction
帯域制限部2306では、入力画素6×6画素(図23のN×M画素2301)を用いて、帯域制限された4×4画素を生成する。ここでは帯域制限に、水平・垂直3×3タップのローパスフィルタ(LPF)を利用することとする。3×3タップのLPFを利用する場合、4×4画素のLPF結果を生成するには、上下左右に+1画素が必要となる。このため、補正量計算部1804の入力は、6×6画素となる。なお、帯域制限の方法としては、3×3タップに限らず、より多タップのフィルタを利用することができる。この場合は、入力される画素数が増加することになるが、帯域制限フィルタの特性を向上させることができる。The
なお、2次元的なLPFフィルタではなく、水平方向にLPF処理した後に、垂直方向にLPF処理したり、あるいは逆に、垂直方向にLPF処理を行い、その後水平方向にLPFフィルタを施してもよい。いずれの場合も同様の効果が期待できる。Instead of the two-dimensional LPF filter, the LPF process in the horizontal direction may be followed by the LPF process in the vertical direction, or conversely, the LPF process may be performed in the vertical direction and then the LPF filter may be applied in the horizontal direction. . In either case, the same effect can be expected.
補間部2303と補間部2307では、補間位置px、pyと±1画素はなれた位置の画素値を、補間計算により求める。
図24は、4x4の入力画素値をv00~v33とした場合の、補間位置px、pyの画素の位置を示した図である。FIG. 24 is a diagram showing the positions of the pixels at the interpolation positions px and py when the input pixel value of 4 × 4 is v00 to v33.
図25は、i00~i22の8箇所を示す図である。FIG. 25 is a diagram showing eight locations i00 to i22.
画素位置2308に対して±1画素はなれた位置は、図25に示すi00、i01、i02、i10,i12,i20,i21,i22の8箇所になる。補間部2303では、入力された4×4画素を用いて、px、py位置を含めた9点の画素値を算出する。また、補間部2307では、帯域制限部2306により帯域制限された4×4画素を用いて、px、py位置を含めた9点の画素値を、補間により算出する。The positions that are ± 1 pixel away from the
なお、補間の方法としてはバイリニア法、バイキュービックコンボリューション法などが利用できるが、4×4画素の範囲で処理を施す場合には、バイリニア法が適当である。なお、バイキュービックコンボリューション法で処理を行う場合には、6×6画素より大きな画素範囲で処理を施すのが好ましい。As a method of interpolation, a bilinear method, a bicubic convolution method, or the like can be used. However, when processing is performed in a 4 × 4 pixel range, the bilinear method is appropriate. In addition, when processing by the bicubic convolution method, it is preferable to perform processing in a pixel range larger than 6 × 6 pixels.
エッジ抽出部2304では、補間部2303または補間部2307の出力結果を用いてエッジ成分の抽出を行う。このとき、傾斜の強さを示すgrad0の値により、補間部2303または補間部2307のどちらの結果を利用してエッジ成分を抽出するかを切り替える。例えば、grad0が小さい、つまり傾斜が小さい部分では、補間部2303の結果を使ってエッジ抽出を行い、grad0が大きい場合には、帯域制限された補間部2307の結果を使ってエッジ抽出を行うなどが考えられる。このようにすることで、小さなエッジ部分では小さなエッジも捕まえ、かつ、大きなエッジでは、ノイズ成分をLPFにより除去した後のエッジ成分を抽出することが可能になる。The
なお、エッジ成分の抽出方法としては、図6のような係数と、i00~i22を掛け合わせればよい。なお、図6の係数によるエッジ抽出は処理の一例であり、例えば図5のような係数、あるいは他の係数を利用して、エッジ成分の抽出を行ってもよい。なお、このフィルタ係数を変更することで、抽出するエッジ成分の強さや帯域を変更することができる。また、抽出されたエッジ成分のノイズ成分を除去するために、コアリングと呼ばれる、0近辺のエッジ成分を0に丸める非線形な処理を行うことで、ノイズ成分を強調しないようにすることができる。As an edge component extraction method, a coefficient as shown in FIG. 6 may be multiplied by i00 to i22. Note that the edge extraction using the coefficients shown in FIG. 6 is an example of processing, and for example, the edge components may be extracted using the coefficients shown in FIG. 5 or other coefficients. Note that the strength and band of the edge component to be extracted can be changed by changing the filter coefficient. Further, in order to remove the noise component of the extracted edge component, it is possible to prevent the noise component from being emphasized by performing a non-linear process called rounding that rounds the edge component near 0 to 0.
補正部2305では、エッジ抽出部2304で抽出されたエッジ成分と、grad0を用いて補正量Oe(図18)を計算する(図46のS463)。The
ここでは、まずgrad0から抽出した、エッジ成分に対して乗算するゲインを求める。Here, first, a gain for multiplying the edge component extracted from grad0 is obtained.
図26は、grad0からゲインを求めるテーブルの例である。FIG. 26 is an example of a table for obtaining a gain from grad0.
図26では、横軸がgrad0、縦軸がゲインである。図26の例では、傾斜が小さい、すなわち、grad0が小さい部分でのゲインは小さく、傾斜が大きい部分では、ゲインを大きくするようなグラフになっている。ここで、傾斜が小さい部分は、ノイズ成分である可能性が大きい。このため、この部分のゲインを大きくすると、ノイズを強調してしまう。このため、傾斜が小さい部分では、抑え気味の設定にされる。また、傾斜が大きな部分では、エッジである信頼性が高いので、強くゲインを掛けて、傾斜をより大きくする設定にされる。In FIG. 26, the horizontal axis is grad0 and the vertical axis is gain. In the example of FIG. 26, the graph is such that the gain is small in the portion where the slope is small, that is, grad0 is small, and the gain is increased in the portion where the slope is large. Here, there is a high possibility that a portion with a small inclination is a noise component. For this reason, increasing the gain in this portion emphasizes noise. For this reason, in the part with a small inclination, it is set as a restrained feeling. In addition, since the reliability of the edge is high in the portion where the slope is large, the slope is further increased by applying a strong gain.
なお、これに限らず、grad0とゲインの関係は自由に設定してよい。例えばgrad0が中くらいの部分が最も高くなるように設定したり、いくつかの箇所に山があるような設定にしてもよい。また、grad0とゲインの関係は、数式で表現してもよいし、テーブルで持たせてもよい。テーブルの量を削減するために、いくつかのポイントだけ保持しておき、線形補間や曲線補間で補間してもよい。Note that, not limited to this, the relationship between grad0 and gain may be set freely. For example, it may be set so that the middle part of grad0 is the highest, or may be set such that there are mountains at some places. Further, the relationship between grad0 and gain may be expressed by a mathematical expression or may be given by a table. In order to reduce the amount of the table, only some points may be retained and interpolation may be performed by linear interpolation or curve interpolation.
ゲインが計算されたら、補正量計算部1804では、抽出したエッジ成分を、ゲイン倍した結果をOeとして出力する。When the gain is calculated, the correction
補正量計算部1804では、図25に示すように、補間位置Px,Pyの±1画素に相当する画素位置の画素の値を補間計算し、計算された9画素を用いてエッジ成分を抽出している。補間位置Px,Pyの±1画素に相当する画素位置の値は、拡大率が2.0倍であれば、拡大後の高解像度画像に存在する画素位置となるが、拡大率によっては高解像度画像には存在しない画素位置となる。例えば2.5倍の場合、拡大後の画素の位置として、0、0.4、0.8、1.2、1.6、2、2.4、2.8・・・といった画素位置の画素が補間されることになる。しかし、1.6の補間位置の画素位置の±1画素にあたる、0.6と2.6に相当する画素位置の画素は、拡大によって生成されないことになる。本実施の形態では、エッジ成分の抽出に、±1画素の位置の画素を補間生成することで、拡大前や拡大後の画像の画素値を用いてエッジ抽出するのに比べて、補間位置に対して精度のよい、良好なエッジ成分を抽出することができる。As shown in FIG. 25, the correction
また、補正量計算部1804では、コアリングやテーブル引きといった非線形な処理が含まれている。このような処理が含まれているので、エッジ強調後に拡大を行った場合や、拡大後にエッジ強調を行った場合などとは、結果は一致しない。エッジ補正量の計算の場合、このような非線形な処理が含まれることが多いが、順番に処理を行う場合には非線形な処理の結果が、後の処理に好ましくない影響を与えてしまう可能性がある。本実施の形態では、低解像度画像から、直接、高解像度画像の画素数の補正量を計算することで、拡大処理やエッジ強調処理を順番に行った場合に発生する、好ましくない副作用を抑制している。なお、本実施の形態では、9画素を補間生成した後にエッジ抽出を行うとしたが、補間生成の式とエッジ抽出を同時に行うような行列式を予め用意しておき、一気に変換してもよい。一気に変換した場合は、無駄な演算を省くことが可能となり、小規模なハードウェア構成、または演算量での実現が可能となる。Also, the correction
(補間部)
補間部1805(図18)では、入力された6×6画素1801と、補間座標Px,Py1802より、画素位置Px、Pyの画素値を補間して、補間画像OLを出力する(図46のS461)。補間部1805での補間は、バイリニア法やバイキュービックコンボリューション法などで行う。なお、これらの拡大技術は一般的な技術であり、本実施の形態の骨子ではないので詳しい説明は省略する。(Interpolation part)
The interpolation unit 1805 (FIG. 18) interpolates the pixel values at the pixel positions Px and Py from the
(合成部)
合成部1806では、補間部1805で生成した、高解像度画像の画素値OLに、補正量計算部1804で計算したOeを足し込み、合成された出力画素値Oを出力する(図46のS464)。(Synthesizer)
In the
(数A8)はこのOの計算式である。(Equation A8) is a calculation formula of this O.
(数A8)
O=OL+Oe(Number A8)
O = OL + Oe
(再補正部)
再補正部1807では、合成部1806で合成した画素値Oと、特徴量分析部1803で計算された特徴量grad1,MIN,MAXを用いて、画素値の補正を行い、補正された画素値O’を出力する(図46のS465)。(Re-correction part)
The
(数A9)は、出力値Oの計算式である。(Number A9) is a calculation formula of the output value O.
(数A9)
O > MAXのとき、O = MAX+min((O-MAX)・GAIN,LIMIT)
O < MINのとき、O = MIN-min((MIN-O)・GAIN,LIMIT)
それ以外のとき、 O’=O(Number A9)
When O> MAX, O = MAX + min ((O−MAX) · GAIN, LIMIT)
When O <MIN, O = MIN-min ((MIN-O) · GAIN, LIMIT)
Otherwise, O '= O
(数A9)中のGAIN,LIMITは、grad1から計算されるパラメータである。(GAIN and LIMIT in (A9) are parameters calculated from grad1.
図27は、grad1とGAINの関係を示したものである。FIG. 27 shows the relationship between grad1 and GAIN.
図27では、grad1が小さい場合にはゲインを大きく、grad1が大きくなるほど、ゲインを小さくした設定となる(図46のS465b、図45のC倍値算出部1061)。In FIG. 27, when grad1 is small, the gain is increased, and as grad1 is increased, the gain is set to be smaller (S465b in FIG. 46, C multiple
図28は、grad1とLIMITの関係を示したものである。FIG. 28 shows the relationship between grad1 and LIMIT.
図28では、grad1が小さい場合にLIMITが大きく、grad1が大きい場合にLIMITが小さくなる設定となる(図46のS465c、図45の閾値クリップ部1062)。28, LIMIT is set to be large when grad1 is small, and LIMIT is set to be small when grad1 is large (S465c in FIG. 46,
上記のように設定すると、grad1が大きい部分、つまり強いエッジ成分を含む部分では、LIMITによるクリップがきっちりとされる(強くなる)ため、くっきりした映像になる。一方、小さな振幅を含む部分では、クリップがあまりされないため、シュートをカットしたことによる不自然感を抑えることができる。When set as described above, the clip by LIMIT is made clear (strong) in a portion where grad1 is large, that is, a portion including a strong edge component, so that a clear image is obtained. On the other hand, in the portion including a small amplitude, clipping is not so much, so that unnatural feeling caused by cutting the chute can be suppressed.
なお、図27および28は設定の一例であり、grad1とGAIN,LIMITの関係は利用者により自由に設定できるものとする。27 and 28 are examples of settings, and the relationship between grad1 and GAIN and LIMIT can be set freely by the user.
以上のように、本実施の形態Aの画像拡大装置によれば、自然なかつ強いシュートがなくエッジがすっきりと立った映像(図10)を生成することができる。このとき、拡大前後でエッジ強調を行った場合に発生するシュート(図8)を発生させることなく、かつ、シュートをまったく発生させないことによる不自然な画像(図9)のようになることもない。As described above, according to the image enlarging apparatus of the present embodiment A, it is possible to generate a video (FIG. 10) with a natural and strong shoot without a sharp edge. At this time, a shoot (FIG. 8) that occurs when edge enhancement is performed before and after enlargement is not generated, and an unnatural image (FIG. 9) due to the absence of a shoot is not generated. .
要約すれば、次の通りである。すなわち、低解像度画像(図1、図15の入力画像101)を高解像度画像(図1、図15の出力画像107)に拡大して表示する場合、拡大によりボケた映像になってしまう問題がある。そこで、低解像度の入力画像を入力し、高解像度の出力画像を入力する画像拡大装置(画像拡大装置108、画像拡大部1504、画像拡大装置1500)において、入力画像の特徴量を分析し、高解像度画像の画素数の特徴量を生成する特徴量分析部(特徴量分析部102、特徴量分析部1803)と、低解像度の入力画像を入力し、特徴量を元に、高解像度の画素数のエッジ補正量を計算し、出力する補正量計算部(補正量計算部103、補正量計算部1804)と、補間により、拡大後の画像(補間画像)を生成する補間部(補間部104、補間部1805)と、補間画像と補正量を合成する合成部(合成部105、合成部1806)と、特徴量と合成後の画素値を入力し、再度補正を行うことで、入力画像にあわせた補正を行う再補正部(再補正部106、再補正部1807)を備え、くっきり、かつシュートを抑えた拡大画像を生成する。In summary, it is as follows. That is, when a low-resolution image (the
この画像拡大装置によれば、ボケの抑制と、エッジの周辺が光ることの抑制と、画像のベタつきの回避とが両立できて、画質が十分かつ確実に向上できる。According to this image enlarging apparatus, it is possible to achieve both of suppression of blurring, suppression of shining around the edge, and avoiding stickiness of the image, and the image quality can be sufficiently and reliably improved.
<<実施の形態B>>
以下、実施形態Bを、図面を参照しながら説明する。実施の形態Bは、実施の形態Aを変形した変形例である。実施の形態Bにおいて、先述の説明と同様である点については、適宜、重複した説明が省略される。なお、以下では、先述の図(図1~図29)が、適宜、参照される。そして、実施の形態Bの構成のうちで、先述の構成に対応する構成については、適宜、先述の構成の符号と同じ符号が用いられたり、先述の構成の名称と同じ名称が用いられたりする。<< Embodiment B >>
Hereinafter, Embodiment B will be described with reference to the drawings. The embodiment B is a modification of the embodiment A. In Embodiment B, the same description as that described above is appropriately omitted. In the following, the above-described figures (FIGS. 1 to 29) will be referred to as appropriate. And among the configurations of Embodiment B, for configurations corresponding to the above-described configurations, the same reference numerals as those of the above-described configurations are used as appropriate, or the same names as the names of the above-described configurations are used as appropriate. .
実施の形態Bに係る画像拡大装置(画像拡大装置108B、画像拡大部1504Bなど)は、前記再補正部は、前記合成部により出力された第1の前記高解像度画像(図32A、図30B及び図47の点線)を、前記特徴量分析部により生成された前記特徴量と、前記補間部が出力した前記補間画像(図30A、図30B、図47のIx,y)とから求められる閾値(図30A、図30B、図47のU’x,y参照)を用いて再度、補正し、補正された第2の前記高解像度画像(図30Bの太い実線、図32C、図47の広いピッチの太い破線)を生成する画像拡大装置である。In the image enlarging apparatus (an
(実施の形態B1)
図29は、実施形態B1における画像拡大部108B(画像拡大部108の下位概念(一例))のブロック図を示す。(Embodiment B1)
FIG. 29 is a block diagram of the
図29において、101は、低解像度の入力画像(元画像)、102は、低解像度の入力画像101から出力する高解像度画像(第1の高解像度画像、第2の高解像度画像)の各画素に対応する特徴量を出力する特徴量分析部である。103は、特徴量分析部102の出力した特徴量に応じて、エッジ成分の補正量を計算し、出力する高解像度画像(第2の高解像度画像)の各画素の補正量を計算し、出力する補正量計算部である。104は、低解像度の入力画像101を入力して、出力する高解像度画像の画素数と同じ画素数の画像(補間画像)を生成する補間部である。105は、補間部104から出力された高解像度画像(補間画像)の画素を受け取ると共に、画素に対応する補正量を補正量計算部103から受け取り、補正した画素(第1の高解像度画像)を出力する合成部である。106は、特徴量分析部102から受け取った、出力画素に対応する特徴量と、補間部104が生成した画素値から計算される閾値を用いて、合成部105が出力した合成結果(第1の高解像度画像)を再補正して、出力する再補正部である。107は、出力される高解像度画像(第2の高解像度画像)である。108Bは、低解像度画像を入力して、高解像度画像(第2の高解像度画像)を出力する画像拡大部である。29,
以下、実施の形態B1の画像拡大部108B(図29)に設けられた再補正部106が行う再補正の手順について説明を行う。Hereinafter, the recorrection procedure performed by the
高解像度画像(第1の高解像度画像)の、画素位置(x,y)に対応する合成部105の出力画素値をXx,y(図47の点線のデータ)、特徴量分析部102により算出された上限値をUx,y(図47の狭いピッチの細い一点鎖線のデータ),下限値をLx,y、補間部104が生成した画素値(補間画像)をIx,y(図47の実線のデータ)とする。この時、再補正部106では、(数B1)の演算により、上限の閾値U’x,y(図47の狭いピッチの細い破線のデータ)と下限の閾値L’x,y、および、上限側のリミット値TU(図47における、極大点でのU’x,y+TUの値M1参照)と下限側のリミット値TLを計算する。なお、(数B1)においてα、Tは予め設定された定数であり、αは0.0~1.0の範囲をとる。The output pixel value of the synthesizing
(数B1)
下限側の計算
Ix,y ≦ Lx,yのとき、L'x,y = Lx,y
TL = T
Ix,y > Lx,yのとき、d0 = Ix,y - Lx,y
d0' = d0 × α
L'x,y = Ix,y - d0'
TL = T + d0 - d0'
上限側の計算
Ux,y ≦ Ix,yのとき、U'x,y = Ux,y
TU = T
Ux,y > Ix,yのとき、u0 = Ux,y - Ix,y
u0'= u0 × α
U'x,y = Ix,y + u0'
TU = T + u0 - u0'(Number B1)
When the lower limit calculation Ix, y ≤ Lx, y, L'x, y = Lx, y
TL = T
When Ix, y> Lx, y, d0 = Ix, y−Lx, y
d0 ′ = d0 × α
L′ x, y = Ix, y−d0 ′
TL = T + d0-d0 '
When Ux, y ≤ Ix, y on the upper limit side, U'x, y = Ux, y
TU = T
When Ux, y> Ix, y, u0 = Ux, y-Ix, y
u0 '= u0 x α
U'x, y = Ix, y + u0 '
TU = T + u0-u0 '
なお、ここで、図47のβは、上記のαに対して、β=1-α(0<β<1)の関係を有する。Here, β in FIG. 47 has a relationship of β = 1−α (0 <β <1) with respect to α described above.
すなわち、先述のUx,yよりも、(Ux,y-Ix,y)×βだけ小さい値が、U'x,yとして算出される(図47の狭いピッチの破線の細い矢印線参照)。U'x,yは、Ix,yまでの距離として、Ux,yからIx,yまでの距離(Ux,y-Ix,y)のうちの、割合βの部分((Ux,y-Ix,y)×β)が、Ux,yから減じられた距離を有する。That is, a value smaller by (Ux, y−Ix, y) × β than the above-mentioned Ux, y is calculated as U′x, y (see the thin arrow line with a narrow broken line in FIG. 47). U′x, y is the distance from Ix, y to the portion (Ux, y−Ix, y) from Ux, y to Ix, y (portion β) ((Ux, y−Ix, y y) × β) has a distance subtracted from Ux, y.
なお、図29における、補間部104から再補正部106への矢印線(図31の補間部1805から再補正部1807への矢印線)は、このようなU'x,yを算出するために、再補正部106(再補正部1807)により、Ix,yが補間部104(補間部1805)から取得されることを示す。In FIG. 29, an arrow line from the
(数B1)により、U’x,y, L’x,yおよびTU, TLを計算した後、再補正部106(図45のC倍値算出部1061、図46のS465)では、(数B2)の演算により補正値Px,yを計算する。なお、ここで、計算される補正値Px,yは、図47において、補正値Px,y(B)1102(広いピッチの太い破線のデータ)として示される。After calculating U′x, y, L′ x, y and TU, TL by (Equation B1), the recorrection unit 106 (C multiple
(数B2)
Xx,y > U'x,yのとき、 Px,y=U'x,y + (Xx,y - U'x,y)× C
Xx,y < L'x,yのとき、 Px,y=L'x,y - (L'x,y - Xx,y)× C
それ以外のとき、 Px,y=Xx,y(Number B2)
When Xx, y> U′x, y, Px, y = U′x, y + (Xx, y−U′x, y) × C
When Xx, y <L′ x, y, Px, y = L′ x, y− (L′ x, y−Xx, y) × C
Otherwise, Px, y = Xx, y
なお、数式においてCはあらかじめ設定された0.0~1.0の範囲の定数である。In the formula, C is a preset constant in the range of 0.0 to 1.0.
なお、先述の通り、Ux,y>Ix,yのとき、U'x,y=Ux,y-(Ux,y-Ix,y)×βである。このため、「Ux,y>Ix,y かつ Xx,y>U'x,y」のときにおいて、Px,y=Px,y(B)=U'x,y+(Xx,y-U'x,y)×C={Ux,y+(Xx,y-Ux,y)×C}-(Ux,y-Ix,y)×β×(1-C)=Px,y(A)-(Ux,y-Ix,y)×γである(γ=β×(1-C)、0<γ<1、図47参照)。なお、ここで、Px,y(B)は、この実施の形態B1での補正値Px,y(Px,y(B))ではなく、実施の形態Aにおける先述の補正値Px,y(図47の広いピッチの太い一点鎖線)を示す。つまり、Px,y(B)は、先述のPx,y(A)よりも、上述の(Ux,y-Ix,y)×γだけ小さい値である(図47の広いピッチの太い破線の矢印線参照)。As described above, when Ux, y> Ix, y, U′x, y = Ux, y− (Ux, y−Ix, y) × β. Therefore, when “Ux, y> Ix, y and Xx, y> U′x, y”, Px, y = Px, y (B) = U′x, y + (Xx, y−U′x , y) × C = {Ux, y + (Xx, y−Ux, y) × C} − (Ux, y−Ix, y) × β × (1−C) = Px, y (A) − (Ux , y−Ix, y) × γ (γ = β × (1-C), 0 <γ <1, see FIG. 47). Here, Px, y (B) is not the correction value Px, y (Px, y (B)) in this embodiment B1, but the correction value Px, y described above in the embodiment A (FIG. 47 shows a thick dotted line with a wide pitch). That is, Px, y (B) is a value smaller than the above-described Px, y (A) by the above-mentioned (Ux, y−Ix, y) × γ (a thick broken line arrow in FIG. 47). See line).
この計算により、上限値U'x,y(<Ux,y)と下限値L'x,y(<Lx,y)を超えた部分が、C倍(クリッピング)される。Cは1.0以下に設定するため、結果として、U’x,yとL’x,yにはさまれた範囲を超えた部分が、補正されて小さくなることになる。に よ り By this calculation, the portion exceeding the upper limit value U′x, y (<Ux, y) and the lower limit value L′ x, y (<Lx, y) is C times (clipped). Since C is set to 1.0 or less, as a result, the portion beyond the range between U′x, y and L′ x, y is corrected and becomes smaller.
次に、(数B3)の演算により補正値Px,yをさらに補正して、第2の補正値P’x,y(Px,y(B)の極大点近くの平坦部分)を計算する。また、min(a,b)は、aとbのうちどちらか小さいほうを選択する関数である。Next, the correction value Px, y is further corrected by the calculation of (Equation B3) to calculate the second correction value P′x, y (a flat portion near the maximum point of Px, y (B)). Further, min (a, b) is a function that selects the smaller one of a and b.
(数B3)
Px,y > U'x,yのとき、 P'x,y=U'x,y + min(Px,y - U'x,y ,TU)
Px,y < L'x,yのとき、 P'x,y=L'x,y - min(L'x,y - Px,y ,TL)
それ以外のとき、 P'x,y=Px,y(Number B3)
When Px, y> U′x, y, P′x, y = U′x, y + min (Px, y−U′x, y, TU)
When Px, y <L'x, y, P'x, y = L'x, y-min (L'x, y-Px, y, TL)
Otherwise, P'x, y = Px, y
(数B3)により、TU,TL(値M1)を超えるオーバーシュートとアンダーシュート成分が、TUまたはTLに変換される。(Equation B3) converts overshoot and undershoot components exceeding TU and TL (value M1) into TU or TL.
再補正部106では、この第2の補正値P’x,y(図47のPx,y(B))を出力する(図46のS465d、図45の閾値クリップ部1062)。The
図30Aは、Ux,y,Lx,y,Ix,y,U’x,y,L’x,y,TUおよびTLの関係を図示したものである。FIG. 30A illustrates the relationship between Ux, y, Lx, y, Ix, y, U'x, y, L'x, y, TU, and TL.
定数αが0.0~1.0の範囲であるため、それぞれの関係は図30Aのようになる。図30Aでは、U’x,yとL’x,yは、Ux,yおよびLx,yよりもIx,yに近い値となり(図47参照)、合成部105の出力が、U’x,yとL’x,yを超えた部分について、(数B2)および(数B3)の補正をされることになる。なお、U’x,y+TU=Ux,y+Tであり(図47参照)、L’x,y-TL=Lx,y-Tである。Since the constant α is in the range of 0.0 to 1.0, each relationship is as shown in FIG. 30A. In FIG. 30A, U′x, y and L′ x, y are values closer to Ix, y than Ux, y and Lx, y (see FIG. 47), and the output of the combining
図30Bは、(数B2)、(数B3)による補正を行った例である。FIG. 30B is an example in which correction is performed using (Equation B2) and (Equation B3).
なお、図47は、図30Bを模式的にしたグラフを示す。図47の詳細については、適宜、図30Bを参照されたい。FIG. 47 is a graph schematically showing FIG. 30B. For details of FIG. 47, refer to FIG. 30B as appropriate.
図30Bにおいて、点線(丸)で示される折れ線1101(図47の点線のデータ)は、合成部105の出力、太い実線で示される折れ線1102(図47の広いピッチの太い破線のデータ)は、再補正部106の出力である。また、細い実線で示される折れ線(図47の実線のデータ)は、補間部104の出力Ix,yであり、破線はそれぞれU'x,y,L’x,y,U’x,y+TU,L’x,y-TLである(図47の狭いピッチの細い一点鎖線のデータ、値M1の二点鎖線のデータ)。In FIG. 30B, a broken line 1101 (dotted line data in FIG. 47) indicated by a dotted line (circle) is an output of the combining
図30Bのように、1101がU’x,yを超えるポイント1103(図47参照)で、定数C(C=1-γ/β(γ<β))により出力(Px,y(B))の傾きが変わり、U’x,y+TUを超えるポイント1104で、U’x,y+TU(図47の二点鎖線)にクリップされる。As shown in FIG. 30B, at a point 1103 (see FIG. 47) where 1101 exceeds U′x, y, an output (Px, y (B)) with a constant C (C = 1−γ / β (γ <β)). Is changed, and is clipped to U′x, y + TU (two-dot chain line in FIG. 47) at a
同様に、L’x,y以下になるポイント1105より、出力の傾きが変えられ、L’x,y-TL以下になるポイント1106で、L’x,y-TLにクリップされる。図30Bのように、1101で示される、合成部105の信号(Xx,y、図47の点線のデータ)に対して、オーバーシュートとアンダーシュートが抑制され、かつ、エッジの傾斜の強い画像が生成される。なお、エッジの傾きの補正が、上限値または下限値の手前から行われるため、傾斜を立てたことによる不自然さも抑制できる。Similarly, the slope of the output is changed from the
以上のように、実施の形態B1によれば、拡大処理によるボケをエッジ強調により緩和しつつ、かつ、エッジ強調によるシュートの発生を抑制した自然な映像を提供することができる。これにより、低解像度画像を拡大した場合でも、映像の先鋭感を失うことなく自然な映像を表示することが可能になる。As described above, according to Embodiment B1, it is possible to provide a natural image in which blurring due to enlargement processing is reduced by edge enhancement and generation of shoots due to edge enhancement is suppressed. As a result, even when a low-resolution image is enlarged, a natural video can be displayed without losing the sharpness of the video.
なお、図47のポイント1103xは、実施の形態B1におけるポイント1103に対応する、実施の形態A1のPx,y(A)によるポイントを示す。Note that a
そして、範囲106yは、Px,y(B)での補正で平坦化される範囲を示し、範囲106yCは、Px,y(A)での補正で平坦化される範囲を示す。The
そして、上記のように、前記再補正部(再補正部106)は、除去を行う前記第1成分のうちの少なくとも一部として、第3成分(図47の(Xx,y-Ix,y)×γ)を、前記第1の高解像度画像(図32A、図30B及び図47の点線)から除去する。この第3成分は、当該第3成分が除去されることにより、当該第3成分が除去されない場合の第2の高解像度画像(図32B、図47のPx,y(A)等参照)の平坦な範囲(範囲106yC)よりも狭い平坦な範囲(図32C、図47のPx,y(B) 等参照)における範囲106y)を有する第2の高解像度画像(図32C、図47のPx,y(B))が生成される成分である。As described above, the re-correction unit (re-correction unit 106) uses the third component ((Xx, y−Ix, y) in FIG. 47 as at least a part of the first component to be removed. Xγ) is removed from the first high-resolution image (dotted lines in FIGS. 32A, 30B, and 47). This third component is obtained by removing the third component, thereby flattening the second high-resolution image (see Px, y (A), etc. in FIG. 32B and FIG. 47) when the third component is not removed. Second high-resolution image (range Px, y in FIGS. 32C and 47) having a flat range (
これにより、平坦な範囲が、元の範囲(範囲106yC)よりも更に狭い範囲(範囲106y)となり、より十分に、画像のベタつきを抑制し、さらに高い画質が得られる。Thereby, the flat range becomes a narrower range (
このように、前記合成部(合成部105、エッジ強調部)は、前記補間部により生成された前記補間画像(図30A及び図47のIx,y、図30Bの細い実線)の画素値に前記補正量を足してもよい。そして、これにより、前記補間画像におけるエッジが強調された前記第1の高解像度画像(図30B及びの図47の点線)が生成されてもよい。As described above, the synthesis unit (the
そして、前記再補正部は、第1の前記高解像度画像における、前記エッジの周辺を光らせる、前記エッジの強調での過補正の成分(シュートの成分)のうちで、前記差に基いて設定された前記閾値(図30A、図30B、図47のU’x,y参照)から特定される成分を除去した第2の前記高解像度画像(図30Bの太い実線、図47のPx,y(B))を生成してもよい。ここで、再補正部は、前記閾値として第1の値(図30A及び図47のUx,y)が特定される場合に生成される前記第2の高解像度画像(図32B、図47のPx,y(A))の平坦部(範囲106yC)よりも狭い平坦部(範囲106y)を有する第2の前記高解像度画像(図30Bの太い実線、図32C、図47のPx,y(B))が生成される第2の値(U’x,y)を、前記閾値として算出してもよい。The re-correction unit is set based on the difference among over-correction components (shoot components) in the edge enhancement that illuminates the periphery of the edge in the first high-resolution image. In addition, the second high-resolution image (thick solid line in FIG. 30B, Px, y (B in FIG. 30B) from which the specified component is removed from the threshold value (see U′x, y in FIGS. 30A, 30B, and 47). )) May be generated. Here, the re-correction unit performs the second high-resolution image (Px in FIGS. 32B and 47) generated when the first value (Ux, y in FIGS. 30A and 47) is specified as the threshold. , y (A)) having a flat portion (
(実施の形態B2)
実施の形態B2について、図を参照しながら説明を行う。(Embodiment B2)
The embodiment B2 will be described with reference to the drawings.
図31は、実施の形態B2におけるS1707(図17)の画像拡大処理を行う画像拡大部1504B(図15)の処理の流れを示したものである。以降、図31を用いて、実施の形態B2における画像拡大処理について詳しく説明する。FIG. 31 shows the flow of processing of the
実施の形態B2の画像拡大装置1500(図15)は、画像拡大部1504として、図31の画像拡大部1504Bを備える。The image enlargement apparatus 1500 (FIG. 15) according to Embodiment B2 includes the
(再補正部)
再補正部1807では、合成部1806で合成した画素値O(第1の高解像度画像)と、補間部1805で計算された画素値OL(補間画像)と、特徴量分析部1803で計算された特徴量grad1,MIN,MAXを用いて、合成部1806で合成した画素値O(第1の高解像度画像)の補正を行い、補正された画素値O’(第2の高解像度画像)を出力する。(Re-correction part)
In the
以下、O’の計算方法について(数B4)から(数B6)を用いて説明する。Hereinafter, the calculation method of O ′ will be described using (Equation B4) to (Equation B6).
(数B4)
OL≦MINのとき、NMIN=MIN
LLIM=LIMIT
OL>MINのとき、NMIN=OL-(OL-MIN)×E
LLIM=LIMIT+(1-E)(OL-MIN)
(数B5)
MAX≦OLのとき、NMAX=MAX
ULIM=LIMIT
MAX>OLのとき、NMAX=OL+(MAX-OL)×E
ULIM=LIMIT+(1-E)(MAX-OL)
(数B6)
O > MAXのとき、
O'= NMAX+min((O-NMAX)・GAIN,ULIM)
O < MINのとき、
O'= NMIN-min((NMIN-O)・GAIN,LLIM)
それ以外のとき、 O'=O(Number B4)
When OL ≦ MIN, NMIN = MIN
LLIM = LIMIT
When OL> MIN, NMIN = OL− (OL−MIN) × E
LLIM = LIMIT + (1-E) (OL-MIN)
(Number B5)
When MAX ≦ OL, NMAX = MAX
ULIM = LIMIT
When MAX> OL, NMAX = OL + (MAX−OL) × E
ULIM = LIMIT + (1-E) (MAX-OL)
(Number B6)
When O> MAX,
O ′ = NMAX + min ((O−NMAX) · GAIN, ULIM)
When O <MIN,
O ′ = NMIN-min ((NMIN-O) · GAIN, LLIM)
Otherwise, O '= O
(数B4)~(数B6)中のE(上述のα)は定数である。また、GAIN(上述のC),LIMIT(T)は、grad1から、図45のC倍値算出部1061又は閾値クリップ部1062により計算されるパラメータである。E (the above α) in (Equation B4) to (Equation B6) is a constant. GAIN (C described above) and LIMIT (T) are parameters calculated from grad1 by the C multiplication
(数B4)は、MIN(Lx,y),LIMITとOL(Ix,y)および定数Eを用いて、Oの傾斜を変化させるポイントNMIN(L'x,y)と、下限のクリップ値LLIM(TL)を再補正部1807が計算する数式である。(Equation B4) is a point NMIN (L′ x, y) at which the slope of O is changed using MIN (Lx, y), LIMIT and OL (Ix, y) and a constant E, and the lower limit clip value LLIM (TL) is a mathematical formula calculated by the
(数B5)は、MAX(Ux,y)、LIMITとOL、定数Eを用いて、Oの傾斜を変化させるNMAX(U'x,y)と、上限のクリップ値ULIM(TU)を再補正部1807が計算する数式である。この計算では、定数Eは0.0~1.0である。なお、Eを小さくすると、補間拡大の画素値OLとの差が少しでもあれば、傾斜の調整が行われるようになり(図47のPx,y(B))、Eを1.0に設定すると、MIN、MAXを超えた部分だけ補正が行われるようになる(図47のPx,y(A))。なお、定数Eとしては、0.5以下に設定すると、傾斜の変化が早くなり、エッジを立てたことにより不自然さをより少なくすることとができる。(Equation B5) uses MAX (Ux, y), LIMIT and OL, and constant E to re-correct NMAX (U'x, y) for changing the slope of O and the upper limit clip value ULIM (TU). This is a mathematical formula calculated by the
ここで、図32A~Cを用いて、定数Eによる出力波形の違いを説明する。Here, the difference in the output waveform due to the constant E will be described with reference to FIGS. 32A to 32C.
図32Aは、合成部1806の出力(図47のXx,y)を示す図である。FIG. 32A is a diagram illustrating an output (Xx, y in FIG. 47) of the
図32Bは、E=1.0の再補正後の出力(図47のPx,y(A))を示す図である。FIG. 32B is a diagram showing an output after re-correction of E = 1.0 (Px, y (A) in FIG. 47).
図32Cは、E=0.25の再補正後の出力画像(図47のPx,y(B))の水平ラインの一部である。FIG. 32C is a part of the horizontal line of the output image after re-correction of E = 0.25 (Px, y (B) in FIG. 47).
これらの各図では、横軸が、画像の水平方向の画素位置を、縦軸が、各画素位置の画素値を示している。In each of these drawings, the horizontal axis indicates the pixel position in the horizontal direction of the image, and the vertical axis indicates the pixel value at each pixel position.
図示されるように、図32B(図47のPx,y(A))、図32C(図47のPx,y(B))ともに、図32A(図47のXx,y)で発生しているオーバーまたはアンダーシュート成分が抑えられ、かつエッジが急峻になっていることがわかる。32B (Px, y (A) in FIG. 47) and FIG. 32C (Px, y (B) in FIG. 47) are both generated in FIG. 32A (Xx, y in FIG. 47). It can be seen that the over or undershoot component is suppressed and the edge is steep.
そして、図32C(図47のPx,y(B))では、図32B(図47のPx,y(A))に比べて、エッジの傾斜は維持しつつ、図47の範囲106yCよりも狭い範囲106yCにより示されるように、上部が平坦化してしまう影響が少なくなっている。このため、図32C(図47のPx,y(B))では、図32B(図47のPx,y(A))に比べて、エッジ周辺が自然な形になり、くっきりとした映像になる。32C (Px, y (B) in FIG. 47) is narrower than the range 106yC in FIG. 47 while maintaining the inclination of the edge as compared with FIG. 32B (Px, y (A) in FIG. 47). As indicated by the range 106yC, the effect of flattening the upper portion is reduced. Therefore, in FIG. 32C (Px, y (B) in FIG. 47), the periphery of the edge has a natural shape and a clear image compared to FIG. 32B (Px, y (A) in FIG. 47). .
<<実施の形態C>>
以下、実施形態Cを、図面を参照しながら説明する。実施の形態Cも、実施の形態Aを変形した変形例である。なお、実施の形態Cの細部の点は、実施の形態Bと同様であってもよい。<< Embodiment C >>
Hereinafter, Embodiment C will be described with reference to the drawings. The embodiment C is also a modification of the embodiment A. The details of Embodiment C may be the same as Embodiment B.
実施の形態Cに係る画像拡大装置(画像拡大装置108C、画像拡大部1504Cなど)は、前記低解像度画像及び前記高解像度画像の画像サイズ、又は、拡大率を入力し(拡大率と、前記低解像度画像及び前記高解像度画像の画像サイズとの少なくとも一方を入力し)、前記低解像度画像から前記高解像度画像を生成するための、前記高解像度画像の各画素に対応する、前記低解像度画像に対する第1の補間画素位置を生成する補間画素位置生成部(補間画素位置生成部110)と、前記低解像度画像(入力画像101)と前記第1の補間画素位置とを入力し、前記第1の補間画素位置の周辺の画素値の変化に応じて、前記第1の補間画素位置を補正して、前記第1の補間画素位置が補正された第2の補間画素位置を生成する白細線化部(白細線化部109)とを備え、前記補正量計算部(補正量計算部103)は、前記第2の補間画素位置と、前記低解像度画像とを入力し、出力する第2の前記高解像画像の各画素の補正量を計算し、前記補間部(補間部104)は、前記低解像度画像と、前記第1の補間画素位置とを入力し、入力された前記第1の補間画素位置に対応する画素値を補間計算し、当該第1の補間画素位置に、計算された前記画素値を有する前記補間画像(図36及び図37の(a))を生成し、前記合成部は、前記補正量計算部で、前記第2の補間画素位置から計算された前記補正量(図36及び図37の右欄の(b))と、前記補間部で、前記第1の補間画素位置から生成された前記画素値(図36及び図37の(a)とを合成して(図36及び図37の(c)の41106)、第2の前記高解像度画像(図37の(d)の1208)を生成する画像拡大装置である。An image enlargement apparatus (an
なお、図33における、補間画素位置生成部110から特徴量分析部102への矢印線等により示されるように、次の通りでもよい。In addition, as shown by the arrow line etc. from the interpolation pixel
つまり、前記特徴量分析部は、前記第1の補間画素位置(補間画素位置生成部110による位置)における、前記低解像度画像の特徴量を分析し、出力する第2の前記高解像度画像の各画素に対する特徴量を出力し、記補正量計算部は、前記第2の補間画素位置、前記低解像度画像、および、前記第1の補間画素位置からの前記特徴量を入力し、出力する第2の前記高解像度画像の各画素の補正量を計算してもよい。That is, the feature amount analysis unit analyzes each feature amount of the low resolution image at the first interpolation pixel position (position by the interpolation pixel position generation unit 110) and outputs each of the second high resolution images to be output. A feature amount for a pixel is output, and a correction amount calculation unit receives and outputs the feature amount from the second interpolation pixel position, the low-resolution image, and the first interpolation pixel position. The correction amount of each pixel of the high-resolution image may be calculated.
また、図39における、白細線化部41909から特徴量分析部41903への矢印線等により示されるように、次の通りでもよい。Further, as indicated by an arrow line from the
つまり、前記特徴量分析部は、前記第2の補間画素位置(白細線化部41909による位置)における、前記低解像度画像の特徴量を分析し、出力する第2の前記高解像度画像の各画素に対する特徴量を出力し、前記補正量計算部は、前記第2の補間画素位置、前記低解像度画像、および、前記第2の補間画素位置からの前記特徴量を入力し、出力する第2の前記高解像度画像の各画素の補正量を計算してもよい。That is, the feature amount analysis unit analyzes the feature amount of the low resolution image at the second interpolation pixel position (position by the white thinning unit 41909) and outputs each pixel of the second high resolution image to be output. The correction amount calculation unit inputs and outputs the feature amount from the second interpolation pixel position, the low-resolution image, and the second interpolation pixel position. A correction amount of each pixel of the high resolution image may be calculated.
(実施の形態C1)
図33は、実施形態C1における画像拡大部108C(画像拡大部108の下位概念(一例))のブロック図を示す。(Embodiment C1)
FIG. 33 is a block diagram of the
図33において、101は、低解像度の入力画像(元画像)、102は、低解像度の入力画像101から出力する、高解像度画像(第1の高解像度画像、第2の高解像度画像)の各画素に対応する特徴量を出力する特徴量分析部である。110は、拡大率、または、入力画像101と出力画像107との画像サイズを入力し、サイズに応じた、高解像度画像の各画素を補間するための第1の補間画素位置を生成する補間画素位置生成部である。33,
そして、109は、入力画像101と、補間画素位置生成部110により生成された第1の補間画素位置から、第1の補間画素位置が補正された第2の補間画素位置を補正計算する白細線化部である。また、103は、特徴量分析部102の出力した特徴量に応じて、白細線化部109により算出された第2の補間画素位置に対応するエッジ成分の補正量を計算し、出力する高解像度画像(第2の高解像度画像)の各画素の補正量を出力する補正量計算部である。
そして、104は、低解像度の入力画像101と、白細線化部109による補正がされる前の上記第1の補間画素位置を入力して、出力する高解像度画像と同じ画素数の画像(補間画像)を生成する補間部である。105は、補間部104から出力された高解像度画像(補間画像)の画素を受け取ると共に、その画素に対応する補正量を補正量計算部103から受け取り、補正した画素(第1の高解像度画像)を出力する合成部である。106は、特徴量分析部102から受け取った、出力画素に対応する特徴量によって、合成部105が出力した合成結果(第1の高解像度画像)を再補正して、出力する再補正部である。107は、出力される高解像度画像(出力画像、第2の高解像度画像)、108Cは、低解像度画像(入力画像101)を入力して、高解像度画像(出力画像107、第2の高解像度画像)を出力する画像拡大部である。An
(補間画素位置生成部)
補間画素位置生成部110では、拡大率、または、入力画像のサイズと出力画像のサイズとをパラメータとして受け取り、これを用いて補間画素位置(第1の補間画素位置)の計算を行う。なお、入力が、入力画像サイズと出力画像サイズとである場合、画像サイズの比率により拡大率を計算する。他方、拡大率が入力された場合には、入力された拡大率をそのまま利用する。(Interpolated pixel position generator)
The interpolation pixel
なお、このとき、水平・垂直の拡大率が異なる場合には、入力される拡大率は、水平と垂直の拡大率の2つとなる。両者が同じ場合は、拡大率としては1つだけでよいが、ここでの説明では、水平方向の拡大率と、垂直方向の拡大率の2つを受け取ったとして説明を行う。At this time, if the horizontal and vertical enlargement ratios are different, the input enlargement ratios are the horizontal and vertical enlargement ratios. When both are the same, only one enlargement ratio is required. However, in this description, it is assumed that two horizontal enlargement ratios and vertical enlargement ratios have been received.
図34は、水平・垂直の拡大率から、補間画素位置の計算を行うフローを示す(S3401~S3410)。FIG. 34 shows a flow for calculating the interpolation pixel position from the horizontal and vertical enlargement ratios (S3401 to S3410).
補間画素位置生成部110では、まず、水平・垂直方向の移動幅dx、dyを計算する(S3402)。dx、dyは拡大率から計算できる。具体的には、dx、dyは拡大率の逆数となる。例えば、拡大率が、水平・垂直各2倍であれば、dx、dyは1/2=0.5となる。The interpolation pixel
次に、補間画素位置(x、y)を初期値(0,0)に初期化する(S3403)。この初期値として、ここでは0を設定したが、拡大時の画像の中心を変えたくない場合には、-0.25,-0.25を設定すればよい。このように初期値は、高解像度画像として生成したい画像の位相により設定を変えておく。Next, the interpolation pixel position (x, y) is initialized to an initial value (0, 0) (S3403). As this initial value, 0 is set here, but if it is not desired to change the center of the image at the time of enlargement, it may be set to -0.25 and -0.25. In this way, the initial value is changed depending on the phase of the image to be generated as a high resolution image.
次に、(x、y)を第1の補間画素位置として出力する(S3404)。なお、第1の補間画素位置(x、y)が負の値である場合は、0にクリップして出力を行う。Next, (x, y) is output as the first interpolation pixel position (S3404). When the first interpolation pixel position (x, y) is a negative value, the output is clipped to 0 and output.
次に水平方向の補間位置xをdxだけずらす(S3405)。dxだけずらした結果xが、入力画像の水平サイズより小さい場合には、S3404の処理に戻る(S3406:Yes)。水平サイズを超えた場合には(S3406:No)、xを初期値に初期化し(S3407)、yにdyを加算し更新する(S3408)。Next, the horizontal interpolation position x is shifted by dx (S3405). If the result x shifted by dx is smaller than the horizontal size of the input image, the process returns to S3404 (S3406: Yes). When the horizontal size is exceeded (S3406: No), x is initialized to an initial value (S3407), and dy is added to y and updated (S3408).
そして、垂直位置yが、入力画像の垂直サイズより小さい場合には(S3409:Yes)、S3404の処理に戻る(S3409)。垂直サイズを超えた場合には(S3409:No)、すべての画素の補間画素位置を出力したとして、終了する。If the vertical position y is smaller than the vertical size of the input image (S3409: Yes), the process returns to S3404 (S3409). If the vertical size is exceeded (S3409: No), the interpolated pixel positions of all the pixels are output, and the process ends.
以上で、高解像度画像のサイズ分の第1の補間画素位置が生成される。Thus, the first interpolation pixel position corresponding to the size of the high resolution image is generated.
なお、ここでの第1の補間画素位置の計算方法は一例であり、一般的な、拡大処理に利用される補間位置の計算方法を用いても、本実施の形態と同様の効果が期待できる。また、入力画像の初期値および移動幅dx、dyを適切に設定することで、入力画像の一部分だけを出力画像のサイズに合わせて拡大することも可能となる。この場合は、S3406、S3409の条件を、それぞれ、出力した補間画素位置の個数が、出力画像の水平サイズを越えた、及び、垂直サイズを超えたとすればよい。Note that the calculation method of the first interpolation pixel position here is an example, and the same effect as in the present embodiment can be expected even by using a general interpolation position calculation method used for enlargement processing. . In addition, by appropriately setting the initial value of the input image and the movement widths dx and dy, it is possible to enlarge only a part of the input image according to the size of the output image. In this case, the conditions of S3406 and S3409 may be set such that the number of output interpolation pixel positions exceeds the horizontal size and the vertical size of the output image, respectively.
(白細線化部)
白細線化部109では、低解像度画像(入力画像101)と、補間画素位置生成部110により生成された第1の補間画素位置を入力して、第1の補間画素位置が補正された第2の補間画素位置を出力する。(White thinning part)
The
図35は、白細線化処理のフローである(S3501~S3512)。FIG. 35 is a flow of white thinning processing (S3501 to S3512).
白細線化では、まず、第1の補間画素位置(x、y)を入力する(S3502)。In white thinning, first, the first interpolation pixel position (x, y) is input (S3502).
次に、第1の補間画素位置(x、y)に隣接する、入力画像101の画素位置を算出する(S3503)。先に説明したように、第1の補間画素位置は、小数位置であり、例えば(x,y)=(10.5,12.5)であれば、隣接する、入力画像101の画素は(10,12)(11,12)(10,13)(11,13)の4つの位置にある画素となる。Next, the pixel position of the
次に、算出された複数の隣接画素のうち、最大および最小の画素値を持つものをチェックする(S3504)。最大と最小との画素値を持つ画素の位置が、水平方向にずれた2つの位置である場合には(S3505:Yes)、x方向の補正量を計算し、xを補正する(S3506,S3507)。この補正は、最小値を持つ画素位置の方へ、xをずらすような補正である。Next, among the calculated plurality of adjacent pixels, a pixel having the maximum and minimum pixel values is checked (S3504). When the positions of the pixels having the maximum and minimum pixel values are two positions shifted in the horizontal direction (S3505: Yes), the correction amount in the x direction is calculated and x is corrected (S3506, S3507). ). This correction is such that x is shifted toward the pixel position having the minimum value.
なお、どれだけずらすかは、最大値と最小値の差分により決定する。例えば、差分が大きな場合はxをより大きくずらし、差が小さな場合は殆ど動かさないような処理を行う。Note that the amount of shift is determined by the difference between the maximum and minimum values. For example, when the difference is large, x is shifted more, and when the difference is small, processing is performed so as not to move.
同様に、y方向についても、最大と最小の画素値を持つ画素の位置が垂直方向にずれている場合について(S3508:Yes),y方向の補正量を計算し、yの補正を行う(S3509,S3510)。Similarly, in the y direction, when the position of the pixel having the maximum and minimum pixel values is shifted in the vertical direction (S3508: Yes), the correction amount in the y direction is calculated and y is corrected (S3509). , S3510).
そして、補正した(x、y)を、補正後の第2の補間画素位置(x’、y’)として出力する(S3511)。Then, the corrected (x, y) is output as the corrected second interpolation pixel position (x ′, y ′) (S3511).
すなわち、最大の画素値の画素と、最小の画素値の画素との2つの画素が特定されることにより、入力画像101における、第1の補間画素位置での傾きの方向が特定される。そして、特定された方向における、最小値の画素側への向き、つまり、暗い方への向きに、第1の補間画素位置から移動した位置が、第2の補間画素位置として特定される。That is, by specifying the two pixels of the pixel having the maximum pixel value and the pixel having the minimum pixel value, the direction of the inclination at the first interpolation pixel position in the
以上の処理を行うことで、隣接画素の最大値と最小値の差が大きい場合、つまり明るさの差が大きい部分について、第2の補間画素位置(x、y)が暗い方向に補正されることになる。この、補正された補間画素位置を利用して補間計算を行うことで、下記で詳しく説明されるようにして、明るい部分の領域が狭くなり、結果として白い部分を細くすることが可能になる。By performing the above processing, the second interpolation pixel position (x, y) is corrected in the dark direction when the difference between the maximum value and the minimum value of the adjacent pixels is large, that is, in the portion where the brightness difference is large. It will be. By performing the interpolation calculation using the corrected interpolation pixel position, as will be described in detail below, the area of the bright part is narrowed, and as a result, the white part can be thinned.
なお、第1の補間画素位置での傾きが、平坦である場合などには、第1の補間画素位置と同じ位置が、第2の補間画素位置と特定されてもよい。Note that, when the slope at the first interpolation pixel position is flat, the same position as the first interpolation pixel position may be specified as the second interpolation pixel position.
(特徴量分析部)
特徴量分析部102では、補間部104の出力する拡大後の各画素に対する特徴量を計算し、出力する。特徴量として出力するのは、補間画素位置(例えば、第1の補間画素位置)に対応する、低解像度画像の位置周辺の傾斜の強さと、周辺画素の上限値と下限値である。傾斜の強さは、補間画素位置に隣接する低解像度画像の画素を2×2画素抽出し、図3および図4のフィルタにより水平および垂直の微分成分dxとdyを求め、どちらか大きなほうを傾斜の強さとするなどの方法がある。なお、傾斜の強さの計算方法としてはsobelフィルタまたはprewittフィルタなどを用いてもよく、この方法に限定されるものではない。また、上限値と下限値としては、補間画素位置の周辺の低解像度画像n×n画素の中で、最も大きな画素値を上限値、最も小さな値を下限値として設定する。(Feature Analysis)
The feature
以上により、傾斜の強さと上限値、下限値が特徴量として計算され、出力される。As described above, the strength of the slope, the upper limit value, and the lower limit value are calculated and output as feature values.
なお、本実施の形態では、特徴量分析部102に入力される補間画素位置として、補正される前の第1の補間画素位置を入力するとしたが、白細線化部109で補正された第2の補間画素位置を入力してもよい。この場合、下限値と上限値も、補正された第2の補間画素位置方向にずれるため、より強い補正を行うことができる。In the present embodiment, the first interpolated pixel position before correction is input as the interpolated pixel position input to the feature
(補正量計算部)
補正量計算部103では、第2の補間画素位置に対応する画素のエッジ度合いに応じた補正量を計算する。補正量計算部103では、まず、白細線化部109で補正された、第2の補間画素位置と、低解像度の入力画像の画素値を用いてエッジ成分を計算する。エッジ成分の抽出方法としては、例えば、先述の図5または図6に示すラプラシアンフィルタなどを用いる。なお、補間画素位置(例えば小数位置)の画素は、低解像度画像(例えば、整数位置の画素のみよりなる)には存在しないため、これらのフィルタを施す場合には、一度補間演算により、対応する各画素位置(例えば整数位置)の画素値を計算した後に、3×3のフィルタ処理が行われる。(Correction amount calculator)
The correction
エッジ成分を抽出後、特徴量分析部102で計算した傾斜の強さを用いて、補正量計算部103が抽出したエッジの強調度合いを計算する。After the edge component is extracted, the degree of enhancement of the edge extracted by the correction
補正量計算部103に、白細線化部109で補正された第2の補間画素位置を入力することにより、出力される補正量が、明るい方向と暗い方向で不均等になる。これにより、白と黒の補正量のバランスを変えることができる。By inputting the second interpolation pixel position corrected by the
つまり、比較的明るい第1の補間画素位置の補正量として、第1の補間画素位置において算出される補正量ではなく、補正された比較的暗い第2の補間画素位置で算出される補正量が特定される。That is, the correction amount calculated at the corrected relatively dark second interpolation pixel position is not the correction amount calculated at the first interpolation pixel position as the correction amount of the relatively bright first interpolation pixel position. Identified.
(補間部)
補間部104では、バイリニア法やバイキュービックコンボリューション法等を用いて、低解像度画像(入力画像101)から、高解像度の画像(補間画像)を、補間拡大により生成する。なお、これらの一般的な拡大技術は、本実施形態の骨子ではないので、詳しい説明を省略する。補間部104の技術としては、従来から用いられている拡大補間技術を利用することが可能である。(Interpolation part)
The
なお、補間部104では、白細線化部109で補正した第2の補間画素位置は利用されない。これは、補間部104の画素位置として、補正した結果を利用すると、白から黒に変化するエッジ部分で、ギザギザ感が強調されてしまうためである。したがって、補間部104は、補間画素位置生成部110で生成した、補正前の第1の補間画素位置を利用する。Note that the
(再補正部)
再補正部106では、合成部105が出力した、エッジ強調が施された第1の高解像度画像と、特徴量分析部102が出力した、第1の高解像度画像に対応した上限値、下限値を入力し、合成部105が出力した第1の高解像度画像の再補正を行う。(Re-correction part)
In the
以下、再補正の手順について説明を行う。Hereinafter, the re-correction procedure will be described.
第1の高解像度画像の画素位置(x,y)に対応する、合成部105の出力画素値をXx,y、上限値をUx,y,下限値をLx,yとした時、再補正部106では、先述の(数A1)の演算により第1の補正値Px,yを計算する。When the output pixel value of the
次に、先述の(数A2)の演算により、第1の補正値Px,yをさらに補正して、第2の補正値P’x,yを計算する。Next, the first correction value Px, y is further corrected to calculate the second correction value P′x, y by the above-described operation (numerical value A2).
再補正部106では、この第2の補正値P’x,yを出力する。The
以上の処理により、実施の形態C1によれば、白い部分を細くしつつ、アンダーシュートとオーバーシュートを抑えた拡大画像が出力されることになる。Through the above processing, according to the embodiment C1, an enlarged image in which the white portion is thinned and undershoot and overshoot are suppressed is output.
図36は、合成までの処理でのデータを示す図である。FIG. 36 is a diagram showing data in a process until synthesis.
図37は、再補正までの処理でのデータを示す図である。FIG. 37 is a diagram showing data in the process up to re-correction.
以下、図36と図37を利用しながら、処理の過程と信号の流れについて説明する。図36および図37の補正前(左欄)は、白細線化処理により補間画素位置の補正を行わなかった場合のデータを示し、補正後(右欄)は、補間画素位置を補正した場合のデータを示す。Hereinafter, the process and signal flow will be described with reference to FIGS. 36 and 37. FIG. 36 and FIG. 37 show data when the interpolation pixel position is not corrected by the white thinning process, and after correction (right column) shows the data when the interpolation pixel position is corrected. Data is shown.
図36、図37のそれぞれでは、補間部104の出力(a)、補正量計算部103の出力(b)、合成部105の出力(c)、そして再補正部106の出力(図37の(d))を示している。なお、再補正部106の出力(d)は、Tを0とした場合の結果である。なお、図の水平方向は画素位置を示し、垂直方向は画素値を示している。画素値は上に行くほど明るい色で、下に行くほど暗い色を表している。In each of FIGS. 36 and 37, the output (a) of the
図37では、合成部105の出力(c)までの例を示す。FIG. 37 shows an example up to the output (c) of the combining
ここで、画素位置補正を行う場合でも、補間部104には、補正前の第1の補間画素位置が入力されるため、(a)の行において、41101と41102(補間画像)は両者同じである。Here, even when performing pixel position correction, since the first interpolation pixel position before correction is input to the
(b)は、補正量計算部103の出力であるが、画素位置補正を行った場合には(右欄)、画素位置補正を行わない左欄の場合には比較的明るい補正量が特定される第1の補間画素位置で、第2の補間画素位置における暗い補正量が特定されることにより、明るい補正量の部分が狭くなる。このような画素位置補正が行われるため、(b)の左欄の41103に比べて、右欄の41104の上に凸な部分が狭くなっている。(B) is an output of the correction
(c)は、(a)と(b)を合成した結果であるが、上段における左欄の41105における明るい部分41105Rに比べて、右欄の41106の明るい部分41106Rが狭くなっているのがわかる(下段の41107参照)。このため、白い部分が細く見えるようになる。(C) shows the result of combining (a) and (b), but it can be seen that the
図37(d)では、再補正部106により再補正された結果を示す。図37(d)を見ると、再補正後の信号1207と1208の明るい部分の幅が、画素位置補正をした場合(右欄)の部分1208Rでは、他方の部分1207Rよりも狭くなっていることがわかる(1209)。FIG. 37 (d) shows the result of the recorrection by the
このように、再補正後(右欄)では、アンダーシュートとオーバーシュートがなく、かつ白が細くなった、拡大後のデータが出力される。In this way, after re-correction (right column), the enlarged data with no undershoot and overshoot and thin white is output.
以上のように、実施の形態C1によれば、特に、拡大処理にあわせてエッジ補正を行った場合に起こりやすい、白が太くなったような印象をなくすように、拡大後の明るい成分を細くしたエッジ補正を実現できる。これにより、視覚的にバランスのとれた拡大画像(出力画像107)を生成できる。As described above, according to the embodiment C1, the bright component after enlargement is thinned so as to eliminate the impression that white is thick, which is likely to occur particularly when edge correction is performed in accordance with the enlargement process. Edge correction can be realized. Thereby, an enlarged image (output image 107) that is visually balanced can be generated.
なお、アンダーシュートおよびオーバーシュートの補正を行わないのであれば、合成部105までの処理で、拡大処理を終えてもよい。この場合も、白線が太く見えないという効果を得ることができる。Note that if the undershoot and overshoot corrections are not performed, the enlargement process may be completed by the process up to the combining
このように、画像拡大装置108(画像拡大装置108C)は、白細線化部(白細線化部109)を備える。Thus, the image enlarging device 108 (
白細線化部は、第1の補間画素位置を第2の補間画素位置に補正することにより、補正された第2の補間画素位置から算出された補正量(図36の41104)でのエッジ強調がされた第1の高解像度画像をエッジ強調部(合成部105)に算出させて、エッジ強調部の動作を制御する。この制御により、含まれる白の部分(図36の部分41106R)が、制御がされない場合の白の部分(部分41105R)よりも狭い第1の高解像度画像(信号41106)がエッジ強調部により算出される。The white thinning unit corrects the first interpolation pixel position to the second interpolation pixel position, thereby enhancing the edge with the correction amount (41104 in FIG. 36) calculated from the corrected second interpolation pixel position. The edge enhancement unit (compositing unit 105) is caused to calculate the first high-resolution image that has been subjected to, and the operation of the edge enhancement unit is controlled. By this control, the edge enhancement unit calculates a first high-resolution image (signal 41106) in which the white portion (
そして、白細線化部は、この制御により、ひいては、このような、白の部分が狭められた第1の高解像度画像に対する再補正を再補正部106に行わせて、再補正部106の動作を制御する。この制御により、含まれる白の部分(図37の部分1208R)が、制御がされない場合の白の部分(部分1207R)よりも狭い第2の高解像度画像(図37(d)の信号1208)が再補正部106により算出される。Then, under this control, the white thinning unit causes the
(実施の形態C2)
実施の形態C2について、図を参照しながら説明を行う。(Embodiment C2)
The embodiment C2 will be described with reference to the drawings.
図38は、実施の形態C2における、画像拡大部1504Cが設けられた画像拡大装置1500のブロック図である。FIG. 38 is a block diagram of an
図38において、101は、入力画像、1601は、第1の補間画素位置x,y、1602は、第1の補間画素位置x,yの周辺6x6画素を選択する画素選択部である。1603は、第1の補間画素位置x,yの小数点部分px,pyを取り出す小数点位置計算部、1504Cは、入力画像の6x6画素と、小数点位置px,pyを入力し、第1の補間画素位置x,yの画素値(第2の高解像度画像)を計算して出力する画像拡大部である。107は、拡大処理後の第2の高解像度画像である。38,
図39は、実施の形態C2における、図17のS1707の画像拡大処理を行う画像拡大部1504C(図38)の処理の流れを示したものである。以降、図39を用いて、実施の形態C2の画像拡大処理について詳しく説明する。FIG. 39 shows a processing flow of the
(白細線化部)
図40は、図39の白細線化部41909の処理の詳細を示した図である。(White thinning part)
FIG. 40 is a diagram showing details of the processing of the
白細線化部41909では、入力画素から傾斜方向を、傾斜方向判定部2003により算出する。In the
図41は、傾斜方向の検出方法を説明する図である。FIG. 41 is a diagram for explaining a method of detecting the tilt direction.
図41において、白丸は、第1の補間画素位置の隣接画素、黒丸は、隣接画素の中で最大値となるもの、網掛けの丸は、隣接画素の中で最小値となるものである(図35のS3504等参照)。4画素の値がすべて同じとなるパターン(a)(f)(k)(p)では、すべての画素で、白丸としている。In FIG. 41, the white circle is the adjacent pixel at the first interpolation pixel position, the black circle is the maximum value among the adjacent pixels, and the shaded circle is the minimum value among the adjacent pixels ( (See S3504 in FIG. 35). In the patterns (a), (f), (k), and (p) in which the values of all four pixels are the same, all the pixels are white circles.
図41の矢印は、最小値から最大値に向かう方向を示しており、矢印が水平の場合は、横方向のみの補正、垂直の場合は、縦方向のみの補正、斜めの場合は、水平・垂直双方の補正が行われる。なお、ここで示した傾斜方向判定部2003は、一例であり、図3または図4に示したフィルタを隣接画素に施した結果により傾斜方向を判定するなどしてもよい。The arrow in FIG. 41 indicates the direction from the minimum value to the maximum value. When the arrow is horizontal, only the horizontal direction is corrected. When the arrow is vertical, only the vertical direction is corrected. Both vertical corrections are performed. The tilt
補間位置補正量計算部2004では、最大値と最小値の差から補正量の計算を行う。なお補正量の計算では、傾斜方向判定部2003の結果が、水平方向のみの補正の場合には、xの補正量のみ、垂直方向の補正の場合には、yの補正量のみ、斜めの場合には、x、y双方の補正量を計算する(図35のS3505~S3510参照)。The interpolation position correction
補正量計算としては、例えば(数C1)、(数C2)のような方法がある。As the correction amount calculation, for example, there are methods such as (number C1) and (number C2).
(数C1)
AX=CLIP(0,(最大値-最小値)×K,L)
(数C2)
AY=CLIP(0,(最大値-最小値)×K,L)(Number C1)
AX = CLIP (0, (maximum value−minimum value) × K, L)
(Number C2)
AY = CLIP (0, (maximum value−minimum value) × K, L)
(数C1),(数C2)において、AXは、水平方向の補正量、AYは、垂直方向の補正量、K、Lは各々定数である。また、CLIPは、0~Lの範囲に演算結果をクリップすることを示している。先に説明したように、各方向の補正を行う場合のみ、(数C1),(数C2)による計算が行われ、補正を行わない方向についての補正量は、0となる。例えば、垂直方向のみ補正を行う場合には、AX=0となる。なお、Kを負の値に設定することで、白を細くするのではなく、黒を細くすることもできる。画像拡大装置1500では、意図的に白を太く見せたい場合には、Kの設定により白を太くすることも可能である。In (Equation C1) and (Equation C2), AX is a horizontal correction amount, AY is a vertical correction amount, and K and L are constants. CLIP indicates that the calculation result is clipped in the range of 0 to L. As described above, only when correction in each direction is performed, the calculation by (Equation C1) and (Equation C2) is performed, and the correction amount for the direction in which no correction is performed is zero. For example, when correcting only in the vertical direction, AX = 0. In addition, by setting K to a negative value, it is possible to reduce the black instead of reducing the white. In the
なお、図41(d)(g)(j)(m)の斜め方向の移動については、(数C1),(数C2)の計算式で補正量を計算した場合、以下のような問題が発生する。41 (d), (g), (j), and (m), the following problems occur when the correction amount is calculated using the formulas (Equation C1) and (Equation C2). appear.
図42は、補正量の計算で発生する問題を示す図である。FIG. 42 is a diagram showing a problem that occurs in the calculation of the correction amount.
図42(a)は、(数C1),(数C2)に基づいて、補正量AX,AYを設定した場合の例である。図42(a)のように補正量は、原点を中心とした正方形の形となり、斜め方向(2201)の補正の場合、水平、垂直のみの補正時に比べて約1.414倍長くなってしまう。これにより、画像中の斜め線などが過度に補正され、ガタついてしまうことがある。そこで、補間位置補正量計算部2004では、AX,AYの長さに応じて、図42(b)の2202のように、円周上の位置に来るように、AX,AYの調整を行う。これにより、斜め方向への補正がかかり過ぎるのを防ぐ。この補正には三角関数を用いた演算が必要となるが、より簡易的な方法としては、図41(d)(g)(j)(m)の4パターンに一致した場合に、AX,AYを1/√2倍するなどでも良い。FIG. 42A shows an example in which the correction amounts AX and AY are set based on (Equation C1) and (Equation C2). As shown in FIG. 42A, the correction amount has a square shape with the origin as the center, and in the case of correction in the oblique direction (2201), the correction amount is about 1.414 times longer than that in the horizontal and vertical correction only. . As a result, oblique lines and the like in the image may be excessively corrected and become unstable. Therefore, the interpolation position correction
次に、補間位置補正部2005では、補間座標Px,PyのそれぞれにAX,AYを各々加算して補正を行う(数C3)。Next, the interpolation
(数C3)
Px'=CLIP(0,Px+AX,1.0)
Py'=CLIP(0,Py+AY,1.0)(Number C3)
Px ′ = CLIP (0, Px + AX, 1.0)
Py ′ = CLIP (0, Py + AY, 1.0)
なお、(数C3)では、Px,Pyのそれぞれは、0~1の範囲に正規化されているとしている。例えば、Pxが0~255の値をとる場合には、Px’を計算する数式は、Px’=CLIP(0,Px+AX,255)となる。In addition, in (number C3), each of Px and Py is normalized to a range of 0 to 1. For example, when Px takes a value from 0 to 255, the formula for calculating Px ′ is Px ′ = CLIP (0, Px + AX, 255).
以上により、補正された第2の補間座標Px’とPy’(第2の補間画素位置、図40の補間座標2006)が計算される。Thus, the corrected second interpolation coordinates Px ′ and Py ′ (second interpolation pixel position, interpolation coordinates 2006 in FIG. 40) are calculated.
(特徴量分析部)
図43は、図39の特徴量分析部41903の処理の詳細を示したものである。(Feature Analysis)
FIG. 43 shows details of the processing of the feature
特徴量分析部41903では、入力画像101(図38)の補間位置の周辺N×M画素42301と、白細線化部41909により算出された第2の補間画素位置px’、py’(図43の補間座標42302)を入力し、特徴量としてgrad0,grad1,MIN,MAXを出力する。なお、ここでは、入力は、N=M=4での16画素として説明を行うが、これより小さい、または大きな範囲により特徴量を計算してもよい。In the feature
画像拡大部1504Cに入力された6×6画素のうち、中央の4×4画素が入力されると、特徴量分析部41903では、まず2×2画素ブロック毎の画素値の最大値と最小値を、ブロック毎のMIN/MAX計算部42303で計算する。2×2画素ブロックとは、先述の図20に示すように、4×4画素を2×2画素毎に9ブロックに分割するブロックである。図20では○印が画素、0~8までの数字がブロックの番号である。ここでは、各ブロックの最大値と最小値をMINn、MAXn(n=0,1,2,3,...,8であり図20のブロック番号に対応)とする。Of the 6 × 6 pixels input to the
ブロック差分計算部42304では、各ブロック毎の差分DIFFnを計算する。DIFFnの計算式は、先述の(数A5)のとおりである。The block
また、エリア判定部42305では、補正後の補間座標(第2の補間画素位置)px’、py’から、MIN,MAXの計算に使うブロックと、補間に利用するDX,DYを計算する。先述の図21により、4×4画素と、px’、py’と、補間画素の関係が示される。第2の補間画素位置の小数点成分がpx’、py’なので、0.0≦px、py<1.0となり、px’、py’は図21斜線の範囲となる。Also, the
px’、py’が図21のa,b,c,dのどのエリアにあるかで、補間に利用するMINn、MAXnを、図22A~22Dのように変える。図22Aの斜線で示されるブロックは、図21のaのエリアにpx’、py’がある場合に選択されるMINn、MAXnを示している。図22Bの斜線で示されるブロックは、図21のbのエリアにpx’、py’がある場合に選択されるMINn、MAXnを示している。図22Cの斜線で示されるブロックは、図21のcのエリアにpx’、py’がある場合に選択されるMINn、MAXnを示している。図22Dの斜線で示されるブロックは、図21のdのエリアにpx’、py’がある場合に選択されるMINn、MAXnを示していている。The MINn and MAXn used for interpolation are changed as shown in FIGS. 22A to 22D depending on which area of a, b, c, and d in FIG. Blocks indicated by diagonal lines in FIG. 22A indicate MINn and MAXn that are selected when px ′ and py ′ are present in the area of FIG. Blocks indicated by hatching in FIG. 22B indicate MINn and MAXn selected when px ′ and py ′ are present in the area of FIG. Blocks indicated by diagonal lines in FIG. 22C indicate MINn and MAXn selected when px ′ and py ′ exist in the area c of FIG. 21. Blocks indicated by diagonal lines in FIG. 22D indicate MINn and MAXn selected when px ′ and py ′ exist in the area d of FIG. 21.
(数C4)は、MI0、MI1,MI2,MI3とMA0,MA1,MA2、MA4,DX,DYを求める式である。(Equation C4) is an expression for obtaining MI0, MI1, MI2, MI3 and MA0, MA1, MA2, MA4, DX, DY.
(数C4)
aのエリアの場合)
MI0=MIN0
MI1=MIN1
MI2=MIN3
MI3=MIN4
MA0=MAX0
MA1=MAX1
MA2=MAX3
MA3=MAX4
DX=Px'+0.5
DY=Py'+0.5
bのエリアの場合)
MI0=MIN1
MI1=MIN2
MI2=MIN4
MI3=MIN5
MA0=MAX1
MA1=MAX2
MA2=MAX4
MA3=MAX5
DX=Px'-0.5
DY=Py'+0.5
cのエリアの場合)
MI0=MIN3
MI1=MIN4
MI2=MIN6
MI3=MIN7
MA0=MAX3
MA1=MAX4
MA2=MAX6
MA3=MAX7
DX=Px'+0.5
DY=Py'-0.5
dのエリアの場合)
MI0=MIN4
MI1=MIN5
MI2=MIN7
MI3=MIN8
MA0=MAX4
MA1=MAX5
MA2=MAX7
MA3=MAX8
DX=Px'-0.5
DY=Py'-0.5(Number C4)
(For area a)
MI0 = MIN0
MI1 = MIN1
MI2 = MIN3
MI3 = MIN4
MA0 = MAX0
MA1 = MAX1
MA2 = MAX3
MA3 = MAX4
DX = Px ′ + 0.5
DY = Py ′ + 0.5
(In the case of area b)
MI0 = MIN1
MI1 = MIN2
MI2 = MIN4
MI3 = MIN5
MA0 = MAX1
MA1 = MAX2
MA2 = MAX4
MA3 = MAX5
DX = Px′−0.5
DY = Py ′ + 0.5
(C area)
MI0 = MIN3
MI1 = MIN4
MI2 = MIN6
MI3 = MIN7
MA0 = MAX3
MA1 = MAX4
MA2 = MAX6
MA3 = MAX7
DX = Px ′ + 0.5
DY = Py′−0.5
(d area)
MI0 = MIN4
MI1 = MIN5
MI2 = MIN7
MI3 = MIN8
MA0 = MAX4
MA1 = MAX5
MA2 = MAX7
MA3 = MAX8
DX = Px′−0.5
DY = Py′−0.5
特徴量計算部42306では、ブロック差分計算部42304で計算したDIFFn、エリア判定部で計算したMI0~3,MA0~3、DX,DYから、grad0,grad1,MIN,MAXを算出する。The feature
先述の(数A7)により、算出式が示される。The calculation formula is shown by the above-mentioned (number A7).
なお、ここでは、特徴量分析に、補正後の第2の補間座標(第2の補間画素位置)Px’、Py’を入力したが、補間前の第1の補間座標(第1の補間画素位置)の小数点成分Px、Pyを入力してもよい。Here, the corrected second interpolation coordinates (second interpolation pixel positions) Px ′ and Py ′ are input to the feature amount analysis. However, the first interpolation coordinates (first interpolation pixel before interpolation) are input. Position) decimal point components Px and Py may be input.
(補正量計算部)
図44は、図39の補正量計算部41904の処理の詳細を示したものである(図23参照)。(Correction amount calculator)
FIG. 44 shows details of the processing of the correction
補間部2703と補間部2707では、補正後の補間位置(第2の補間画素位置)px’、py’と±1画素はなれた位置の画素値を補間計算により求める。先述の図24により、4x4の入力画素値を、v00~v33とした場合の補間位置px’、py’の画素の位置が示される。第2の補間画素位置である補間位置px’、py’の画素位置2308に対して±1画素はなれた位置は、図25に示すi00、i01、i02、i10,i12,i20,i21,i22の8箇所になる。補間部2703では入力された4×4画素を用いてpx’、py’位置を含めた9点の画素値を、補間部2707では帯域制限部2706により帯域制限された4×4画素を用いて、px’、py’位置を含めた9点の画素値を補間により算出する。The
以上のように補正量計算部41904では、補正された第2の画素位置(第2の補間画素位置)を用いて、エッジ成分の計算を行うことで、エッジの明るさに応じた、太さの調整を行うことができる。これにより、白い部分と黒い部分でのエッジの補正量のバランスを変更することができ、太さをコントロールできる。As described above, the correction
(補間部)
補間部41905(図39)では、入力された6×6画素41901と、補正前の第1の画素位置(第1の補間画素位置)の小数点位置Px,Py41902を用いて、画素値を補間して補間画像OLを出力する。(Interpolation part)
The interpolation unit 41905 (FIG. 39) interpolates the pixel value using the
(再補正部)
再補正部41907では、合成部41906で合成した画素値O(第1の高解像度画像)と、特徴量分析部で計算された特徴量grad1,MIN,MAXを用いて画素値の補正を行い、補正された画素値O’(第2の高解像度画像)を出力する。(Re-correction part)
The
先述の(数A9)により、出力値Oの計算式が示される。The calculation formula of the output value O is shown by the above-mentioned (number A9).
(数A9)中のGAIN,LIMITはgrad1から計算されるパラメータである。図27はgrad1とGAINの関係を示したものである。図では、grad1が小さい場合にはゲインを大きく、grad1と大きくなるほどゲインを小さくした設定となる。(GAIN and LIMIT in (A9) are parameters calculated from grad1. FIG. 27 shows the relationship between grad1 and GAIN. In the figure, the gain is increased when grad1 is small, and the gain is decreased as grad1 is increased.
図28はgrad1とLIMITの関係を示したものである。図28では、grad1が小さい場合にLIMITが大きく、grad1が大きい場合にLIMITが小さくなる設定となる。FIG. 28 shows the relationship between grad1 and LIMIT. In FIG. 28, LIMIT is large when grad1 is small, and LIMIT is small when grad1 is large.
なお、先述の図27、図28の説明と同様、再補正部41907には、特徴量に対応する定数(GAIN及びLIMITの少なくとも一方)を用いる設定がされてもよい。例えば、特徴量に対応するLIMITが用いられる設定がされてもよい。上記のように設定すると、grad1が大きい部分、つまり強いエッジ成分を含む部分では、LIMITによるクリップが強くなる(きっちりとされる)ため、くっきりした映像になる。一方、小さな振幅を含む部分では、クリップがあまりされないため、シュートをカットしたことによる不自然感を抑えることができる。Note that, similarly to the description of FIGS. 27 and 28 described above, the
以上のように、実施の形態Cの画像拡大装置108C(画像拡大部1504C、実施の形態Cの画像拡大装置1500)によれば、自然なかつ強いシュートがなくエッジがすっきりと立った映像(図37の1208)を生成することができる。また、補正後の第2の補間画素位置を用いて、特徴量と補正量を計算することで、図37(d)の補正後(右欄の信号1208)のように、白い部分を細くすることができる。これによりエッジの傾斜補正を普通に行い、黒と白が同じ幅だけ太くなってしまった場合に発生していた、錯視効果により白が太く見えてしまう現象を緩和し、拡大後の視覚的な黒白のバランスを保つことができる。As described above, according to the
要約すれば次の通りである。低解像度画像(入力画像101)を高解像度画像(出力画像107)に拡大し表示する場合、同時にエッジの先鋭化(合成部105における、補正量の足し込みによるエッジ強調)を行うと、錯視効果により白が太く見えてしまう問題がある(図49、図50、図36、図37等参照)。そこで、低解像度の入力画像を入力し、高解像度の出力画像を出力する画像拡大装置(画像拡大装置108C、画像拡大部1504C)において、入力画像の特徴量を分析し、高解像度画像の画素数の特徴量を生成する機能(特徴量分析部102)と、拡大率から第1の補間画素位置を計算する機能(補間画素位置生成部110)と、入力画像と第1の補間画素位置から、第1の補間画素位置の複数の隣接画像(図41参照)の画素値の差により補正された第2の補間画素位置を生成する機能(白細線化部109)と、低解像度の入力画像と、補正された第2の補間画素位置を入力し、特徴量を元に、高解像度の画素数のエッジ補正量を計算し出力する機能(補正量計算部103)と、第1の補間画素位置を用いた補間により拡大後の画像(補間画像)を生成する機能(補間部104)と、補間画像と補正量を合成する機能(合成部105)と、特徴量と、合成後の画素値(第1の高解像度画像)を入力し、再度補正を行うことで、入力画像にあわせた補正を行う機能(再補正部106)を備える。The summary is as follows. When the low-resolution image (input image 101) is enlarged and displayed on the high-resolution image (output image 107), sharpening of the edges (edge enhancement by adding correction amounts in the combining unit 105) is performed simultaneously. As a result, there is a problem that white appears to be thick (see FIGS. 49, 50, 36, 37, etc.). Therefore, in an image enlargement device (image enlargement device 108C, image enlargement unit 1504C) that inputs a low-resolution input image and outputs a high-resolution output image, the feature amount of the input image is analyzed, and the number of pixels of the high-resolution image From the function for generating the feature amount (feature amount analysis unit 102), the function for calculating the first interpolation pixel position from the enlargement ratio (interpolation pixel position generation unit 110), and the input image and the first interpolation pixel position, A function (white thinning section 109) for generating a second interpolation pixel position corrected by a difference in pixel values of a plurality of adjacent images (see FIG. 41) at the first interpolation pixel position, a low-resolution input image, A function of inputting the corrected second interpolation pixel position, calculating and outputting an edge correction amount of the number of high-resolution pixels based on the feature amount (correction amount calculation unit 103), and the first interpolation pixel position Enlarged image by interpolation using ( A function (interpolation unit 104) for generating an interim image), a function for combining an interpolation image and a correction amount (synthesis unit 105), a feature amount, and a pixel value after synthesis (first high-resolution image). A function (re-correction unit 106) that performs correction according to the input image by performing correction again is provided.
実施形態にかかる画像拡大装置、画像拡大方法およびプログラムは、出力デバイスの解像度が、入力される画像の解像度より高解像度である場合に適用することができる。例えば、DVDをハイビジョンテレビに表示する場合、高解像度な出力機能を持つプリンタ等に、低解像度の画像を拡大印刷する場合や、デジタルカメラやムービーのデジタルズームなどに適用することができる。The image enlargement apparatus, the image enlargement method, and the program according to the embodiment can be applied when the resolution of the output device is higher than the resolution of the input image. For example, when a DVD is displayed on a high-definition television, the present invention can be applied to a case where a low-resolution image is enlarged and printed on a printer having a high-resolution output function or a digital camera or a digital zoom of a movie.
そして、これらの場合において、拡大によるボケを抑えつつくっきり感のある画像を提供することができる。In these cases, it is possible to provide a clear image while suppressing blur caused by enlargement.
また、拡大とエッジ強調を同時に行った場合に、視覚的に白が太く見えてしまう現象を緩和し、視覚的にバランスのよい映像を提供できる。Also, when enlargement and edge enhancement are performed at the same time, it is possible to alleviate the phenomenon that the white looks visually thick and provide a visually balanced image.
101 入力画像
102、1803、41903 特徴量分析部
103、1804、41904 補正量計算部
104、1805、2303、2307、2703、2707、41905 補間部
105、1806、41906 合成部
106、1807、41907 再補正部
107 出力画像
108、1504 画像拡大部
109、41909 白細線化部
110 補間画素位置生成部
201 入力部
202 チューナー
203 外部端子
204 メモリカード
205 メモリ
206 プロセッサ
207 復号部
208 表示部
209 ビデオドライバ
210 ハードディスク
211 表示デバイス
1501、1601 補間位置
1502、1602 画素選択部
1503、1603 小数点位置計算部
1801、41901 入力画素(6×6画素)
1802、1902、2708、41902 補間座標
1808、41908 出力画素
1901、2001、2301、2701、42301 入力画素(N×M画素)
1903、42303 ブロック毎のMIN/MAX計算部
1904、42304 ブロック差分計算部
1905、42305 エリア判定部
1906、42306 特徴量計算部
2002 補間座標Px,Py
2003 傾斜方向判定部
2004 補間位置補正量計算部
2005 補間位置補正部
2006 補正後の補間座標Px’、Py’
2304、2704 エッジ抽出部
2305、2705 補正部
2306、2706 帯域制限部
2702 grad0
2903 強調係数決定部
2904 エッジ強調画像生成部
2905 補間画素生成部
2906 比較部
2907 重み付け合成部
42302 補間座標Px’,Py’101
1802, 1902, 2708, 41902 Interpolated coordinates 1808, 41908
1903, 42303 MIN / MAX calculation unit for each
2003 Inclination
2304, 2704
2903 Enhancement
Claims (17)
Translated fromJapanese前記低解像度画像を入力し、前記高解像度画像の画素数の補間画像を生成する補間部と、
前記低解像度画像の特徴量を分析し、前記高解像度画像の各画素に対する前記特徴量を出力する特徴量分析部と、
前記特徴量分析部により出力された前記特徴量と、前記低解像度画像とを入力し、前記高解像度画像の各画素に対する補正量を計算する補正量計算部と、
前記補正量計算部で計算された前記補正量と、前記補間部で生成された前記補間画像とを合成して、第1の前記高解像度画像を生成する合成部と、
前記合成部により出力された第1の前記高解像度画像を、前記特徴量分析部により生成された前記特徴量を用いて再度、補正し、補正された第2の前記高解像度画像を生成し、生成された第2の前記高解像度画像を、当該画像拡大装置から出力させる再補正部とを備えた画像拡大装置。An image enlarging apparatus that inputs a low resolution image and outputs a high resolution image having a higher resolution than the low resolution image,
An interpolation unit that inputs the low resolution image and generates an interpolation image of the number of pixels of the high resolution image;
A feature quantity analysis unit that analyzes a feature quantity of the low resolution image and outputs the feature quantity for each pixel of the high resolution image;
A correction amount calculation unit that inputs the feature amount output by the feature amount analysis unit and the low-resolution image and calculates a correction amount for each pixel of the high-resolution image;
A synthesis unit that generates the first high-resolution image by combining the correction amount calculated by the correction amount calculation unit and the interpolation image generated by the interpolation unit;
The first high-resolution image output by the synthesis unit is corrected again using the feature amount generated by the feature amount analysis unit, and a corrected second high-resolution image is generated. An image enlarging apparatus comprising: a re-correction unit that outputs the generated second high-resolution image from the image enlarging apparatus.
前記再補正部は、第1の前記高解像度画像における、前記エッジの周辺を光らせる、前記エッジの強調での過補正の成分を、C倍すると共に(0<C<1)、C倍がされた当該成分にクリップを行うことにより、C倍およびクリップがされた第2の前記高解像度画像を生成する請求項1記載の画像拡大装置。The synthesis unit generates the first high-resolution image in which an edge in the interpolated image is emphasized by adding the correction amount to a pixel value in the interpolated image,
The re-correction unit multiplies the overcorrection component in the enhancement of the edge, which illuminates the periphery of the edge in the first high-resolution image, by C (0 <C <1) and is multiplied by C The image enlarging apparatus according to claim 1, wherein the second high-resolution image that is C-folded and clipped is generated by clipping the component.
前記特徴量分析部により出力される前記特徴量は、前記過補正の成分のうちで、当該値CでのC倍および当該幅Tでのクリップにより除去される成分のみが除去された場合には、前記ベタつきが生じない値C及び幅Tを特定し、
前記再補正部は、前記特徴量により特定される前記値Cおよび前記幅Tを各々算出し、算出された前記値CによるC倍と、算出された前記幅Tによるクリップとを行うことにより、当該値Cおよび当該幅Tに基いて除去される前記成分のみを除去した第2の前記高解像度画像を生成する請求項4記載の画像拡大装置。The overcorrection component is a component that causes stickiness when all of the overcorrection components are removed from the first high-resolution image.
The feature amount output by the feature amount analysis unit is obtained when only the component that is removed by clipping at the value C and the clip at the width T is removed from the overcorrected components. , Specify a value C and a width T at which the stickiness does not occur,
The re-correction unit calculates the value C and the width T specified by the feature amount, respectively, and performs C multiplication by the calculated value C and clip by the calculated width T, The image enlarging apparatus according to claim 4, wherein the second high-resolution image is generated by removing only the component removed based on the value C and the width T.
前記再補正部は、第1の前記高解像度画像における、前記エッジの周辺を光らせる、前記エッジの強調での過補正の成分のうちで、前記補間画像から求められた前記閾値から特定される成分を除去した第2の前記高解像度画像を生成し、前記閾値として第1の値が特定される場合に生成される前記第2の高解像度画像の平坦部よりも狭い平坦部を有する第2の前記高解像度画像が生成される第2の値を前記閾値として算出する請求項7記載の画像拡大装置。The synthesizing unit generates the first high-resolution image in which edges in the interpolated image are emphasized by adding the correction amount to the pixel value of the interpolated image generated by the interpolating unit,
The re-correction unit illuminates the periphery of the edge in the first high-resolution image, and the component specified from the threshold obtained from the interpolated image among the over-correction components in the edge enhancement The second high-resolution image from which the second high-resolution image is removed is generated, and a second flat portion narrower than the flat portion of the second high-resolution image generated when the first value is specified as the threshold value. The image enlargement apparatus according to claim 7, wherein a second value at which the high-resolution image is generated is calculated as the threshold value.
前記低解像度画像と前記第1の補間画素位置とを入力し、前記第1の補間画素位置の周辺の画素値の変化に応じて、前記第1の補間画素位置を補正して、前記第1の補間画素位置が補正された第2の補間画素位置を生成する白細線化部とを備え、
前記補正量計算部は、前記第2の補間画素位置と、前記低解像度画像とを入力し、出力する第2の前記高解像度画像の各画素の補正量を計算し、
前記補間部は、前記低解像度画像と、前記第1の補間画素位置とを入力し、入力された前記第1の補間画素位置に対応する画素値を補間計算し、当該第1の補間画素位置に、計算された前記画素値を有する前記補間画像を生成し、
前記合成部は、前記補正量計算部で、前記第2の補間画素位置から計算された前記補正量と、前記補間部で、前記第1の補間画素位置から生成された前記画素値とを合成して、第2の前記高解像度画像を生成する請求項1記載の画像拡大装置。The low resolution corresponding to each pixel of the high resolution image for inputting the image size or the enlargement ratio of the low resolution image and the high resolution image and generating the high resolution image from the low resolution image An interpolation pixel position generation unit for generating a first interpolation pixel position for the image;
The low-resolution image and the first interpolation pixel position are input, the first interpolation pixel position is corrected according to a change in pixel values around the first interpolation pixel position, and the first interpolation pixel position is corrected. A white thinning unit that generates a second interpolation pixel position in which the interpolation pixel position is corrected,
The correction amount calculation unit inputs the second interpolation pixel position and the low-resolution image, calculates a correction amount of each pixel of the second high-resolution image to be output,
The interpolation unit inputs the low-resolution image and the first interpolation pixel position, interpolates and calculates a pixel value corresponding to the input first interpolation pixel position, and the first interpolation pixel position Generating the interpolated image having the calculated pixel value;
The synthesizing unit synthesizes the correction amount calculated from the second interpolation pixel position by the correction amount calculation unit and the pixel value generated from the first interpolation pixel position by the interpolation unit. The image enlargement apparatus according to claim 1, wherein the second high-resolution image is generated.
前記補正量計算部は、前記第2の補間画素位置、前記低解像度画像、および、前記第1の補間画素位置からの前記特徴量を入力し、出力する第2の前記高解像度画像の各画素の補正量を計算する請求項10記載の画像拡大装置。The feature amount analysis unit analyzes the feature amount of the low resolution image at the first interpolation pixel position, and outputs a feature amount for each pixel of the second high resolution image to be output,
The correction amount calculation unit inputs and outputs the feature amount from the second interpolation pixel position, the low resolution image, and the first interpolation pixel position, and outputs each pixel of the second high resolution image. The image enlarging apparatus according to claim 10, wherein the correction amount is calculated.
前記補正量計算部は、前記第2の補間画素位置、前記低解像度画像、および、前記第2の補間画素位置からの前記特徴量を入力し、出力する第2の前記高解像度画像の各画素の補正量を計算する請求項10記載の画像拡大装置。The feature amount analysis unit analyzes the feature amount of the low resolution image at the second interpolation pixel position, and outputs the feature amount for each pixel of the second high resolution image to be output,
The correction amount calculation unit inputs and outputs the feature amount from the second interpolation pixel position, the low resolution image, and the second interpolation pixel position, and outputs each pixel of the second high resolution image. The image enlarging apparatus according to claim 10, wherein the correction amount is calculated.
前記低解像度画像を入力し、前記高解像度画像の画素数の補間画像を生成する補間ステップと、
前記低解像度画像の特徴量を分析し、前記高解像度画像の各画素に対する前記特徴量を出力する特徴量分析ステップと、
前記特徴量分析ステップで出力された前記特徴量と、前記低解像度画像とを入力し、前記高解像度画像の各画素に対する補正量を計算する補正量計算ステップと、
前記補正量計算ステップで計算された前記補正量と、前記補間部で生成された前記補間画像とを合成して、第1の前記高解像度画像を生成する合成ステップと、
前記合成ステップで出力された第1の前記高解像度画像を、前記特徴量分析ステップで生成された前記特徴量を用いて再度、補正し、補正された第2の前記高解像度画像を生成し、生成された第2の前記高解像度画像を、当該画像拡大装置から出力させる再補正ステップとを含む画像拡大方法。An image enlarging apparatus is an image enlarging method for inputting a low resolution image and outputting a high resolution image having a higher resolution than the low resolution image,
An interpolation step of inputting the low resolution image and generating an interpolation image of the number of pixels of the high resolution image;
Analyzing the feature quantity of the low resolution image and outputting the feature quantity for each pixel of the high resolution image; and
A correction amount calculating step of inputting the feature amount output in the feature amount analyzing step and the low-resolution image and calculating a correction amount for each pixel of the high-resolution image;
Combining the correction amount calculated in the correction amount calculating step and the interpolation image generated by the interpolation unit to generate the first high-resolution image;
The first high-resolution image output in the combining step is corrected again using the feature amount generated in the feature amount analysis step, and a corrected second high-resolution image is generated. And a re-correction step of outputting the generated second high-resolution image from the image enlargement apparatus.
前記低解像度画像を入力し、前記高解像度画像の画素数の補間画像を生成する補間部と、
前記低解像度画像の特徴量を分析し、前記高解像度画像の各画素に対する前記特徴量を出力する特徴量分析部と、
前記特徴量分析部により出力された前記特徴量と、前記低解像度画像とを入力し、前記高解像度画像の各画素に対する補正量を計算する補正量計算部と、
前記補正量計算部で計算された前記補正量と、前記補間部で生成された前記補間画像とを合成して、第1の前記高解像度画像を生成する合成部と、
前記合成部により出力された第1の前記高解像度画像を、前記特徴量分析部により生成された前記特徴量を用いて再度、補正し、補正された第2の前記高解像度画像を生成し、生成された第2の前記高解像度画像を、当該集積回路から出力させる再補正部とを備えた集積回路。An integrated circuit that inputs a low-resolution image and outputs a high-resolution image that is higher in resolution than the low-resolution image,
An interpolation unit that inputs the low resolution image and generates an interpolation image of the number of pixels of the high resolution image;
A feature quantity analysis unit that analyzes a feature quantity of the low resolution image and outputs the feature quantity for each pixel of the high resolution image;
A correction amount calculation unit that inputs the feature amount output by the feature amount analysis unit and the low-resolution image and calculates a correction amount for each pixel of the high-resolution image;
A synthesis unit that generates the first high-resolution image by combining the correction amount calculated by the correction amount calculation unit and the interpolation image generated by the interpolation unit;
The first high-resolution image output by the synthesis unit is corrected again using the feature amount generated by the feature amount analysis unit, and a corrected second high-resolution image is generated. An integrated circuit comprising: a re-correction unit that outputs the generated second high-resolution image from the integrated circuit.
前記低解像度画像を入力し、前記高解像度画像の画素数の補間画像を生成する補間ステップと、
前記低解像度画像の特徴量を分析し、前記高解像度画像の各画素に対する前記特徴量を出力する特徴量分析ステップと、
前記特徴量分析ステップで出力された前記特徴量と、前記低解像度画像とを入力し、前記高解像度画像の各画素に対する補正量を計算する補正量計算ステップと、
前記補正量計算ステップで計算された前記補正量と、前記補間部で生成された前記補間画像とを合成して、第1の前記高解像度画像を生成する合成ステップと、
前記合成ステップで出力された第1の前記高解像度画像を、前記特徴量分析ステップで生成された前記特徴量を用いて再度、補正し、補正された第2の前記高解像度画像を生成し、生成された第2の前記高解像度画像を、当該コンピュータから出力させる再補正ステップとを前記コンピュータに実行させるための画像拡大プログラム。An image enlargement program for executing a process of inputting a low resolution image to a computer and outputting a high resolution image having a higher resolution than the low resolution image,
An interpolation step of inputting the low resolution image and generating an interpolation image of the number of pixels of the high resolution image;
Analyzing the feature quantity of the low resolution image and outputting the feature quantity for each pixel of the high resolution image; and
A correction amount calculating step of inputting the feature amount output in the feature amount analyzing step and the low-resolution image and calculating a correction amount for each pixel of the high-resolution image;
Combining the correction amount calculated in the correction amount calculating step and the interpolation image generated by the interpolation unit to generate the first high-resolution image;
The first high-resolution image output in the combining step is corrected again using the feature amount generated in the feature amount analysis step, and a corrected second high-resolution image is generated. An image enlargement program for causing the computer to execute a re-correction step of outputting the generated second high-resolution image from the computer.
Priority Applications (4)
| Application Number | Priority Date | Filing Date | Title |
|---|---|---|---|
| CN200980135712.1ACN102150418B (en) | 2008-12-22 | 2009-12-21 | Image enlargement apparatus, method, and integrated circuit |
| JP2010525142AJP5562242B2 (en) | 2008-12-22 | 2009-12-21 | Image enlargement apparatus, method, integrated circuit, and program |
| US12/918,109US8233744B2 (en) | 2008-12-22 | 2009-12-21 | Image enlargement apparatus, method, integrated circuit, and program |
| US13/533,160US8811773B2 (en) | 2008-12-22 | 2012-06-26 | Image enlargement apparatus, method, integrated circuit, and program |
Applications Claiming Priority (6)
| Application Number | Priority Date | Filing Date | Title |
|---|---|---|---|
| JP2008325210 | 2008-12-22 | ||
| JP2008-325210 | 2008-12-22 | ||
| JP2009191550 | 2009-08-21 | ||
| JP2009191549 | 2009-08-21 | ||
| JP2009-191550 | 2009-08-21 | ||
| JP2009-191549 | 2009-08-21 |
Related Child Applications (2)
| Application Number | Title | Priority Date | Filing Date |
|---|---|---|---|
| US12/918,109A-371-Of-InternationalUS8233744B2 (en) | 2008-12-22 | 2009-12-21 | Image enlargement apparatus, method, integrated circuit, and program |
| US13/533,160DivisionUS8811773B2 (en) | 2008-12-22 | 2012-06-26 | Image enlargement apparatus, method, integrated circuit, and program |
Publications (1)
| Publication Number | Publication Date |
|---|---|
| WO2010073582A1true WO2010073582A1 (en) | 2010-07-01 |
Family
ID=42287231
Family Applications (1)
| Application Number | Title | Priority Date | Filing Date |
|---|---|---|---|
| PCT/JP2009/007054WO2010073582A1 (en) | 2008-12-22 | 2009-12-21 | Image enlarging device, method, integrated circuit, and program |
Country Status (4)
| Country | Link |
|---|---|
| US (2) | US8233744B2 (en) |
| JP (1) | JP5562242B2 (en) |
| CN (1) | CN102150418B (en) |
| WO (1) | WO2010073582A1 (en) |
Cited By (6)
| Publication number | Priority date | Publication date | Assignee | Title |
|---|---|---|---|---|
| WO2012132183A1 (en)* | 2011-03-28 | 2012-10-04 | パナソニック株式会社 | Image processing apparatus, image processing method, computer program for processing images, and recording medium |
| JP2015011130A (en)* | 2013-06-27 | 2015-01-19 | 株式会社横須賀テレコムリサーチパーク | Image processing apparatus, electrophoretic display device, image processing method, and program |
| JP2016115318A (en)* | 2014-12-18 | 2016-06-23 | 日本放送協会 | Blurring correction device, super-resolution device, and program |
| US9466008B2 (en) | 2013-12-09 | 2016-10-11 | Samsung Display Co., Ltd. | Device and method for processing image |
| KR101664743B1 (en)* | 2015-09-22 | 2016-10-12 | 현대자동차주식회사 | Apparatus for generating high resolution image and method thereof |
| US9614999B2 (en) | 2014-12-05 | 2017-04-04 | Samsung Display Co., Ltd. | Image processing apparatus and image processing method with edge enhancement |
Families Citing this family (27)
| Publication number | Priority date | Publication date | Assignee | Title |
|---|---|---|---|---|
| US8335403B2 (en)* | 2006-11-27 | 2012-12-18 | Nec Laboratories America, Inc. | Soft edge smoothness prior and application on alpha channel super resolution |
| GB2481857B (en)* | 2010-07-09 | 2017-02-08 | Snell Ltd | Methods and apparatus for resampling a spatially sampled attribute of an image |
| US8953907B2 (en)* | 2011-06-15 | 2015-02-10 | Marvell World Trade Ltd. | Modified bicubic interpolation |
| JP2013165476A (en)* | 2011-11-11 | 2013-08-22 | Mitsubishi Electric Corp | Image processing device, image processing method, image display device, program, and recording medium |
| CN102881000B (en)* | 2012-09-07 | 2016-05-18 | 华为技术有限公司 | A kind of super-resolution method, device and equipment of video image |
| CN102946522B (en)* | 2012-10-22 | 2015-08-19 | 华为技术有限公司 | Based on super-resolution method and the equipment of non-local mean |
| US8830395B2 (en)* | 2012-12-19 | 2014-09-09 | Marvell World Trade Ltd. | Systems and methods for adaptive scaling of digital images |
| US9349188B2 (en) | 2013-03-15 | 2016-05-24 | Samsung Electronics Co., Ltd. | Creating details in an image with adaptive frequency strength controlled transform |
| US9305332B2 (en) | 2013-03-15 | 2016-04-05 | Samsung Electronics Company, Ltd. | Creating details in an image with frequency lifting |
| US9536288B2 (en) | 2013-03-15 | 2017-01-03 | Samsung Electronics Co., Ltd. | Creating details in an image with adaptive frequency lifting |
| US9066025B2 (en)* | 2013-03-15 | 2015-06-23 | Samsung Electronics Co., Ltd. | Control of frequency lifting super-resolution with image features |
| CN104144281B (en)* | 2013-05-08 | 2017-06-09 | 财团法人车辆研究测试中心 | Self-adaptive image edge repairing device and method thereof |
| CN104346778B (en)* | 2013-07-30 | 2017-08-22 | 比亚迪股份有限公司 | The edge enhancing method and device and digital camera equipment of image |
| JP5621025B1 (en)* | 2013-09-02 | 2014-11-05 | 泰 坂野 | Image processing system, image processing method, and image processing program |
| EP2869023B1 (en)* | 2013-10-30 | 2018-06-13 | Canon Kabushiki Kaisha | Image processing apparatus, image processing method and corresponding computer program |
| US9589324B1 (en)* | 2014-03-27 | 2017-03-07 | Pixelworks, Inc. | Overshoot protection of upscaled images |
| US9652829B2 (en) | 2015-01-22 | 2017-05-16 | Samsung Electronics Co., Ltd. | Video super-resolution by fast video segmentation for boundary accuracy control |
| KR102392810B1 (en)* | 2015-06-10 | 2022-05-03 | 삼성디스플레이 주식회사 | Display device and driving method thereof |
| JP6504500B2 (en)* | 2015-06-18 | 2019-04-24 | パナソニックIpマネジメント株式会社 | Video image enhancement method |
| US10237447B2 (en)* | 2015-06-29 | 2019-03-19 | Canon Kabushiki Kaisha | Image processing apparatus, image processing method, and storage medium |
| JP6719104B2 (en)* | 2015-08-28 | 2020-07-08 | パナソニックIpマネジメント株式会社 | Image output device, image transmission device, image reception device, image output method, and recording medium |
| KR102087681B1 (en)* | 2015-09-17 | 2020-03-11 | 삼성전자주식회사 | Image processing device, method for processing image and computer-readable recording medium |
| US20170109863A1 (en)* | 2015-10-19 | 2017-04-20 | Mathieu Jacques | Pixel Mapping Systems and Processes Using Raster-Based and Vector Representation Principles |
| US9819900B2 (en)* | 2015-12-30 | 2017-11-14 | Spreadtrum Communications (Shanghai) Co., Ltd. | Method and apparatus for de-interlacing television signal |
| CN106231416A (en)* | 2016-08-16 | 2016-12-14 | 北京小米移动软件有限公司 | Method for processing video frequency and device |
| CN113611244B (en)* | 2021-08-04 | 2022-07-15 | 卡莱特云科技股份有限公司 | LED display screen contrast improving method and LED display screen |
| KR20240136502A (en)* | 2023-03-06 | 2024-09-19 | 삼성디스플레이 주식회사 | Image display system including display panel and lens array and method for operating thereof |
Citations (3)
| Publication number | Priority date | Publication date | Assignee | Title |
|---|---|---|---|---|
| JPH11298718A (en)* | 1998-04-06 | 1999-10-29 | Seiko Epson Corp | Image data interpolation apparatus, image data interpolation method, and medium recording image data interpolation program |
| JP2002158869A (en)* | 2000-11-21 | 2002-05-31 | Mitsubishi Electric Corp | Image processing device and image display device, image processing method and image display method |
| JP2010041497A (en)* | 2008-08-06 | 2010-02-18 | Sanyo Electric Co Ltd | Image processor, electronic apparatus, and image processing method |
Family Cites Families (40)
| Publication number | Priority date | Publication date | Assignee | Title |
|---|---|---|---|---|
| US5617224A (en)* | 1989-05-08 | 1997-04-01 | Canon Kabushiki Kaisha | Imae processing apparatus having mosaic processing feature that decreases image resolution without changing image size or the number of pixels |
| US5125072A (en)* | 1989-07-31 | 1992-06-23 | Eastman Kodak Company | Efficient data storage system for gray-scale printers |
| US5131057A (en)* | 1990-02-12 | 1992-07-14 | Wright State University | Method for video-to-printing image resolution conversion |
| US5657402A (en)* | 1991-11-01 | 1997-08-12 | Massachusetts Institute Of Technology | Method of creating a high resolution still image using a plurality of images and apparatus for practice of the method |
| JP2989364B2 (en)* | 1992-03-12 | 1999-12-13 | シャープ株式会社 | Image processing apparatus and image processing method |
| TW377431B (en)* | 1995-04-14 | 1999-12-21 | Hitachi Ltd | Method and apparatus for changing resolution |
| US5912708A (en)* | 1996-12-26 | 1999-06-15 | Sony Corporation | Picture signal encoding device, picture signal encoding method, picture signal decoding device, picture signal decoding method, and recording medium |
| US6160845A (en)* | 1996-12-26 | 2000-12-12 | Sony Corporation | Picture encoding device, picture encoding method, picture decoding device, picture decoding method, and recording medium |
| US6760489B1 (en) | 1998-04-06 | 2004-07-06 | Seiko Epson Corporation | Apparatus and method for image data interpolation and medium on which image data interpolation program is recorded |
| JP2000083157A (en)* | 1998-09-07 | 2000-03-21 | Fuji Photo Film Co Ltd | Image processing method and image processing unit |
| JP2000115526A (en) | 1998-10-06 | 2000-04-21 | Hitachi Ltd | Image processing apparatus and edge processing method |
| US7003176B1 (en)* | 1999-05-06 | 2006-02-21 | Ricoh Company, Ltd. | Method, computer readable medium and apparatus for converting color image resolution |
| JP2000339450A (en)* | 1999-05-26 | 2000-12-08 | Sony Corp | Picture processing method and picture processor |
| JP3419352B2 (en)* | 1999-07-15 | 2003-06-23 | 松下電器産業株式会社 | Image processing apparatus, image processing method, and image processing program recording medium |
| US6933970B2 (en)* | 1999-12-20 | 2005-08-23 | Texas Instruments Incorporated | Digital still camera system and method |
| US7330209B2 (en)* | 1999-12-20 | 2008-02-12 | Texas Instruments Incorporated | Digital still camera system and complementary-color-filtered array interpolation method |
| US6724398B2 (en) | 2000-06-20 | 2004-04-20 | Mitsubishi Denki Kabushiki Kaisha | Image processing method and apparatus, and image display method and apparatus, with variable interpolation spacing |
| US6714688B1 (en)* | 2000-11-10 | 2004-03-30 | Eastman Kodak Company | Method and apparatus for enhancing the edge contrast of an interpolated digital image |
| US6898332B2 (en)* | 2000-11-15 | 2005-05-24 | Seiko Epson Corporation | Image processing device and image processing method |
| US7068396B1 (en)* | 2000-11-21 | 2006-06-27 | Eastman Kodak Company | Method and apparatus for performing tone scale modifications on a sparsely sampled extended dynamic range digital image |
| EP1231773B8 (en)* | 2001-02-09 | 2005-09-28 | Imaging Solutions AG | Local sharpening of photographic images by utilizing masks |
| EP1390814A2 (en)* | 2001-05-30 | 2004-02-25 | Nptest, Inc. | Sub-resolution alignment of images |
| US6795587B2 (en)* | 2001-07-23 | 2004-09-21 | Micron Technology, Inc. | Image resizing using short asymmetric FIR filters |
| US7149369B2 (en)* | 2002-04-23 | 2006-12-12 | Hewlett-Packard Development Company, L.P. | Method and system for image scaling |
| US7474794B2 (en)* | 2002-06-25 | 2009-01-06 | Quix Technologies Ltd. | Image processing using probabilistic local behavior assumptions |
| US7031515B2 (en)* | 2002-07-19 | 2006-04-18 | Kabushiki Kaisha Toshiba | Image processing apparatus and image processing method |
| JP4259949B2 (en)* | 2003-08-08 | 2009-04-30 | 株式会社リコー | Image creating apparatus, image creating program, and recording medium |
| JP4407801B2 (en) | 2003-12-16 | 2010-02-03 | セイコーエプソン株式会社 | Edge generation apparatus, edge generation method, and edge generation program |
| JP4455364B2 (en)* | 2004-03-09 | 2010-04-21 | キヤノン株式会社 | Resolution conversion method and apparatus |
| EP1746846B1 (en)* | 2004-04-12 | 2019-03-20 | Nikon Corporation | Image processing device having color shift-correcting function, image processing program, and electronic camera |
| KR100530224B1 (en)* | 2004-04-20 | 2005-11-22 | 삼성전자주식회사 | Image transforming device and method thereof |
| CN101685536B (en)* | 2004-06-09 | 2011-11-30 | 松下电器产业株式会社 | image processing method |
| JP4517872B2 (en)* | 2005-02-10 | 2010-08-04 | ソニー株式会社 | Image processing apparatus, image processing method, program for image processing method, and recording medium recording program for image processing method |
| US7613363B2 (en)* | 2005-06-23 | 2009-11-03 | Microsoft Corp. | Image superresolution through edge extraction and contrast enhancement |
| CN1804901A (en)* | 2006-01-18 | 2006-07-19 | 天津大学 | Neighbor diffused selection based smooth image multiplication method |
| US7340098B2 (en)* | 2006-03-15 | 2008-03-04 | Matsushita Electric Industrial Co., Ltd. | Method and apparatus for image conversion |
| JP4490987B2 (en) | 2007-04-26 | 2010-06-30 | 株式会社東芝 | High resolution device and method |
| KR101265956B1 (en)* | 2007-11-02 | 2013-05-22 | 삼성전자주식회사 | System and method for restoration image based block of image |
| JP2010063088A (en)* | 2008-08-08 | 2010-03-18 | Sanyo Electric Co Ltd | Imaging apparatus |
| KR101035744B1 (en)* | 2008-12-08 | 2011-05-20 | 삼성전자주식회사 | Character recognition apparatus and method using camera |
- 2009
- 2009-12-21WOPCT/JP2009/007054patent/WO2010073582A1/enactiveApplication Filing
- 2009-12-21USUS12/918,109patent/US8233744B2/enactiveActive
- 2009-12-21JPJP2010525142Apatent/JP5562242B2/enactiveActive
- 2009-12-21CNCN200980135712.1Apatent/CN102150418B/enactiveActive
- 2012
- 2012-06-26USUS13/533,160patent/US8811773B2/enactiveActive
Patent Citations (3)
| Publication number | Priority date | Publication date | Assignee | Title |
|---|---|---|---|---|
| JPH11298718A (en)* | 1998-04-06 | 1999-10-29 | Seiko Epson Corp | Image data interpolation apparatus, image data interpolation method, and medium recording image data interpolation program |
| JP2002158869A (en)* | 2000-11-21 | 2002-05-31 | Mitsubishi Electric Corp | Image processing device and image display device, image processing method and image display method |
| JP2010041497A (en)* | 2008-08-06 | 2010-02-18 | Sanyo Electric Co Ltd | Image processor, electronic apparatus, and image processing method |
Cited By (8)
| Publication number | Priority date | Publication date | Assignee | Title |
|---|---|---|---|---|
| WO2012132183A1 (en)* | 2011-03-28 | 2012-10-04 | パナソニック株式会社 | Image processing apparatus, image processing method, computer program for processing images, and recording medium |
| US9153010B2 (en) | 2011-03-28 | 2015-10-06 | Panasonic Intellectual Property Corporation Of America | Image processing device and image processing method generating a high-resolution image from a low-resolution image |
| JP5837572B2 (en)* | 2011-03-28 | 2015-12-24 | パナソニック インテレクチュアル プロパティ コーポレーション オブアメリカPanasonic Intellectual Property Corporation of America | Image processing apparatus, image processing method, computer program for image processing, and recording medium |
| JP2015011130A (en)* | 2013-06-27 | 2015-01-19 | 株式会社横須賀テレコムリサーチパーク | Image processing apparatus, electrophoretic display device, image processing method, and program |
| US9466008B2 (en) | 2013-12-09 | 2016-10-11 | Samsung Display Co., Ltd. | Device and method for processing image |
| US9614999B2 (en) | 2014-12-05 | 2017-04-04 | Samsung Display Co., Ltd. | Image processing apparatus and image processing method with edge enhancement |
| JP2016115318A (en)* | 2014-12-18 | 2016-06-23 | 日本放送協会 | Blurring correction device, super-resolution device, and program |
| KR101664743B1 (en)* | 2015-09-22 | 2016-10-12 | 현대자동차주식회사 | Apparatus for generating high resolution image and method thereof |
Also Published As
| Publication number | Publication date |
|---|---|
| US20120263384A1 (en) | 2012-10-18 |
| CN102150418B (en) | 2014-10-15 |
| CN102150418A (en) | 2011-08-10 |
| JP5562242B2 (en) | 2014-07-30 |
| US8811773B2 (en) | 2014-08-19 |
| US20100322536A1 (en) | 2010-12-23 |
| US8233744B2 (en) | 2012-07-31 |
| JPWO2010073582A1 (en) | 2012-06-07 |
Similar Documents
| Publication | Publication Date | Title |
|---|---|---|
| JP5562242B2 (en) | Image enlargement apparatus, method, integrated circuit, and program | |
| US7782401B1 (en) | Method and system for digital image scaling with sharpness enhancement and transient improvement | |
| JP4894595B2 (en) | Image processing apparatus and method, and program | |
| JP4577621B2 (en) | Image correction processing system and image correction processing method | |
| US7483040B2 (en) | Information processing apparatus, information processing method, recording medium, and program | |
| US7876979B2 (en) | Resolution-converting apparatus and method | |
| US9137464B2 (en) | Image processing apparatus and control method of the same | |
| US8334932B2 (en) | Image processing device, image display device, and image processing method | |
| WO2011033619A1 (en) | Image processing device, image processing method, image processing program, and storage medium | |
| JP6485068B2 (en) | Image processing method and image processing apparatus | |
| US20190043171A1 (en) | Image processing apparatus and image processing method | |
| JP6335614B2 (en) | Image processing apparatus, control method thereof, and program | |
| JP4467416B2 (en) | Tone correction device | |
| JP4305917B2 (en) | Video signal processing apparatus and television apparatus | |
| JP2015064869A (en) | Image processing method and image processing apparatus | |
| JP6403720B2 (en) | Image processing apparatus, image processing method, and computer program | |
| US8468185B2 (en) | Data processing method and apparatus having input sample values and applying a filter to limit an output value range to be within a permissible range | |
| KR102470242B1 (en) | Image processing device, image processing method and program | |
| JP4526405B2 (en) | TV image processing device | |
| JP2015106318A (en) | Image processor and image processing method | |
| JP6575742B2 (en) | Image processing method and image processing apparatus | |
| KR20050121148A (en) | Image interpolation method, and apparatus of the same | |
| JP4176681B2 (en) | Image edge correction apparatus and image edge correction method | |
| US12327335B2 (en) | Gradient adaptive ringing control for image resampling | |
| JP2011022779A (en) | Image correction apparatus, image correction method and program |
Legal Events
| Date | Code | Title | Description |
|---|---|---|---|
| WWE | Wipo information: entry into national phase | Ref document number:200980135712.1 Country of ref document:CN | |
| WWE | Wipo information: entry into national phase | Ref document number:2010525142 Country of ref document:JP | |
| 121 | Ep: the epo has been informed by wipo that ep was designated in this application | Ref document number:09834393 Country of ref document:EP Kind code of ref document:A1 | |
| WWE | Wipo information: entry into national phase | Ref document number:12918109 Country of ref document:US | |
| WWE | Wipo information: entry into national phase | Ref document number:1775/CHENP/2011 Country of ref document:IN | |
| NENP | Non-entry into the national phase | Ref country code:DE | |
| 122 | Ep: pct application non-entry in european phase | Ref document number:09834393 Country of ref document:EP Kind code of ref document:A1 |