US9807849B2 - Automatically commissioning lighting controls using sensing parameters of the lighting controls - Google Patents
Automatically commissioning lighting controls using sensing parameters of the lighting controlsDownload PDFInfo
- Publication number
- US9807849B2 US9807849B2US14/194,684US201414194684AUS9807849B2US 9807849 B2US9807849 B2US 9807849B2US 201414194684 AUS201414194684 AUS 201414194684AUS 9807849 B2US9807849 B2US 9807849B2
- Authority
- US
- United States
- Prior art keywords
- graph
- sensor
- sensors
- vertices
- vertex
- Prior art date
- Legal status (The legal status is an assumption and is not a legal conclusion. Google has not performed a legal analysis and makes no representation as to the accuracy of the status listed.)
- Active, expires
Links
Images


Classifications
- H—ELECTRICITY
- H05—ELECTRIC TECHNIQUES NOT OTHERWISE PROVIDED FOR
- H05B—ELECTRIC HEATING; ELECTRIC LIGHT SOURCES NOT OTHERWISE PROVIDED FOR; CIRCUIT ARRANGEMENTS FOR ELECTRIC LIGHT SOURCES, IN GENERAL
- H05B47/00—Circuit arrangements for operating light sources in general, i.e. where the type of light source is not relevant
- H05B47/10—Controlling the light source
- H05B47/105—Controlling the light source in response to determined parameters
- H05B47/11—Controlling the light source in response to determined parameters by determining the brightness or colour temperature of ambient light
- H05B37/0218—
- H05B37/0227—
- H05B37/0245—
- H—ELECTRICITY
- H05—ELECTRIC TECHNIQUES NOT OTHERWISE PROVIDED FOR
- H05B—ELECTRIC HEATING; ELECTRIC LIGHT SOURCES NOT OTHERWISE PROVIDED FOR; CIRCUIT ARRANGEMENTS FOR ELECTRIC LIGHT SOURCES, IN GENERAL
- H05B47/00—Circuit arrangements for operating light sources in general, i.e. where the type of light source is not relevant
- H05B47/10—Controlling the light source
- H05B47/105—Controlling the light source in response to determined parameters
- H05B47/115—Controlling the light source in response to determined parameters by determining the presence or movement of objects or living beings
- H—ELECTRICITY
- H05—ELECTRIC TECHNIQUES NOT OTHERWISE PROVIDED FOR
- H05B—ELECTRIC HEATING; ELECTRIC LIGHT SOURCES NOT OTHERWISE PROVIDED FOR; CIRCUIT ARRANGEMENTS FOR ELECTRIC LIGHT SOURCES, IN GENERAL
- H05B47/00—Circuit arrangements for operating light sources in general, i.e. where the type of light source is not relevant
- H05B47/10—Controlling the light source
- H05B47/175—Controlling the light source by remote control
- G—PHYSICS
- G01—MEASURING; TESTING
- G01S—RADIO DIRECTION-FINDING; RADIO NAVIGATION; DETERMINING DISTANCE OR VELOCITY BY USE OF RADIO WAVES; LOCATING OR PRESENCE-DETECTING BY USE OF THE REFLECTION OR RERADIATION OF RADIO WAVES; ANALOGOUS ARRANGEMENTS USING OTHER WAVES
- G01S11/00—Systems for determining distance or velocity not using reflection or reradiation
- G01S11/12—Systems for determining distance or velocity not using reflection or reradiation using electromagnetic waves other than radio waves
- G—PHYSICS
- G05—CONTROLLING; REGULATING
- G05B—CONTROL OR REGULATING SYSTEMS IN GENERAL; FUNCTIONAL ELEMENTS OF SUCH SYSTEMS; MONITORING OR TESTING ARRANGEMENTS FOR SUCH SYSTEMS OR ELEMENTS
- G05B15/00—Systems controlled by a computer
- G05B15/02—Systems controlled by a computer electric
- G—PHYSICS
- G05—CONTROLLING; REGULATING
- G05B—CONTROL OR REGULATING SYSTEMS IN GENERAL; FUNCTIONAL ELEMENTS OF SUCH SYSTEMS; MONITORING OR TESTING ARRANGEMENTS FOR SUCH SYSTEMS OR ELEMENTS
- G05B2219/00—Program-control systems
- G05B2219/20—Pc systems
- G05B2219/26—Pc applications
- G05B2219/2642—Domotique, domestic, home control, automation, smart house
- H—ELECTRICITY
- H05—ELECTRIC TECHNIQUES NOT OTHERWISE PROVIDED FOR
- H05B—ELECTRIC HEATING; ELECTRIC LIGHT SOURCES NOT OTHERWISE PROVIDED FOR; CIRCUIT ARRANGEMENTS FOR ELECTRIC LIGHT SOURCES, IN GENERAL
- H05B47/00—Circuit arrangements for operating light sources in general, i.e. where the type of light source is not relevant
- H05B47/10—Controlling the light source
- H05B47/175—Controlling the light source by remote control
- H05B47/198—Grouping of control procedures or address assignation to light sources
- H05B47/199—Commissioning of light sources
- H05B47/1995—Auto-commissioning
- Y—GENERAL TAGGING OF NEW TECHNOLOGICAL DEVELOPMENTS; GENERAL TAGGING OF CROSS-SECTIONAL TECHNOLOGIES SPANNING OVER SEVERAL SECTIONS OF THE IPC; TECHNICAL SUBJECTS COVERED BY FORMER USPC CROSS-REFERENCE ART COLLECTIONS [XRACs] AND DIGESTS
- Y02—TECHNOLOGIES OR APPLICATIONS FOR MITIGATION OR ADAPTATION AGAINST CLIMATE CHANGE
- Y02B—CLIMATE CHANGE MITIGATION TECHNOLOGIES RELATED TO BUILDINGS, e.g. HOUSING, HOUSE APPLIANCES OR RELATED END-USER APPLICATIONS
- Y02B20/00—Energy efficient lighting technologies, e.g. halogen lamps or gas discharge lamps
- Y02B20/40—Control techniques providing energy savings, e.g. smart controller or presence detection
- Y02B20/46—
Definitions
- the described embodimentsrelate generally to control systems. More particularly, the described embodiments relate to methods, apparatuses and systems for automatically commissioning lighting controls using sensing parameters of the lighting controls.
- Sensors within a structurecan be utilized for automatically control lighting, and conserver use of energy to power with lighting.
- the sensorsinclude, for example, motion sensors and light sensors.
- automated lighting control systemscan be difficult to design, and can include high costs of installation.
- the installation processtypically includes a commissioning process which can be time consuming and expensive.
- One embodimentincludes a method of locating lights of a structure.
- the methodincludes sensing signals, by a plurality of sensor units wherein the plurality of sensor units are associated with a plurality of lights, and generating a graph based on the sensed signals, wherein the graph includes nodes that represent light locations, and edges that represent distances between the lights.
- the building control systemincludes a plurality of sensors, a plurality of lights associated with the plurality of sensors, and a controller.
- the controlleris operative to receive sense signals from the plurality of sensors, and generate a graph based on the sensed signals, wherein the graph includes nodes that represent light locations, and edges that represent distances between the lights.
- FIG. 1shows an area that includes multiple fixtures that include sensors and/or lights, according to an embodiment.
- FIG. 2shows a lighting fixture of a lighting system, according to an embodiment.
- FIG. 3shows a lighting fixture of a lighting system, according to another embodiment.
- FIG. 4shows variation of measured intensity of light with respect to distance from the source of the light, according to an embodiment.
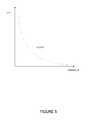
- FIG. 5shows variation of measured link quality indicator (LQI) with respect to distance from the source of an electromagnetic signal source, according to an embodiment.
- FIG. 6is a flow chart that includes steps of operation of a motion sensor, according to an embodiment.
- FIG. 7show samples of data generated by a plurality of motion sensor units, according to an embodiment.
- FIG. 8shows steps of a method of constructing a graph G S1 from data generated by a motion sensor unit, according to an embodiment.
- FIG. 9shows an example of data generated by a light intensity sensor unit, according to an embodiment.
- FIG. 10shows steps of a method of constructing a graph G S2 from data generated by a light intensity sensor unit, according to an embodiment.
- FIG. 11shows an example of data generated by an LQI sensor unit, according to an embodiment.
- FIG. 12shows steps of a method of constructing a graph G S3 from data generated by an LQI sensor unit, according to an embodiment.
- FIG. 13is a flow chart that include steps of a method of constructing a compiled graph G S from the graphs G S1 , G S2 G S3 , according to an embodiment.
- FIG. 14is a flow chart that includes steps of a method of constructing the compiled graph G S using a synthesis function, according to an embodiment.
- FIG. 15is a flow chart that includes steps of a method of constructing a floor plan graph G f , according to an embodiment.
- FIG. 16shows a floor plan graph according to an embodiment.
- FIG. 17shows a sensor graph according to an embodiment.
- FIGS. 18, 19, 20show steps of methods for analyzing and matching two un-weighted graphs with a maximum run time, and outputting a best match found between the two graphs and a score of the best match, according to at least some embodiments.
- FIGS. 21, 22, 23show steps of methods for finding a match between two one-degree neighboring graphs with a maximum run time, and outputting a score of the best match, according to at least some embodiments.
- FIGS. 24, 25show steps of methods for finding best matched vertices between two graphs in which best matching is already known, according to at least some embodiments.
- An embodimentincludes commissioning of lighting controls onto a floor plan using sensing parameters of the lighting controls.
- the commissioningincludes generating a sensor graph that include information of relationships (such as, which sensors are neighbors, estimated distances between the sensors, and confidences of the estimates of the distances) between sensors (and/or fixtures) of an area that is obtained through sensing and/or control of the sensors and/or lighting fixtures associated with the sensors.
- the commissioningincludes matching the sensor graph with a floor plan graph, wherein the floor plan graph is generated based on a known floor plan of the area.
- the matchingprovides an identification of where each of the sensors of the area is located.
- the matchingfurther provides a quality of the matching that reflects a confidence level of the matching.
- FIG. 1shows an area 100 that includes multiple fixtures 101 - 120 , according to an embodiment.
- each fixture 101 - 120includes one or more sensors, a lighting controller, and a light.
- each of the fixtures 101 - 120includes at least one sensor.
- the fixtures 101 - 120are dispersed within a structure that includes the area 100 . As shown, the fixtures 101 - 120 can be deployed within cubicles, hallways and open spaces within the area 100 . Once deployed, the locations of the fixtures 101 - 120 within the building are recorded for future reference, and for building control utilizing the fixtures 101 - 120 . After deployed, a commissioning process is completed to determine the location of each of the fixtures 101 - 120 .
- the fixtures 101 - 120are interfaced with a controller 130 .
- each fixture 101 - 120is directly connected to the controller 130 .
- linksexist between the fixtures, allowing a fixture to be connected to the controller 120 through one or more other fixtures.
- the fixtures 101 - 120can form a wireless mesh network, and links between fixtures and other devices can include links through other fixtures.
- the controller 130receives information from the fixtures, and controls an environmental condition (such as, lighting or heating) within the area 100 .
- the controller 130receives information that includes at least sensed signals of sensors of the fixtures 101 - 120 within the area. Based on the sensed signals, the controller 130 automatically performs a commissioning process in which a location (both absolute locations and locations relative to other fixtures) of each fixture is determined. Once determined, the location of each of the sensors and/or fixtures is stored in memory 140 for future reference.
- controller 130While shown as a separate controller 130 , for at least embodiments, the processing of the controller 130 is distributed amongst the controller of each of the fixtures. For other embodiments, the processing of the controller 130 is self-contained within a remote controller 130 .
- FIG. 2shows a lighting fixture 200 of a lighting system, according to an embodiment.
- the lighting fixture 200includes a motion detecting unit (motion sensor unit) 210 , a light intensity detection unit (light intensity sensor unit) 220 , an LQI unit (electromagnetic signals transmitter and receiver) 230 , a controller/interface 240 , and a light controller unit 250 .
- the motion detecting unit 210sensed motion proximate to the fixture 200 .
- the light intensity detection unit 220senses the intensity of light proximate to the fixture 200 . It should be noted, that for at least some embodiments, at least one light associated with the fixture 200 emits light.
- the LQI unitboth senses (receives) electromagnetic signals proximate to the fixture 200 , and for at least some embodiments, also emits (transmits) and electromagnetic signal.
- the controller/interface 240receives the sensed signals of the motion detecting unit 210 , the light intensity detection unit 220 , and the LQI unit 230 and provides the sensed signals to the central controller 130 . At least one of the controller/interface 240 and the central controller 130 provides control information to the light controller unit 250 for controlling one or more light associated with the fixture 200 .
- the central controller 130based on the sensed signal of one or more of the motion detecting unit 210 , the light intensity detection unit 220 , and the LQI unit 230 the central controller 130 generates graphs that include estimated locations of each of multiple fixtures including the fixture 200 .
- the central controller 130further places the fixtures on an existing floor plan, thereby generating a floor plan graph of the area in which the fixtures are located that includes the locations of all of the fixtures. While describes as controlling light, it is to be understood that for at least some embodiments, the fixture additionally or alternatively control another environmental parameter, such as, heat or cooling (HVAC).
- HVACheat or cooling
- FIG. 3shows sensor and associated lighting control (fixture), according to an embodiment.
- a sensor and associated lighting control fixture 300includes a smart sensor system 302 that is interfaced with a high-voltage manager 304 , which is interfaced with a luminaire 340 .
- the sensor and associated lighting control of FIG. 3is one exemplary embodiment of the sensors utilized for occupancy detection. Many different sensor embodiments are adapted to utilization of the described embodiments for occupant sensing and motion. For at least some embodiments, sensors that are not directly associated with light control are utilized.
- the high-voltage manager 304includes a controller (manager CPU) 320 that is coupled to the luminaire 340 , and to a smart sensor CPU 335 of the smart sensor system 302 .
- the smart sensor CPU 345is coupled to a communication interface 350 , wherein the communication interface 350 couples the controller to an external device.
- the smart sensor system 302additionally includes a sensor 340 .
- the sensor 340can include one or more of a light sensor 341 , a motion sensor 342 , and temperature sensor 343 , and camera 344 and/or an air quality sensor 345 . It is to be understood that this is not an exhaustive list of sensors. That is additional or alternate sensors can be utilized for occupancy and motion detection of a structure that utilizes the lighting control fixture 300 .
- the sensor 340is coupled to the smart sensor CPU 345 , and the sensor 340 generates a sensed input. For at least one embodiment, at least one of the sensors is utilized for communication with the user device.
- the temperature sensor 343is utilized for occupancy detection.
- the temperature sensor 343is utilized to determine how much and/or how quickly the temperature in the room has increased since the start of, for example, a meeting of occupants. How much the temperate has increased and how quickly the temperature has increased can be correlated with the number of the occupants. All of this is dependent on the dimensions of the room and related to previous occupied periods.
- estimates and/or knowledge of the number of occupants within a roomare used to adjust the HVAC (heating, ventilation and air conditioning) of the room.
- the temperature of the roomis adjusted based on the estimated number of occupants in the room.
- the controllersare operative to control a light output of the luminaire 340 based at least in part on the sensed input, and communicate at least one of state or sensed information to the external device.
- the high-voltage manager 304receives the high-power voltage and generates power control for the luminaire 340 , and generates a low-voltage supply for the smart sensor system 302 .
- the high-voltage manager 304 and the smart sensor system 302interact to control a light output of the luminaire 340 based at least in part on the sensed input, and communicate at least one of state or sensed information to the external device.
- the high-voltage manager 304 and the smart sensor system 302can also receive state or control information from the external device, which can influence the control of the light output of the luminaire 340 .
- manager CPU 320 of the high-voltage manager 304 and the smart sensor CPU 345 of the smart sensor system 302are shown as separate controllers, it is to be understood that for at least some embodiments the two separate controllers (CPUs) 320 , 345 can be implemented as single controller or CPU.
- the communication interface 350provides a wireless link to external devices (for example, the central controller, the user device and/or other lighting sub-systems or devices).
- external devicesfor example, the central controller, the user device and/or other lighting sub-systems or devices.
- An embodiment of the high-voltage manager 304 of the lighting control fixture 300further includes an energy meter (also referred to as a power monitoring unit), which receives the electrical power of the lighting control fixture 300 .
- the energy metermeasures and monitors the power being dissipated by the lighting control fixture 300 .
- the monitoring of the dissipated powerprovides for precise monitoring of the dissipated power. Therefore, if the manager CPU 320 receives a demand response (typically, a request from a power company that is received during periods of high power demands) from, for example, a power company, the manager CPU 320 can determine how well the lighting control fixture 300 is responding to the received demand response. Additionally, or alternatively, the manager CPU 320 can provide indications of how much energy (power) is being used, or saved.
- a demand responsetypically, a request from a power company that is received during periods of high power demands
- the manager CPU 320can determine how well the lighting control fixture 300 is responding to the received demand response. Additionally, or alternatively, the
- FIG. 4shows variation of measured intensity of light with respect to distance from the source of the light, according to an embodiment.
- the light intensity detection unit 220generates a sensed signal that represents an intensity of received light. This sensed signal can be used for estimating a location of the sensor (and therefore, a fixture that includes the sensor).
- the curve shown in FIG. 4provides a representation of the variation in received light intensity as a function of the distance the sensor receiving the light is from the source of the light. Utilizing this relationship, estimates of the distance between a light source and a sensor sensing the light source can be determined. For example, a light associated with a first fixture can be controllably activated.
- the distance between the activated light of the first fixture and the light sensor of the second fixturecan be estimated.
- a light of a single fixture of an areais activated making it the only source of light in the area and the distances between the activated light of the single fixture and the other fixtures of the area can be estimated.
- the intensity of light generated by a fixturediminishes with distance traveled by the light way from the Fixture Light.
- the light intensity at exemplary distances of 0 feet, 2 feet, 4 feet and 6 feetare depicted in FIG. 4 .
- the distances between the light intensity sensor and the originating lightcan be estimated based on the sensed light intensity.
- FIG. 5shows variation of measured link quality indicator (LQI) with respect to distance from the source of an electromagnetic signal source, according to an embodiment.
- the LQI unit 230 of the fixturesincludes an electromagnetic signal transmitter and an electromagnetic signal receiver. Utilizing a curve similar to the curve shown in FIG. 5 , the distance between a first LQI unit of a first fixture and a second LQI unit of the second fixture can be estimated. That is, by transmitting an electromagnetic signal from the first fixture at a known power level, the distance between the first LQI sensor and the second LQI sensor can be estimated based on the power level of the sensed electromagnetic signal received by the second LQI.
- LQIdecreases with square of distance. Based on this observation of LQI between two LQI sensors (fixtures), the relative distance between fixtures in the network of fixtures can be determined.
- FIG. 6is a flow chart that includes steps of operation of a motion sensor, according to an embodiment.
- the motion detecting units 210 of multiple fixturescan associate commonly located fixtures by correlating motion sensed by the commonly located fixtures. That is, when the timing of sensed motion of multiple fixtures is the same, it is assumed that the multiple fixtures are proximately located. The more times the sensed motion of motion detecting units 210 of the multiple fixtures are correlated in time, the higher the level of confidence that the multiple fixtures are located near each other.
- a first step 610includes sensing motion by a motion detecting unit 210 over an interval of time. That is, sensed motion is monitored and observed over a fixed interval of time.
- a second step 620includes recording the presence or absence of motion during the interval of time.
- the recorded presence of motion during the interval of time for multiple motion detecting unitscan be used to determine common locations of the fixtures of the motion detecting units.
- the motion observation processobserves (senses motion) of the area associated with the fixtures, for a fixed interval of time, for example, 5 seconds and then record the presence or absence of motion. This recorded information is sent to central controller at fixed interval of, for example, 5 minutes, for processing. The process continues until stopped.
- FIG. 7show samples of data generated by a plurality of motion sensor units, according to an embodiment.
- the data shown in FIG. 7is raw data generated by multiple motion sensor units of multiple fixtures.
- the table of data of FIG. 7includes the motion sensor unit number (1-5), a time stamp of the senses motion, and the raw sensed motion data.
- commonly located sensors and fixturescan be identified by correlating the sensed motion of the multiple fixtures.
- the data of the motion detecting unitis sent to the central controller once every time period (for example, every 5 minutes) and sampled at a sampling interval (such as, every 5 seconds).
- the LCS_IDrepresents identification identifier of sensor (fixtures)
- TIMESTAMPrepresents time at which 5 minute window ends
- MOTION_DETECTEDrepresents the 60 binary motion bits with 1 representing motion detected and 0 representing motion not detected.
- FIG. 8shows steps of a method of constructing a graph G S1 from data generated by a motion sensor unit, according to an embodiment.
- a first step 810includes a controller retrieving the sensing motion data from memory.
- a second step 820includes identifying, for a particular motion sensor of a fixture, other motion sensors of other fixtures that repeatedly detect motion at the same time the particular sensor does.
- the other fixturesare identified as immediate neighboring fixtures.
- a confidence levelis determined based how closely the motion of the other fixtures is correlated to motion sensed by the particular motion sensor, and the number of repeating times the motion is correlated.
- a third step 830includes constructing a graph G S1 , wherein the vertices of the graph include a motion sensor of a fixture. Further, an edge value between the vertices if the vertices are immediate neighbors, and the edge value is based upon the confidence level.
- the graph G S1can be written to memory (step 830 ).
- the process of FIG. 8provides an exemplary method of algorithmically processing the motion data.
- the key observation in analysis of motion datais that if two sensors are detecting motion at same instant of time (for example, at the sampling interval of 5 seconds) or in a next interval then the sensors are spatially close with high probability. It could happen that two sensors are distant but detect motion in same interval because 2 different people are walking below that sensor in the same instant of time. But the probability of latter case happening is much smaller as compared to that of former one.
- FIG. 9shows an example of data generated by a light intensity sensor unit, according to an embodiment. More specifically, FIG. 9 includes a table that indicates the fixture of the activated light (light source), the fixture that senses the light, and the value of the sensed light. Based on this table, neighboring fixtures can be identified.
- the light intensity detection unitcan be used to construct G S2 , a graph similar to Graph G s1 .
- G S2a graph similar to Graph G s1 .
- sourcessuch as, Sunlight and so on
- FIG. 8is an exemplary embodiment of data generated by this setup.
- LCS_ID_SRCrepresent the sensor which is acting like a source and LCS_ID_DEST are the destination sensors.
- the column LIGHT_INTENSITY_DETECTED columnrepresents the light detected by LCS_ID_DEST.
- FIG. 10shows steps of a method of constructing a graph G S2 from data generated by a light intensity sensor unit, according to an embodiment.
- a first step 1010includes a controller retrieving the sensing light intensity data from memory.
- the light datais generated while controllably activating a single light associated with a fixture within an area. Other fixtures within the area receive the light, and sense an intensity of the received light.
- the retrieved sensed light intensityis processed to identify the fixture that includes the highest level of sensed light intensity.
- a second step 1020includes identifying the fixture that includes the highest level of sensed light intensity, and identifying this fixture as an immediate neighboring fixture of the fixture that generated the light that is being sensed.
- a processcan be initiated wherein a different one of the fixtures activates its light, and the sensed light intensity at all of the other of the fixtures is monitored. Through an iterative process, neighboring fixtures can be identified.
- a third step 1030includes constructing a graph G S2 , wherein the vertices of the graph include a light sensor of a fixture. Between each vertex, an edge weight is assigned that reflects a confidence in the placement of adjacent (neighboring) fixtures. For an embodiment, the confidence level is dependent on the relative value of the sensed light intensity. The greater the sensed value, the greater the confidence level.
- the graph G S2can be written to memory (step 1030 ).
- the process of FIG. 10provides an exemplary embodiment of algorithmically processing the light intensity data.
- the flow chartprovides for construction of G S2 from the light intensity data.
- LQI unitscan be used to construct G s3 graph similar to Graph G s2 . Referring to FIG. 5 , it can be concluded that a very high value of LQI between two fixtures implies that the fixtures are one degree close with high measure of confidence, irrespective of the noise factors involved in LQI readings. LQI unit can compute the LQI between two fixtures, compute LQI readings for all possible pairs of sensors (fixtures).
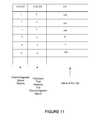
- FIG. 11shows an example of data generated by an LQI sensor unit, according to an embodiment. More specifically, the table includes a designation of the fixture that generates the electromagnetic signal, and then the fixtures that sense the electromagnetic signal, and a sensed LQI (Link Quality Indicator) of the received signal.
- the LQI of the fixture that receives electromagnetic signal having the greatest LQIis the fixture that has the best quality electromagnetic link. Typically, the fixture have the best electromagnetic link with the electromagnetic source, is the fixture that is closest to the fixture that generates the electromagnetic signal.
- FIG. 12shows steps of a method of constructing a graph G S3 from data generated by an LQI sensor unit, according to an embodiment.
- a first step 1210includes retrieving the sensed LQI data from memory.
- a second step 1220includes transmitting an electromagnetic signal by a one of a plurality of LQI units of the fixtures, and sensing LQI by the plurality of fixtures.
- the fixtures with the highest sensed LQIare determined to be the neighboring fixtures.
- a level of confidenceis determined by the value of the sensed LQI.
- the neighboring fixture having the largest LQIis assumed to be the fixture that is closest to the fixture that transmits the electromagnetic signal.
- a third step 1230includes constructing a graph G S3 wherein fixtures of the LQI sensors are assigned to vertices of the graph G S3 , an edge exists between two vertices if they are immediate neighbored and the edge weight is equal to the confidence measure.
- the graph G S3can be written to memory (step 1240 ).
- a weighted graph(sensor graph) that includes nodes, wherein each node represent LCS (lighting control sensor, which can include a sensor and/or a lighting fixture) and weights on the edges between the nodes that represent a measure of distance between nodes (G s ).
- the weighted graphis computed by algorithmically processing the sensing data sent by LCS's.
- a Graph G sis computed by synthesizing the 3 Distance Graphs G s1 , G s2 , G s3 generated from the data sent by Motion Detecting Unit, Light Intensity Detecting Unit and LQI unit, respectively. The commission is completed through inexactly matching of the graph G s (sensor graph) with a floor plan graph (G f ).
- FIG. 13is a flow chart that include steps of a method of constructing a compiled graph G S from the graphs G S1 , G S2 G S3 , according to an embodiment.
- a first step 1310includes retrieving the graphs G S1 , G S2 G S3 from memory.
- a second step 1320includes for each pair of fixtures, synthesizing the edge weights. As previously stated, the edge weights reflect a level of confidence in the pair being neighboring fixtures.
- a third step 1330includes constructing a compiled graph G S in which a fixture is located at vertices, and edges between the vertices include synthesized weights from each of the graphs G S1 , G S2 G S3 .
- the compiled graph G Scan be written to memory (step 1340 ).
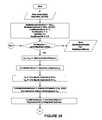
- FIG. 14is a flow chart that includes steps of a method of constructing the compiled graph G S using a synthesis function, according to an embodiment.
- multiple sensor graphs G S1 , G S2 G S3are generated based on the sensed signals.
- the generated graphsinclude nodes or vertices that represent the locations of the sensors, edges that include an estimated distance between the vertices, and a confidence value that represents a level of confidence in the accuracy of the estimated distance.
- the synthesized graph G Sis generated by according to the steps of the flow chart of FIG. 14 .
- a first step 1410includes reading the confidence levels of the plurality of sensor graphs at a particular vertex or node, such as, from sensor graphs G S1 , G S2 G S3 -A second step 1420 includes determining of any of the confidence levels are equal to 1. If yes, then the distance associated with the confidence level of 1 is used, and the confidence level of the synthesized distance estimate is set to 1 as well (step 1425 ).
- a third step 1430includes determining if any of 2 confidence levels are greater than 0.75. If yes, then the synthesized confidence level is set to 1 (step 1435 ).
- a fourth step 1440includes determining if any 2 confidence levels are greater than 0.50. If yes, then the synthesized confidence level is set to 0.75 (step 1445 ).
- a fifth step 1450includes determining if any 2 confidence levels are greater than 0.25. If yes, then the synthesized confidence level is set to 0.50 (step 1455 ).
- a sixth step 1460includes determining that all the confidence levels are 0. If yes, then the synthesized confidence level is set to 0 (step 1465 ). If all the confidence levels of step 1460 are not determined to be 0, then the synthesized confidence level is set to 0.25 (step 1470 ).
- FIG. 15is a flow chart that includes steps of a method of constructing a floor plan graph G f , according to an embodiment.
- a first step 1510includes reading a floor plan of the area.
- the floor planis an existing plan that includes the exact location of all the sensor/fixtures within an area. However, the floor plan does not include information of which sensor/fixture is in each location, just that a fixture/sensor is in the precise location(s).
- a second step 1520includes for each sensor/fixture, determining its immediate neighbor sensor/fixture using the (x,y) co-ordinates of the sensor/fixture.
- a third step 1530includes constructing a floor plan graph G f where vertices of the graph represent sensor/fixtures and an edge exists between immediate neighboring sensor/fixtures having a weight 1. That is, the exact location of each sensor/fixture can be determined from the floor plan, and a weight (confidence level) of one can be assigned for the distance between because the exact distances between each vertex (sensor/fixture location) is know from the floor plan.
- a fourth step 1540includes writing/storing the floor plan graph.
- the commissioning of the sensors/fixturesincludes matching the sensor graphs with the floor plan graph for determining which sensors are at which sensor location of the floor plan graph. This process provides a method of identifying which sensor/fixture is located at which sensor location.
- the floor plan graphincludes exact locations of the sensors within the structure, and matching includes placing each of the sensors based on the exact location of the sensors of the floor plan graph and information about the sensors of the sensor graph, wherein the information comprises the vertices and estimated distances between the vertices of the sensor graph.
- the first-degree neighbors of the vertices of the floor plan graphare known, the first-degree neighbors of the vertices of the sensor graph is estimated based on sensed signals of the sensor, and both the floor plan graph and the sensor graph include a same number of vertices.
- sensor graph and the floor plan graphare planar with bounded degree.
- the inexact graph matchingis performed by using customized branch and bound method optimized with respect to time and accuracy.
- the branch and bound(BB or B&B) is a general algorithm for finding optimal solutions of various optimization problems, especially in discrete and combinatorial optimization.
- a branch-and-bound algorithmconsists of a systematic enumeration of all candidate solutions, where large subsets of fruitless candidates are discarded en masse, by using upper and lower estimated bounds of the quantity being optimized.
- vertices of the sensor graphare matched with vertices of the floor plan graph that include a similar edge structure.
- an edge structureis determined based on a number of first degree neighboring vertices, and the similar edge structure is determined as vertices having a same number of first degree neighboring vertices.
- At least some embodimentsinclude identifying vertices of the floor plan graph that include unique characteristics, and matching vertices of the sensor graph that includes the unique characteristics.
- the unique characteristicsinclude, for example, a unique number of first degree neighbor nodes, and/or unique number of edges.
- At least some embodimentsinclude first matching vertices of the sensor graph that include confidence levels above a threshold, and subsequently matching vertices of the sensor graph that include confidence levels below the threshold.
- a measure of the confidence level of the vertexis a sum of the confidence levels of edges incident on that vertex.
- At least some embodimentsinclude identifying the vertices of the sensor graph that include the highest quality information about neighbors and confidence levels in the edge distances. Best matches identified and performed first, next lower quality matched performed next.
- the matchingincludes selecting a vertex of the floor plan graph to match a vertex of the sensor graph, wherein the degrees of the vertex of the floor plan graph and the degrees the vertex of the sensor graph are a maximum, and a difference between the degrees of the vertex of the floor plan graph and the vertex of the sensor graph are a minimum, and the vertex of the floor plan graph and the vertex of the sensor graph have not been previously matched, wherein the degrees reflects a number of neighboring vertices.
- a vertex V f1is selected from the floor plan graph and a vertex V s1 is selected from the sensor graph such that degrees of V f1 and V s1 are maximum, difference in degree of V f1 and V s1 is minimum and V f1 and V s1 have not been picked earlier.
- At least some embodimentsinclude scoring a quality of the matching based on at least one of a difference in a cardinality of an edge set of the floor plan graph and the sensor graph, cardinality of a vertex set of the floor plan graph and the sensor graph, and/or a measure of a dis-similarity in an edge structure of the floor plan graph and the sensor graph after the match.
- an error or quality estimate of the matchingincludes difference in the match score and ideal match score. The difference in number of edges between the floor plan graph and sensor graph gives a measure of the ideal match score.
- FIG. 16a floor plan graph according to an embodiment
- FIG. 17shows a sensor graph according to an embodiment.
- the vertices of the graphsrepresent sensor locations.
- the followingare exemplary steps for matching Graphs G 1 (Floor Plan Graph) and G 2 (Sensor Graph).
- the graph matching processinvolves mapping all Vertices from one graph to another such that a maximum number of edges are matched and there is minimum number of mismatch between edges.
- a first step (a)includes picking a Vertex from each graph such that they are similar and are have a maximum degree.
- a measure of similaritycan be degree of Vertex. For example in Graph 1 and Graph 2 there are many pairs of vertices which satisfy above criteria of selection. Vertex pair (X 16 , Y 16 ) is one such pair, (X 10 , Y 16 ) is another, (X 10 , Y 10 ) is another but not (X 22 , Y 22 ).
- a second step (b)includes assigning a cost to each Vertex match as sum of dissimilarity between Vertex.
- MatchScoreOf 1-degreeNeighbourerGraphs of (X 16 ,Y 16 ))is calculated by using step “c” defined below.
- a third step (c)includes computing a MatchScoreOf 1-degreeNeighbourerGraphs by executing following steps:
- a fourth step (d)includes picking up that vertex matched pair whose degree is maximum and the difference in degree in minimum from 1-degree neighboring vertices matched set. For example while matching (X 16 ,Y 16 ) the 1-degree neighboring vertices matched set was ((X 10 ,Y 10 ), (X 15 ,Y 15 ), (X 17 ,Y 17 ), (X 22 ,Y 22 )) and vertex pair (X 10 ,Y 10 ) satisfy the condition of maximum degree and minimum degree difference, so the next vertex pair which is matched is (X 10 ,Y 10 ).
- a fifth step (e)includes using step (b) to determine the cost of matching the new vertex pair found in step (d).
- a sixth step (f)includes repeating step (d) in finding the next pair of vertex match.
- a seventh step (g)includes repeating steps (b) to (d) until all vertices are matched.
- An eighth step (h)includes determining a cost of the Graph match which is the sum of cost of matching vertices.
- a ninth step (i)includes determining if
- ⁇⁇ (cardinality(Vertices of Graph)) then it's an acceptable match else restart the matching process by going to step “a”.
- FIGS. 18, 19, 20show steps of methods for analyzing and matching two un-weighted graphs with a maximum run time, and outputting a best match found between the two graphs and a score of the best match, according to at least some embodiments.
- FIGS. 21, 22, 23show steps of methods for finding a match between two one-degree neighboring graphs with a maximum run time, and outputting a score of the best match, according to at least some embodiments.
- FIGS. 24, 25show steps of methods of providing a best match between a pair of vertexes of two graphs in which matching of the graphs is already known, according to an embodiment.
Landscapes
- Circuit Arrangement For Electric Light Sources In General (AREA)
Abstract
Description
- 1. To start the match, pick up Vertex from each graph such that they are similar and are have a maximum degree. For an embodiment, a measure of similarity is a degree of the Vertex. For example if (X16, Y16) were matched then 1-degreeNeighbourerGraphs that are being matched are G1=(Vertices1=(X10, X15,X17,X22), Edges1=((X10,X15), (X10, X17), (X15, X22), (X17, X22))) and G2=(Vertices2=(Y10, Y15,Y17,Y22), Edges2=((Y10,Y15), (Y10,Y17))) and as per the condition described above match vertices (X10, Y10);
- 2. Assign cost to Vertex match as sum of dissimilarity between Vertex. A measure of dissimilarity can be difference in degree of matched vertices. For example if Vertex Pair (X10,Y10) are matched then the cost of Matching=(|degree of (X10)−degree (Y10)|)=(2−2)=0;
- 3. Next match the vertex pair which are similar and have maximum degree. A measure of similarity can be degree of Vertex. For example:—After (X10, Y10) are matched one can match (X15, Y15) and the cost of this match would be (1−0)=1;
- 4. MatchScore would be sum of cost of matches until now=(0+1)=1;
- 5. When there are no more vertices to be matched then the matching process stops and the MatchScoreOf 1-degreeNeighbourerGraphs is sum of cost of matched vertices;
- 6. If MatchScore is low enough value then it is acceptable Match. For example if |MatchScore−∥cardinality(Vertices1)−cardinality(Vertices2)|+|cardinality(Edges1)−cardinality(Edges1)|∥<=√min(cardinality(Vertices1), cardinality(Vertices2)) then it can be considered as low matchscore and matching process stops.
- 7. If Match is not good then one goes back to step “a” and restart the match process, until a match with acceptable low score is found.
Claims (27)
Priority Applications (1)
| Application Number | Priority Date | Filing Date | Title |
|---|---|---|---|
| US14/194,684US9807849B2 (en) | 2008-09-10 | 2014-03-01 | Automatically commissioning lighting controls using sensing parameters of the lighting controls |
Applications Claiming Priority (5)
| Application Number | Priority Date | Filing Date | Title |
|---|---|---|---|
| US19163608P | 2008-09-10 | 2008-09-10 | |
| US12/584,444US8457793B2 (en) | 2008-09-10 | 2009-09-05 | Intelligent lighting management and building control system |
| US12/874,331US8587225B2 (en) | 2009-09-05 | 2010-09-02 | Floor plan deduction using lighting control and sensing |
| US14/040,640US9575478B2 (en) | 2009-09-05 | 2013-09-28 | Configuring a set of devices of a structure |
| US14/194,684US9807849B2 (en) | 2008-09-10 | 2014-03-01 | Automatically commissioning lighting controls using sensing parameters of the lighting controls |
Related Parent Applications (1)
| Application Number | Title | Priority Date | Filing Date |
|---|---|---|---|
| US14/040,640Continuation-In-PartUS9575478B2 (en) | 2008-09-10 | 2013-09-28 | Configuring a set of devices of a structure |
Publications (2)
| Publication Number | Publication Date |
|---|---|
| US20140175990A1 US20140175990A1 (en) | 2014-06-26 |
| US9807849B2true US9807849B2 (en) | 2017-10-31 |
Family
ID=50973856
Family Applications (1)
| Application Number | Title | Priority Date | Filing Date |
|---|---|---|---|
| US14/194,684Active2032-01-11US9807849B2 (en) | 2008-09-10 | 2014-03-01 | Automatically commissioning lighting controls using sensing parameters of the lighting controls |
Country Status (1)
| Country | Link |
|---|---|
| US (1) | US9807849B2 (en) |
Cited By (4)
| Publication number | Priority date | Publication date | Assignee | Title |
|---|---|---|---|---|
| US10438471B2 (en)* | 2015-02-13 | 2019-10-08 | Chia-Teh Chen | Occupancy based lighting control technology and its application thereof |
| US20210194423A1 (en)* | 2019-06-18 | 2021-06-24 | Kabushiki Kaisha Toshiba | Electronic apparatus, method, and electronic system |
| US11102866B2 (en)* | 2016-05-30 | 2021-08-24 | Signify Holding B.V. | Illumination control |
| US11959994B2 (en) | 2019-06-18 | 2024-04-16 | Kabushiki Kaisha Toshiba | Electronic apparatus, method, and electronic system |
Families Citing this family (18)
| Publication number | Priority date | Publication date | Assignee | Title |
|---|---|---|---|---|
| JP5910824B2 (en)* | 2012-08-09 | 2016-04-27 | 東芝ライテック株式会社 | Lighting control system and lighting control method |
| US9671121B2 (en)* | 2014-02-19 | 2017-06-06 | Enlighted, Inc. | Motion tracking |
| EP3314987A4 (en)* | 2015-06-27 | 2019-01-30 | Gregory A.M. Brown | LUMINAIRES, SYSTEMS, AND METHODS OF OPERATING AND / OR CONTROLLING LUMINAIRES |
| US9618918B2 (en) | 2015-07-13 | 2017-04-11 | James Thomas O'Keeffe | System and method for estimating the number of people in a smart building |
| EP3332612B1 (en) | 2015-08-05 | 2019-12-11 | Lutron Technology Company LLC | Load control system responsive to the location of an occupant and/or mobile device |
| US10750598B2 (en)* | 2015-08-27 | 2020-08-18 | Signify Holding B.V. | Systems and methods for lighting fixture location mapping |
| US10681792B2 (en) | 2015-09-18 | 2020-06-09 | Signify Holding B.V. | Systems and methods for automatic lighting fixture location mapping |
| US11347192B2 (en)* | 2015-10-30 | 2022-05-31 | Signify Holding B.V. | Commissioning of a sensor system |
| US9961750B2 (en) | 2016-02-24 | 2018-05-01 | Leviton Manufacturing Co., Inc. | Advanced networked lighting control system including improved systems and methods for automated self-grouping of lighting fixtures |
| GB2553566B (en)* | 2016-09-09 | 2021-02-03 | Ambx Uk Ltd | Control of output devices |
| WO2018091279A1 (en)* | 2016-11-15 | 2018-05-24 | Philips Lighting Holding B.V. | Energy measurement for a lighting system |
| US10390183B2 (en) | 2017-02-24 | 2019-08-20 | Lsi Industries, Inc. | Light fixture positioning system that transmits beacon signals having different spatial resolutions |
| US20200020057A1 (en)* | 2017-03-03 | 2020-01-16 | Signify Holding B.V. | Data association under recommissioning |
| WO2018200647A1 (en) | 2017-04-26 | 2018-11-01 | Lsi Industries, Inc. | Electronic tag beacon |
| US9992838B1 (en)* | 2017-05-01 | 2018-06-05 | Gooee Limited | Automated luminaire identification and group assignment devices, systems, and methods using dimming function |
| US11825574B2 (en) | 2020-12-29 | 2023-11-21 | Crestron Electronics, Inc. | System and method of commissioning a building control system |
| CA3214201A1 (en)* | 2021-06-10 | 2022-12-15 | James Graham MCANANAMA | Lighting device groupings |
| CN117452834B (en)* | 2023-12-22 | 2024-03-19 | 北京天图设计工程有限公司 | Intelligent control system for LED illuminating lamp of museum |
Citations (70)
| Publication number | Priority date | Publication date | Assignee | Title |
|---|---|---|---|---|
| US5101141A (en) | 1987-12-08 | 1992-03-31 | Legrand Electric Limited | Lighting control |
| US5179324A (en) | 1991-01-21 | 1993-01-12 | Legrand | Dimmer with reduced filtering losses |
| US5191265A (en) | 1991-08-09 | 1993-03-02 | Lutron Electronics Co., Inc. | Wall mounted programmable modular control system |
| US5283516A (en) | 1993-02-24 | 1994-02-01 | Pass & Seymour Legrand | Low voltage dimmer with no load protection |
| US5812422A (en) | 1995-09-07 | 1998-09-22 | Philips Electronics North America Corporation | Computer software for optimizing energy efficiency of a lighting system for a target energy consumption level |
| US5841673A (en)* | 1995-01-30 | 1998-11-24 | Nec Corporation | System and method for processing graphic delay data of logic circuit to reduce topological redundancy |
| US5878407A (en)* | 1995-04-18 | 1999-03-02 | International Business Machines Corporation | Storage of a graph |
| US5896139A (en)* | 1996-08-01 | 1999-04-20 | Platinum Technology Ip, Inc. | System and method for optimizing a scene graph for optimizing rendering performance |
| US6057654A (en) | 1998-05-14 | 2000-05-02 | Legrand | Method and apparatus for automatically controlling a lighting load |
| US6161078A (en)* | 1998-09-21 | 2000-12-12 | Cadence Design Systems, Inc. | Efficient method for solving systems of discrete rotation and reflection constraints |
| US6188181B1 (en) | 1998-08-25 | 2001-02-13 | Lutron Electronics Co., Inc. | Lighting control system for different load types |
| US6342994B1 (en) | 1997-12-12 | 2002-01-29 | Legrand | Protective device against excessive currents, in particular for resettable protection of a controlled switch |
| US20020122003A1 (en)* | 2001-01-05 | 2002-09-05 | Patwari Neal K. | Method and apparatus for location estimation |
| US6548967B1 (en) | 1997-08-26 | 2003-04-15 | Color Kinetics, Inc. | Universal lighting network methods and systems |
| US20040002792A1 (en) | 2002-06-28 | 2004-01-01 | Encelium Technologies Inc. | Lighting energy management system and method |
| US20040077354A1 (en)* | 2002-10-21 | 2004-04-22 | Hong Kong Applied Science And Technology Research Institute Co. Ltd. | Systems and methods for managing wireless communications using link space information |
| US20050169643A1 (en) | 1997-01-02 | 2005-08-04 | Franklin Philip G. | Method and apparatus for the zonal transmission of data using building lighting fixtures |
| US20060039371A1 (en)* | 2004-08-19 | 2006-02-23 | Microsoft Corporation | Network routing |
| US20060056370A1 (en)* | 2003-07-18 | 2006-03-16 | Hancock Martin A | Data integrity in a mesh network |
| US20060168205A1 (en)* | 2005-01-24 | 2006-07-27 | Barron Gregory J | Network analysis system and method |
| US20070057807A1 (en) | 2005-09-12 | 2007-03-15 | Acuity Brands, Inc. | Activation device for an intelligent luminaire manager |
| US20070086128A1 (en) | 2004-09-28 | 2007-04-19 | Acuity Brands, Inc. | Equipment and methods for emergency lighting that provides brownout detection and protection |
| US20070177511A1 (en)* | 2006-02-02 | 2007-08-02 | Eaton Corporation | Ad-hoc network and method employing globally optimized routes for packets |
| US20070215794A1 (en) | 2006-03-15 | 2007-09-20 | Honeywell International, Inc. | Light sensor and light sensing method |
| US20070250212A1 (en)* | 2005-12-02 | 2007-10-25 | Halloran Michael J | Robot system |
| US7309985B2 (en) | 2003-04-23 | 2007-12-18 | Koninklijke Philips Electronics N. V. | Method of reconstructing an MR image |
| US20080071892A1 (en)* | 2006-09-14 | 2008-03-20 | Hitachi, Ltd. | Sensor net server to be connected to sensor node |
| US7348736B2 (en) | 2005-01-24 | 2008-03-25 | Philips Solid-State Lighting Solutions | Methods and apparatus for providing workspace lighting and facilitating workspace customization |
| US7382271B2 (en) | 2004-09-29 | 2008-06-03 | Siemens Building Technologies, Inc. | Automated position detection for wireless building automation devices |
| US20080153423A1 (en)* | 2006-12-20 | 2008-06-26 | Armstrong Brian S R | System and method for assessment of wireless communication performance |
| US20080152046A1 (en)* | 2006-12-20 | 2008-06-26 | Armstrong Brian S R | Synchronization system and method for wireless communicating nodes |
| US20080151761A1 (en)* | 2006-12-20 | 2008-06-26 | Theisen Peter J | System and method employing wireless communications and predetermined measurement functions of wireless nodes for assessing wireless communication performance |
| US20080151762A1 (en)* | 2006-12-20 | 2008-06-26 | Armstrong Brian S R | Packet sniffer node and system including the same to assess wireless communication performance |
| US20080185597A1 (en) | 2007-02-06 | 2008-08-07 | Universal Scientific Industrial Co., Ltd. | Light-emitting module |
| US20080244104A1 (en) | 2007-03-28 | 2008-10-02 | Johnson Controls Technology Company | Building automation system field devices and adapters |
| US7437596B2 (en) | 2004-10-05 | 2008-10-14 | Siemens Building Technologies, Inc. | Self-healing control network for building automation systems |
| US20080253608A1 (en)* | 2007-03-08 | 2008-10-16 | Long Richard G | Systems, Devices, and/or Methods for Managing Images |
| US20080253298A1 (en)* | 2007-04-13 | 2008-10-16 | Bhatti Ghulam M | Method and System for Managing Routes in a Wireless Network of Nodes |
| US20080265796A1 (en) | 2002-09-25 | 2008-10-30 | Jonathan Null | Light management system device and method |
| US20090026966A1 (en) | 2006-03-07 | 2009-01-29 | Koninklijke Philips Electronics N V | Lighting system with lighting units using optical communication |
| US7499515B1 (en)* | 2007-08-27 | 2009-03-03 | Harris Corporation | System and method for automated link quality measurement for adaptive modulation systems using noise level estimates |
| US20090156126A1 (en)* | 2006-04-03 | 2009-06-18 | Resonance Holdings Limited | Methods for determining proximity between radio frequency devices and controlling switches |
| US7550931B2 (en) | 2001-05-30 | 2009-06-23 | Philips Solid-State Lighting Solutions, Inc. | Controlled lighting methods and apparatus |
| US20090179596A1 (en) | 2006-05-11 | 2009-07-16 | Koninklijke Philips Electronics N V | Integrated lighting control module and power switch |
| US7566137B2 (en) | 2003-03-24 | 2009-07-28 | Lutron Electronics Co., Inc. | System to control daylight and electric light in a space |
| US20090228318A1 (en)* | 2008-03-06 | 2009-09-10 | Hitachi, Ltd. | Server and sensor net system for measuring quality of activity |
| US20090234538A1 (en)* | 2005-03-17 | 2009-09-17 | Nsk Ltd. | Method and apparatus for controlling electric power steering system |
| US7623042B2 (en) | 2005-03-14 | 2009-11-24 | Regents Of The University Of California | Wireless network control for building lighting system |
| US20100034386A1 (en) | 2008-08-06 | 2010-02-11 | Daintree Networks, Pty. Ltd. | Device manager repository |
| US20100191186A1 (en)* | 2007-12-31 | 2010-07-29 | Deka Products Limited Partnership | Split ring resonator antenna adapted for use in wirelessly controlled medical device |
| US7812543B2 (en) | 2006-11-15 | 2010-10-12 | Budike Jr Lothar E S | Modular wireless lighting control system using a common ballast control interface |
| US20100264846A1 (en) | 2008-04-14 | 2010-10-21 | Digital Lumens, Inc. | Power Management Unit with Adaptive Dimming |
| US20100270933A1 (en) | 2008-04-14 | 2010-10-28 | Digital Lumens, Inc. | Power Management Unit with Power Metering |
| US20100280677A1 (en) | 2009-05-04 | 2010-11-04 | Budike Jr Lothar E S | Lighting and energy control system and modules |
| US20100295482A1 (en) | 2009-04-14 | 2010-11-25 | Digital Lumens, Inc. | Power Management Unit with Multi-Input Arbitration |
| US20100301777A1 (en) | 2007-09-07 | 2010-12-02 | Regine Kraemer | Method and Device For Adjusting the Color or Photometric Properties of an Led Illumination Device |
| US20110031897A1 (en) | 2009-08-10 | 2011-02-10 | Redwood Systems, Inc. | Lighting systems and methods of auto-commissioning |
| US7925384B2 (en) | 2008-06-02 | 2011-04-12 | Adura Technologies, Inc. | Location-based provisioning of wireless control systems |
| US20110199020A1 (en) | 2010-02-18 | 2011-08-18 | Redwood Systems, Inc. | Methods of commissioning lighting systems |
| US8085672B2 (en)* | 2005-01-28 | 2011-12-27 | Honeywell International Inc. | Wireless routing implementation |
| US20130006899A1 (en) | 2011-07-01 | 2013-01-03 | Wsu Research Foundation | Activity Recognition in Multi-Entity Environments |
| US8457793B2 (en)* | 2008-09-10 | 2013-06-04 | Enlighted, Inc. | Intelligent lighting management and building control system |
| US20130227114A1 (en)* | 2012-02-28 | 2013-08-29 | Cisco Technology, Inc. | Hierarchical schema to provide an aggregated view of device capabilities in a network |
| US8587225B2 (en)* | 2009-09-05 | 2013-11-19 | Enlighted, Inc. | Floor plan deduction using lighting control and sensing |
| US20140031987A1 (en)* | 2009-09-05 | 2014-01-30 | Enlighted, Inc. | Configuring a set of devices of a structure |
| US20140126426A1 (en)* | 2012-11-05 | 2014-05-08 | Cisco Technology, Inc. | Mintree-based routing in highly constrained networks |
| US20140222213A1 (en)* | 2009-09-05 | 2014-08-07 | Enlighted, Inc. | Configuring a plurality of sensor devices of a structure |
| US20140328211A1 (en)* | 2011-08-18 | 2014-11-06 | Tridonic Gmgh & Co Kg | Analysis and address allocation of wireless building networks |
| US20150177716A1 (en) | 2013-12-20 | 2015-06-25 | Enlighted, Inc. | Occupancy detection |
| US20150234366A1 (en) | 2014-02-19 | 2015-08-20 | Enlighted, Inc. | Motion tracking |
- 2014
- 2014-03-01USUS14/194,684patent/US9807849B2/enactiveActive
Patent Citations (76)
| Publication number | Priority date | Publication date | Assignee | Title |
|---|---|---|---|---|
| US5101141A (en) | 1987-12-08 | 1992-03-31 | Legrand Electric Limited | Lighting control |
| US5179324A (en) | 1991-01-21 | 1993-01-12 | Legrand | Dimmer with reduced filtering losses |
| US5191265A (en) | 1991-08-09 | 1993-03-02 | Lutron Electronics Co., Inc. | Wall mounted programmable modular control system |
| US5283516A (en) | 1993-02-24 | 1994-02-01 | Pass & Seymour Legrand | Low voltage dimmer with no load protection |
| US5841673A (en)* | 1995-01-30 | 1998-11-24 | Nec Corporation | System and method for processing graphic delay data of logic circuit to reduce topological redundancy |
| US5878407A (en)* | 1995-04-18 | 1999-03-02 | International Business Machines Corporation | Storage of a graph |
| US5812422A (en) | 1995-09-07 | 1998-09-22 | Philips Electronics North America Corporation | Computer software for optimizing energy efficiency of a lighting system for a target energy consumption level |
| US5896139A (en)* | 1996-08-01 | 1999-04-20 | Platinum Technology Ip, Inc. | System and method for optimizing a scene graph for optimizing rendering performance |
| US20060275040A1 (en) | 1997-01-02 | 2006-12-07 | Franklin Philip G | Method and apparatus for the zonal transmission of data using building lighting fixtures |
| US20050169643A1 (en) | 1997-01-02 | 2005-08-04 | Franklin Philip G. | Method and apparatus for the zonal transmission of data using building lighting fixtures |
| US6548967B1 (en) | 1997-08-26 | 2003-04-15 | Color Kinetics, Inc. | Universal lighting network methods and systems |
| US6342994B1 (en) | 1997-12-12 | 2002-01-29 | Legrand | Protective device against excessive currents, in particular for resettable protection of a controlled switch |
| US6057654A (en) | 1998-05-14 | 2000-05-02 | Legrand | Method and apparatus for automatically controlling a lighting load |
| US6188181B1 (en) | 1998-08-25 | 2001-02-13 | Lutron Electronics Co., Inc. | Lighting control system for different load types |
| US6161078A (en)* | 1998-09-21 | 2000-12-12 | Cadence Design Systems, Inc. | Efficient method for solving systems of discrete rotation and reflection constraints |
| US20020122003A1 (en)* | 2001-01-05 | 2002-09-05 | Patwari Neal K. | Method and apparatus for location estimation |
| US7550931B2 (en) | 2001-05-30 | 2009-06-23 | Philips Solid-State Lighting Solutions, Inc. | Controlled lighting methods and apparatus |
| US20040002792A1 (en) | 2002-06-28 | 2004-01-01 | Encelium Technologies Inc. | Lighting energy management system and method |
| US20070061050A1 (en) | 2002-06-28 | 2007-03-15 | Encelium Technologies Inc. | Lighting energy management system and method |
| US20080265796A1 (en) | 2002-09-25 | 2008-10-30 | Jonathan Null | Light management system device and method |
| US20040077354A1 (en)* | 2002-10-21 | 2004-04-22 | Hong Kong Applied Science And Technology Research Institute Co. Ltd. | Systems and methods for managing wireless communications using link space information |
| US7566137B2 (en) | 2003-03-24 | 2009-07-28 | Lutron Electronics Co., Inc. | System to control daylight and electric light in a space |
| US7309985B2 (en) | 2003-04-23 | 2007-12-18 | Koninklijke Philips Electronics N. V. | Method of reconstructing an MR image |
| US20060056370A1 (en)* | 2003-07-18 | 2006-03-16 | Hancock Martin A | Data integrity in a mesh network |
| US20060039371A1 (en)* | 2004-08-19 | 2006-02-23 | Microsoft Corporation | Network routing |
| US20070086128A1 (en) | 2004-09-28 | 2007-04-19 | Acuity Brands, Inc. | Equipment and methods for emergency lighting that provides brownout detection and protection |
| US20090195161A1 (en) | 2004-09-28 | 2009-08-06 | Acuity Brands, Inc. | Equipment and methods for emergency lighting that provides brownout detection and protection |
| US7382271B2 (en) | 2004-09-29 | 2008-06-03 | Siemens Building Technologies, Inc. | Automated position detection for wireless building automation devices |
| US7437596B2 (en) | 2004-10-05 | 2008-10-14 | Siemens Building Technologies, Inc. | Self-healing control network for building automation systems |
| US20100135186A1 (en) | 2005-01-24 | 2010-06-03 | Daintree Networks, Pty. Ltd. | Network Analysis System and Method |
| US7792956B2 (en) | 2005-01-24 | 2010-09-07 | Daintree Networks, Pty. Ltd. | Network analysis system and method |
| US7348736B2 (en) | 2005-01-24 | 2008-03-25 | Philips Solid-State Lighting Solutions | Methods and apparatus for providing workspace lighting and facilitating workspace customization |
| US20060168205A1 (en)* | 2005-01-24 | 2006-07-27 | Barron Gregory J | Network analysis system and method |
| US8085672B2 (en)* | 2005-01-28 | 2011-12-27 | Honeywell International Inc. | Wireless routing implementation |
| US7623042B2 (en) | 2005-03-14 | 2009-11-24 | Regents Of The University Of California | Wireless network control for building lighting system |
| US20090234538A1 (en)* | 2005-03-17 | 2009-09-17 | Nsk Ltd. | Method and apparatus for controlling electric power steering system |
| US20070057807A1 (en) | 2005-09-12 | 2007-03-15 | Acuity Brands, Inc. | Activation device for an intelligent luminaire manager |
| US20070250212A1 (en)* | 2005-12-02 | 2007-10-25 | Halloran Michael J | Robot system |
| US20070177511A1 (en)* | 2006-02-02 | 2007-08-02 | Eaton Corporation | Ad-hoc network and method employing globally optimized routes for packets |
| US20090026966A1 (en) | 2006-03-07 | 2009-01-29 | Koninklijke Philips Electronics N V | Lighting system with lighting units using optical communication |
| US20070215794A1 (en) | 2006-03-15 | 2007-09-20 | Honeywell International, Inc. | Light sensor and light sensing method |
| US20090156126A1 (en)* | 2006-04-03 | 2009-06-18 | Resonance Holdings Limited | Methods for determining proximity between radio frequency devices and controlling switches |
| US20090179596A1 (en) | 2006-05-11 | 2009-07-16 | Koninklijke Philips Electronics N V | Integrated lighting control module and power switch |
| US20080071892A1 (en)* | 2006-09-14 | 2008-03-20 | Hitachi, Ltd. | Sensor net server to be connected to sensor node |
| US7812543B2 (en) | 2006-11-15 | 2010-10-12 | Budike Jr Lothar E S | Modular wireless lighting control system using a common ballast control interface |
| US20080151762A1 (en)* | 2006-12-20 | 2008-06-26 | Armstrong Brian S R | Packet sniffer node and system including the same to assess wireless communication performance |
| US20080153423A1 (en)* | 2006-12-20 | 2008-06-26 | Armstrong Brian S R | System and method for assessment of wireless communication performance |
| US20080152046A1 (en)* | 2006-12-20 | 2008-06-26 | Armstrong Brian S R | Synchronization system and method for wireless communicating nodes |
| US20080151761A1 (en)* | 2006-12-20 | 2008-06-26 | Theisen Peter J | System and method employing wireless communications and predetermined measurement functions of wireless nodes for assessing wireless communication performance |
| US20080185597A1 (en) | 2007-02-06 | 2008-08-07 | Universal Scientific Industrial Co., Ltd. | Light-emitting module |
| US20080253608A1 (en)* | 2007-03-08 | 2008-10-16 | Long Richard G | Systems, Devices, and/or Methods for Managing Images |
| US20080244104A1 (en) | 2007-03-28 | 2008-10-02 | Johnson Controls Technology Company | Building automation system field devices and adapters |
| US20080253298A1 (en)* | 2007-04-13 | 2008-10-16 | Bhatti Ghulam M | Method and System for Managing Routes in a Wireless Network of Nodes |
| US7499515B1 (en)* | 2007-08-27 | 2009-03-03 | Harris Corporation | System and method for automated link quality measurement for adaptive modulation systems using noise level estimates |
| US20100301777A1 (en) | 2007-09-07 | 2010-12-02 | Regine Kraemer | Method and Device For Adjusting the Color or Photometric Properties of an Led Illumination Device |
| US20100191186A1 (en)* | 2007-12-31 | 2010-07-29 | Deka Products Limited Partnership | Split ring resonator antenna adapted for use in wirelessly controlled medical device |
| US20090228318A1 (en)* | 2008-03-06 | 2009-09-10 | Hitachi, Ltd. | Server and sensor net system for measuring quality of activity |
| US20100264846A1 (en) | 2008-04-14 | 2010-10-21 | Digital Lumens, Inc. | Power Management Unit with Adaptive Dimming |
| US20100270933A1 (en) | 2008-04-14 | 2010-10-28 | Digital Lumens, Inc. | Power Management Unit with Power Metering |
| US7925384B2 (en) | 2008-06-02 | 2011-04-12 | Adura Technologies, Inc. | Location-based provisioning of wireless control systems |
| US20100034386A1 (en) | 2008-08-06 | 2010-02-11 | Daintree Networks, Pty. Ltd. | Device manager repository |
| US8457793B2 (en)* | 2008-09-10 | 2013-06-04 | Enlighted, Inc. | Intelligent lighting management and building control system |
| US20100295482A1 (en) | 2009-04-14 | 2010-11-25 | Digital Lumens, Inc. | Power Management Unit with Multi-Input Arbitration |
| US20100280677A1 (en) | 2009-05-04 | 2010-11-04 | Budike Jr Lothar E S | Lighting and energy control system and modules |
| US20110031897A1 (en) | 2009-08-10 | 2011-02-10 | Redwood Systems, Inc. | Lighting systems and methods of auto-commissioning |
| US20140031987A1 (en)* | 2009-09-05 | 2014-01-30 | Enlighted, Inc. | Configuring a set of devices of a structure |
| US8587225B2 (en)* | 2009-09-05 | 2013-11-19 | Enlighted, Inc. | Floor plan deduction using lighting control and sensing |
| US20140222213A1 (en)* | 2009-09-05 | 2014-08-07 | Enlighted, Inc. | Configuring a plurality of sensor devices of a structure |
| US20110199020A1 (en) | 2010-02-18 | 2011-08-18 | Redwood Systems, Inc. | Methods of commissioning lighting systems |
| US20130006899A1 (en) | 2011-07-01 | 2013-01-03 | Wsu Research Foundation | Activity Recognition in Multi-Entity Environments |
| US20140328211A1 (en)* | 2011-08-18 | 2014-11-06 | Tridonic Gmgh & Co Kg | Analysis and address allocation of wireless building networks |
| US20170164320A1 (en)* | 2011-08-18 | 2017-06-08 | Tridonic Gmbh & Co Kg | Analysis and address allocation of wireless building networks |
| US20130227114A1 (en)* | 2012-02-28 | 2013-08-29 | Cisco Technology, Inc. | Hierarchical schema to provide an aggregated view of device capabilities in a network |
| US20140126426A1 (en)* | 2012-11-05 | 2014-05-08 | Cisco Technology, Inc. | Mintree-based routing in highly constrained networks |
| US20150177716A1 (en) | 2013-12-20 | 2015-06-25 | Enlighted, Inc. | Occupancy detection |
| US20150234366A1 (en) | 2014-02-19 | 2015-08-20 | Enlighted, Inc. | Motion tracking |
Non-Patent Citations (2)
| Title |
|---|
| A. H. Land and A. G. Doig (1960). "An automatic method of solving discrete programming problems". Econometrica 28 (3). pp. 497-520. doi:10.2307/1910129. |
| Gupta, V., "Distributed Estimation and Control in Networked Systems", Aug. 2006, Doctor of Philosophy Dissertation, California Institute of Technology, p. 1-254.* |
Cited By (5)
| Publication number | Priority date | Publication date | Assignee | Title |
|---|---|---|---|---|
| US10438471B2 (en)* | 2015-02-13 | 2019-10-08 | Chia-Teh Chen | Occupancy based lighting control technology and its application thereof |
| US11102866B2 (en)* | 2016-05-30 | 2021-08-24 | Signify Holding B.V. | Illumination control |
| US20210194423A1 (en)* | 2019-06-18 | 2021-06-24 | Kabushiki Kaisha Toshiba | Electronic apparatus, method, and electronic system |
| US11959994B2 (en) | 2019-06-18 | 2024-04-16 | Kabushiki Kaisha Toshiba | Electronic apparatus, method, and electronic system |
| US12028018B2 (en)* | 2019-06-18 | 2024-07-02 | Kabushiki Kaisha Toshiba | Electronic apparatus for determining correspondence between devices and positions at which devices are located using propagation characteristic of wireless communication between devices, and method, and electronic system for same |
Also Published As
| Publication number | Publication date |
|---|---|
| US20140175990A1 (en) | 2014-06-26 |
Similar Documents
| Publication | Publication Date | Title |
|---|---|---|
| US9807849B2 (en) | Automatically commissioning lighting controls using sensing parameters of the lighting controls | |
| CN108141943B (en) | System and method for automated lighting fixture position mapping | |
| KR101298563B1 (en) | Wireless building management system and managing methods for a building | |
| KR102475642B1 (en) | Electronic device for controlling air conditioning thereof | |
| US8587225B2 (en) | Floor plan deduction using lighting control and sensing | |
| KR20070095712A (en) | Indoor Environment Management System and Indoor Environment Management Method Using the Same | |
| EP3342257B1 (en) | Systems and methods for lighting fixture location mapping | |
| CN116366656B (en) | Method and system for forming a device network | |
| CN103875215A (en) | Commissioning of lighting systems | |
| WO2006095317A1 (en) | Commissioning wireless network devices according to an installation plan | |
| CN109791191A (en) | Beacon verifies equipment | |
| WO2018158185A1 (en) | Detecting recommissioning | |
| JP6624780B2 (en) | Positioning method, server and program | |
| KR20230026273A (en) | Method and system for commissioning environmental sensors | |
| US9961737B2 (en) | System, information process apparatus and information processing method | |
| JP5760873B2 (en) | Data generating apparatus, method and program | |
| JP2017108334A (en) | Control device, device control system and program | |
| WO2018203234A1 (en) | Automated luminaire identification and group assignment | |
| CN110383953A (en) | Data association under re-debugging | |
| JP3858827B2 (en) | Information management system | |
| CN110691116A (en) | Method, positioning device and system for managing network devices | |
| JP7007702B2 (en) | Light emitting device and light emitting life data management system | |
| WO2022181043A1 (en) | Stay location proposal system, stay location proposal method, and program | |
| EP4139708A1 (en) | Autonomous room boundary detection and classification with low resolution sensors | |
| WO2020180432A1 (en) | Drone-assisted commissioning of indoor positioning system for light fixtures |
Legal Events
| Date | Code | Title | Description |
|---|---|---|---|
| AS | Assignment | Owner name:ENLIGHTED, INC., CALIFORNIA Free format text:ASSIGNMENT OF ASSIGNORS INTEREST;ASSIGNORS:BHATKAR, ANUP;MOHAN, TANUJ;ASHAR, PREMAL;REEL/FRAME:032330/0425 Effective date:20140224 | |
| AS | Assignment | Owner name:PACIFIC WESTERN BANK, NORTH CAROLINA Free format text:SECURITY INTEREST;ASSIGNOR:ENLIGHTED, INC.;REEL/FRAME:037631/0651 Effective date:20160122 | |
| STCF | Information on status: patent grant | Free format text:PATENTED CASE | |
| FEPP | Fee payment procedure | Free format text:ENTITY STATUS SET TO UNDISCOUNTED (ORIGINAL EVENT CODE: BIG.); ENTITY STATUS OF PATENT OWNER: LARGE ENTITY | |
| MAFP | Maintenance fee payment | Free format text:PAYMENT OF MAINTENANCE FEE, 4TH YEAR, LARGE ENTITY (ORIGINAL EVENT CODE: M1551); ENTITY STATUS OF PATENT OWNER: LARGE ENTITY Year of fee payment:4 | |
| AS | Assignment | Owner name:BUILDING ROBOTICS, INC., CALIFORNIA Free format text:MERGER;ASSIGNOR:ENLIGHTED, INC.;REEL/FRAME:057883/0238 Effective date:20210929 | |
| MAFP | Maintenance fee payment | Free format text:PAYMENT OF MAINTENANCE FEE, 8TH YEAR, LARGE ENTITY (ORIGINAL EVENT CODE: M1552); ENTITY STATUS OF PATENT OWNER: LARGE ENTITY Year of fee payment:8 |