US9784707B2 - System and method for measuring an analyte in a sample - Google Patents
System and method for measuring an analyte in a sampleDownload PDFInfo
- Publication number
- US9784707B2 US9784707B2US13/620,448US201213620448AUS9784707B2US 9784707 B2US9784707 B2US 9784707B2US 201213620448 AUS201213620448 AUS 201213620448AUS 9784707 B2US9784707 B2US 9784707B2
- Authority
- US
- United States
- Prior art keywords
- test
- electrode
- voltage
- sample
- current
- Prior art date
- Legal status (The legal status is an assumption and is not a legal conclusion. Google has not performed a legal analysis and makes no representation as to the accuracy of the status listed.)
- Active
Links
Images


Classifications
- G—PHYSICS
- G01—MEASURING; TESTING
- G01N—INVESTIGATING OR ANALYSING MATERIALS BY DETERMINING THEIR CHEMICAL OR PHYSICAL PROPERTIES
- G01N27/00—Investigating or analysing materials by the use of electric, electrochemical, or magnetic means
- G01N27/26—Investigating or analysing materials by the use of electric, electrochemical, or magnetic means by investigating electrochemical variables; by using electrolysis or electrophoresis
- G01N27/28—Electrolytic cell components
- G01N27/30—Electrodes, e.g. test electrodes; Half-cells
- G01N27/327—Biochemical electrodes, e.g. electrical or mechanical details for in vitro measurements
- G01N27/3271—Amperometric enzyme electrodes for analytes in body fluids, e.g. glucose in blood
- G01N27/3274—Corrective measures, e.g. error detection, compensation for temperature or hematocrit, calibration
Definitions
- the present disclosurerelates to methods and systems for determining analyte concentration of a sample.
- Analyte detection in physiological fluidsis of ever increasing importance to today's society.
- Analyte detection assaysfind use in a variety of applications, including clinical laboratory testing, home testing, etc., where the results of such testing play a prominent role in diagnosis and management in a variety of disease conditions.
- Analytes of interestinclude glucose for diabetes management, cholesterol, and the like.
- analyte detection protocols and devices for both clinical and home usehave been developed.
- an electrochemical methodOne type of method that is employed for analyte detection is an electrochemical method.
- an aqueous liquid sampleis placed into a sample-receiving chamber in an electrochemical cell that includes two electrodes, e.g., a counter and working electrode.
- the analyteis allowed to react with a redox reagent to form an oxidizable (or reducible) substance in an amount corresponding to the analyte concentration.
- the quantity of the oxidizable (or reducible) substance presentis then estimated electrochemically and related to the amount of analyte present in the initial sample.
- Such systemsare susceptible to various modes of inefficiency and/or error. For example, variations in temperatures can affect the results of the method. This is especially relevant when the method is carried out in an uncontrolled environment, as is often the case in home applications or in third world countries. Errors can also occur when the sample size is insufficient to get an accurate result. Partially filled test strips can potentially give an inaccurate result because the measured test currents are proportional to the area of the working electrode that is wetted with sample. Thus, partially filled test strips can under certain conditions provide a glucose concentration that is negatively biased. A user can have difficulty determining whether an electrode area of a test strip is completely covered by a sample.
- test stripsincluding the ones described herein, have a relatively small volume ( ⁇ one microliter) making it difficult for a user to see and judge whether there is a small area of an electrode that is unwetted. This can especially be a problem for people with diabetes that often have poor visual acuity.
- the methodaccounts for temperature variation and includes applying a sample to a test strip and applying a first test voltage for a first time interval between a first electrode and a second electrode sufficient to oxidize a reduced mediator at the second electrode.
- a second test voltagecan be applied for a second time interval between the first electrode and the second electrode that is also sufficient to oxidize the reduced mediator at the first electrode.
- a first glucose concentrationcan be calculated based on the test current values during the first time interval and the second time interval.
- the test metercan measure a temperature value. Accordingly, a temperature corrected glucose concentration can be calculated based on the first glucose concentration and the temperature value.
- the methodis configured to determine whether a test strip is sufficiently filled with a sample.
- the methodincludes applying a first test voltage between a first electrode and a second electrode of a test strip.
- the first test voltagecan have both an AC voltage component and a DC voltage component.
- the AC voltage componentcan be applied at a predetermined amount of time after the application of the first test voltage.
- the DC voltage componentcan have a magnitude sufficient to cause a limiting test current at the second electrode. Accordingly, a portion of the resulting test current from the AC voltage component can be processed into a capacitance value.
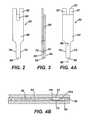
- FIG. 1Ais a perspective view of a test strip
- FIG. 1Bis an exploded perspective view of the test strip of FIG. 1A ;
- FIG. 1Cis a perspective view of a distal portion of the test strip of FIG. 1A ;
- FIG. 2is a bottom plan view of the test strip of FIG. 1A ;
- FIG. 3is a side plan view of the test strip of FIG. 1A ;
- FIG. 4Ais a top plan view of the test strip of FIG. 1A ;
- FIG. 4Bis a partial side view of the distal portion of the test strip consistent with arrows 4 B- 4 B of FIG. 4A ;
- FIG. 5is a simplified schematic showing a test meter electrically interfacing with the test strip contact pads
- FIG. 6shows a test voltage waveform in which the test meter applies a plurality of test voltages for prescribed time intervals
- FIG. 7shows a test current transient generated with the test voltage waveform of FIG. 6 ;
- FIG. 8is a flow diagram showing an embodiment of a method of determining a glucose concentration
- FIG. 9is a flow diagram showing an exemplary embodiment of a blood glucose algorithm and a hematocrit correction
- FIG. 10is a chart showing a correlation between measured hematocrit levels using a reference method and measured hematocrit levels using the test strip of FIG. 1 ;
- FIG. 11is a bias plot showing a plurality of test strips that were tested with blood samples having a wide range of hematocrit levels
- FIG. 12is a flow diagram showing an embodiment of a method of applying a temperature correction when a sample is blood
- FIG. 13is a bias plot showing a plurality of test strips that were tested with blood samples having a wide range of hematocrit levels, a wide range of glucose levels, and a wide range of temperature levels without temperature correction;
- FIG. 14is a bias plot showing a plurality of test strips that were tested with blood samples having a wide range of hematocrit levels, a wide range of glucose levels, and a wide range of temperature levels with temperature correction;
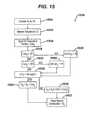
- FIG. 15is a flow diagram showing an embodiment of a method of applying a temperature correction when a sample is control solution
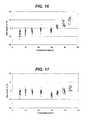
- FIG. 16is a bias plot showing a plurality of test strips that were tested with control solution samples having a wide range of glucose levels and a wide range of temperature levels without temperature correction;
- FIG. 17is a bias plot showing a plurality of test strips that were tested with control solution samples having a wide range of glucose levels and a wide range of temperature levels with temperature correction;
- FIG. 18is a flow diagram depicting an embodiment of a method of identifying system errors
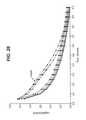
- FIG. 19is a chart showing a correlation of capacitance and bias to a reference glucose measurement (YSI, Yellow Springs Instrument) where capacitance values were measured for blood samples during the third test voltage of FIG. 6 ;
- FIG. 20is a chart showing a correlation of capacitance and bias to a reference glucose measurement (YSI, Yellow Springs Instrument) where capacitance values were measured for blood samples during the second test voltage of FIG. 6 (e.g., after approximately 1.3 seconds);
- YSIYellow Springs Instrument
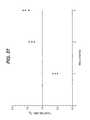
- FIG. 21is a chart showing a correlation of capacitance and bias to a reference glucose measurement (YSI, Yellow Springs Instrument) where capacitance values were measured for control solution samples during the second test voltage of FIG. 6 (e.g., after approximately 1.3 seconds);
- YSIYellow Springs Instrument
- FIG. 22shows a test current transient of the second test time interval when a user performs a double dose (solid line) and does not perform a double dose (dotted line);
- FIG. 23shows a test current transient of the second test time interval when a late start error occurs (solid line) and does not occur (dotted line) with the test meter;
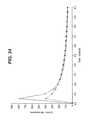
- FIG. 24shows a test current transient of the third test time interval for a test strip having a high resistance track (squares) and a low resistance track (triangles);
- FIG. 25is a chart showing a plurality of ratio values indicating that a high resistance test strip lot can be distinguished from a low resistance test strip lot;
- FIG. 26shows a plurality of test current transients for a test strip lot having leakage between a spacer and the first electrode (squares) and for test strip lots having a sufficiently low amount of leakage (circles and triangles);
- FIG. 27is a chart showing a plurality of ratio values for identifying leakage of liquid for test strip lots prepared with different manufacturing conditions.
- a glucose test systembased on a thin-layer cell design with opposing electrodes and tri-pulse electrochemical detection that is fast (e.g., about 5 second analysis time), requires a small sample (e.g., about 0.4 ⁇ L), and can provide improved reliability and accuracy of blood glucose measurements.
- glucose in the samplecan be oxidized to gluconolactone using glucose dehydrogenase and an electrochemically active mediator can be used to shuttle electrons from the enzyme to a palladium working electrode.
- a potentiostatcan be utilized to apply a tri-pulse potential waveform to the working and counter electrodes, resulting in test current transients used to calculate the glucose concentration. Further, additional information gained from the test current transients may be used to discriminate between sample matrices and correct for variability in blood samples due to hematocrit, temperature variation, electrochemically active components, and identify possible system errors.
- an electrochemical cellcan be in the form of a test strip.
- the test stripmay include two opposing electrodes separated by a thin spacer for defining a sample-receiving chamber or zone in which a reagent layer is located.
- test stripsincluding, for example, test strips with co-planar electrodes may also be used with the methods described herein.
- FIGS. 1A to 4Bshow various views of an exemplary test strip 62 suitable for use with the methods and systems described herein.
- a test strip 62is provided which includes an elongate body extending from a distal end 80 to a proximal end 82 , and having lateral edges 56 , 58 , as illustrated in FIG. 1A .
- the test strip 62also includes a first electrode layer 66 , a second electrode layer 64 , and a spacer 60 sandwiched in between the two electrode layers 64 and 66 .
- the first electrode layer 66can include a first electrode 166 , a first connection track 76 , and a first contact pad 67 , where the first connection track 76 electrically connects the first electrode 166 to the first contact pad 67 , as shown in FIGS. 1B and 4B .
- the first electrode 166is a portion of the first electrode layer 66 that is immediately underneath the reagent layer 72 , as indicated by FIGS. 1B and 4B .
- the second electrode layer 64can include a second electrode 164 , a second connection track 78 , and a second contact pad 63 , where the second connection track 78 electrically connects the second electrode 164 with the second contact pad 63 , as shown in FIGS. 1B, 2, and 4B .
- the second electrode 164is a portion of the second electrode layer 64 that is above the reagent layer 72 , as indicated by FIG. 4B .
- the sample-receiving chamber 61is defined by the first electrode 166 , the second electrode 164 , and the spacer 60 near the distal end 80 of the test strip 62 , as shown in FIGS. 1B and 4B .
- the first electrode 166 and the second electrode 164can define the bottom and the top of sample-receiving chamber 61 , respectively, as illustrated in FIG. 4B .
- a cutout area 68 of the spacer 60can define the sidewalls of the sample-receiving chamber 61 , as illustrated in FIG. 4B .
- the sample-receiving chamber 61can include ports 70 that provide a sample inlet and/or a vent, as shown in FIGS. 1A to 1C .
- one of the portscan allow a fluid sample to ingress and the other port can allow air to egress.
- the sample-receiving chamber 61can have a small volume.
- the chamber 61can have a volume in the range of from about 0.1 microliters to about 5 microliters, about 0.2 microliters to about 3 microliters, or, preferably, about 0.3 microliters to about 1 microliter.
- the cutout 68can have an area ranging from about 0.01 cm 2 to about 0.2 cm 2 , about 0.02 cm 2 to about 0.15 cm 2 , or, preferably, about 0.03 cm 2 to about 0.08 cm 2 .
- first electrode 166 and second electrode 164can be spaced apart in the range of about 1 micron to about 500 microns, preferably between about 10 microns and about 400 microns, and more preferably between about 40 microns and about 200 microns.
- the relatively close spacing of the electrodescan also allow redox cycling to occur, where oxidized mediator generated at first electrode 166 , can diffuse to second electrode 164 to become reduced, and subsequently diffuse back to first electrode 166 to become oxidized again.
- oxidized mediator generated at first electrode 166can diffuse to second electrode 164 to become reduced, and subsequently diffuse back to first electrode 166 to become oxidized again.
- the first electrode layer 66 and the second electrode layer 64can be a conductive material formed from materials such as gold, palladium, carbon, silver, platinum, tin oxide, iridium, indium, or combinations thereof (e.g., indium doped tin oxide).
- the electrodescan be formed by disposing a conductive material onto an insulating sheet (not shown) by a sputtering, electroless plating, or a screen-printing process.
- the first electrode layer 66 and the second electrode layer 64can be made from sputtered palladium and sputtered gold, respectively.
- Suitable materials that can be employed as spacer 60include a variety of insulating materials, such as, for example, plastics (e.g., PET, PETG, polyimide, polycarbonate, polystyrene), silicon, ceramic, glass, adhesives, and combinations thereof.
- the spacer 60may be in the form of a double sided adhesive coated on opposing sides of a polyester sheet where the adhesive may be pressure sensitive or heat activated.
- plasticse.g., PET, PETG, polyimide, polycarbonate, polystyrene
- the spacer 60may be in the form of a double sided adhesive coated on opposing sides of a polyester sheet where the adhesive may be pressure sensitive or heat activated.
- the first electrode layer 66 , the second electrode layer 64 , and/or the spacer 60are within the spirit and scope of the present disclosure.
- reagent layer 72can be disposed within the sample-receiving chamber 61 using a process such as slot coating, dispensing from the end of a tube, ink jetting, and screen printing.
- the reagent layer 72can include at least a mediator and an enzyme and is deposited onto first electrode 166 .
- mediatorsinclude ferricyanide, ferrocene, ferrocene derivatives, osmium bipyridyl complexes, and quinone derivatives.
- suitable enzymesinclude glucose oxidase, glucose dehydrogenase (GDH) using a pyrroloquinoline quinone (PQQ) co-factor, GDH using a nicotinamide adenine dinucleotide (NAD) co-factor, and GDH using a flavin adenine dinucleotide (FAD) co-factor [E.C.1.1.99.10].
- PQQpyrroloquinoline quinone
- NADnicotinamide adenine dinucleotide
- FADflavin adenine dinucleotide
- the reagent layer 72can be prepared from a formulation that contains 33 mM potassium citraconate, pH 6.8, 0.033% Pluronic P103, 0.017% Pluronic F87, 0.85 mM CaCl 2 , 30 mM sucrose, 286 ⁇ M PQQ, 15 mg/mL apo-GDH, and 0.6 M ferricyanide.
- the PQQcan be left out of the formulation and the apo-GDH can be replaced with FAD-GDH.
- Pluronicsare block copolymers based on ethylene oxide and propylene oxide, which can function as antifoaming agents and/or wetting agents.
- the formulationcan be applied at 570 ⁇ L/min using a 13 gauge needle poised about 150 ⁇ m above a palladium web moving at about 10 m/min.
- concentration of the solids in the reagentcan be increased by 50% and the flow rate can be reduced to 380 ⁇ L/min in order to maintain a constant reagent coating density.
- the enzyme formulationBefore coating the palladium web with the enzyme formulation, it can be coated with 2-mercaptoethane sulfonic acid (MESA).
- MESA2-mercaptoethane sulfonic acid
- a 95 ⁇ m thick spacer with a 1.2 mm wide channel cut in itcan be laminated to the reagent layer and the palladium web at 70° C.
- a MESA-coated gold webcan be laminated to the other side of the spacer.
- the spacercan be made from PET coated on both sides with a thermoplastic such as Vitel, which is a linear saturated copolyester resin having a relatively high molecular weight.
- Vitela linear saturated copolyester resin having a relatively high molecular weight.
- the resulting laminatecan be cut such that the fill path of the sample-receiving chamber is about 3.5 mm long, thus giving a total volume of about 0.4 ⁇ L.
- the reagent layer 72may have an area larger than the area of the first electrodes 166 . As a result a portion of the spacer 60 may overlap and touch the reagent layer 72 .
- the spacer 60may be configured to form a liquid impermeable seal to the first electrode 166 even though a portion of the reagent layer 72 is between the spacer 60 and the first electrode 166 .
- the spacer 60may intermingle or partially dissolve a portion of the reagent layer 72 to form a liquid impermeable bond to the first electrode 166 sufficient to define the electrode area for at least the total test time.
- the spacer 60may not be able to form a liquid impermeable seal and, as a result, the liquid may seep between the spacer 60 and the first electrode 166 . Such a leakage event may cause an inaccurate glucose measurement to occur.
- Either the first electrode 166 or the second electrode 164can perform the function of a working electrode depending on the magnitude and/or polarity of the applied test voltage.
- the working electrodemay measure a limiting test current that is proportional to the reduced mediator concentration.
- the current limiting speciesis a reduced mediator (e.g., ferrocyanide)
- ferrocyanidee.g., ferrocyanide
- the first electrode 166performs the function of the working electrode
- the second electrode 164performs the function of a counter/reference electrode.
- a counter/reference electrodesimply as a reference electrode or a counter electrode.
- a limiting oxidationoccurs when all reduced mediator has been depleted at the working electrode surface such that the measured oxidation current is proportional to the flux of reduced mediator diffusing from the bulk solution towards the working electrode surface.
- the term bulk solutionrefers to a portion of the solution sufficiently far away from the working electrode where the reduced mediator is not located within a depletion zone.
- the reduced mediatorcan be oxidized at the second electrode 164 as a limiting current.
- the second electrode 164performs the function of the working electrode and the first electrode 166 performs the function of the counter/reference electrode.
- performing an analysiscan include introducing a quantity of a fluid sample into a sample-receiving chamber 61 via a port 70 .
- the port 70 and/or the sample-receiving chamber 61can be configured such that capillary action causes the fluid sample to fill the sample-receiving chamber 61 .
- the first electrode 166 and/or second electrode 164may be coated with a hydrophilic reagent to promote the capillarity of the sample-receiving chamber 61 .
- thiol derivatized reagents having a hydrophilic moietysuch as 2-mercaptoethane sulfonic acid may be coated onto the first electrode and/or the second electrode.
- FIG. 5provides a simplified schematic showing a test meter 100 interfacing with a first contact pad 67 a , 67 b and a second contact pad 63 .
- the second contact pad 63can be used to establish an electrical connection to the test meter through a U-shaped notch 65 , as illustrated in FIG. 2 .
- the test meter 100may include a second electrode connector 101 , and first electrode connectors ( 102 a , 102 b ), a test voltage unit 106 , a current measurement unit 107 , a processor 212 , a memory unit 210 , and a visual display 202 , as shown in FIG. 5 .
- the first contact pad 67can include two prongs denoted as 67 a and 67 b .
- the first electrode connectors 102 a and 102 bseparately connect to prongs 67 a and 67 b , respectively.
- the second electrode connector 101can connect to second contact pad 63 .
- the test meter 100can measure the resistance or electrical continuity between the prongs 67 a and 67 b to determine whether the test strip 62 is electrically connected to the test meter 100 .
- the test meter 100can use a variety of sensors and circuits to determine when the test strip 62 is properly positioned with respect to the test meter 100 .
- the test meter 100can apply a test voltage and/or a current between the first contact pad 67 and the second contact pad 63 .
- the test meter 100turns on and initiates a fluid detection mode.
- the fluid detection modecauses test meter 100 to apply a constant current of about 1 microampere between the first electrode 166 and the second electrode 164 .
- the test meter 100measures a relatively large voltage, which can be limited by the analog-to-digital converter (A/D) within test meter 100 .
- A/Danalog-to-digital converter
- the test meter 100can perform a glucose test by applying a plurality of test voltages for prescribed intervals, as shown in FIG. 6 .
- the plurality of test voltagesmay include a first test voltage V 1 for a first time interval t i , a second test voltage V 2 for a second time interval t 2 , and a third test voltage V 3 for a third time interval t 3 .
- a glucose test time interval t Grepresents an amount of time to perform the glucose test (but not necessarily all the calculations associated with the glucose test).
- Glucose test time interval t Gcan range from about 1 second to about 5 seconds. Further, as illustrated in FIG.
- the second test voltage V 2can include a constant (DC) test voltage component and a superimposed alternating (AC), or oscillating, test voltage component.
- the superimposed alternating test voltage componentcan be applied for a time interval indicated by t cap .
- the inset of FIG. 6magnifies the high frequency AC component.
- the plurality of test current values measured during any of the time intervalsmay be performed at a frequency ranging from about 1 measurement per nanosecond to about one measurement per 100 milliseconds. While an embodiment using three test voltages in a serial manner is described, one skilled in the art will appreciate that the glucose test can include different numbers of open-circuit and test voltages. For example, as an alternative embodiment, the glucose test could include an open-circuit for a first time interval, a second test voltage for a second time interval, and a third test voltage for a third time interval.
- names “first,” “second,” and “third”are chosen for convenience and do not necessarily reflect the order in which the test voltages are applied. For instance, an embodiment can have a potential waveform where the third test voltage can be applied before the application of the first and second test voltage.
- the test meter 100may apply a first test voltage V 1 (e.g., ⁇ 20 mV in FIG. 6 ) for a first time interval t 1 (e.g., 1 second in FIG. 6 ).
- the first time interval t 1can range from about 0.1 seconds to about 3 seconds and preferably range from about 0.2 seconds to about 2 seconds, and most preferably range from about 0.3 seconds to about 1 seconds.
- the first time interval t 1may be sufficiently long so that the sample-receiving chamber 61 can fully fill with sample and also so that the reagent layer 72 can at least partially dissolve or solvate.
- the first test voltage V 1may be a value relatively close to the redox potential of the mediator so that a relatively small amount of a reduction or oxidation current is measured.
- FIG. 7shows that a relatively small amount of current is observed during the first time interval t 1 compared to the second and third time intervals t 2 and t 3 .
- the first test voltage V 1can range from about ⁇ 100 mV to about ⁇ 1 mV, preferably range from about ⁇ 50 mV to about ⁇ 5 mV, and most preferably range from about ⁇ 30 mV to about ⁇ 10 mV.
- the test meter 100After applying the first test voltage V 1 , the test meter 100 applies a second test voltage V 2 between first electrode 166 and second electrode 164 (e.g., ⁇ 0.3 Volts in FIG. 6 ), for a second time interval t 2 (e.g., about 3 seconds in FIG. 6 ).
- the second test voltage V 2may be a value sufficiently negative of the mediator redox potential so that a limiting oxidation current is measured at the second electrode 164 .
- the second test voltage V 2can range from about ⁇ 600 mV to about zero mV, preferably range from about ⁇ 600 mV to about ⁇ 100 mV, and more preferably be about ⁇ 300 mV.
- the second time interval t 2should be sufficiently long so that the rate of generation of reduced mediator (e.g., ferrocyanide) can be monitored based on the magnitude of a limiting oxidation current.
- Reduced mediatoris generated by enzymatic reactions with the reagent layer 72 .
- a limiting amount of reduced mediatoris oxidized at second electrode 164 and a non-limiting amount of oxidized mediator is reduced at first electrode 166 to form a concentration gradient between first electrode 166 and second electrode 164 .
- the second time interval t 2should also be sufficiently long so that a sufficient amount of ferricyanide can be generated at the second electrode 164 .
- a sufficient amount of ferricyanideis required at the second electrode 164 so that a limiting current can be measured for oxidizing ferrocyanide at the first electrode 166 during the third test voltage V 3 .
- the second time interval t 2may be less than about 60 seconds, and preferably can range from about 1 second to about 10 seconds, and more preferably range from about 2 seconds to about 5 seconds.
- the time interval indicated as t cap in FIG. 6may also last over a range of times, but in one exemplary embodiment it has a duration of about 20 milliseconds.
- the superimposed alternating test voltage componentis applied after about 0.3 seconds to about 0.4 seconds after the application of the second test voltage V 2 , and induces a sine wave having a frequency of about 109 Hz with an amplitude of about +/ ⁇ 50 mV.
- FIG. 7shows a relatively small peak i pb at the beginning of the second time interval t 2 followed by a gradual increase of an absolute value of an oxidation current during the second time interval t 2 .
- the small peak i pboccurs due to an initial depletion of reduced mediator at about 1 second.
- the gradual absolute increase in oxidation current after the small peak i pbis caused by the generation of ferrocyanide by reagent layer 72 , which then diffuses to second electrode 164 .
- the test meter 100After applying the second test voltage V 2 , the test meter 100 applies a third test voltage V 3 between the first electrode 166 and the second electrode 164 (e.g., about +0.3 Volts in FIG. 6 ) for a third time interval t 3 (e.g., 1 second in FIG. 6 ).
- the third test voltage V 3may be a value sufficiently positive of the mediator redox potential so that a limiting oxidation current is measured at the first electrode 166 .
- the third test voltage V 3can range from about zero mV to about 600 mV, preferably range from about 100 mV to about 600 mV, and more preferably be about 300 mV.
- the third time interval t 3may be sufficiently long to monitor the diffusion of reduced mediator (e.g., ferrocyanide) near the first electrode 166 based on the magnitude of the oxidation current.
- reduced mediatore.g., ferrocyanide
- a limiting amount of reduced mediatoris oxidized at first electrode 166 and a non-limiting amount of oxidized mediator is reduced at the second electrode 164 .
- the third time interval t 3can range from about 0.1 seconds to about 5 seconds and preferably range from about 0.3 seconds to about 3 seconds, and more preferably range from about 0.5 seconds to about 2 seconds.
- FIG. 7shows a relatively large peak i pc , at the beginning of the third time interval t 3 followed by a decrease to a steady-state current i ss value.
- the second test voltage V 2can have a first polarity and the third test voltage V 3 may have a second polarity that is opposite to the first polarity.
- the second test voltage V 2can be sufficiently negative of the mediator redox potential and the third test voltage V 3 can be sufficiently positive of the mediator redox potential.
- the third test voltage V 3may be applied immediately after the second test voltage V 2 .
- the magnitude and polarity of the second and third test voltagescan be chosen depending on the manner in which analyte concentration is determined.
- FIG. 8illustrates one method of determining a glucose concentration by way of a flow diagram.
- a usercan insert a test strip into a test meter and then apply a sample to the test strip.
- the test meterdetects the presence of the sample and applies a test voltage, as shown in a step 1802 .
- the test metermeasures a test current, as shown in a step 1804 .
- a microprocessor of the test metercan then process the resulting test current values so that an accurate glucose measurement can be determined and to ensure that there are no system errors.
- step 1806Another step in the method, as shown in step 1806 , can be performing a control solution (CS)/blood discrimination test.
- CScontrol solution
- step 1808if the CS/blood discrimination test determines that the sample is blood, then method 1800 moves to a series of steps that include: the application of a blood glucose algorithm 1810 , hematocrit correction 1812 , blood temperature correction 1814 , and error checks 1000 ; and if the CS/blood discrimination test determines that the sample is CS (i.e., not blood), then method 1800 moves to a series of steps that include: the application of a CS glucose algorithm 1824 , CS temperature correction 1826 , and error checks 1000 .
- step 1818can be performed to determine if there are any errors. If there are no errors, then the test meter outputs a glucose concentration, as shown in a step 1820 , but if there are errors, then the test outputs an error message, as shown in a step 1822 .
- the CS/blood discrimination test 1806can include a first reference value and a second reference value.
- the first reference valuecan be based on current values during the first time interval t 1 and the second reference value can be based on current values during both the second time interval t 2 and the third time interval t 3 .
- the first reference valuecan be obtained by performing a summation of the current values obtained during the first time current transient when using the test voltage waveform of FIG. 6 .
- a first reference value i sumcan be represented by Equation 1:
- the second reference valuesometimes referred to as the residual reaction index, can be obtained by a seventh ratio R 7 of current values during the second time interval and the third time interval, as shown in Eq. 2:
- R 7abs ⁇ ( i ⁇ ( 3.8 ) i ⁇ ( 4.15 ) ) Eq . ⁇ 2
- absrepresents an absolute function
- 3.8 and 4.15represent the time in seconds of the second and third time intervals, respectively, for this particular example.
- a discrimination criterioncan be used to determine if the sample is either control solution or blood based on the first reference value of Eq. 1 and the second reference of Eq. 2.
- the first reference value of Eq. 1can be compared to a pre-determined threshold and the second reference value of Eq. 2 can be compared to a pre-determined threshold equation.
- the predetermined thresholdmay be about 12 microamperes.
- the pre-determined threshold equationcan be based on a function using the first reference value of Eq. 1. More specifically, as illustrated by Eq. 3, the pre-determined threshold equation can be:
- the CS/Blood discrimination test 1806can identify a sample as blood if
- the blood glucose algorithm of step 1810can be performed on the test current values.
- a first glucose concentration G 1can be calculated using a glucose algorithm as shown in Equation 4:
- i 1is a first test current value
- i 2is a second test current value
- i 3is a third test current value
- All test current values (e.g., i 1 , i 2 , and i 3 ) in Equation 4use the absolute value of the current.
- the first test current value i 1 and the second test current value i 2can each be defined by an average or summation of one or more predetermined test current values that occur during the third time interval t 3 .
- the third test current value i 3can be defined by an average or summation of one or more predetermined test current values that occur during the second time interval t 2 .
- names “first” “second,” and “third”are chosen for convenience and do not necessarily reflect the order in which the current values are calculated.
- Equation 4can be modified to provide an even more accurate glucose concentration.
- the term i 1can be defined to include peak current values i pb and i pc and the steady-state current i ss , as shown in Equation 5:
- i 1i 2 ⁇ ⁇ i pc - 2 ⁇ ⁇ i pb + i ss i pc + i ss ⁇ Eq . ⁇ 5
- a calculation of the steady-state current i sscan be based on a mathematical model, an extrapolation, an average at a predetermined time interval, a combination thereof, or any number of other ways for calculating a steady-state current.
- i smay be estimated by multiplying the test current value at 5 seconds with a constant K 8 (e.g., 0.678).
- K 8e.g. 0.78
- i ss⁇ i(5) ⁇ K 8 .
- K 8can be estimated using Equation 6:
- i ssi ⁇ ( 5 ) 1 + 4 ⁇ ⁇ exp ⁇ ( - 4 ⁇ ⁇ 2 ⁇ Dx ⁇ ⁇ 0.975 L 2 ) Eq . ⁇ 6
- the number 0.975is about the time in seconds after the third test voltage V 3 is applied that corresponds to i(5), which, assuming a linear variation over the time between about 0.95 seconds and 1 second, is the average current between 0.95 and 1 second
- Dis assumed to be about 5 ⁇ 10 ⁇ 6 cm 2 /sec as a typical diffusion coefficient in blood
- Lis assumed to be about 0.0095 cm, which represents the height of the spacer 60 .
- i pcmay be the test current value at 4.1 seconds
- i pbmay be the test current value at 1.1 seconds, based on the test voltage and test current waveforms in FIGS. 6 and 7 .
- i 2can be defined to be
- Equation 5can be combined with Equation 4 to yield an equation for determining a more accurate glucose concentration that can compensate for the presence of endogenous and/or exogenous interferents in a blood sample, as shown in Equation 7:
- G 1( i 2 i 3 ) p ⁇ ( a ⁇ i 2 ⁇ ⁇ i pc - 2 ⁇ i pb + i ss i pc + i ss ⁇ - z ) Eq . ⁇ 7
- the first glucose concentration G 1is the output of the blood glucose algorithm and the terms a, p, and z are constants that can be derived empirically.
- the CS glucose algorithm of step 1824can be performed on the test current values.
- a first glucose concentration G 1 for CScan be calculated using Equation 7 above, although the values for a, p, and z for CS can be different than those for blood.
- hematocrit correction 1812can be applied by modifying G 1 to provide a second glucose concentration G 2 that is accurate even if the sample has an extreme hematocrit level (e.g., about 20% or about 60%).
- FIG. 9is a flow diagram depicting a method 2000 for calculating an accurate glucose concentration that accounts for blood samples having an extreme hematocrit level.
- a usercan initiate a test by applying a sample to the test strip, as shown in a step 2001 .
- a first test voltage V 1can be applied for a first time interval t i as shown in a step 2002 .
- the resulting test currentis then measured for the first time interval t 1 , as shown in a step 2004 .
- the second test voltage V 2is applied for a second time interval t 2 , as shown in a step 2006 .
- the resulting test currentis then measured for the second time interval t 2 , as shown in a step 2008 .
- the third test voltage V 3is applied for a third time interval t 3 , as shown in a step 2010 .
- the resulting test currentis then measured for the third time interval t 3 , as shown in a step 2012 .
- a first glucose concentration G 1can be calculated, as shown in a step 2014 .
- the first glucose concentration G 1can be calculated using Equations 4 or 7.
- a hematocrit level Hcan be calculated, as shown in a step 2016 .
- the hematocrit levelmay be estimated using test current values acquired during the glucose test time interval t G .
- the hematocrit level Hmay be estimated using test current values acquired during the second time interval t 2 and the third time interval t 3 .
- the hematocrit level Hcan be estimated using a hematocrit equation based upon the first glucose concentration G 1 and i 2 .
- Equation 8H is the hematocrit level, i 2 is at least one current value during the second time interval, K 5 is a fifth constant, K 6 is a sixth constant, and K 7 is a seventh constant.
- K 5 , K 6 , and K 7may be about ⁇ 76, 56, and 250, respectively.
- K 5 , K 6 , and K 7may be about ⁇ 73.5, 58.8, and 213, respectively.
- FIG. 10shows that the estimated hematocrit levels using Equation 8 has an approximately linear correlation with actual hematocrit levels measured with a reference method.
- the hematocrit level His compared to a lower predetermined hematocrit level H L , as shown in a step 2018 .
- the lower predetermined hematocrit level H Lmay be about 30%. If the hematocrit level H is less than lower predetermined hematocrit level H L , then the first glucose concentration G 1 is compared to an upper predetermined glucose concentration G u , as shown in a step 2020 .
- the upper predetermined glucose concentration G tmay be about 300 mg/dL. If the hematocrit level H is compared to an upper predetermined hematocrit level H u , as shown in a step 2022 .
- the upper predetermined hematocrit level H umay be about 50%. If the hematocrit level H is greater than H u , then the first glucose concentration G i is compared to a lower predetermined glucose concentration G L , as shown in a step 2028 .
- the lower predetermined glucose concentration G Lmay be about 100 mg/dL. Steps 2018 and 2022 indicate that method 2000 will output first glucose concentration G 1 , as shown in a step 2034 , if the hematocrit level H is not less than H L and not greater than H u .
- a first functioncan be used to calculate a correction value Corr, as shown in a step 2024 , if the first glucose concentration G 1 is less than the upper predetermined glucose concentration G u .
- the second functioncan be used to calculate the correction value Corr, as shown in a step 2026 .
- the correction value Corr for Equations 9 and 10may be restricted to a range of about ⁇ 5 to about zero. Thus, if Corr is less than ⁇ 5, then Corr is set to ⁇ 5 and if Corr is greater than zero, then Corr is set to zero.
- a third functioncan be used to calculate a correction value Corr, as shown in a step 2030 , if the first glucose concentration G 1 is less than lower predetermined glucose concentration G L .
- the correction value Corr for Equation 12may be restricted to a range of about zero to about six. Thus, if Corr is less than zero, then Corr is set to zero and if Corr is greater than six, then Corr is set to six.
- the first glucose concentrationis compared to 100 mg/dL in a step 2036 . If the first glucose concentration is less than 100 mg/dL, then the second glucose concentration G 2 is calculated using a first correction equation, as shown in a step 2038 .
- the 100 mg/dLrepresents a glucose threshold and should not be construed as a limiting number. In one embodiment, the glucose threshold may range from about 70 mg/dL to about 100 mg/dL.
- the second glucose concentration G 2is calculated using a second correction equation, as shown in a step 2040 .
- the second correction equationmay be in the form of Equation 14:
- G 2G 1 ⁇ ( 1 + Corr 100 ) Eq . ⁇ 14
- G 2G 1 ⁇ ( 1 + Corr 100 ) Eq . ⁇ 14
- the second glucose concentration G 2can be calculated using Equation 14, as shown in step 2040 .
- the second glucose concentration G 2equals the first glucose concentration G 1 , which can then be outputted as a glucose reading in step 2042 .
- FIG. 11shows a bias plot for a plurality of test strips that were tested with blood samples having a wide range of hematocrit levels and glucose concentrations. More specifically, FIG. 11 shows the effect of whole blood samples having a wide range of hematocrit on the accuracy and precision of the new test system.
- the bias of the sensor response with respect to the YSI 2700(Yellow Springs Instruments, Yellow Springs, Ohio) is plotted against the plasma glucose concentration. The data were obtained with 3 batches of sensors and 4 blood donors.
- the hematocritwas adjusted to 20% (squares), 37-45% (circles) or 60% (triangles) prior to spiking the samples with glucose.
- blood temperature correction 1814can be applied to the test current values to provide a glucose concentration with an improved accuracy because of a reduced effect from temperature.
- a method for calculating a temperature corrected glucose concentrationcan include measuring a temperature value and calculating a second correction value Corr 2 .
- the second correction value Corr 2can be based on a temperature value and either first glucose concentration G 1 or second glucose concentration G 2 glucose concentration, both of which as described previously do not include a correction for temperature. Accordingly, the second correction value Corr 2 can then be used to correct the glucose concentration G 1 or G 2 for temperature.
- FIG. 12is a flow diagram depicting an embodiment of the method 1814 of applying a blood temperature correction.
- a glucose concentration uncorrected for temperaturecan be obtained such as first glucose concentration G 1 from step 1810 or a second glucose concentration G 2 from step 1812 .
- a blood temperature correctioncan be applied to either G 1 or G 2 , for simplicity the blood temperature correction will be described using G 2 .
- a temperature valuecan be measured.
- the temperaturecan be measured using a thermistor or other temperature reading device that is incorporated into a test meter, or by way of any number of other mechanisms or means.
- a determinationcan be performed to determine whether the temperature value T is greater than a first temperature threshold T 1 .
- the temperature threshold T 1is about 15° C. If the temperature value T is greater than 15° C., then a first temperature function can be applied to determine the second correction value Corr 2 , as shown in a step 1914 . If the temperature value T is not greater than 15° C., then a second temperature function can be applied to determine the second correction value Corr 2 , as shown in a step 1916 .
- Tis about equal to T RT
- Corr 2is about zero.
- the first temperature functioncan be configured to have essentially no correction at room temperature such that variation can be reduced under routine ambient conditions.
- K 11is an eleventh constant (e.g., 0.57 for GDH-PQQ and 0.89 for FAD-GDH)
- Tis a temperature value
- T RTis a room temperature value
- K 12is a twelfth constant (e.g., 0.00023 for GDH-PQQ and 0.00077 for FAD-GDH)
- G1is a first glucose concentration
- K 13is a thirteenth constant (e.g., 0.63 for GDH-PQQ and 1.65 for FADGDH)
- T 1is a first temperature threshold
- K 14is a fourteenth constant (e.g., 0.0038 for GDH-PQQ and 0.0029 for FAD-GDH).
- Corr 2can be limited to have a range of ⁇ 10 to +10 by using a step 1918 and/or a step 1922 .
- a determinationcan be performed to determine whether Corr 2 is greater than 10. If Corr 2 is greater than 10, the Corr 2 is set to 10, as shown in a step 1920 . If Corr 2 is not greater than 10, then a determination is performed to determine whether Corr 2 is less than ⁇ 10, as shown in a step 1922 .
- Corr 2can be set to ⁇ 10 if Corr 2 is less than ⁇ 10, as shown in a step 1924 . If Corr 2 is a value already in between ⁇ 10 and +10, then there generally is no need for truncation.
- a temperature corrected glucose concentrationcan be calculated using either a step 1928 or a step 1930 .
- the method 1814 for blood temperature correctionwas verified using blood in a glove box over a temperature range of about 5° C. to 45° C.
- the blood sampleshad a hematocrit range of about 20-50% hematocrit and a glucose range of about 20-600 mg/dL equivalent plasma glucose concentration.
- the glove boxwas an enclosed chamber that could hold a pre-determined constant temperature.
- the glove portion of the glove boxallowed a tester outside of the glove box to perform a glucose test inside the glove box.
- the testerinserted test strips into a test meter and dose sampled in an environment having both a controlled temperature and relative humidity (RH).
- the RHwas maintained at about 60% in order to keep evaporation of the sample droplets at a relatively low level during the test.
- FIG. 13shows that temperature has a substantial bias on the blood results when there is no temperature compensation function in the test meters because only about 83.4% of biases were within 15% or 15 mg/dL of the reference glucose value.
- FIG. 14there is much less bias on the blood results when there is a temperature compensation in the test meters because far less biases percentage-wise were located outside of the 15% or 15 mg/dL range of the reference glucose value when compared to the results of FIG. 13 .
- FIG. 15is a flow diagram depicting an embodiment of the method 1826 of applying a CS temperature correction.
- the CS temperature correctionis similar to the blood temperature correction except that the temperature function for calculating Corr 2 is different.
- a glucose concentration uncorrected for temperaturecan be obtained such as first glucose concentration G 1 from step 1824 .
- a temperature valuecan be measured, as shown in a step 1910 .
- a third temperature functioncan be applied to determine the second correction value Corr 2 for CS, as shown in a step 1934 .
- K 15is a fifteenth constant (e.g., 0.27 for GDH-PQQ and 0.275 for FAD-GDH)
- Tis a temperature value
- T RTis a room temperature value (e.g., 22° C.)
- K 16is a sixteenth constant (e.g., 0.0011 for GDH-PQQ and
- Corr 2can be limited to have a range of ⁇ 10 to +10 by using a step 1918 and/or a step 1922 , as shown in FIG. 20 .
- a determinationcan be performed to determine whether Corr 2 is greater than 10. If Corr 2 is greater than 10, the Corr 2 can be set to 10, as shown in a step 1920 . If Corr 2 is not greater than 10, then a determination can be performed to determine whether Corr 2 is less than ⁇ 10, as shown in a step 1922 . Corr 2 can be set to ⁇ 10 if Corr 2 is less than ⁇ 10, as shown in a step 1924 .
- a temperature corrected glucose concentration for CScan be calculated using either a step 1928 or a step 1930 .
- a determinationcan be performed to determine whether the glucose concentration uncorrected for temperature (e.g., G 1 ) is less than 100 mg/dL. If G 1 is less than 100 mg/dL, then third glucose concentration G 3 can be calculated by adding G 1 +Corr 2 , as shown in step 1928 . If G 1 is not less than 100 mg/dL, then third glucose concentration G 3 can be calculated by dividing Corr 2 by one hundred, adding one, and then multiplying by the second glucose concentration to give a temperature corrected concentration, as shown in step 1930 . Once a third glucose concentration for CS is determined that is corrected for the effects of temperature, the third glucose concentration can be outputted, as shown in a step 1932 , to either the next step in method 1800 or to error checks 1000 .
- the method 1826 for CS temperature correctionwas verified in a glove box over a temperature range of about 5° C. to 45° C.
- the relative humidity (RH)was maintained at about 60%.
- FIG. 16shows that temperature has a substantial bias on the CS results when there is no temperature compensation function in the meters because a fair amount of the results fall outside of 15% or 15 mg/dL of the reference glucose value.
- FIG. 17there is much less bias on the blood results when there is a temperature compensation in the test meters because none of the results were located outside of the 15% or 15 mg/dL range of the glucose value.
- Various embodiments of a method for identifying various system errorswhich may include user errors when performing a test, test meter errors, and defective test strips, are also provided.
- the systemcan be configured to identify a test utilizing a partial fill or double-fill of a sample chamber. Also, the system can be configured to identify those situations where the sample may be leaking from the sample chamber thereby compromising the integrity of the testing and/or those situations where some portion of system (e.g., the test strip) is damaged.
- FIG. 18is a flow diagram depicting an exemplary embodiment of a method 1000 of identifying system errors in performing an analyte measurement.
- a usercan initiate a test by applying a sample to a test strip, as shown in a step 1002 .
- the test meterapplies a first test voltage V 1 for a first time interval t 1 , as shown in a step 1004 a .
- a resulting test currentis then measured for the first time interval t 1 , as shown in a step 1005 a .
- the test metercan perform a double dose check 1006 a and a maximum current check 1012 a .
- test meterwill display an error message, as shown in a step 1028 . If the double dose check 1006 a and maximum current check 1012 a both pass, then the test meter can apply a second test voltage V 2 for a second time interval t 2 , as shown in a step 1004 b.
- a resulting test currentis measured for the second time interval t 2 , as shown in a step 1005 b .
- the test metercan perform a sufficient volume check 1030 , a double dose check 1006 b , a maximum current check 1012 b , and a minimum current check 1014 b . If one of the checks 1030 , 1006 b , 1012 b , or 1014 b fails, then the test meter will display an error message, as shown in step 1028 . If all of the checks 1030 , 1006 b , 1012 b , and 1014 b pass, then the test meter will apply a third test voltage V 3 , as shown in a step 1004 c.
- a resulting test currentis measured for the third time interval t 3 , as shown in a step 1005 c .
- the test metercan perform a double dose check 1006 c , maximum current check 1012 c , a minimum current check 1014 c , a high resistance check 1022 c , and a sample leakage check 1024 c . If all of the checks 1006 c , 1012 c , 1014 c , 1022 c , and 1024 c pass, then the test meter will display a glucose concentration, as shown in a step 1026 .
- test meterwill display an error message, as shown in step 1028 .
- the followingwill describe the system checks and how errors can be identified using such system checks.
- a capacitance measurementis used.
- the capacitance measurementcan measure essentially an ionic double-layer capacitance resulting from the formation of ionic layers at the electrode-liquid interface.
- a magnitude of the capacitancecan be proportional to the area of an electrode coated with sample.
- test stripscan be found in U.S. Pat. Nos. 7,195,704 and 7,199,594, each of which is hereby incorporated by reference in its entirety.
- a test voltage having a constant component and an oscillating componentis applied to the test strip.
- the resulting test currentcan be mathematically processed, as described in further detail below, to determine a capacitance value.
- a limiting test currentoccurs at a working electrode having a well-defined area (i.e., an area not changing during the capacitance measurement)
- the most accurate and precise capacitance measurements in an electrochemical test stripcan be performed.
- a well-defined electrode area that does not change with timecan occur when there is a tight seal between the electrode and the spacer.
- the test currentis relatively constant when the current is not changing rapidly due either to glucose oxidation or electrochemical decay.
- any period of time when an increase in signal, which would be seen due to glucose oxidation, is effectively balanced by a decrease in signal, which accompanies electrochemical decaycan also be an appropriate time interval for measuring capacitance.
- first electrode 166can potentially change with time after dosing with the sample if the sample seeps in between the spacer 60 and the first electrode 166 .
- reagent layer 72can be have an area larger than the cutout area 68 that causes a portion of the reagent layer 72 to be in between the spacer 60 and the first electrode layer 66 .
- interposing a portion of the reagent layer 72 in between the spacer 60 and the first electrode layer 66can allow the wetted electrode area to increase during a test.
- a leakagecan occur during a test that causes the area of the first electrode to increase with time, which in turn can distort a capacitance measurement.
- an area of the second electrode 164can be more stable with time compared to the first electrode 166 because there is no reagent layer in between the second electrode 164 and the spacer 60 .
- the sampleis less likely to seep in between the spacer 60 and the second electrode 164 .
- a capacitance measurement that uses a limiting test current at the second electrode 164can thus be more precise because the area does not change during the test.
- a first test voltage V 1(e.g., ⁇ 20 mV) can be applied between the electrodes for about 1 second to monitor the fill behavior of the liquid and to distinguish between control solution and blood.
- the test currentsare used from about 0.05 to 1 second.
- This first test voltage V 1can be relatively low (i.e., the test voltage is similar in magnitude to the redox potential of the mediator) such that the distribution of ferrocyanide in the cell is disturbed as little as possible by the electrochemical reactions occurring at the first and second electrodes.
- a second test voltage V 2(e.g., ⁇ 300 mV) having a larger absolute magnitude can be applied after the first test voltage V 1 such that a limiting current can be measured at the second electrode 164 .
- the second test voltage V 2can include an AC voltage component and a DC voltage component.
- the AC voltage componentcan be applied at a predetermined amount of time after the application of the second test voltage V 2 , and further, can be a sine wave having a frequency of about 109 Hertz and an amplitude of about +/ ⁇ 50 millivolts.
- the predetermined amount of timecan range from about 0.3 seconds to about 0.4 seconds after the application of the second test voltage V 2 .
- the predetermined amount of timecan be a time where a test current transient as a function of time has a slope of about zero.
- the predetermined amount of timecan be a time required for a peak current value (e.g., i pb ) to decay by about 50%.
- the DC voltageit can be applied at a beginning of the first test voltage.
- the DC voltage componentcan have a magnitude sufficient to cause a limiting test current at the second electrode such as, for example, about ⁇ 0.3 volts with respect to the second electrode.
- the reagent layer 72is not coated onto the second electrode 164 , which causes the magnitude of the absolute peak current i pb to be relatively low compared to the magnitude of the absolute peak current i pc .
- the reagent layer 72can be configured to generate a reduced mediator in a presence of an analyte, and the amount of the reduced mediator proximate to first electrode can contribute to the relatively high absolute peak current i pc .
- at least the enzyme portion of the reagent layer 72can be configured to not substantially diffuse from the first electrode to the second electrode when a sample is introduced into the test strip.
- test currents after i pbtends to settle to a flat region at approximately 1.3 seconds, and then the current increases again as the reduced mediator generated at the first electrode 166 , which can be coated with the reagent layer 72 , diffuses to the second electrode 164 , which is not coated with the reagent layer 72 .
- the glucose algorithmrequires test current values both before and after the test interval of about 1.3 to about 1.4 seconds. For example, i pb is measured at 1.1 seconds in Equation 7 and test currents are measured at 1.4 seconds onwards for
- a capacitance measurementcan be performed at a relatively flat region of the test current values, which can be performed at about 1.3 seconds to about 1.4 seconds.
- the capacitancecan interfere with the relatively low first test voltage V 1 that can be used in the CS/blood discrimination test 1806 .
- an oscillating voltage component on the order of +/ ⁇ 50 mV superimposed onto a ⁇ 20 mV constant voltage componentcan cause significant perturbation of the measured test current. Not only does the oscillating voltage component interfere with the first test voltage V 1 , but it can also significantly perturb the test currents measured after 1.4 seconds, which in turn can interfere with the blood glucose algorithm 1810 .
- measuring the capacitance at about 1.3 seconds to about 1.4 secondsresulted in accurate and precise measurements that did not interfere with the CS/blood discrimination test or the glucose algorithm.
- the third test voltage V 3(e.g., +300 mV) can be applied causing the test current to be measured at the first electrode 166 , which can be coated with the reagent layer 72 .
- the presence of a reagent layer on the first electrodecan allow penetration of liquid between the spacer layer and the electrode layer, which can cause the electrode area to increase.
- a 109 Hz AC test voltage( ⁇ 50 mV peak-to-peak) can be applied for 2 cycles during the time interval t cap .
- the first cyclecan be used as a conditioning pulse and the second cycle can be used to determine the capacitance.
- the capacitance estimatecan be obtained by summing the test current over a portion of the alternating current (AC) wave, subtracting the direct current (DC) offset, and normalizing the result using the AC test voltage amplitude and the AC frequency. This calculation provides a measure of the capacitance of the strip, which is dominated by the strip sample chamber when it is filled with a sample.
- the capacitancecan be measured by summing the test current over one quarter of the AC wavelength on either side of the point in time where the input AC voltage crosses the DC offset, i.e. when the AC component of the input voltage is zero (the zero crossing point).
- the DC current componentis considered as changing linearly with time (due to the on-going glucose reaction generating ferrocyanide) and is thus represented by a constant i o , which is the DC current at time zero (the zero crossing point), and s, the slope of the DC current change with time.
- the AC current componentis represented by I sin( ⁇ + ⁇ ), where I is the amplitude of the current wave, ⁇ is its frequency, and ⁇ is its phase shift relative to the input voltage wave.
- wcan also be expressed as 2 ⁇ f, where f is the frequency of the AC wave in Hertz.
- Ican also be expressed as shown in Equation 21:
- Equation 20can be integrated from one quarter wavelength before the zero crossing point to one quarter wavelength after the zero crossing point to yield Equation 23:
- Equation 25By substituting Eq. 21 into Eq. 20, then into Eq. 23, and then rearranging, Equation 25 results:
- Equation 251 2 ⁇ V ⁇ ( ⁇ - 1 / 4 ⁇ f 1 / 4 ⁇ f ⁇ i ⁇ ( t ) - i o 2 ⁇ f ) Eq . ⁇ 25
- Equation 25The integral term in Equation 25 can be approximated using a sum of currents shown in Equation 26:
- Equation 27Equation 27:
- the capacitance measurementscan be obtained by summing the currents not around the voltage zero crossing point, but rather around the maximum AC component of the current.
- the test currentcan be summed a quarter wavelength around the current maximum. This is tantamount to assuming that the circuit element responding to the AC excitation is a pure capacitor, so ⁇ is ⁇ /2.
- Equation 24can be reduced to Equation 28:
- Equation 28can then be used with Equation 25 to yield a simplified capacitance equation that does not require an integral approximation. The net result is that capacitance measurements when summing the currents not around the voltage crossing point, but rather around the maximum AC component of the current, were more precise.
- the microprocessor of the test metercan have a heavy load with calculating the glucose concentration.
- the capacitance data acquisitionneeds to be made part way through the test rather than at its beginning, it can be necessary to defer the processing of the capacitance measurement data until after the determination of the glucose concentration is completed.
- the capacitancecan be calculated, and if the capacitance is below a pre-determined threshold, a partial fill error can be flagged.
- Cap corrCap ⁇ 1.9 ⁇ T Eq. 29 where Cap corr is i the temperature corrected capacitance value, Cap is capacitance, and T is temperature.
- the temperature-corrected capacitance values from Equations 29 and 30can be used for identifying partially filled test strips.
- the thresholdshould generally be set four (4) standard deviation units below the mean. Statistically this equates to a 99.994% certainty that no complete fill will be identified as a partial fill.
- the temperature-corrected capacitance threshold value for bloodwill be about 450 nF, and the corresponding value for control solution will be about 560 nF. These values can be programmed into a memory portion of the test meters. In an alternative embodiment, the threshold value can be adjusted by the operator depending on the intended use.
- the chart of FIG. 19shows a correlation of capacitance and bias to a reference glucose measurement (YSI, Yellow Springs Instrument).
- the measured glucose concentrationswere converted to a bias by comparing it to a glucose measurement performed with a reference instrument.
- Several test stripswere filled with various volumes of blood, and the capacitance and glucose concentrations were measured with the test voltage waveform of FIG. 6 . More particularly, the capacitance was measured during the third test voltage V 3 where the test current is relatively large and decreases rapidly with time. Additionally, the capacitance measurements were performed where the limiting test current occurs on the first electrode, which has a reagent layer coating.
- the capacitance valuesshould form a straight line with relatively little scatter when correlated to the YSI bias. For example, a 50% negative bias to YSI should correspond to a 50% decrease in capacitance compared to a fully-filled test strip. Thus, if it is also assumed that the strip-to-strip variation in bias is relatively small, then the relatively large scatter of data points in FIG. 19 can be ascribed to a relatively large variation in the capacitance measurements. It was found that capacitance variation was caused by performing the capacitance measurement during the third test voltage where the test current values are generally not relatively constant.
- a relatively large scatter in the capacitance measurementscould cause a significant number of fully-filled test strips to be rejected. Further, a large capacitance variation can cause some capacitance measurements to be biased low, and thus, be below a sufficiently filled threshold resulting in a falsely identified partial fill.
- the chart of FIG. 20shows a correlation of capacitance (measured at about 1.3 seconds) and bias to a reference glucose measurement (YSI, Yellow Springs Instrument).
- a reference glucose measurementYSI, Yellow Springs Instrument.
- Several test stripswere filled with various volumes of blood, and the capacitance and glucose concentrations were measured with the test voltage waveform of FIG. 6 . More particularly, the capacitance was measured during the second test voltage V 2 where the test current is relatively constant. In addition, the capacitance measurement was performed where the limiting test current occurs on the second electrode, which did not have a reagent layer coating. In contrast to FIG. 19 , the data in FIG. 20 shows that the capacitance values are less scattered.
- the chart of FIG. 21shows a correlation of capacitance (measured at about 1.3 seconds) and bias to a reference glucose measurement (YSI, Yellow Springs Instrument).
- Several test stripswere filled with various volumes of CS, and the capacitance and glucose concentrations were measured with the test voltage waveform of FIG. 6 . Similar to FIG. 20 , the data in FIG. 21 shows that the capacitance values have a relatively low amount of variation when performed during this time interval.
- FIG. 22shows a test current transient where a user performed a double-dosing event during the second test time interval t 2 that caused a spike to be observed (see solid line). When there is no double-dosing event, the test current transient does not have a peak (see dotted line of FIG. 22 ).
- a double-dosing eventcan cause a glucose test to have an inaccurate reading.
- a double-dosing eventinitially causes the measured test current to be low in magnitude because the electrode area is effectively decreased when only a portion is wetted with sample. Once the user applies the second dose, a current spike will occur because of a sudden increase in the effective electrode area and also because turbulence causes more reduced mediator to be transported close to the working electrode. In addition, less ferrocyanide will be generated because a portion of the reagent layer is not wetted by sample for the entire test time. Thus, an inaccurate glucose reading can result if a test current value used in the glucose algorithm is depressed or elevated as a result of the double-dosing.
- a method of identifying a double-dosing eventmay include measuring a second test current and a third test current where the second test current occurs before the third test current.
- An equationmay be used to identify double-dosing events based on a difference between the absolute value of the third test current and the absolute value of the second test current. If the difference is greater than a predetermined threshold, the test meter may output an error message indicative of a double-dosing event.
- the method of identifying the double-dosing eventmay be performed multiple times in serial manner as the test current values are collected by the test meter.
- the predetermined thresholds disclosed hereinare illustrative for use with test strip 100 and with the test voltage waveform of FIG.
- working electrode and reference electrodeboth have an area of about 0.042 cm 2 and a distance between the two electrodes ranging from about 90 microns to about 100 microns. It should be obvious to one skilled in the art that such predetermined thresholds may change based on the test strip design, the test voltage waveform, and other factors.
- a methodmay include measuring a first test current, a second test current, and third test current where the first test current occurs before the second test current and the third test current occurs after the second test current.
- An equationmay be used to identify double-dosing events based on two times the absolute value of the second test current minus the absolute value of first test current and minus the absolute value of the third test current.
- the predetermined thresholdmay be set to a different value for the first time interval t 1 , second time interval t 2 , and third time interval t 3 .
- the predetermined thresholdmay be about two (2) microamperes for the first time interval t 1 , about two (2) microamperes for the second time interval t 2 , and about three (3) microamperes for the third time interval t 3 .
- the predetermined thresholdsmay be adjusted as a result of the following factors such as noise in the test meter, frequency of test current measurements, the area of the electrodes, the distance between the electrodes, the probability of a false positive identification of a double-dosing event, and the probability of a false negative identification of a double-dosing event.
- the method of identifying the double-dosing event using Equation 32can be performed for multiple portions of the test current transient.
- Equation 32can be more accurate than Equation 31 for identifying double-dosing events because the first test current and third test current provide a baseline correction.
- the double-dosing checkcan be performed at a time period just after the beginning of the first, second, and third time intervals because a peak typically occurs at the beginning of the time intervals. For example, the test currents measured at zero seconds to about 0.3, 1.05, and 4.05 seconds should be excluded from the double-dosing check.
- a maximum current checkcan be used to identify a test meter error or a test strip defect.
- An example of a test meter erroroccurs when the blood is detected late after it is dosed.
- An example of a defective test stripoccurs when the first and second electrode are shorted together.
- FIG. 23shows a test current transient where the test meter did not immediately detect the dosing of blood into the test strip (see solid line). In such a scenario, a late start will generate a significant amount of ferrocyanide before the second test voltage V 2 is applied causing a relatively large test current value to be observed. In contrast, when the test meter properly initiates the test voltage waveform once blood is applied, the test current values for the second time interval are much smaller, as illustrated by the dotted line in FIG. 23 .
- a late start eventcan cause an inaccurate glucose reading. Thus, it would be desirable to identify a late start event and then have the meter output an error message instead of outputting an inaccurate reading.
- a late start eventcauses the measured test current to be larger in magnitude because there is more time for the reagent layer to generate ferrocyanide. Thus, the increased test current values will likely distort the accuracy of the glucose concentration.
- a short between the first and second electrodecan cause the test current to increase.
- the magnitude of this increasedepends on the magnitude of the shunting resistance between the first and second electrode. If the shunting resistance is relatively low, a relatively large positive bias will be added to the test current causing a potentially inaccurate glucose response.
- Maximum current check( 1012 a , 1012 b , and 1012 c ) can be performed by comparing the absolute value of all of the measured test current values to a predetermined threshold and outputting an error message if the absolute value of one of the measured test current values is greater than the predetermined threshold.
- the predetermined thresholdcan be set to a different value for the first, second, and third test time intervals (t 1 , t 2 , and t 3 ). In one embodiment, the predetermined threshold may be about 50 microamperes for the first time interval t 1 , about 300 microamperes for the second time interval t 2 , and about 3000 microamperes for the third time interval t 3 .
- a minimum current checkcan be used to identify a false start of a glucose test, an improper time shift by a test meter, and a premature test strip removal.
- a false startcan occur when the test meter initiates a glucose test even though no sample has been applied to the test strip. Examples of situations that can cause a test meter to inadvertently initiate a test are an electrostatic discharge event (ESD) or a temporary short between first and second electrodes. Such events can cause a relatively large current to be observed for a least a short moment in time that initiates a test even though no liquid sample has been introduced into the test strip.
- ESDelectrostatic discharge event
- An inadvertent initiation of a glucose testcan cause a test meter to output a low glucose concentration even though no sample has yet been applied to the test strip.
- the test metershould provide an error message that instructs the user to re-insert the same test strip or to insert a new test strip for performing the test again.
- a time shifting error by the test metercan occur when the third test voltage V 3 is applied early or late.
- An early application of the third test voltage V 3should cause the test current value at the end of the second time interval t 2 to be a relatively large current value with a positive polarity instead of a relatively small current value with a negative polarity.
- a late application of the third test voltage V 3should cause the test current value at the beginning of the third time interval to be a relatively small current value with a negative polarity instead of a relatively large current value with a positive polarity.
- For both the early and late application of the third test voltage V 3there is a possibility of causing an inaccurate glucose result. Therefore, it would be desirable to identify a time shifting error by the test meter using the minimum current check so that an inaccurate glucose reading does not occur.
- a premature removal of a test strip from the test meter before the end of a glucose testcan also cause an inaccurate glucose reading to occur.
- a test strip removalwould cause the test current to change to a value close to zero potentially causing an inaccurate glucose output. Accordingly, it would also be desirable to identify a premature strip removal using a minimum current check so that an error message can be provided instead of displaying an inaccurate glucose reading.
- the minimum current checkmay be performed by comparing the absolute value of all of the measured test current values during the second and third time intervals (t 2 and t 3 ) to a predetermined threshold and outputting an error message if the absolute value of one of the measured test current values is less than a predetermined threshold.
- the predetermined thresholdmay be set to a different value for the second and third test time intervals. However, in one embodiment, the predetermined threshold may be about 1 microampere for the first time interval t 1 and the second time interval t 2 . Note that the minimum current check was not performed for the first time interval because the test current values are relatively small because the first test voltage V 1 is close in magnitude to the redox potential of the mediator.
- a high resistance trackcan be detected on a test strip that can result in an inaccurate glucose reading.
- a high resistance trackcan occur on a test strip that has an insulating scratch or a fouled electrode surface.
- scratchescan easily occur during the handling and manufacture of the test strip.
- a scratch that runs from one lateral edge 56 to another lateral edge 58 on first electrode layer 66can cause an increased resistance between first contact pads 67 and first electrode 166 .
- Sputtered metal filmstend to be very thin (e.g., 10 to 50 nm) making them prone to scratches during the handling and manufacture of the test strip.
- sputtered metal filmscan be fouled by exposure to volatile compounds such as hydrocarbons. This exposure causes an insulating film to form on the surface of the electrode, which increases the resistance.
- Another scenario that can cause a high resistance trackis when the sputtered metal film is too thin (e.g., ⁇ 10 nm).
- Yet another scenario that can cause a high resistance trackis when the test meter connectors do not form a sufficiently conductive contact to the test strip contact pads. For example, the presence of dried blood on the test meter connectors can prevent a sufficiently conductive contact to the test strip contact pads.
- FIG. 24shows two test current transients during a third time interval t 3 for a test strip having a high resistance track (squares) and a low resistance track (triangles).
- a sufficiently high track resistance R that is between the electrode and the electrode contact padcan substantially attenuate the magnitude of the effectively applied test voltage V eff , which in turn can attenuate the magnitude of the resulting test current.
- Rshould be a relatively small value (i.e., low track resistance).
- a low resistance trackmay be represented by an electrode layer having a resistivity of less than about 12 ohms per square and a high resistance track may be represented by an electrode layer having a resistivity of greater than about 40 ohms per square.
- a determination of whether a test strip has a high track resistancecan use an equation based on a first test current i 1 and a second test current i 2 that both occur during the third time interval t 3 .
- the first test current i 1may be measured at about a beginning of the third time interval t 3 (e.g., 4.05 seconds) where the magnitude is at a maximum or close to the maximum.
- the second test current i 2may be measured at about an end of the third time interval t 3 (e.g., 5 seconds) where the magnitude is at the minimum or close to the minimum.
- Equation 34The equation for identifying a high track resistance may be in the form of Equation 34:
- first ratio R 1i 1 i 1 - i 2 Eq . ⁇ 34 If first ratio R 1 is greater than a predetermined threshold, then the test meter may output an error message due to the test strip having a high resistance track.
- the predetermined thresholdmay be about 1.2. It is significant that the first test current i 1 is about a maximum current value because it is the most sensitive to resistance variations according to Equation 33. If a first test current i 1 is measured at a time that was closer to the minimum current value, then Equation 34 would be less sensitive for determining whether a high resistance track was present. It is advantageous to have relatively low variation in the first ratio R 1 when testing low resistance test strips. The relatively low variation decreases the likelihood of mistakenly identifying a high resistance track test strip.
- first ratio R 1 values for test strips having a low resistance trackis about four times lower when a first test current value i 1 was defined as a current value immediately after the application of the third test voltage V 3 , as opposed to being a sum of current values during the third time interval t 3 .
- first ratio R 1 values for low resistance test stripsthe probability of mistakenly identifying a high resistance track increases.
- FIG. 25is a chart showing a plurality of R 1 values calculated with Equation 34 for two test strip lots where one lot has a high resistance track and the other lot has a low resistance track.
- One lot of test stripwas purposely manufactured with a high resistance track by using palladium electrodes that were purposely fouled by an exposure to gas containing hydrocarbons for several weeks.
- the second test strip lotwas manufactured without purposely fouling the electrode surface.
- a roll of sputtered coated palladiumwas coated with MESA before coating with the reagent layer. All of the low resistance test strips which were not fouled, had R 1 values of less than 1.1 indicating that Equation 34 could identify low track resistance test strips.
- essentially all of the high resistance test strips, which were purposely fouledhad R 1 values of greater than 1.1 indicating that Equation 34 could identify high track resistance test strips.
- a leakagecan be detected on a test strip when the spacer 60 does not form a sufficiently strong liquid impermeable seal with the first electrode layer 66 .
- a leakageoccurs when liquid seeps in between the spacer 60 and the first electrode 166 and/or the second electrode 164 .
- FIG. 4Bshows a reagent layer 72 that is immediately adjacent to the walls of the spacer 60 .
- the reagent layer 72can be have an area larger than the cutout area 68 that causes a portion of the reagent layer 72 to be in between the spacer 60 and the first electrode layer 66 .
- FIG. 16shows test current transients during a third time interval t 3 for three different types of test strip lots where test strip lot 1 (squares) has a leakage of liquid between the spacer and the first electrode.
- Test strip lot 1was constructed using a dryer setting that did not sufficiently dry the reagent layer and also was laminated with a pressure setting that was not sufficient to form a liquid impermeable seal to the electrodes.
- the reagent layeris sufficiently dried so that an adhesive portion of the spacer 60 can intermingle with the reagent layer and still form a liquid impermeable seal to the first electrode layer 166 .
- sufficient pressuremust be applied so that the adhesive portion of the spacer 60 can form the liquid impermeable seal to the first electrode layer 166 .
- test strip lot 2was prepared similarly to test strip lot 1 except that they were stored at about 37 degrees Celsius for about two weeks. The storage of the test strip lot 2 caused the spacer to reform creating a liquid impermeable seal to the electrodes.
- Test strip lot 3was constructed using a dryer setting that was sufficient to dry the reagent layer and also was laminated with a pressure setting sufficient to form a liquid impermeable seal. Both test strip lots 2 and 3 (triangles and circles respectively) show a more rapid decay in the test current magnitude with time compared to test strip 1 (squares), as illustrated in FIG. 26 .
- a determination of whether a test strip leakscan be performed using an equation based on a first test current, a second test current, a third test current, and a fourth test current that occur during the third test time interval.
- a first logarithm of a second ratiocan be calculated based on a first test current i 1 and a second test current i 2 .
- a second logarithm of a third ratiocan be calculated based on a third test current i 3 and a fourth test current i 4 .
- An equationmay be used to calculate a fourth ratio R 4 based on the first logarithm and the second logarithm. If the fourth ratio R 4 is less than a predetermined ratio, then the test meter will output an error message due to leakage.
- the predetermined thresholdmay range from about 0.95 to about 1.
- the equation for identifying leakagecan be in the form of Equation 35:
- the first test current i 1 and the second test i 2 currentmay be about the two largest current values occurring the third time interval t 3
- the fourth test current i 4may be a smallest current value occurring the third time interval t 3
- the third test current i 3may be selected at a third test time so that a difference between the fourth test time and a third test time is greater than a difference between a second test time and a first test time.
- the first test current, the second test current, the third test current, and the fourth test currentmay be measured at about 4.1 seconds, 4.2 seconds, 4.5 seconds, and 5 seconds, respectively.
- FIG. 27is a chart showing a plurality of R 4 values calculated with Equation 35 for the three test strip lots described for FIG. 26 . Accordingly, test strip lot 1 has fourth ratio values less than one and both test strip lots 2 and 3 have fourth ratio R 4 values greater than one indicating that Equation 35 can successfully identify strip leakages.
- a determination of whether a test strip has a leakagecan be performed using an equation based on only three test current values instead of using four test current values as shown in Equation 35.
- the three test current valuesmay include a first test current i 1 , a third test current i 3 , and a fourth test current i 4 that all occur during the third test time interval t 3 .
- a third logarithm of a fifth ratiomay be calculated based on the first test current i 1 and the third test current i 3 .
- a second logarithm of a third ratiomay be calculated based on the third test current i 3 and the fourth test current i 4 .
- Equation 36An equation may be used to calculate a sixth ratio R 6 based on the third logarithm and the second logarithm. If R 6 is less than a predetermined ratio, then the test meter will output an error message due to leakage.
- the equation for identifying leakagemay be in the form of Equation 36:
Landscapes
- Health & Medical Sciences (AREA)
- Chemical & Material Sciences (AREA)
- Hematology (AREA)
- Life Sciences & Earth Sciences (AREA)
- Electrochemistry (AREA)
- Chemical Kinetics & Catalysis (AREA)
- Molecular Biology (AREA)
- Physics & Mathematics (AREA)
- Analytical Chemistry (AREA)
- Biochemistry (AREA)
- General Health & Medical Sciences (AREA)
- General Physics & Mathematics (AREA)
- Immunology (AREA)
- Pathology (AREA)
- Investigating Or Analysing Biological Materials (AREA)
Abstract
Description
where the term isumis the summation of current values and t is a time. The second reference value, sometimes referred to as the residual reaction index, can be obtained by a seventh ratio R7of current values during the second time interval and the third time interval, as shown in Eq. 2:
where abs represents an absolute function and 3.8 and 4.15 represent the time in seconds of the second and third time intervals, respectively, for this particular example. A discrimination criterion can be used to determine if the sample is either control solution or blood based on the first reference value of Eq. 1 and the second reference of Eq. 2. For example, the first reference value of Eq. 1 can be compared to a pre-determined threshold and the second reference value of Eq. 2 can be compared to a pre-determined threshold equation. The predetermined threshold may be about 12 microamperes. The pre-determined threshold equation can be based on a function using the first reference value of Eq. 1. More specifically, as illustrated by Eq. 3, the pre-determined threshold equation can be:
where Z1can be a constant such as, for example, about 0.2. Thus, the CS/
else the sample is a control solution.
Blood Glucose Algorithm
where a calculation of the steady-state current isscan be based on a mathematical model, an extrapolation, an average at a predetermined time interval, a combination thereof, or any number of other ways for calculating a steady-state current. Some examples of methods for calculating isscan be found in U.S. Pat. Nos. 5,942,102 and 6,413,410, each of which is hereby incorporated by reference in its entirety.
where the number 0.975 is about the time in seconds after the third test voltage V3is applied that corresponds to i(5), which, assuming a linear variation over the time between about 0.95 seconds and 1 second, is the average current between 0.95 and 1 second, the term D is assumed to be about 5×10⁻⁶cm2/sec as a typical diffusion coefficient in blood, and the term L is assumed to be about 0.0095 cm, which represents the height of the
and i3can be defined to be
where the first glucose concentration G1is the output of the blood glucose algorithm and the terms a, p, and z are constants that can be derived empirically.
CS Glucose Algorithm
H=K5ln(|i2|)+K6ln(G1)+K7 Eq. 8
where H is the hematocrit level, i2is at least one current value during the second time interval, K5is a fifth constant, K6is a sixth constant, and K7is a seventh constant. When GDH-PQQ is the enzyme, K5, K6, and K7may be about −76, 56, and 250, respectively. When FAD-GDH is the enzyme, K5, K6, and K7may be about −73.5, 58.8, and 213, respectively.
Corr=K1(HL−H)G1 Eq. 9
where K1is a first constant and HLis the lower predetermined hematocrit level. In one embodiment K1and HLmay be about −0.004 and about 30%, respectively.
Corr=K2(HL−H)(Gmax−G1) Eq. 10
where K2is a second constant and Gmaxis a predetermined maximum glucose concentration. In one embodiment K2and Gmaxmay be about −0.004 and about 600 mg/dL, respectively. The correction value Corr for
Corr=0 Eq. 11
however, if the first glucose concentration G1is not less than the lower predetermined glucose concentration GL, then the fourth function can be used to calculate the correction value Corr, as shown in a
Corr=K4(H−HU)(G1−GL) Eq. 12
where K4is a fourth constant, which may be about 0.011. The correction value Corr for Equation 12 may be restricted to a range of about zero to about six. Thus, if Corr is less than zero, then Corr is set to zero and if Corr is greater than six, then Corr is set to six.
G2=G1+Corr Eq. 13
If the first glucose concentration G1is not less than 100 mg/dL based on
After the second glucose concentration G2is calculated in either
Corr2=−K9(T−TRT)+K10×G2(T−TRT) Eq. 15
where Corr2is the correction value, K9is a ninth constant (e.g., 0.57 for GDH-PQQ and 0.89 for FAD-GDH), T is a temperature value, TRTis a room temperature value (e.g., 22° C.), K10is a tenth constant (e.g., 0.00023 for GDH-PQQ and 0.00077 for FAD-GDH), and G2is the second glucose concentration. When T is about equal to TRT, Corr2is about zero. In some instances, the first temperature function can be configured to have essentially no correction at room temperature such that variation can be reduced under routine ambient conditions. The second temperature function for calculating the second correction value Corr2can be in the form of Equation 16:
Corr2=−K11(T−TRT)+K12×G2(T−TRT)−K13×G2(T−T1)+K14×G2(T−T1) Eq. 16
where Corr2is the correction value, K11is an eleventh constant (e.g., 0.57 for GDH-PQQ and 0.89 for FAD-GDH), T is a temperature value, TRTis a room temperature value, K12is a twelfth constant (e.g., 0.00023 for GDH-PQQ and 0.00077 for FAD-GDH), G1 is a first glucose concentration, K13is a thirteenth constant (e.g., 0.63 for GDH-PQQ and 1.65 for FADGDH), T1is a first temperature threshold, and K14is a fourteenth constant (e.g., 0.0038 for GDH-PQQ and 0.0029 for FAD-GDH).
G3=G2+Corr2 Eq. 17
If G2is not less than 100 mg/dL, then an Equation 18 can be used to calculate the temperature corrected glucose concentration G3by dividing Corr2by one hundred, adding one; and then multiplying by the second glucose concentration G2:
G3=G2[1+0.01×Corr2] Eq. 18
Once a third glucose concentration is determined that has been corrected for the effects of temperature, the third glucose concentration can be outputted, as shown in a
Corr2=−K15(T−TRT)−K16×G2(T2−TRT)
where K15is a fifteenth constant (e.g., 0.27 for GDH-PQQ and 0.275 for FAD-GDH), T is a temperature value, TRTis a room temperature value (e.g., 22° C.), K16is a sixteenth constant (e.g., 0.0011 for GDH-PQQ and 0.00014 for FAD-GDH), and G2is the second glucose concentration.
i(t)=io+st+Isin(ωt+φ) Eq. 20
where the terms io+st represent the test current caused by the constant test voltage component. Generally, the DC current component is considered as changing linearly with time (due to the on-going glucose reaction generating ferrocyanide) and is thus represented by a constant io, which is the DC current at time zero (the zero crossing point), and s, the slope of the DC current change with time. The AC current component is represented by I sin(ω+φ), where I is the amplitude of the current wave, ω is its frequency, and φ is its phase shift relative to the input voltage wave. The term w can also be expressed as 2πf, where f is the frequency of the AC wave in Hertz. The term I can also be expressed as shown in Equation 21:
where V is the amplitude of the applied voltage signal and |Z| is the magnitude of the complex impedance. The term |Z| can also be expressed as shown in Equation 22:
where R is the real part of the impedance and C is the capacitance.
which can be simplified to Equation 24:
By substituting Eq. 21 into Eq. 20, then into Eq. 23, and then rearranging, Equation 25 results:
The integral term in Equation 25 can be approximated using a sum of currents shown in Equation 26:
where the test currents ikare summed from one quarter wavelength before the zero crossing point to one quarter wavelength past the zero crossing point. Substituting Equation 26 into Equation 25 yields Equation 27:
in which the DC offset current iocan be obtained by averaging the test current over one full sine cycle around the zero crossing point.
This is a reasonable assumption in this case as the uncoated electrode is polarized such that the DC, or real, component of the current flowing is independent of the voltage applied over the range of voltages used in the AC excitation. Accordingly, the real part of the impedance responding to the AC excitation is infinite, implying a pure capacitive element. Equation 28 can then be used with Equation 25 to yield a simplified capacitance equation that does not require an integral approximation. The net result is that capacitance measurements when summing the currents not around the voltage crossing point, but rather around the maximum AC component of the current, were more precise.
Capcorr=Cap−1.9×T Eq. 29
where Capcorris i the temperature corrected capacitance value, Cap is capacitance, and T is temperature.
Capcorr=Cap−0.56×T Eq. 30
The temperature-corrected capacitance values from
| TABLE 1 |
| Temperature-corrected capacitance values for complete fills |
| Parameter | All bloods results | All CS results | ||
| Mean capacitance (nF) | 515 | 664 | ||
| SD (nF) | 16 | 27 | ||
| Mean −4*SD (nF) | 451 | 556 | ||
Z2=abs(i(t+x))−abs(i(t))
where i(t) is a second test current, i(t+x) is a third test current, t is a time for the second test current, and x is an increment of time in between current measurements. If the value Z2is greater than a predetermined threshold of about three (3) microamperes, then the test meter may output an error message due to a double-dosing event. The predetermined thresholds disclosed herein are illustrative for use with
Y=2*abs(i(t))−abs(i(t−x))−abs(i(t+x))
where i(t) is a second test current, i(t−x) is a first test current, i(t+x) is a third test current, t is a time for the second test current, and x is an increment of time in between measurements, and abs represents an absolute function. If the summation value Y is greater than a predetermined threshold, then the test meter may output an error message due to a double-dosing event. The predetermined threshold may be set to a different value for the first time interval t1, second time interval t2, and third time interval t3.
Veff=V−i(t)R
Generally, Veffwill be the most attenuated at the beginning of the third time interval t3where the test current will generally have the highest magnitude. The combination of a relatively large R and a relatively large test current at the beginning of the third time interval t3can cause a significant attenuation in the applied test voltage. In turn, this could cause an attenuation of the resulting test current at the beginning of the third time interval t3, as illustrated in
If first ratio R1is greater than a predetermined threshold, then the test meter may output an error message due to the test strip having a high resistance track. The predetermined threshold may be about 1.2. It is significant that the first test current i1is about a maximum current value because it is the most sensitive to resistance variations according to Equation 33. If a first test current i1is measured at a time that was closer to the minimum current value, then Equation 34 would be less sensitive for determining whether a high resistance track was present. It is advantageous to have relatively low variation in the first ratio R1when testing low resistance test strips. The relatively low variation decreases the likelihood of mistakenly identifying a high resistance track test strip. As determined and described herein, the variation of first ratio R1values for test strips having a low resistance track is about four times lower when a first test current value i1was defined as a current value immediately after the application of the third test voltage V3, as opposed to being a sum of current values during the third time interval t3. When there is a high variation in first ratio R1values for low resistance test strips, the probability of mistakenly identifying a high resistance track increases.
In one embodiment, the first test current i1and the second test i2current may be about the two largest current values occurring the third time interval t3, the fourth test current i4may be a smallest current value occurring the third time interval t3, and the third test current i3may be selected at a third test time so that a difference between the fourth test time and a third test time is greater than a difference between a second test time and a first test time. In one illustrative embodiment, the first test current, the second test current, the third test current, and the fourth test current may be measured at about 4.1 seconds, 4.2 seconds, 4.5 seconds, and 5 seconds, respectively.
Claims (14)
Priority Applications (1)
| Application Number | Priority Date | Filing Date | Title |
|---|---|---|---|
| US13/620,448US9784707B2 (en) | 2008-06-09 | 2012-09-14 | System and method for measuring an analyte in a sample |
Applications Claiming Priority (3)
| Application Number | Priority Date | Filing Date | Title |
|---|---|---|---|
| US13157208P | 2008-06-09 | 2008-06-09 | |
| US12/464,935US8551320B2 (en) | 2008-06-09 | 2009-05-13 | System and method for measuring an analyte in a sample |
| US13/620,448US9784707B2 (en) | 2008-06-09 | 2012-09-14 | System and method for measuring an analyte in a sample |
Related Parent Applications (1)
| Application Number | Title | Priority Date | Filing Date |
|---|---|---|---|
| US12/464,935DivisionUS8551320B2 (en) | 2008-06-09 | 2009-05-13 | System and method for measuring an analyte in a sample |
Publications (2)
| Publication Number | Publication Date |
|---|---|
| US20130008804A1 US20130008804A1 (en) | 2013-01-10 |
| US9784707B2true US9784707B2 (en) | 2017-10-10 |
Family
ID=41327300
Family Applications (2)
| Application Number | Title | Priority Date | Filing Date |
|---|---|---|---|
| US12/464,935Active2030-10-08US8551320B2 (en) | 2008-06-09 | 2009-05-13 | System and method for measuring an analyte in a sample |
| US13/620,448ActiveUS9784707B2 (en) | 2008-06-09 | 2012-09-14 | System and method for measuring an analyte in a sample |
Family Applications Before (1)
| Application Number | Title | Priority Date | Filing Date |
|---|---|---|---|
| US12/464,935Active2030-10-08US8551320B2 (en) | 2008-06-09 | 2009-05-13 | System and method for measuring an analyte in a sample |
Country Status (6)
| Country | Link |
|---|---|
| US (2) | US8551320B2 (en) |
| EP (2) | EP2482069B1 (en) |
| JP (4) | JP5237201B2 (en) |
| AU (2) | AU2009202200B2 (en) |
| CA (1) | CA2668237C (en) |
| ES (2) | ES2647238T3 (en) |
Families Citing this family (135)
| Publication number | Priority date | Publication date | Assignee | Title |
|---|---|---|---|---|
| US6391005B1 (en) | 1998-03-30 | 2002-05-21 | Agilent Technologies, Inc. | Apparatus and method for penetration with shaft having a sensor for sensing penetration depth |
| US8641644B2 (en) | 2000-11-21 | 2014-02-04 | Sanofi-Aventis Deutschland Gmbh | Blood testing apparatus having a rotatable cartridge with multiple lancing elements and testing means |
| US7981056B2 (en) | 2002-04-19 | 2011-07-19 | Pelikan Technologies, Inc. | Methods and apparatus for lancet actuation |
| US8337419B2 (en) | 2002-04-19 | 2012-12-25 | Sanofi-Aventis Deutschland Gmbh | Tissue penetration device |
| US9795747B2 (en) | 2010-06-02 | 2017-10-24 | Sanofi-Aventis Deutschland Gmbh | Methods and apparatus for lancet actuation |
| US7041068B2 (en) | 2001-06-12 | 2006-05-09 | Pelikan Technologies, Inc. | Sampling module device and method |
| US9427532B2 (en) | 2001-06-12 | 2016-08-30 | Sanofi-Aventis Deutschland Gmbh | Tissue penetration device |
| EP1395185B1 (en) | 2001-06-12 | 2010-10-27 | Pelikan Technologies Inc. | Electric lancet actuator |
| JP4209767B2 (en) | 2001-06-12 | 2009-01-14 | ペリカン テクノロジーズ インコーポレイテッド | Self-optimized cutting instrument with adaptive means for temporary changes in skin properties |
| US7749174B2 (en) | 2001-06-12 | 2010-07-06 | Pelikan Technologies, Inc. | Method and apparatus for lancet launching device intergrated onto a blood-sampling cartridge |
| US7344507B2 (en) | 2002-04-19 | 2008-03-18 | Pelikan Technologies, Inc. | Method and apparatus for lancet actuation |
| US9226699B2 (en) | 2002-04-19 | 2016-01-05 | Sanofi-Aventis Deutschland Gmbh | Body fluid sampling module with a continuous compression tissue interface surface |
| US7004928B2 (en) | 2002-02-08 | 2006-02-28 | Rosedale Medical, Inc. | Autonomous, ambulatory analyte monitor or drug delivery device |
| US7976476B2 (en) | 2002-04-19 | 2011-07-12 | Pelikan Technologies, Inc. | Device and method for variable speed lancet |
| US9314194B2 (en) | 2002-04-19 | 2016-04-19 | Sanofi-Aventis Deutschland Gmbh | Tissue penetration device |
| US7297122B2 (en) | 2002-04-19 | 2007-11-20 | Pelikan Technologies, Inc. | Method and apparatus for penetrating tissue |
| US7331931B2 (en) | 2002-04-19 | 2008-02-19 | Pelikan Technologies, Inc. | Method and apparatus for penetrating tissue |
| US7674232B2 (en) | 2002-04-19 | 2010-03-09 | Pelikan Technologies, Inc. | Method and apparatus for penetrating tissue |
| US7547287B2 (en) | 2002-04-19 | 2009-06-16 | Pelikan Technologies, Inc. | Method and apparatus for penetrating tissue |
| US7491178B2 (en) | 2002-04-19 | 2009-02-17 | Pelikan Technologies, Inc. | Method and apparatus for penetrating tissue |
| US8372016B2 (en) | 2002-04-19 | 2013-02-12 | Sanofi-Aventis Deutschland Gmbh | Method and apparatus for body fluid sampling and analyte sensing |
| US8579831B2 (en) | 2002-04-19 | 2013-11-12 | Sanofi-Aventis Deutschland Gmbh | Method and apparatus for penetrating tissue |
| US8267870B2 (en) | 2002-04-19 | 2012-09-18 | Sanofi-Aventis Deutschland Gmbh | Method and apparatus for body fluid sampling with hybrid actuation |
| US8784335B2 (en) | 2002-04-19 | 2014-07-22 | Sanofi-Aventis Deutschland Gmbh | Body fluid sampling device with a capacitive sensor |
| US9248267B2 (en) | 2002-04-19 | 2016-02-02 | Sanofi-Aventis Deustchland Gmbh | Tissue penetration device |
| US7892183B2 (en) | 2002-04-19 | 2011-02-22 | Pelikan Technologies, Inc. | Method and apparatus for body fluid sampling and analyte sensing |
| US7232451B2 (en) | 2002-04-19 | 2007-06-19 | Pelikan Technologies, Inc. | Method and apparatus for penetrating tissue |
| US7901362B2 (en) | 2002-04-19 | 2011-03-08 | Pelikan Technologies, Inc. | Method and apparatus for penetrating tissue |
| US8221334B2 (en) | 2002-04-19 | 2012-07-17 | Sanofi-Aventis Deutschland Gmbh | Method and apparatus for penetrating tissue |
| US8360992B2 (en) | 2002-04-19 | 2013-01-29 | Sanofi-Aventis Deutschland Gmbh | Method and apparatus for penetrating tissue |
| US8702624B2 (en) | 2006-09-29 | 2014-04-22 | Sanofi-Aventis Deutschland Gmbh | Analyte measurement device with a single shot actuator |
| US7909778B2 (en) | 2002-04-19 | 2011-03-22 | Pelikan Technologies, Inc. | Method and apparatus for penetrating tissue |
| US9795334B2 (en) | 2002-04-19 | 2017-10-24 | Sanofi-Aventis Deutschland Gmbh | Method and apparatus for penetrating tissue |
| US7708701B2 (en) | 2002-04-19 | 2010-05-04 | Pelikan Technologies, Inc. | Method and apparatus for a multi-use body fluid sampling device |
| US7229458B2 (en) | 2002-04-19 | 2007-06-12 | Pelikan Technologies, Inc. | Method and apparatus for penetrating tissue |
| US8574895B2 (en) | 2002-12-30 | 2013-11-05 | Sanofi-Aventis Deutschland Gmbh | Method and apparatus using optical techniques to measure analyte levels |
| DE602004028463D1 (en) | 2003-05-30 | 2010-09-16 | Pelikan Technologies Inc | METHOD AND DEVICE FOR INJECTING LIQUID |
| US7850621B2 (en) | 2003-06-06 | 2010-12-14 | Pelikan Technologies, Inc. | Method and apparatus for body fluid sampling and analyte sensing |
| WO2006001797A1 (en) | 2004-06-14 | 2006-01-05 | Pelikan Technologies, Inc. | Low pain penetrating |
| US8282576B2 (en) | 2003-09-29 | 2012-10-09 | Sanofi-Aventis Deutschland Gmbh | Method and apparatus for an improved sample capture device |
| EP1680014A4 (en) | 2003-10-14 | 2009-01-21 | Pelikan Technologies Inc | METHOD AND DEVICE FOR A VARIABLE USER INTERFACE |
| US7822454B1 (en) | 2005-01-03 | 2010-10-26 | Pelikan Technologies, Inc. | Fluid sampling device with improved analyte detecting member configuration |
| US8668656B2 (en) | 2003-12-31 | 2014-03-11 | Sanofi-Aventis Deutschland Gmbh | Method and apparatus for improving fluidic flow and sample capture |
| WO2006011062A2 (en) | 2004-05-20 | 2006-02-02 | Albatros Technologies Gmbh & Co. Kg | Printable hydrogel for biosensors |
| US9775553B2 (en) | 2004-06-03 | 2017-10-03 | Sanofi-Aventis Deutschland Gmbh | Method and apparatus for a fluid sampling device |
| WO2005120365A1 (en) | 2004-06-03 | 2005-12-22 | Pelikan Technologies, Inc. | Method and apparatus for a fluid sampling device |
| US8652831B2 (en) | 2004-12-30 | 2014-02-18 | Sanofi-Aventis Deutschland Gmbh | Method and apparatus for analyte measurement test time |
| US20060281187A1 (en) | 2005-06-13 | 2006-12-14 | Rosedale Medical, Inc. | Analyte detection devices and methods with hematocrit/volume correction and feedback control |
| EP1928302B1 (en) | 2005-09-30 | 2012-08-01 | Intuity Medical, Inc. | Fully integrated wearable or handheld monitor |
| US8801631B2 (en) | 2005-09-30 | 2014-08-12 | Intuity Medical, Inc. | Devices and methods for facilitating fluid transport |
| US8529751B2 (en) | 2006-03-31 | 2013-09-10 | Lifescan, Inc. | Systems and methods for discriminating control solution from a physiological sample |
| US8778168B2 (en) | 2007-09-28 | 2014-07-15 | Lifescan, Inc. | Systems and methods of discriminating control solution from a physiological sample |
| JP5812603B2 (en)* | 2007-12-10 | 2015-11-17 | バイエル・ヘルスケア・エルエルシーBayer HealthCareLLC | Slope-based correction |
| US8603768B2 (en) | 2008-01-17 | 2013-12-10 | Lifescan, Inc. | System and method for measuring an analyte in a sample |
| EP2265324B1 (en) | 2008-04-11 | 2015-01-28 | Sanofi-Aventis Deutschland GmbH | Integrated analyte measurement system |
| US9833183B2 (en) | 2008-05-30 | 2017-12-05 | Intuity Medical, Inc. | Body fluid sampling device—sampling site interface |
| WO2009148624A1 (en) | 2008-06-06 | 2009-12-10 | Intuity Medical, Inc. | Detection meter and mode of operation |
| EP3984454A1 (en) | 2008-06-06 | 2022-04-20 | Intuity Medical, Inc. | Medical diagnostic devices and methods |
| US8551320B2 (en) | 2008-06-09 | 2013-10-08 | Lifescan, Inc. | System and method for measuring an analyte in a sample |
| US9375169B2 (en) | 2009-01-30 | 2016-06-28 | Sanofi-Aventis Deutschland Gmbh | Cam drive for managing disposable penetrating member actions with a single motor and motor and control system |
| JP5422647B2 (en) | 2009-05-29 | 2014-02-19 | パナソニック株式会社 | Biosensor system and method for measuring concentration of analyte |
| US8323467B2 (en)* | 2009-10-27 | 2012-12-04 | Lifescan Scotland Limited | Dual chamber, multi-analyte test strip with opposing electrodes |
| EP2506768B1 (en) | 2009-11-30 | 2016-07-06 | Intuity Medical, Inc. | Calibration material delivery devices and methods |
| KR100980316B1 (en)* | 2009-12-09 | 2010-09-06 | 동진메디칼 주식회사 | Strip having thermal compensating function and method for measuring blood sugar using it |
| IL209760A (en)* | 2009-12-11 | 2015-05-31 | Lifescan Scotland Ltd | Fill sufficiency method and system |
| US8101065B2 (en)* | 2009-12-30 | 2012-01-24 | Lifescan, Inc. | Systems, devices, and methods for improving accuracy of biosensors using fill time |
| US8877034B2 (en) | 2009-12-30 | 2014-11-04 | Lifescan, Inc. | Systems, devices, and methods for measuring whole blood hematocrit based on initial fill velocity |
| US8391940B2 (en)* | 2010-02-04 | 2013-03-05 | Lifescan, Inc. | Methods and systems to correct for hematocrit effects |
| US8773106B2 (en) | 2010-02-25 | 2014-07-08 | Lifescan Scotland Limited | Capacitance detection in electrochemical assay with improved sampling time offset |
| US8742773B2 (en) | 2010-02-25 | 2014-06-03 | Lifescan Scotland Limited | Capacitance detection in electrochemical assay with improved response |
| WO2011104517A2 (en) | 2010-02-25 | 2011-09-01 | Lifescan Scotland Limited | Capacitance detection in electrochemical assay |
| US20110208435A1 (en)* | 2010-02-25 | 2011-08-25 | Lifescan Scotland Ltd. | Capacitance detection in electrochemical assays |
| EP2540224B1 (en)* | 2010-02-26 | 2020-04-01 | ARKRAY, Inc. | Analysis device, analysis method, and analysis system |
| EP2565637A3 (en) | 2010-03-31 | 2013-04-03 | Lifescan Scotland Limited | Electrochemical analyte measurement method and system |
| US8965476B2 (en) | 2010-04-16 | 2015-02-24 | Sanofi-Aventis Deutschland Gmbh | Tissue penetration device |
| CA2803797A1 (en) | 2010-06-25 | 2011-12-29 | Intuity Medical, Inc. | Analyte monitoring methods and systems |
| KR101899307B1 (en) | 2010-07-19 | 2018-09-18 | 시락 게엠베하 인터내셔날 | System and method for measuring an analyte in a sample |
| CA2807117A1 (en)* | 2010-08-02 | 2012-02-09 | Cilag Gmbh International | Systems and methods for improved accuracy for temperature correction of glucose results for control solution |
| US8603323B2 (en) | 2010-09-20 | 2013-12-10 | Lifescan, Inc. | Apparatus and process for improved measurements of a monitoring device |
| US8932445B2 (en)* | 2010-09-30 | 2015-01-13 | Cilag Gmbh International | Systems and methods for improved stability of electrochemical sensors |
| US8617370B2 (en)* | 2010-09-30 | 2013-12-31 | Cilag Gmbh International | Systems and methods of discriminating between a control sample and a test fluid using capacitance |
| EP3901624B1 (en)* | 2010-12-22 | 2024-01-31 | Roche Diabetes Care GmbH | Methods to compensate for sources of error during electrochemical testing |
| US9632054B2 (en) | 2010-12-31 | 2017-04-25 | Cilag Gmbh International | Systems and methods for high accuracy analyte measurement |
| EP2679992B1 (en)* | 2011-02-23 | 2019-10-23 | PHC Holdings Corporation | Biological sample measuring system |
| RU2605292C2 (en)* | 2011-05-27 | 2016-12-20 | Лайфскэн Скотлэнд Лимитед | Peak offset correction for analyte test strip, used for measuring analyte content |
| US9782114B2 (en) | 2011-08-03 | 2017-10-10 | Intuity Medical, Inc. | Devices and methods for body fluid sampling and analysis |
| US8475733B2 (en) | 2011-08-04 | 2013-07-02 | Cilag Gmbh International | Hand-held test meter and analytical test strip cartridge assembly with desiccant vial |
| US8580576B2 (en) | 2011-08-04 | 2013-11-12 | Cilag Gmbh International | Method for bodily fluid sample transfer during analyte determination |
| US20130084590A1 (en)* | 2011-09-30 | 2013-04-04 | Lifescan Scotland Ltd. | Analytical test strip with bodily fluid phase-shift measurement electrodes |
| US8840776B2 (en)* | 2011-10-25 | 2014-09-23 | Bionime Corporation | Method and sensor strip for analysis of a sample |
| EP2781914A1 (en)* | 2011-11-18 | 2014-09-24 | Murata Manufacturing Co., Ltd. | Method for measuring hematocrit levels, quantitative analysis method using said measurement method, and sensor chip |
| US9903830B2 (en) | 2011-12-29 | 2018-02-27 | Lifescan Scotland Limited | Accurate analyte measurements for electrochemical test strip based on sensed physical characteristic(s) of the sample containing the analyte |
| US8709232B2 (en)* | 2012-04-30 | 2014-04-29 | Cilag Gmbh International | Analyte measurement technique and system |
| US9201038B2 (en) | 2012-07-24 | 2015-12-01 | Lifescan Scotland Limited | System and methods to account for interferents in a glucose biosensor |
| MX355854B (en)* | 2012-07-27 | 2018-05-03 | Ascensia Diabetes Care Holdings Ag | System and method for detecting used and dried sensors. |
| EP2919000B1 (en)* | 2012-12-12 | 2019-05-08 | PHC Holdings Corporation | Blood component measuring device and method for measuring blood component |
| CA2900885C (en) | 2013-03-15 | 2017-12-19 | F. Hoffmann-La Roche Ag | Methods of electrochemically measuring an analyte with a test sequence having a pulsed dc block as well as devices, apparatuses and systems incorporating the same |
| KR101732300B1 (en) | 2013-03-15 | 2017-05-02 | 에프. 호프만-라 로슈 아게 | Methods of failsafing electrochemical measurements of an analyte as well as devices, apparatuses and systems incorporating the same |
| CA2949906C (en)* | 2013-03-15 | 2019-04-02 | F. Hoffmann-La Roche Ag | Methods of scaling data used to construct biosensor algorithms as well as devices, apparatuses and systems incorporating the same |
| CN105190299B (en) | 2013-03-15 | 2018-04-20 | 豪夫迈·罗氏有限公司 | The method based on descriptor of electrochemical measurement analyte and the unit and system with reference to this method |
| CN105247356B (en) | 2013-03-15 | 2017-11-07 | 豪夫迈·罗氏有限公司 | Methods of using information from recovery pulses in electrochemical analyte measurements and devices, devices and systems incorporating said methods |
| KR101743382B1 (en) | 2013-03-15 | 2017-06-02 | 에프. 호프만-라 로슈 아게 | Methods of detecting high antioxidant levels during electrochemical measurements and failsafing an analyte concentration therefrom as well as devices, apparatuses and systems incorporting the same |
| US20140299483A1 (en) | 2013-04-05 | 2014-10-09 | Lifescan Scotland Limited | Analyte meter and method of operation |
| US9274098B2 (en) | 2013-04-30 | 2016-03-01 | Lifescan Scotland Limited | Analyte meter digital sample detection |
| US20140318987A1 (en) | 2013-04-30 | 2014-10-30 | Lifescan Scotland Limited | Analyte meter test strip detection |
| GB2515299B (en) | 2013-06-18 | 2015-12-30 | Suresensors Ltd | Methods and apparatus for determining analyte in a sample |
| US9354194B2 (en) | 2013-06-19 | 2016-05-31 | Cilag Gmbh International | Orientation independent meter |
| WO2014205412A1 (en) | 2013-06-21 | 2014-12-24 | Intuity Medical, Inc. | Analyte monitoring system with audible feedback |
| US9435762B2 (en)* | 2013-06-27 | 2016-09-06 | Lifescan Scotland Limited | Fill error trap for an analyte measurement determined from a specified sampling time derived from a sensed physical characteristic of the sample containing the analyte |
| US9835578B2 (en)* | 2013-06-27 | 2017-12-05 | Lifescan Scotland Limited | Temperature compensation for an analyte measurement determined from a specified sampling time derived from a sensed physical characteristic of the sample containing the analyte |
| US20150050678A1 (en) | 2013-08-13 | 2015-02-19 | Lifescan Scotland Limited | Modular analytical test meter |
| US9383332B2 (en) | 2013-09-24 | 2016-07-05 | Lifescan Scotland Limited | Analytical test strip with integrated battery |
| US20150144507A1 (en)* | 2013-11-22 | 2015-05-28 | Cilag Gmbh International | Folded biosensor |
| US20150177256A1 (en) | 2013-12-23 | 2015-06-25 | Cilag Gmbh International | Test strip sample application video system |
| US9500616B2 (en) | 2013-12-23 | 2016-11-22 | Cilag Gmbh International | Multi-orientation test strip |
| US20150176053A1 (en) | 2013-12-23 | 2015-06-25 | Cilag Gmbh International | Test strip insertion drive mechanism for analyte meter |
| US20150176049A1 (en) | 2013-12-23 | 2015-06-25 | Cilag Gmbh International | Determining usability of analytical test strip |
| US9575051B2 (en) | 2013-12-23 | 2017-02-21 | Cilag Gmbh International | Test strip connector contact protection |
| US9442089B2 (en) | 2013-12-23 | 2016-09-13 | Lifescan Scotland Limited | Analyte meter test strip detection |
| TWI512287B (en)* | 2014-03-31 | 2015-12-11 | Taidoc Technology Corp | Electrochemical biosensor device, system and detection method with sample detection function |
| US20160091451A1 (en)* | 2014-09-25 | 2016-03-31 | Lifescan Scotland Limited | Accurate analyte measurements for electrochemical test strip to determine analyte measurement time based on measured temperature, physical characteristic and estimated analyte value |
| JP6654383B2 (en)* | 2014-10-03 | 2020-02-26 | アークレイ株式会社 | Measuring device, detecting method, electrochemical sensor and measuring system |
| US20160178559A1 (en) | 2014-12-17 | 2016-06-23 | Lifescan Scotland Limited | Universal strip port connector |
| US20160178574A1 (en)* | 2014-12-17 | 2016-06-23 | Cilag Gmbh International | Test strip and method to determine test strip compatibility |
| JP6779210B2 (en)* | 2014-12-19 | 2020-11-04 | エフ.ホフマン−ラ ロシュ アーゲーF. Hoffmann−La Roche Aktiengesellschaft | Inspection element for electrochemical detection of at least one analyte |
| US10369567B2 (en)* | 2015-11-04 | 2019-08-06 | International Business Machines Corporation | Continuous, capacitance-based monitoring of liquid flows in a microfluidic device |
| JP6403653B2 (en)* | 2015-11-05 | 2018-10-10 | シラグ・ゲーエムベーハー・インターナショナルCilag GMBH International | High accuracy analyte measurement system and method |
| JP6680702B2 (en)* | 2017-01-27 | 2020-04-15 | シラグ・ゲーエムベーハー・インターナショナルCilag GMBH International | High accuracy analyte measurement system and method |
| US11408881B2 (en)* | 2017-05-04 | 2022-08-09 | Roche Diabetes Care, Inc. | Test meter and method for detecting undue pressure applied to an inserated test strip |
| CN207528678U (en)* | 2017-12-05 | 2018-06-22 | 禅谱科技股份有限公司 | Electrochemical analyzer |
| JP6609001B2 (en)* | 2018-06-04 | 2019-11-20 | シラグ・ゲーエムベーハー・インターナショナル | High accuracy analyte measurement system and method |
| US11035819B2 (en)* | 2018-06-28 | 2021-06-15 | Lifescan Ip Holdings, Llc | Method for determining analyte concentration in a sample technical field |
| CN109884150B (en)* | 2019-03-08 | 2021-05-14 | 武汉璟泓科技股份有限公司 | Erythrocyte backlog correction method and storage medium |
| US20200378917A1 (en)* | 2019-05-29 | 2020-12-03 | Hach Company | Electrochemistry sensor housing |
| CN115426608B (en)* | 2022-09-26 | 2025-04-04 | 深圳市豪恩声学股份有限公司 | Headphone operation test collection method, device, computer equipment and storage medium |
Citations (209)
| Publication number | Priority date | Publication date | Assignee | Title |
|---|---|---|---|---|
| US3648160A (en) | 1969-12-01 | 1972-03-07 | Technicon Corp | Method and apparatus for the highly accurate, automatic determination of the hematocrit of whole blood samples |
| US4088448A (en) | 1975-09-29 | 1978-05-09 | Lilja Jan Evert | Apparatus for sampling, mixing the sample with a reagent and making particularly optical analyses |
| GB2020424A (en) | 1978-05-05 | 1979-11-14 | Baker Chem Co J T | Determination of glucose |
| US4224125A (en) | 1977-09-28 | 1980-09-23 | Matsushita Electric Industrial Co., Ltd. | Enzyme electrode |
| US4233029A (en) | 1978-10-25 | 1980-11-11 | Eastman Kodak Company | Liquid transport device and method |
| US4250257A (en) | 1978-08-24 | 1981-02-10 | Technicon Instruments Corporation | Whole blood analyses in porous media |
| US4254083A (en) | 1979-07-23 | 1981-03-03 | Eastman Kodak Company | Structural configuration for transport of a liquid drop through an ingress aperture |
| US4259165A (en) | 1978-12-20 | 1981-03-31 | Hokushin Electric Works, Ltd. | Dissolved oxygen probe |
| US4301412A (en) | 1979-10-29 | 1981-11-17 | United States Surgical Corporation | Liquid conductivity measuring system and sample cards therefor |
| US4301414A (en) | 1979-10-29 | 1981-11-17 | United States Surgical Corporation | Disposable sample card and method of making same |
| US4303887A (en) | 1979-10-29 | 1981-12-01 | United States Surgical Corporation | Electrical liquid conductivity measuring system |
| US4307188A (en) | 1979-09-06 | 1981-12-22 | Miles Laboratories, Inc. | Precursor indicator compositions |
| DE3103464A1 (en) | 1981-02-02 | 1982-08-05 | Gkss - Forschungszentrum Geesthacht Gmbh, 2054 Geesthacht | Sealing frame for electrodialysis membrane stack |
| US4374013A (en) | 1980-03-05 | 1983-02-15 | Enfors Sven Olof | Oxygen stabilized enzyme electrode |
| US4404066A (en) | 1980-08-25 | 1983-09-13 | The Yellow Springs Instrument Company | Method for quantitatively determining a particular substrate catalyzed by a multisubstrate enzyme |
| US4431004A (en) | 1981-10-27 | 1984-02-14 | Bessman Samuel P | Implantable glucose sensor |
| US4436812A (en) | 1980-10-29 | 1984-03-13 | Fuji Electric Co., Ltd. | Process of calibrating a blood sugar analyzing apparatus |
| US4508613A (en) | 1983-12-19 | 1985-04-02 | Gould Inc. | Miniaturized potassium ion sensor |
| US4517291A (en) | 1983-08-15 | 1985-05-14 | E. I. Du Pont De Nemours And Company | Biological detection process using polymer-coated electrodes |
| US4517287A (en) | 1979-04-04 | 1985-05-14 | Boehringer Mannheim Gmbh | Method and reagent for the enzymatic determination of enzyme substrates |
| US4533440A (en) | 1983-08-04 | 1985-08-06 | General Electric Company | Method for continuous measurement of the sulfite/sulfate ratio |
| GB2154735A (en) | 1984-01-27 | 1985-09-11 | Menarini Sas | Reagent for determining blood glucose content |
| US4545382A (en) | 1981-10-23 | 1985-10-08 | Genetics International, Inc. | Sensor for components of a liquid mixture |
| US4547735A (en) | 1982-01-23 | 1985-10-15 | Holger Kiesewetter | Instrument for measuring the hematocrit value of blood |
| US4552840A (en) | 1982-12-02 | 1985-11-12 | California And Hawaiian Sugar Company | Enzyme electrode and method for dextran analysis |
| EP0171375A1 (en) | 1984-07-09 | 1986-02-12 | Institut Cerac S.A. | High pressure water valve |
| EP0172969A2 (en) | 1983-11-12 | 1986-03-05 | Lion Laboratories Limited | Discriminant analysis of gas constituents |
| US4629563A (en) | 1980-03-14 | 1986-12-16 | Brunswick Corporation | Asymmetric membranes |
| US4654197A (en) | 1983-10-18 | 1987-03-31 | Aktiebolaget Leo | Cuvette for sampling and analysis |
| US4664119A (en) | 1985-12-04 | 1987-05-12 | University Of Southern California | Transcutaneous galvanic electrode oxygen sensor |
| US4686479A (en) | 1985-07-22 | 1987-08-11 | Young Chung C | Apparatus and control kit for analyzing blood sample values including hematocrit |
| SU1351627A2 (en) | 1986-03-27 | 1987-11-15 | Томский инженерно-строительный институт | Filtering element |
| US4711245A (en) | 1983-05-05 | 1987-12-08 | Genetics International, Inc. | Sensor for components of a liquid mixture |
| EP0251915A2 (en) | 1986-06-27 | 1988-01-07 | Terumo Kabushiki Kaisha | Enzyme sensor |
| EP0255291A1 (en) | 1986-07-23 | 1988-02-03 | Unilever Plc | Method and apparatus for electrochemical measurements |
| EP0266204A2 (en) | 1986-10-31 | 1988-05-04 | Kingston Technologies, Inc. | Pressure dependent anisotropic transport membrane system |
| EP0278647A2 (en) | 1987-02-09 | 1988-08-17 | AT&T Corp. | Electronchemical processes involving enzymes |
| GB2201248A (en) | 1987-02-24 | 1988-08-24 | Ici Plc | Enzyme electrode sensors |
| US4774039A (en) | 1980-03-14 | 1988-09-27 | Brunswick Corporation | Dispersing casting of integral skinned highly asymmetric polymer membranes |
| EP0290770A2 (en) | 1987-05-14 | 1988-11-17 | Ace Medical Company | Pressure sensor |
| US4790925A (en) | 1987-09-18 | 1988-12-13 | Mine Safety Appliances Company | Electrochemical gas sensor |
| EP0299779A2 (en) | 1987-07-15 | 1989-01-18 | Sri International | Fast response time microsensors for gaseous and vaporous species |
| WO1989008713A1 (en) | 1988-03-15 | 1989-09-21 | Life-Chek Laboratories | Method and apparatus for amperometric diagnostic analysis |
| EP0351891A2 (en) | 1983-05-05 | 1990-01-24 | MediSense, Inc. | Printed electrodes |
| EP0351516A2 (en) | 1988-07-18 | 1990-01-24 | Martin J. Patko | Precalibrated, disposable, electrochemical sensors |
| US4900424A (en) | 1986-11-28 | 1990-02-13 | Unilever Patent Holdings B.V. | Electrochemical measurement cell |
| EP0359831A1 (en) | 1988-03-31 | 1990-03-28 | Matsushita Electric Industrial Co., Ltd. | Biosensor and process for its production |
| US4919770A (en) | 1982-07-30 | 1990-04-24 | Siemens Aktiengesellschaft | Method for determining the concentration of electro-chemically convertible substances |
| US4963815A (en) | 1987-07-10 | 1990-10-16 | Molecular Devices Corporation | Photoresponsive electrode for determination of redox potential |
| EP0400918A1 (en) | 1989-05-31 | 1990-12-05 | Nakano Vinegar Co., Ltd. | Enzyme sensor |
| GB2235050A (en) | 1989-08-14 | 1991-02-20 | Sieger Ltd | Electrochemical gas sensor |
| EP0418404A1 (en) | 1989-09-15 | 1991-03-27 | Hewlett-Packard GmbH | Method of determining optimum operating conditions in an electrochemical detector and electrochemical detector using the method |
| JPH0399254A (en) | 1989-09-13 | 1991-04-24 | Toyota Central Res & Dev Lab Inc | hematocrit measuring device |
| WO1991009373A1 (en) | 1989-12-15 | 1991-06-27 | Boehringer Mannheim Corporation | Biosensing instrument and method |
| JPH03167464A (en) | 1989-11-27 | 1991-07-19 | Yamatake Honeywell Co Ltd | Manufacturing method of moisture sensing element |
| EP0451981A2 (en) | 1990-03-26 | 1991-10-16 | Cascade Medical, Inc. | Disposable reagent unit |
| US5059908A (en) | 1990-05-31 | 1991-10-22 | Capital Controls Company, Inc. | Amperimetric measurement with cell electrode deplating |
| US5064516A (en) | 1987-07-16 | 1991-11-12 | Gas Research Institute | Measuring gas levels |
| US5089320A (en) | 1989-01-09 | 1992-02-18 | James River Ii, Inc. | Resealable packaging material |
| JPH0466112A (en) | 1990-07-03 | 1992-03-02 | Ube Ind Ltd | How to determine transport conditions in membrane transport |
| US5108564A (en) | 1988-03-15 | 1992-04-28 | Tall Oak Ventures | Method and apparatus for amperometric diagnostic analysis |
| US5122244A (en) | 1990-02-03 | 1992-06-16 | Boehringer Mannheim Gmbh | Method and sensor electrode system for the electrochemical determination of an analyte or an oxidoreductase as well as the use of suitable compounds therefor |
| US5126034A (en) | 1988-07-21 | 1992-06-30 | Medisense, Inc. | Bioelectrochemical electrodes |
| US5141868A (en) | 1984-06-13 | 1992-08-25 | Internationale Octrooi Maatschappij "Octropa" Bv | Device for use in chemical test procedures |
| WO1992015701A1 (en) | 1991-02-27 | 1992-09-17 | Boehringer Mannheim Corporation | Improved method and reagent for determination of an analyte |
| US5151166A (en) | 1989-10-02 | 1992-09-29 | Normalair-Garrett (Holdings) Limited | Oxygen monitoring method and apparatus |
| JPH04343065A (en) | 1991-05-17 | 1992-11-30 | Ngk Spark Plug Co Ltd | Biosensor |
| US5171689A (en) | 1984-11-08 | 1992-12-15 | Matsushita Electric Industrial Co., Ltd. | Solid state bio-sensor |
| JPH052007A (en) | 1991-06-24 | 1993-01-08 | Nippon Telegr & Teleph Corp <Ntt> | Wall-jet type electrochemical detector and method for producing the same |
| US5192415A (en) | 1991-03-04 | 1993-03-09 | Matsushita Electric Industrial Co., Ltd. | Biosensor utilizing enzyme and a method for producing the same |
| AU3104293A (en) | 1992-01-14 | 1993-07-15 | Commonwealth Scientific And Industrial Research Organisation | Viscometer |
| US5229282A (en) | 1989-11-24 | 1993-07-20 | Matsushita Electric Industrial Co., Ltd. | Preparation of biosensor having a layer containing an enzyme, electron acceptor and hydrophilic polymer on an electrode system |
| EP0560336A1 (en) | 1992-03-12 | 1993-09-15 | Matsushita Electric Industrial Co., Ltd. | A catalyst made from phosphate and a biosensor including the same |
| US5272060A (en) | 1989-07-13 | 1993-12-21 | Kyoto Daiichi Kagaku Co., Ltd. | Method for determination of glucose concentration in whole blood |
| US5272087A (en) | 1988-04-20 | 1993-12-21 | Centre National De La Recherche Scientifique (C.N.R.S.) | Enzymatic electrode and its preparation method |
| US5282950A (en) | 1991-07-15 | 1994-02-01 | Boehringer Mannheim Gmbh | Electrochemical analysis system |
| WO1994002842A1 (en) | 1992-07-28 | 1994-02-03 | The Victoria University Of Manchester | Analytical method for the detection and measurement of paracetamol |
| US5312590A (en) | 1989-04-24 | 1994-05-17 | National University Of Singapore | Amperometric sensor for single and multicomponent analysis |
| US5320732A (en) | 1990-07-20 | 1994-06-14 | Matsushita Electric Industrial Co., Ltd. | Biosensor and measuring apparatus using the same |
| AU5487394A (en) | 1993-02-04 | 1994-08-11 | Asulab S.A. | Electrochemical measuring system with multizone sensors |
| JPH06222874A (en) | 1993-01-26 | 1994-08-12 | Sharp Corp | Position input device |
| US5352351A (en) | 1993-06-08 | 1994-10-04 | Boehringer Mannheim Corporation | Biosensing meter with fail/safe procedures to prevent erroneous indications |
| US5382346A (en) | 1991-05-17 | 1995-01-17 | Kyoto Daiichi Kagaku Co., Ltd. | Biosensor and method of quantitative analysis using the same |
| US5384028A (en) | 1992-08-28 | 1995-01-24 | Nec Corporation | Biosensor with a data memory |
| US5385846A (en) | 1993-06-03 | 1995-01-31 | Boehringer Mannheim Corporation | Biosensor and method for hematocrit determination |
| US5388163A (en) | 1991-12-23 | 1995-02-07 | At&T Corp. | Electret transducer array and fabrication technique |
| US5393399A (en) | 1992-09-07 | 1995-02-28 | Gie Cylergie | Amperometric measuring device having an electrochemical sensor |
| US5405511A (en) | 1993-06-08 | 1995-04-11 | Boehringer Mannheim Corporation | Biosensing meter with ambient temperature estimation method and system |
| US5413690A (en) | 1993-07-23 | 1995-05-09 | Boehringer Mannheim Corporation | Potentiometric biosensor and the method of its use |
| WO1995016198A1 (en) | 1993-12-08 | 1995-06-15 | Unilever Plc | Methods and apparatus for electrochemical measurements |
| US5437999A (en) | 1994-02-22 | 1995-08-01 | Boehringer Mannheim Corporation | Electrochemical sensor |
| US5469369A (en) | 1992-11-02 | 1995-11-21 | The United States Of America As Represented By The Secretary Of The Navy | Smart sensor system and method using a surface acoustic wave vapor sensor array and pattern recognition for selective trace organic vapor detection |
| US5508203A (en) | 1993-08-06 | 1996-04-16 | Fuller; Milton E. | Apparatus and method for radio frequency spectroscopy using spectral analysis |
| US5508171A (en) | 1989-12-15 | 1996-04-16 | Boehringer Mannheim Corporation | Assay method with enzyme electrode system |
| US5509410A (en) | 1983-06-06 | 1996-04-23 | Medisense, Inc. | Strip electrode including screen printing of a single layer |
| US5520787A (en) | 1994-02-09 | 1996-05-28 | Abbott Laboratories | Diagnostic flow cell device |
| US5527446A (en) | 1995-04-13 | 1996-06-18 | United States Of America As Represented By The Secretary Of The Air Force | Gas sensor |
| US5567302A (en) | 1995-06-07 | 1996-10-22 | Molecular Devices Corporation | Electrochemical system for rapid detection of biochemical agents that catalyze a redox potential change |
| WO1997000441A1 (en) | 1995-06-19 | 1997-01-03 | Memtec America Corporation | Electrochemical cell |
| US5611908A (en) | 1994-12-22 | 1997-03-18 | Dr agerwerk Aktiengesellschaft | Method of operating and amperometric measuring cell |
| US5620579A (en) | 1995-05-05 | 1997-04-15 | Bayer Corporation | Apparatus for reduction of bias in amperometric sensors |
| US5628890A (en) | 1995-09-27 | 1997-05-13 | Medisense, Inc. | Electrochemical sensor |
| WO1997018465A1 (en) | 1995-11-16 | 1997-05-22 | Memtec America Corporation | Electrochemical method |
| US5642734A (en) | 1990-10-04 | 1997-07-01 | Microcor, Inc. | Method and apparatus for noninvasively determining hematocrit |
| US5660791A (en) | 1996-06-06 | 1997-08-26 | Bayer Corporation | Fluid testing sensor for use in dispensing instrument |
| EP0800086A1 (en) | 1996-04-01 | 1997-10-08 | Bayer Corporation | Control solution and method for testing the performance of an electrochemical device for determining the concentration of an analyte in blood |
| US5762770A (en) | 1994-02-21 | 1998-06-09 | Boehringer Mannheim Corporation | Electrochemical biosensor test strip |
| US5849174A (en) | 1994-08-01 | 1998-12-15 | Medisense, Inc. | Electrodes and their use in analysis |
| US5869971A (en) | 1996-05-17 | 1999-02-09 | Sendx Medical, Inc. | Method and apparatus for ratiometric measurement of hematocrit |
| US5909114A (en) | 1992-10-28 | 1999-06-01 | Nakano Vinegar Co., Ltd. | Coulometric analysis method and a device therefor |
| JPH11230934A (en) | 1998-02-17 | 1999-08-27 | Kdk Corp | Sample discriminating method |
| US5997817A (en) | 1997-12-05 | 1999-12-07 | Roche Diagnostics Corporation | Electrochemical biosensor test strip |
| WO2000020626A1 (en) | 1998-10-08 | 2000-04-13 | Therasense, Inc. | Small volume in vitro analyte sensor with diffusible or non-leachable redox mediator |
| US6058934A (en) | 1995-11-02 | 2000-05-09 | Chiron Diagnostics Corporation | Planar hematocrit sensor incorporating a seven-electrode conductivity measurement cell |
| US6071391A (en) | 1997-09-12 | 2000-06-06 | Nok Corporation | Enzyme electrode structure |
| EP1042667A1 (en) | 1997-12-22 | 2000-10-11 | Roche Diagnostics Corporation | Meter |
| JP3099254B2 (en) | 1994-02-28 | 2000-10-16 | 安藤電気株式会社 | Suction hand with floating mechanism and transfer contact mechanism |
| US6153069A (en) | 1995-02-09 | 2000-11-28 | Tall Oak Ventures | Apparatus for amperometric Diagnostic analysis |
| US6193873B1 (en) | 1999-06-15 | 2001-02-27 | Lifescan, Inc. | Sample detection to initiate timing of an electrochemical assay |
| JP2001066274A (en) | 1999-08-27 | 2001-03-16 | Omron Corp | Method for evaluating biosensor |
| JP3167464B2 (en) | 1992-11-26 | 2001-05-21 | 富士電機株式会社 | Inverter fault diagnosis device |
| WO2001040787A1 (en) | 1999-11-29 | 2001-06-07 | Matsushita Electric Industrial Co., Ltd. | Sample discriminating method |
| US6251260B1 (en) | 1998-08-24 | 2001-06-26 | Therasense, Inc. | Potentiometric sensors for analytic determination |
| WO2001057510A2 (en) | 2000-02-02 | 2001-08-09 | Lifescan, Inc. | Electrochemical methods and devices for use in the determination of hematocrit corrected analyte concentrations |
| US6287451B1 (en) | 1999-06-02 | 2001-09-11 | Handani Winarta | Disposable sensor and method of making |
| EP1172649A1 (en) | 2000-01-25 | 2002-01-16 | Matsushita Electric Industrial Co., Ltd. | Measuring device using biosensor and biosensor used for it, and dedicated standard liquid |
| US6379513B1 (en) | 1997-03-21 | 2002-04-30 | Usf Filtration And Separations Group Inc. | Sensor connection means |
| US6391645B1 (en) | 1997-05-12 | 2002-05-21 | Bayer Corporation | Method and apparatus for correcting ambient temperature effect in biosensors |
| US6413410B1 (en) | 1996-06-19 | 2002-07-02 | Lifescan, Inc. | Electrochemical cell |
| EP1281960A2 (en) | 2001-08-01 | 2003-02-05 | Lifescan, Inc. | Methods and devices for use in analyte concentration determination assays |
| US20030098233A1 (en)* | 2001-10-10 | 2003-05-29 | Kermani Mahyar Z. | Determination of sample volume adequacy in biosensor devices |
| US6576117B1 (en) | 1998-05-20 | 2003-06-10 | Arkray | Method and apparatus for electrochemical measurement using statistical technique |
| US20030109798A1 (en) | 2001-12-12 | 2003-06-12 | Kermani Mahyar Zardoshti | Biosensor apparatus and method with sample type and volume detection |
| US6595919B2 (en) | 1998-05-13 | 2003-07-22 | Cygnus, Inc. | Device for signal processing for measurement of physiological analytes |
| JP2003262604A (en) | 2001-12-10 | 2003-09-19 | Lifescan Inc | Passive sample detection to initiate timing of assay |
| US6676995B2 (en) | 2001-11-28 | 2004-01-13 | Lifescan, Inc. | Solution striping system |
| EP1394545A1 (en) | 2002-08-27 | 2004-03-03 | Bayer Healthcare, LLC | Method of determining a haematocrit corrected glucose concentration in whole blood samples wherein the haematocrit concentration is measured by impedance spectroscopy |
| US6730200B1 (en) | 1999-06-18 | 2004-05-04 | Abbott Laboratories | Electrochemical sensor for analysis of liquid samples |
| WO2004040286A1 (en) | 2002-10-31 | 2004-05-13 | Matsushita Electric Industrial Co., Ltd. | Determination method for automatically identifying analyte liquid and standard solution for biosensor |
| US6749887B1 (en) | 2001-11-28 | 2004-06-15 | Lifescan, Inc. | Solution drying system |
| US20040120848A1 (en) | 2002-12-20 | 2004-06-24 | Maria Teodorczyk | Method for manufacturing a sterilized and calibrated biosensor-based medical device |
| US20040154932A1 (en) | 2003-02-11 | 2004-08-12 | Yingping Deng | Methods of determining the concentration of an analyte in a fluid test sample |
| EP1455182A1 (en) | 2001-11-20 | 2004-09-08 | Arkray Inc. | Fail judging method and analyzer |
| US20040182703A1 (en) | 2002-04-25 | 2004-09-23 | Home Diagnostics, Inc. | Systems and methods for blood glucose sensing |
| US6816537B2 (en) | 2001-10-09 | 2004-11-09 | Koninklijke Philips Electronics N.V. | Device having touch sensitivity functionality |
| US6818180B2 (en) | 1996-04-05 | 2004-11-16 | Roche Diagnostics Operations, Inc. | Devices for testing for the presence and/or concentration of an analyte in a body fluid |
| US6830934B1 (en) | 1999-06-15 | 2004-12-14 | Lifescan, Inc. | Microdroplet dispensing for a medical diagnostic device |
| US20040256248A1 (en) | 2003-06-20 | 2004-12-23 | Burke David W. | System and method for analyte measurement using dose sufficiency electrodes |
| US20040260511A1 (en) | 2003-06-20 | 2004-12-23 | Burke David W. | System and method for determining an abused sensor during analyte measurement |
| WO2004113913A1 (en) | 2003-06-20 | 2004-12-29 | Roche Diagnostics Gmbh | Method for analyte measurement employing maximum dosing time delay |
| US20050036906A1 (en) | 2003-08-11 | 2005-02-17 | Toray Industries, Inc. | Biosensor |
| US20050045476A1 (en) | 2002-04-25 | 2005-03-03 | Home Diagnostics, Inc. | Systems and methods for blood glucose sensing |
| US6863801B2 (en) | 1995-11-16 | 2005-03-08 | Lifescan, Inc. | Electrochemical cell |
| US6869411B2 (en) | 1992-07-10 | 2005-03-22 | Gambro, Inc. | Apparatus for producing blood component products |
| JP2005147990A (en) | 2003-11-19 | 2005-06-09 | Matsushita Electric Ind Co Ltd | Substrate concentration measurement method |
| US20050153457A1 (en) | 2002-03-14 | 2005-07-14 | Harshad Patel | Test strip qualification system |
| WO2005066355A1 (en) | 2004-01-09 | 2005-07-21 | Hypoguard Limited | Biosensor and method of manufacture |
| US6936146B2 (en) | 2000-03-22 | 2005-08-30 | Allmedicus Co., Ltd | Electrochemical biosensor readout meter |
| US6942770B2 (en) | 2002-04-19 | 2005-09-13 | Nova Biomedical Corporation | Disposable sub-microliter volume biosensor with enhanced sample inlet |
| WO2005098424A1 (en) | 2004-03-31 | 2005-10-20 | Bayer Healthcare Llc | Method and apparatus for implementing threshold based correction functions for biosensors |
| US20050284758A1 (en) | 2004-06-18 | 2005-12-29 | Tom Funke | Novel electrode design for biosensor |
| US7018843B2 (en) | 2001-11-07 | 2006-03-28 | Roche Diagnostics Operations, Inc. | Instrument |
| US20060108236A1 (en) | 2003-04-08 | 2006-05-25 | Joachim Kasielke | Biosensor system |
| US7083712B2 (en) | 2001-11-20 | 2006-08-01 | Arkray, Inc. | Fail judging method for analysis and analyzer |
| WO2006110504A1 (en) | 2005-04-08 | 2006-10-19 | Bayer Healthcare Llc | Oxidizable species as an internal reference in control solutions for biosensors |
| US20060231421A1 (en) | 2005-04-15 | 2006-10-19 | Agamatrix, Inc. | Method for Determination of Analyte Concentrations and Related Apparatus |
| US20060231425A1 (en) | 2005-04-15 | 2006-10-19 | Agamatrix, Inc. | Method and Apparatus for Detection of Abnormal Traces during Electrochemical Analyte Detection |
| WO2006109277A2 (en) | 2005-04-15 | 2006-10-19 | Agamatrix, Inc. | Determination of partial fill in electrochemical strips |
| US20060231423A1 (en)* | 2005-04-15 | 2006-10-19 | Agamatrix, Inc | Analyte determination method and analyte meter |
| US20070000777A1 (en) | 2005-06-03 | 2007-01-04 | Ho Wah O | Test system |
| US7160251B2 (en) | 2002-04-25 | 2007-01-09 | Home Diagnostics, Inc. | Systems and methods for blood glucose sensing |
| US20070017824A1 (en) | 2005-07-19 | 2007-01-25 | Rippeth John J | Biosensor and method of manufacture |
| US20070074977A1 (en)* | 2005-09-30 | 2007-04-05 | Lifescan, Inc. | Method and apparatus for rapid electrochemical analysis |
| JP2007087710A (en) | 2005-09-21 | 2007-04-05 | Hitachi Ltd | Connector, terminal or press part used therefor, and manufacturing method thereof |
| US7201042B2 (en) | 2002-11-01 | 2007-04-10 | Arkray, Inc. | Measuring instrument provided with solid component concentrating means |
| WO2007040913A1 (en) | 2005-09-30 | 2007-04-12 | Bayer Healthcare Llc | Gated voltammetry |
| EP1775587A2 (en) | 2005-10-17 | 2007-04-18 | Lifescan, Inc. | A system and method of processing a current sample for calculating a glucose concentration |
| US20070102292A1 (en) | 2005-05-10 | 2007-05-10 | Roche Diagnostics Operations, Inc. | Method and system for error checking an electrochemical sensor |
| JP2007133985A (en) | 2005-11-11 | 2007-05-31 | Hitachi Ltd | Magnetic recording / optical recording disk inspection system |
| JP2007248281A (en) | 2006-03-16 | 2007-09-27 | Matsushita Electric Ind Co Ltd | Electrode tip and manufacturing method thereof |
| CA2748433A1 (en) | 2006-03-31 | 2007-09-30 | Lifescan, Inc. | Systems and methods of discriminating control solution from a physiological sample |
| EP1839571A1 (en) | 2006-03-31 | 2007-10-03 | LifeScan, Inc. | Methods for analyzing a sample in the presence of interferents |
| US20070235346A1 (en) | 2006-04-11 | 2007-10-11 | Popovich Natasha D | System and methods for providing corrected analyte concentration measurements |
| US20070256943A1 (en) | 2006-05-04 | 2007-11-08 | Popovich Natasha D | System and methods for automatically recognizing a control solution |
| WO2007131036A1 (en) | 2006-05-03 | 2007-11-15 | Bayer Healthcare Llc | Underfill detection system for an electrochemical biosensor |
| WO2007133985A2 (en) | 2006-05-08 | 2007-11-22 | Bayer Healthcare Llc | Abnormal output detection system for a biosensor |
| WO2008004565A1 (en) | 2006-07-05 | 2008-01-10 | Panasonic Corporation | Method and apparatus for measuring liquid sample |
| US7338639B2 (en) | 1997-12-22 | 2008-03-04 | Roche Diagnostics Operations, Inc. | System and method for analyte measurement |
| JP4066112B2 (en) | 1999-01-28 | 2008-03-26 | 株式会社スーパーシリコン研究所 | Wire saw control method and wire saw |
| US20080083618A1 (en) | 2006-09-05 | 2008-04-10 | Neel Gary T | System and Methods for Determining an Analyte Concentration Incorporating a Hematocrit Correction |
| US7390667B2 (en) | 1997-12-22 | 2008-06-24 | Roche Diagnostics Operations, Inc. | System and method for analyte measurement using AC phase angle measurements |
| US7407811B2 (en) | 1997-12-22 | 2008-08-05 | Roche Diagnostics Operations, Inc. | System and method for analyte measurement using AC excitation |
| US20090084687A1 (en) | 2007-09-28 | 2009-04-02 | Lifescan, Inc. | Systems and methods of discriminating control solution from a physiological sample |
| US20090184004A1 (en) | 2008-01-17 | 2009-07-23 | Lifescan, Inc. | System and method for measuring an analyte in a sample |
| JP2009528540A (en) | 2006-02-27 | 2009-08-06 | バイエル・ヘルスケア・エルエルシー | Temperature-corrected analyte determination in a biosensor system |
| US7604721B2 (en) | 2003-06-20 | 2009-10-20 | Roche Diagnostics Operations, Inc. | System and method for coding information on a biosensor test strip |
| US20090301899A1 (en) | 2008-06-09 | 2009-12-10 | Lifescan, Inc. | System and method for measuring an analyte in a sample |
| US7645421B2 (en) | 2003-06-20 | 2010-01-12 | Roche Diagnostics Operations, Inc. | System and method for coding information on a biosensor test strip |
| US7645373B2 (en) | 2003-06-20 | 2010-01-12 | Roche Diagnostic Operations, Inc. | System and method for coding information on a biosensor test strip |
| US20100089775A1 (en) | 2006-12-19 | 2010-04-15 | Apex Biotechnology Corp. | Electrochemical test strip, electrochemical test system, and measurement method using the same |
| US7718439B2 (en) | 2003-06-20 | 2010-05-18 | Roche Diagnostics Operations, Inc. | System and method for coding information on a biosensor test strip |
| US7727467B2 (en) | 2003-06-20 | 2010-06-01 | Roche Diagnostics Operations, Inc. | Reagent stripe for test strip |
| US20100170807A1 (en) | 2003-06-20 | 2010-07-08 | Diebold Eric R | System and method for determining the concentration of an analyte in a sample fluid |
| US20100206749A1 (en) | 2007-09-27 | 2010-08-19 | Philosys Co., Ltd. | Method for corrected erroneous results of measurement in biosensors and apparatus using the same |
| US20100276303A1 (en) | 2006-10-19 | 2010-11-04 | Panasonic Corporation | Method for measuring hematocrit value of blood sample, method for measuring concentration of analyte in blood sample, sensor chip and sensor unit |
| US7955492B2 (en) | 2004-04-19 | 2011-06-07 | Panasonic Corporation | Method for measuring blood components and biosensor and measuring instrument for use therein |
| US7972861B2 (en) | 2004-05-14 | 2011-07-05 | Bayer Healthcare Llc | Methods for performing hematocrit adjustment in glucose assays and devices for same |
| US20110301857A1 (en) | 2010-06-07 | 2011-12-08 | Bayer Healthcare Llc | Slope-Based Compensation Including Secondary Output Signals |
| US20110297554A1 (en) | 2008-12-08 | 2011-12-08 | Bayer Healthcare Llc | Complex Index Functions |
Family Cites Families (6)
| Publication number | Priority date | Publication date | Assignee | Title |
|---|---|---|---|---|
| US797861A (en)* | 1905-05-16 | 1905-08-22 | Augustine Melgarejo | Car-platform. |
| ES2286209T3 (en)* | 2002-11-21 | 2007-12-01 | Lifescan, Inc. | DETERMINATION OF THE ADEQUACY OF THE SAMPLE VOLUME IN BIODETECTORS. |
| US7862341B2 (en)* | 2004-06-17 | 2011-01-04 | Krueger International, Inc. | Marker board |
| US20070205114A1 (en)* | 2006-03-01 | 2007-09-06 | Mathur Vijaywanth P | Method of detecting biosensor filling |
| EP1860432B1 (en)* | 2006-05-24 | 2017-12-13 | Bionime GmbH | A method for operating a measuring meter and a measuring meter |
| JP3167464U (en) | 2010-10-20 | 2011-04-28 | 由英 高藤 | Sanitary napkins package and case |
- 2009
- 2009-05-13USUS12/464,935patent/US8551320B2/enactiveActive
- 2009-06-03AUAU2009202200Apatent/AU2009202200B2/ennot_activeCeased
- 2009-06-03CACA2668237Apatent/CA2668237C/enactiveActive
- 2009-06-08EPEP12164561.8Apatent/EP2482069B1/enactiveActive
- 2009-06-08ESES09251507.1Tpatent/ES2647238T3/enactiveActive
- 2009-06-08EPEP09251507.1Apatent/EP2138841B8/enactiveActive
- 2009-06-08ESES12164561.8Tpatent/ES2481015T3/enactiveActive
- 2009-06-09JPJP2009137856Apatent/JP5237201B2/enactiveActive
- 2011
- 2011-03-18AUAU2011201224Apatent/AU2011201224B2/ennot_activeCeased
- 2012
- 2012-09-14USUS13/620,448patent/US9784707B2/enactiveActive
- 2012-11-29JPJP2012261693Apatent/JP5806195B2/ennot_activeExpired - Fee Related
- 2014
- 2014-05-12JPJP2014098994Apatent/JP5934284B2/enactiveActive
- 2015
- 2015-12-01JPJP2015234775Apatent/JP6306557B2/enactiveActive
Patent Citations (288)
| Publication number | Priority date | Publication date | Assignee | Title |
|---|---|---|---|---|
| US3648160A (en) | 1969-12-01 | 1972-03-07 | Technicon Corp | Method and apparatus for the highly accurate, automatic determination of the hematocrit of whole blood samples |
| US4088448A (en) | 1975-09-29 | 1978-05-09 | Lilja Jan Evert | Apparatus for sampling, mixing the sample with a reagent and making particularly optical analyses |
| US4224125A (en) | 1977-09-28 | 1980-09-23 | Matsushita Electric Industrial Co., Ltd. | Enzyme electrode |
| GB2020424A (en) | 1978-05-05 | 1979-11-14 | Baker Chem Co J T | Determination of glucose |
| US4250257A (en) | 1978-08-24 | 1981-02-10 | Technicon Instruments Corporation | Whole blood analyses in porous media |
| US4233029A (en) | 1978-10-25 | 1980-11-11 | Eastman Kodak Company | Liquid transport device and method |
| US4259165A (en) | 1978-12-20 | 1981-03-31 | Hokushin Electric Works, Ltd. | Dissolved oxygen probe |
| US4517287A (en) | 1979-04-04 | 1985-05-14 | Boehringer Mannheim Gmbh | Method and reagent for the enzymatic determination of enzyme substrates |
| US4254083A (en) | 1979-07-23 | 1981-03-03 | Eastman Kodak Company | Structural configuration for transport of a liquid drop through an ingress aperture |
| US4307188A (en) | 1979-09-06 | 1981-12-22 | Miles Laboratories, Inc. | Precursor indicator compositions |
| US4301412A (en) | 1979-10-29 | 1981-11-17 | United States Surgical Corporation | Liquid conductivity measuring system and sample cards therefor |
| US4303887A (en) | 1979-10-29 | 1981-12-01 | United States Surgical Corporation | Electrical liquid conductivity measuring system |
| US4301414A (en) | 1979-10-29 | 1981-11-17 | United States Surgical Corporation | Disposable sample card and method of making same |
| US4374013A (en) | 1980-03-05 | 1983-02-15 | Enfors Sven Olof | Oxygen stabilized enzyme electrode |
| US4774039A (en) | 1980-03-14 | 1988-09-27 | Brunswick Corporation | Dispersing casting of integral skinned highly asymmetric polymer membranes |
| US4629563A (en) | 1980-03-14 | 1986-12-16 | Brunswick Corporation | Asymmetric membranes |
| US4629563B1 (en) | 1980-03-14 | 1997-06-03 | Memtec North America | Asymmetric membranes |
| US4404066A (en) | 1980-08-25 | 1983-09-13 | The Yellow Springs Instrument Company | Method for quantitatively determining a particular substrate catalyzed by a multisubstrate enzyme |
| US4436812A (en) | 1980-10-29 | 1984-03-13 | Fuji Electric Co., Ltd. | Process of calibrating a blood sugar analyzing apparatus |
| DE3103464A1 (en) | 1981-02-02 | 1982-08-05 | Gkss - Forschungszentrum Geesthacht Gmbh, 2054 Geesthacht | Sealing frame for electrodialysis membrane stack |
| US4545382A (en) | 1981-10-23 | 1985-10-08 | Genetics International, Inc. | Sensor for components of a liquid mixture |
| US4431004A (en) | 1981-10-27 | 1984-02-14 | Bessman Samuel P | Implantable glucose sensor |
| US4547735A (en) | 1982-01-23 | 1985-10-15 | Holger Kiesewetter | Instrument for measuring the hematocrit value of blood |
| US4919770A (en) | 1982-07-30 | 1990-04-24 | Siemens Aktiengesellschaft | Method for determining the concentration of electro-chemically convertible substances |
| US4552840A (en) | 1982-12-02 | 1985-11-12 | California And Hawaiian Sugar Company | Enzyme electrode and method for dextran analysis |
| EP0351892A2 (en) | 1983-05-05 | 1990-01-24 | MediSense, Inc. | Diagnostic aid and assemblies therefor |
| US4711245A (en) | 1983-05-05 | 1987-12-08 | Genetics International, Inc. | Sensor for components of a liquid mixture |
| EP0351891A2 (en) | 1983-05-05 | 1990-01-24 | MediSense, Inc. | Printed electrodes |
| US5509410A (en) | 1983-06-06 | 1996-04-23 | Medisense, Inc. | Strip electrode including screen printing of a single layer |
| US4533440A (en) | 1983-08-04 | 1985-08-06 | General Electric Company | Method for continuous measurement of the sulfite/sulfate ratio |
| US4517291A (en) | 1983-08-15 | 1985-05-14 | E. I. Du Pont De Nemours And Company | Biological detection process using polymer-coated electrodes |
| US4654197A (en) | 1983-10-18 | 1987-03-31 | Aktiebolaget Leo | Cuvette for sampling and analysis |
| EP0172969A2 (en) | 1983-11-12 | 1986-03-05 | Lion Laboratories Limited | Discriminant analysis of gas constituents |
| US4508613A (en) | 1983-12-19 | 1985-04-02 | Gould Inc. | Miniaturized potassium ion sensor |
| GB2154735A (en) | 1984-01-27 | 1985-09-11 | Menarini Sas | Reagent for determining blood glucose content |
| US5141868A (en) | 1984-06-13 | 1992-08-25 | Internationale Octrooi Maatschappij "Octropa" Bv | Device for use in chemical test procedures |
| EP0171375A1 (en) | 1984-07-09 | 1986-02-12 | Institut Cerac S.A. | High pressure water valve |
| US5171689A (en) | 1984-11-08 | 1992-12-15 | Matsushita Electric Industrial Co., Ltd. | Solid state bio-sensor |
| US4686479A (en) | 1985-07-22 | 1987-08-11 | Young Chung C | Apparatus and control kit for analyzing blood sample values including hematocrit |
| US4664119A (en) | 1985-12-04 | 1987-05-12 | University Of Southern California | Transcutaneous galvanic electrode oxygen sensor |
| SU1351627A2 (en) | 1986-03-27 | 1987-11-15 | Томский инженерно-строительный институт | Filtering element |
| EP0251915A2 (en) | 1986-06-27 | 1988-01-07 | Terumo Kabushiki Kaisha | Enzyme sensor |
| EP0255291A1 (en) | 1986-07-23 | 1988-02-03 | Unilever Plc | Method and apparatus for electrochemical measurements |
| EP0266204A2 (en) | 1986-10-31 | 1988-05-04 | Kingston Technologies, Inc. | Pressure dependent anisotropic transport membrane system |
| US4900424A (en) | 1986-11-28 | 1990-02-13 | Unilever Patent Holdings B.V. | Electrochemical measurement cell |
| EP0278647A2 (en) | 1987-02-09 | 1988-08-17 | AT&T Corp. | Electronchemical processes involving enzymes |
| GB2201248A (en) | 1987-02-24 | 1988-08-24 | Ici Plc | Enzyme electrode sensors |
| EP0290770A2 (en) | 1987-05-14 | 1988-11-17 | Ace Medical Company | Pressure sensor |
| US4963815A (en) | 1987-07-10 | 1990-10-16 | Molecular Devices Corporation | Photoresponsive electrode for determination of redox potential |
| EP0299779A2 (en) | 1987-07-15 | 1989-01-18 | Sri International | Fast response time microsensors for gaseous and vaporous species |
| US5064516A (en) | 1987-07-16 | 1991-11-12 | Gas Research Institute | Measuring gas levels |
| US4790925A (en) | 1987-09-18 | 1988-12-13 | Mine Safety Appliances Company | Electrochemical gas sensor |
| US5128015A (en) | 1988-03-15 | 1992-07-07 | Tall Oak Ventures | Method and apparatus for amperometric diagnostic analysis |
| WO1989008713A1 (en) | 1988-03-15 | 1989-09-21 | Life-Chek Laboratories | Method and apparatus for amperometric diagnostic analysis |
| US5108564A (en) | 1988-03-15 | 1992-04-28 | Tall Oak Ventures | Method and apparatus for amperometric diagnostic analysis |
| US5120420A (en) | 1988-03-31 | 1992-06-09 | Matsushita Electric Industrial Co., Ltd. | Biosensor and a process for preparation thereof |
| EP0359831A1 (en) | 1988-03-31 | 1990-03-28 | Matsushita Electric Industrial Co., Ltd. | Biosensor and process for its production |
| US5120420B1 (en) | 1988-03-31 | 1999-11-09 | Matsushita Electric Industrial Co Ltd | Biosensor and a process for preparation thereof |
| US5272087A (en) | 1988-04-20 | 1993-12-21 | Centre National De La Recherche Scientifique (C.N.R.S.) | Enzymatic electrode and its preparation method |
| EP0351516A2 (en) | 1988-07-18 | 1990-01-24 | Martin J. Patko | Precalibrated, disposable, electrochemical sensors |
| US5126034A (en) | 1988-07-21 | 1992-06-30 | Medisense, Inc. | Bioelectrochemical electrodes |
| US5089320A (en) | 1989-01-09 | 1992-02-18 | James River Ii, Inc. | Resealable packaging material |
| US5312590A (en) | 1989-04-24 | 1994-05-17 | National University Of Singapore | Amperometric sensor for single and multicomponent analysis |
| EP0400918A1 (en) | 1989-05-31 | 1990-12-05 | Nakano Vinegar Co., Ltd. | Enzyme sensor |
| US5272060A (en) | 1989-07-13 | 1993-12-21 | Kyoto Daiichi Kagaku Co., Ltd. | Method for determination of glucose concentration in whole blood |
| GB2235050A (en) | 1989-08-14 | 1991-02-20 | Sieger Ltd | Electrochemical gas sensor |
| JPH0399254A (en) | 1989-09-13 | 1991-04-24 | Toyota Central Res & Dev Lab Inc | hematocrit measuring device |
| EP0418404A1 (en) | 1989-09-15 | 1991-03-27 | Hewlett-Packard GmbH | Method of determining optimum operating conditions in an electrochemical detector and electrochemical detector using the method |
| US5151166A (en) | 1989-10-02 | 1992-09-29 | Normalair-Garrett (Holdings) Limited | Oxygen monitoring method and apparatus |
| US5229282A (en) | 1989-11-24 | 1993-07-20 | Matsushita Electric Industrial Co., Ltd. | Preparation of biosensor having a layer containing an enzyme, electron acceptor and hydrophilic polymer on an electrode system |
| JPH03167464A (en) | 1989-11-27 | 1991-07-19 | Yamatake Honeywell Co Ltd | Manufacturing method of moisture sensing element |
| US5243516A (en) | 1989-12-15 | 1993-09-07 | Boehringer Mannheim Corporation | Biosensing instrument and method |
| US5508171A (en) | 1989-12-15 | 1996-04-16 | Boehringer Mannheim Corporation | Assay method with enzyme electrode system |
| WO1991009373A1 (en) | 1989-12-15 | 1991-06-27 | Boehringer Mannheim Corporation | Biosensing instrument and method |
| US5122244A (en) | 1990-02-03 | 1992-06-16 | Boehringer Mannheim Gmbh | Method and sensor electrode system for the electrochemical determination of an analyte or an oxidoreductase as well as the use of suitable compounds therefor |
| EP0451981A2 (en) | 1990-03-26 | 1991-10-16 | Cascade Medical, Inc. | Disposable reagent unit |
| US5059908A (en) | 1990-05-31 | 1991-10-22 | Capital Controls Company, Inc. | Amperimetric measurement with cell electrode deplating |
| JPH0466112A (en) | 1990-07-03 | 1992-03-02 | Ube Ind Ltd | How to determine transport conditions in membrane transport |
| US5320732A (en) | 1990-07-20 | 1994-06-14 | Matsushita Electric Industrial Co., Ltd. | Biosensor and measuring apparatus using the same |
| US5642734A (en) | 1990-10-04 | 1997-07-01 | Microcor, Inc. | Method and apparatus for noninvasively determining hematocrit |
| WO1992015701A1 (en) | 1991-02-27 | 1992-09-17 | Boehringer Mannheim Corporation | Improved method and reagent for determination of an analyte |
| US5192415A (en) | 1991-03-04 | 1993-03-09 | Matsushita Electric Industrial Co., Ltd. | Biosensor utilizing enzyme and a method for producing the same |
| JPH04343065A (en) | 1991-05-17 | 1992-11-30 | Ngk Spark Plug Co Ltd | Biosensor |
| US5382346A (en) | 1991-05-17 | 1995-01-17 | Kyoto Daiichi Kagaku Co., Ltd. | Biosensor and method of quantitative analysis using the same |
| JPH052007A (en) | 1991-06-24 | 1993-01-08 | Nippon Telegr & Teleph Corp <Ntt> | Wall-jet type electrochemical detector and method for producing the same |
| US5282950A (en) | 1991-07-15 | 1994-02-01 | Boehringer Mannheim Gmbh | Electrochemical analysis system |
| US5388163A (en) | 1991-12-23 | 1995-02-07 | At&T Corp. | Electret transducer array and fabrication technique |
| AU3104293A (en) | 1992-01-14 | 1993-07-15 | Commonwealth Scientific And Industrial Research Organisation | Viscometer |
| EP0560336A1 (en) | 1992-03-12 | 1993-09-15 | Matsushita Electric Industrial Co., Ltd. | A catalyst made from phosphate and a biosensor including the same |
| US6869411B2 (en) | 1992-07-10 | 2005-03-22 | Gambro, Inc. | Apparatus for producing blood component products |
| WO1994002842A1 (en) | 1992-07-28 | 1994-02-03 | The Victoria University Of Manchester | Analytical method for the detection and measurement of paracetamol |
| US5384028A (en) | 1992-08-28 | 1995-01-24 | Nec Corporation | Biosensor with a data memory |
| US5393399A (en) | 1992-09-07 | 1995-02-28 | Gie Cylergie | Amperometric measuring device having an electrochemical sensor |
| US5909114A (en) | 1992-10-28 | 1999-06-01 | Nakano Vinegar Co., Ltd. | Coulometric analysis method and a device therefor |
| US5469369A (en) | 1992-11-02 | 1995-11-21 | The United States Of America As Represented By The Secretary Of The Navy | Smart sensor system and method using a surface acoustic wave vapor sensor array and pattern recognition for selective trace organic vapor detection |
| JP3167464B2 (en) | 1992-11-26 | 2001-05-21 | 富士電機株式会社 | Inverter fault diagnosis device |
| JPH06222874A (en) | 1993-01-26 | 1994-08-12 | Sharp Corp | Position input device |
| US5395504A (en) | 1993-02-04 | 1995-03-07 | Asulab S.A. | Electrochemical measuring system with multizone sensors |
| AU5487394A (en) | 1993-02-04 | 1994-08-11 | Asulab S.A. | Electrochemical measuring system with multizone sensors |
| US5385846A (en) | 1993-06-03 | 1995-01-31 | Boehringer Mannheim Corporation | Biosensor and method for hematocrit determination |
| US5405511A (en) | 1993-06-08 | 1995-04-11 | Boehringer Mannheim Corporation | Biosensing meter with ambient temperature estimation method and system |
| US5352351A (en) | 1993-06-08 | 1994-10-04 | Boehringer Mannheim Corporation | Biosensing meter with fail/safe procedures to prevent erroneous indications |
| US5413690A (en) | 1993-07-23 | 1995-05-09 | Boehringer Mannheim Corporation | Potentiometric biosensor and the method of its use |
| US5508203A (en) | 1993-08-06 | 1996-04-16 | Fuller; Milton E. | Apparatus and method for radio frequency spectroscopy using spectral analysis |
| US5645709A (en) | 1993-12-08 | 1997-07-08 | Van Den Bergh Foods Co., Division Of Conopco, Inc. | Methods and apparatus for electrochemical measurements |
| WO1995016198A1 (en) | 1993-12-08 | 1995-06-15 | Unilever Plc | Methods and apparatus for electrochemical measurements |
| US5520787A (en) | 1994-02-09 | 1996-05-28 | Abbott Laboratories | Diagnostic flow cell device |
| US5762770A (en) | 1994-02-21 | 1998-06-09 | Boehringer Mannheim Corporation | Electrochemical biosensor test strip |
| US5437999A (en) | 1994-02-22 | 1995-08-01 | Boehringer Mannheim Corporation | Electrochemical sensor |
| JP3099254B2 (en) | 1994-02-28 | 2000-10-16 | 安藤電気株式会社 | Suction hand with floating mechanism and transfer contact mechanism |
| US5849174A (en) | 1994-08-01 | 1998-12-15 | Medisense, Inc. | Electrodes and their use in analysis |
| US5611908A (en) | 1994-12-22 | 1997-03-18 | Dr agerwerk Aktiengesellschaft | Method of operating and amperometric measuring cell |
| US6153069A (en) | 1995-02-09 | 2000-11-28 | Tall Oak Ventures | Apparatus for amperometric Diagnostic analysis |
| US5527446A (en) | 1995-04-13 | 1996-06-18 | United States Of America As Represented By The Secretary Of The Air Force | Gas sensor |
| US5653863A (en) | 1995-05-05 | 1997-08-05 | Bayer Corporation | Method for reducing bias in amperometric sensors |
| US5620579A (en) | 1995-05-05 | 1997-04-15 | Bayer Corporation | Apparatus for reduction of bias in amperometric sensors |
| US5567302A (en) | 1995-06-07 | 1996-10-22 | Molecular Devices Corporation | Electrochemical system for rapid detection of biochemical agents that catalyze a redox potential change |
| JP2007225619A (en) | 1995-06-19 | 2007-09-06 | Lifescan Inc | Electrochemical cell |
| US6284125B1 (en) | 1995-06-19 | 2001-09-04 | Usf Filtration And Separations Group, Inc. | Electrochemical cell |
| WO1997000441A1 (en) | 1995-06-19 | 1997-01-03 | Memtec America Corporation | Electrochemical cell |
| US5628890A (en) | 1995-09-27 | 1997-05-13 | Medisense, Inc. | Electrochemical sensor |
| US6058934A (en) | 1995-11-02 | 2000-05-09 | Chiron Diagnostics Corporation | Planar hematocrit sensor incorporating a seven-electrode conductivity measurement cell |
| US5942102A (en) | 1995-11-16 | 1999-08-24 | Usf Filtration And Separations Group Inc. | Electrochemical method |
| US6863801B2 (en) | 1995-11-16 | 2005-03-08 | Lifescan, Inc. | Electrochemical cell |
| US6179979B1 (en) | 1995-11-16 | 2001-01-30 | Usf Filtration & Separations Group, Inc. | Electrochemical cell |
| WO1997018465A1 (en) | 1995-11-16 | 1997-05-22 | Memtec America Corporation | Electrochemical method |
| US5723284A (en) | 1996-04-01 | 1998-03-03 | Bayer Corporation | Control solution and method for testing the performance of an electrochemical device for determining the concentration of an analyte in blood |
| EP0800086A1 (en) | 1996-04-01 | 1997-10-08 | Bayer Corporation | Control solution and method for testing the performance of an electrochemical device for determining the concentration of an analyte in blood |
| US6818180B2 (en) | 1996-04-05 | 2004-11-16 | Roche Diagnostics Operations, Inc. | Devices for testing for the presence and/or concentration of an analyte in a body fluid |
| US5869971A (en) | 1996-05-17 | 1999-02-09 | Sendx Medical, Inc. | Method and apparatus for ratiometric measurement of hematocrit |
| US5660791A (en) | 1996-06-06 | 1997-08-26 | Bayer Corporation | Fluid testing sensor for use in dispensing instrument |
| US6413410B1 (en) | 1996-06-19 | 2002-07-02 | Lifescan, Inc. | Electrochemical cell |
| US6379513B1 (en) | 1997-03-21 | 2002-04-30 | Usf Filtration And Separations Group Inc. | Sensor connection means |
| US6391645B1 (en) | 1997-05-12 | 2002-05-21 | Bayer Corporation | Method and apparatus for correcting ambient temperature effect in biosensors |
| US6071391A (en) | 1997-09-12 | 2000-06-06 | Nok Corporation | Enzyme electrode structure |
| US6503381B1 (en) | 1997-09-12 | 2003-01-07 | Therasense, Inc. | Biosensor |
| US5997817A (en) | 1997-12-05 | 1999-12-07 | Roche Diagnostics Corporation | Electrochemical biosensor test strip |
| EP1042667A1 (en) | 1997-12-22 | 2000-10-11 | Roche Diagnostics Corporation | Meter |
| US7981363B2 (en) | 1997-12-22 | 2011-07-19 | Roche Diagnostics Operations, Inc. | System and method for analyte measurement |
| US7494816B2 (en) | 1997-12-22 | 2009-02-24 | Roche Diagnostic Operations, Inc. | System and method for determining a temperature during analyte measurement |
| US7407811B2 (en) | 1997-12-22 | 2008-08-05 | Roche Diagnostics Operations, Inc. | System and method for analyte measurement using AC excitation |
| US20040005716A9 (en) | 1997-12-22 | 2004-01-08 | Beaty Terry A. | Meter |
| US6645368B1 (en) | 1997-12-22 | 2003-11-11 | Roche Diagnostics Corporation | Meter and method of using the meter for determining the concentration of a component of a fluid |
| US7390667B2 (en) | 1997-12-22 | 2008-06-24 | Roche Diagnostics Operations, Inc. | System and method for analyte measurement using AC phase angle measurements |
| US7338639B2 (en) | 1997-12-22 | 2008-03-04 | Roche Diagnostics Operations, Inc. | System and method for analyte measurement |
| JPH11230934A (en) | 1998-02-17 | 1999-08-27 | Kdk Corp | Sample discriminating method |
| US6595919B2 (en) | 1998-05-13 | 2003-07-22 | Cygnus, Inc. | Device for signal processing for measurement of physiological analytes |
| US6576117B1 (en) | 1998-05-20 | 2003-06-10 | Arkray | Method and apparatus for electrochemical measurement using statistical technique |
| US6251260B1 (en) | 1998-08-24 | 2001-06-26 | Therasense, Inc. | Potentiometric sensors for analytic determination |
| US6461496B1 (en) | 1998-10-08 | 2002-10-08 | Therasense, Inc. | Small volume in vitro analyte sensor with diffusible or non-leachable redox mediator |
| WO2000020626A1 (en) | 1998-10-08 | 2000-04-13 | Therasense, Inc. | Small volume in vitro analyte sensor with diffusible or non-leachable redox mediator |
| JP4066112B2 (en) | 1999-01-28 | 2008-03-26 | 株式会社スーパーシリコン研究所 | Wire saw control method and wire saw |
| US6287451B1 (en) | 1999-06-02 | 2001-09-11 | Handani Winarta | Disposable sensor and method of making |
| US6830934B1 (en) | 1999-06-15 | 2004-12-14 | Lifescan, Inc. | Microdroplet dispensing for a medical diagnostic device |
| US6193873B1 (en) | 1999-06-15 | 2001-02-27 | Lifescan, Inc. | Sample detection to initiate timing of an electrochemical assay |
| US6730200B1 (en) | 1999-06-18 | 2004-05-04 | Abbott Laboratories | Electrochemical sensor for analysis of liquid samples |
| JP2001066274A (en) | 1999-08-27 | 2001-03-16 | Omron Corp | Method for evaluating biosensor |
| US20040235178A1 (en) | 1999-11-29 | 2004-11-25 | Matsushita Electric Industrial Co., Ltd. | Sample discriminating method |
| US6824670B2 (en) | 1999-11-29 | 2004-11-30 | Matsushita Electric Industrial Co. Ltd. | Sample discriminating method |
| CN1338049A (en) | 1999-11-29 | 2002-02-27 | 松下电器产业株式会社 | Sample identification method |
| EP1156324A1 (en) | 1999-11-29 | 2001-11-21 | Matsushita Electric Industrial Co., Ltd. | Sample discriminating method |
| WO2001040787A1 (en) | 1999-11-29 | 2001-06-07 | Matsushita Electric Industrial Co., Ltd. | Sample discriminating method |
| US7122111B2 (en) | 1999-11-29 | 2006-10-17 | Matsushita Electric Industrial Co., Ltd. | Sample discriminating method |
| US20020139692A1 (en) | 1999-11-29 | 2002-10-03 | Hiroyuki Tokunaga | Sample discriminating method |
| JP2001153839A (en) | 1999-11-29 | 2001-06-08 | Matsushita Electric Ind Co Ltd | Sample discrimination method |
| EP1172649A1 (en) | 2000-01-25 | 2002-01-16 | Matsushita Electric Industrial Co., Ltd. | Measuring device using biosensor and biosensor used for it, and dedicated standard liquid |
| WO2001057510A2 (en) | 2000-02-02 | 2001-08-09 | Lifescan, Inc. | Electrochemical methods and devices for use in the determination of hematocrit corrected analyte concentrations |
| JP2003521708A (en) | 2000-02-02 | 2003-07-15 | ライフスキャン・インコーポレイテッド | Electrochemical method and apparatus used for measurement of analyte concentration with corrected hematocrit value |
| WO2001057510A3 (en) | 2000-02-02 | 2002-02-21 | Lifescan Inc | Electrochemical methods and devices for use in the determination of hematocrit corrected analyte concentrations |
| US6475372B1 (en) | 2000-02-02 | 2002-11-05 | Lifescan, Inc. | Electrochemical methods and devices for use in the determination of hematocrit corrected analyte concentrations |
| US6936146B2 (en) | 2000-03-22 | 2005-08-30 | Allmedicus Co., Ltd | Electrochemical biosensor readout meter |
| US20030036202A1 (en) | 2001-08-01 | 2003-02-20 | Maria Teodorcyzk | Methods and devices for use in analyte concentration determination assays |
| JP2003114214A (en) | 2001-08-01 | 2003-04-18 | Lifescan Inc | Method and device for use in analyte concentration determing assay |
| EP1281960A2 (en) | 2001-08-01 | 2003-02-05 | Lifescan, Inc. | Methods and devices for use in analyte concentration determination assays |
| US20040219624A1 (en) | 2001-08-01 | 2004-11-04 | Maria Teodorcyzk | Methods and devices for use in analyte concentration determination assays |
| US6816537B2 (en) | 2001-10-09 | 2004-11-09 | Koninklijke Philips Electronics N.V. | Device having touch sensitivity functionality |
| US20030098233A1 (en)* | 2001-10-10 | 2003-05-29 | Kermani Mahyar Z. | Determination of sample volume adequacy in biosensor devices |
| JP2003185615A (en) | 2001-10-10 | 2003-07-03 | Lifescan Inc | Determination of sample volume adequacy |
| US7923258B2 (en) | 2001-11-07 | 2011-04-12 | Roche Diagnostics Operations, Inc. | Instrument |
| US7927882B2 (en) | 2001-11-07 | 2011-04-19 | Roche Diagnostics Operations, Inc. | Instrument |
| US7018843B2 (en) | 2001-11-07 | 2006-03-28 | Roche Diagnostics Operations, Inc. | Instrument |
| US7008525B2 (en) | 2001-11-20 | 2006-03-07 | Arkray, Inc. | Fail judging method and analyzer |
| US7083712B2 (en) | 2001-11-20 | 2006-08-01 | Arkray, Inc. | Fail judging method for analysis and analyzer |
| EP1455182A1 (en) | 2001-11-20 | 2004-09-08 | Arkray Inc. | Fail judging method and analyzer |
| US6676995B2 (en) | 2001-11-28 | 2004-01-13 | Lifescan, Inc. | Solution striping system |
| US6749887B1 (en) | 2001-11-28 | 2004-06-15 | Lifescan, Inc. | Solution drying system |
| US20050161344A1 (en)* | 2001-12-10 | 2005-07-28 | Kermani Mahyar Z. | Passive sample detection to initiate timing of an assay |
| JP2003262604A (en) | 2001-12-10 | 2003-09-19 | Lifescan Inc | Passive sample detection to initiate timing of assay |
| US7199594B2 (en)* | 2001-12-12 | 2007-04-03 | Lifescan, Inc. | Biosensor apparatus and method with sample type and volume detection |
| JP2003240747A (en) | 2001-12-12 | 2003-08-27 | Lifescan Inc | Biosensor apparatus and method for detecting type and volume of samples |
| US20030109798A1 (en) | 2001-12-12 | 2003-06-12 | Kermani Mahyar Zardoshti | Biosensor apparatus and method with sample type and volume detection |
| US20050153457A1 (en) | 2002-03-14 | 2005-07-14 | Harshad Patel | Test strip qualification system |
| US6942770B2 (en) | 2002-04-19 | 2005-09-13 | Nova Biomedical Corporation | Disposable sub-microliter volume biosensor with enhanced sample inlet |
| US7160251B2 (en) | 2002-04-25 | 2007-01-09 | Home Diagnostics, Inc. | Systems and methods for blood glucose sensing |
| US20050045476A1 (en) | 2002-04-25 | 2005-03-03 | Home Diagnostics, Inc. | Systems and methods for blood glucose sensing |
| US20040182703A1 (en) | 2002-04-25 | 2004-09-23 | Home Diagnostics, Inc. | Systems and methods for blood glucose sensing |
| EP1394545A1 (en) | 2002-08-27 | 2004-03-03 | Bayer Healthcare, LLC | Method of determining a haematocrit corrected glucose concentration in whole blood samples wherein the haematocrit concentration is measured by impedance spectroscopy |
| US20040079652A1 (en) | 2002-08-27 | 2004-04-29 | Bayer Healthcare Llc | Methods of determining glucose concentration in whole blood samples |
| EP1557662A1 (en) | 2002-10-31 | 2005-07-27 | Matsushita Electric Industrial Co., Ltd. | Determination method for automatically identifying analyte liquid and standard solution for biosensor |
| CN1692277A (en) | 2002-10-31 | 2005-11-02 | 松下电器产业株式会社 | Quantitative method for automatic identification of sample liquid species and standard liquid for biosensor |
| US20050247562A1 (en) | 2002-10-31 | 2005-11-10 | Hiroyuki Tokunaga | Determination method for automatically identifying analyte liquid and standard solution for biosensor |
| US7504020B2 (en) | 2002-10-31 | 2009-03-17 | Panasonic Corporation | Determination method for automatically identifying analyte liquid and standard solution for biosensor |
| WO2004040286A1 (en) | 2002-10-31 | 2004-05-13 | Matsushita Electric Industrial Co., Ltd. | Determination method for automatically identifying analyte liquid and standard solution for biosensor |
| US7201042B2 (en) | 2002-11-01 | 2007-04-10 | Arkray, Inc. | Measuring instrument provided with solid component concentrating means |
| US20040120848A1 (en) | 2002-12-20 | 2004-06-24 | Maria Teodorczyk | Method for manufacturing a sterilized and calibrated biosensor-based medical device |
| EP1447452A1 (en) | 2003-02-11 | 2004-08-18 | Bayer Healthcare, LLC | Method of detecting bias in enzyme electrode measurements |
| US7132041B2 (en) | 2003-02-11 | 2006-11-07 | Bayer Healthcare Llc | Methods of determining the concentration of an analyte in a fluid test sample |
| US20040154932A1 (en) | 2003-02-11 | 2004-08-12 | Yingping Deng | Methods of determining the concentration of an analyte in a fluid test sample |
| JP2004245836A (en) | 2003-02-11 | 2004-09-02 | Bayer Healthcare Llc | Method for measuring concentration of analytical object in fluid sample |
| US20060108236A1 (en) | 2003-04-08 | 2006-05-25 | Joachim Kasielke | Biosensor system |
| US7892849B2 (en) | 2003-06-20 | 2011-02-22 | Roche Diagnostics Operations, Inc. | Reagent stripe for test strip |
| US7718439B2 (en) | 2003-06-20 | 2010-05-18 | Roche Diagnostics Operations, Inc. | System and method for coding information on a biosensor test strip |
| US20040256248A1 (en) | 2003-06-20 | 2004-12-23 | Burke David W. | System and method for analyte measurement using dose sufficiency electrodes |
| US7879618B2 (en) | 2003-06-20 | 2011-02-01 | Roche Diagnostics Operations, Inc. | Method and reagent for producing narrow, homogenous reagent strips |
| US7829023B2 (en) | 2003-06-20 | 2010-11-09 | Roche Diagnostics Operations, Inc. | Test strip with vent opening |
| US20100170807A1 (en) | 2003-06-20 | 2010-07-08 | Diebold Eric R | System and method for determining the concentration of an analyte in a sample fluid |
| US7977112B2 (en) | 2003-06-20 | 2011-07-12 | Roche Diagnostics Operations, Inc. | System and method for determining an abused sensor during analyte measurement |
| US7749437B2 (en) | 2003-06-20 | 2010-07-06 | Roche Diagnostics Operations, Inc. | Method and reagent for producing narrow, homogenous reagent stripes |
| US7727467B2 (en) | 2003-06-20 | 2010-06-01 | Roche Diagnostics Operations, Inc. | Reagent stripe for test strip |
| WO2005008231A1 (en) | 2003-06-20 | 2005-01-27 | Roche Diagnostics Gmbh | System and method for analyte measurement of biological fluids using dose sufficiency electrodes |
| US7645373B2 (en) | 2003-06-20 | 2010-01-12 | Roche Diagnostic Operations, Inc. | System and method for coding information on a biosensor test strip |
| US7645421B2 (en) | 2003-06-20 | 2010-01-12 | Roche Diagnostics Operations, Inc. | System and method for coding information on a biosensor test strip |
| US7604721B2 (en) | 2003-06-20 | 2009-10-20 | Roche Diagnostics Operations, Inc. | System and method for coding information on a biosensor test strip |
| US7597793B2 (en) | 2003-06-20 | 2009-10-06 | Roche Operations Ltd. | System and method for analyte measurement employing maximum dosing time delay |
| US20040260511A1 (en) | 2003-06-20 | 2004-12-23 | Burke David W. | System and method for determining an abused sensor during analyte measurement |
| WO2004113913A1 (en) | 2003-06-20 | 2004-12-29 | Roche Diagnostics Gmbh | Method for analyte measurement employing maximum dosing time delay |
| US7488601B2 (en) | 2003-06-20 | 2009-02-10 | Roche Diagnostic Operations, Inc. | System and method for determining an abused sensor during analyte measurement |
| US7452457B2 (en) | 2003-06-20 | 2008-11-18 | Roche Diagnostics Operations, Inc. | System and method for analyte measurement using dose sufficiency electrodes |
| US20050036906A1 (en) | 2003-08-11 | 2005-02-17 | Toray Industries, Inc. | Biosensor |
| JP2005147990A (en) | 2003-11-19 | 2005-06-09 | Matsushita Electric Ind Co Ltd | Substrate concentration measurement method |
| WO2005066355A1 (en) | 2004-01-09 | 2005-07-21 | Hypoguard Limited | Biosensor and method of manufacture |
| JP2007522449A (en) | 2004-01-26 | 2007-08-09 | ホーム ダイアグナスティックス,インコーポレーテッド | System and method for detecting blood glucose |
| JP2007531877A (en) | 2004-03-31 | 2007-11-08 | バイエル・ヘルスケア・エルエルシー | Method and apparatus for implementing threshold-based correction functions for biosensors |
| WO2005098424A1 (en) | 2004-03-31 | 2005-10-20 | Bayer Healthcare Llc | Method and apparatus for implementing threshold based correction functions for biosensors |
| US7955492B2 (en) | 2004-04-19 | 2011-06-07 | Panasonic Corporation | Method for measuring blood components and biosensor and measuring instrument for use therein |
| US7972861B2 (en) | 2004-05-14 | 2011-07-05 | Bayer Healthcare Llc | Methods for performing hematocrit adjustment in glucose assays and devices for same |
| US20050284758A1 (en) | 2004-06-18 | 2005-12-29 | Tom Funke | Novel electrode design for biosensor |
| WO2006110504A1 (en) | 2005-04-08 | 2006-10-19 | Bayer Healthcare Llc | Oxidizable species as an internal reference in control solutions for biosensors |
| US20090014339A1 (en) | 2005-04-08 | 2009-01-15 | Beer Greg P | Oxidizable Species as an Internal Reference in Control Solutions for Biosensors |
| WO2006109280A2 (en) | 2005-04-15 | 2006-10-19 | Agamatrix, Inc. | Method and apparatus for detection of abnormal traces during electrochemical analyte detection |
| US20060231418A1 (en)* | 2005-04-15 | 2006-10-19 | Agamatrix, Inc. | Determination of Partial Fill in Electrochemical Strips |
| US20060231423A1 (en)* | 2005-04-15 | 2006-10-19 | Agamatrix, Inc | Analyte determination method and analyte meter |
| US20060231421A1 (en) | 2005-04-15 | 2006-10-19 | Agamatrix, Inc. | Method for Determination of Analyte Concentrations and Related Apparatus |
| WO2006109277A2 (en) | 2005-04-15 | 2006-10-19 | Agamatrix, Inc. | Determination of partial fill in electrochemical strips |
| US20060231425A1 (en) | 2005-04-15 | 2006-10-19 | Agamatrix, Inc. | Method and Apparatus for Detection of Abnormal Traces during Electrochemical Analyte Detection |
| US20070102292A1 (en) | 2005-05-10 | 2007-05-10 | Roche Diagnostics Operations, Inc. | Method and system for error checking an electrochemical sensor |
| US20070000777A1 (en) | 2005-06-03 | 2007-01-04 | Ho Wah O | Test system |
| US20070017824A1 (en) | 2005-07-19 | 2007-01-25 | Rippeth John J | Biosensor and method of manufacture |
| JP2007087710A (en) | 2005-09-21 | 2007-04-05 | Hitachi Ltd | Connector, terminal or press part used therefor, and manufacturing method thereof |
| US20070074977A1 (en)* | 2005-09-30 | 2007-04-05 | Lifescan, Inc. | Method and apparatus for rapid electrochemical analysis |
| US7749371B2 (en) | 2005-09-30 | 2010-07-06 | Lifescan, Inc. | Method and apparatus for rapid electrochemical analysis |
| WO2007040913A1 (en) | 2005-09-30 | 2007-04-12 | Bayer Healthcare Llc | Gated voltammetry |
| JP2007108171A (en) | 2005-09-30 | 2007-04-26 | Lifescan Inc | Method and instrument for quick electrochemical analysis |
| EP1775587A2 (en) | 2005-10-17 | 2007-04-18 | Lifescan, Inc. | A system and method of processing a current sample for calculating a glucose concentration |
| JP2007133985A (en) | 2005-11-11 | 2007-05-31 | Hitachi Ltd | Magnetic recording / optical recording disk inspection system |
| JP2009528540A (en) | 2006-02-27 | 2009-08-06 | バイエル・ヘルスケア・エルエルシー | Temperature-corrected analyte determination in a biosensor system |
| JP2007248281A (en) | 2006-03-16 | 2007-09-27 | Matsushita Electric Ind Co Ltd | Electrode tip and manufacturing method thereof |
| AU2007201377A1 (en) | 2006-03-31 | 2007-10-18 | Lifescan, Inc. | Systems and methods of discriminating control solution from a physiological sample |
| US20110011752A1 (en) | 2006-03-31 | 2011-01-20 | Lifescan, Inc. | Systems and methods for discriminating contorl solution from a physiological sample |
| US20070235347A1 (en)* | 2006-03-31 | 2007-10-11 | Lifescan, Inc. | Systems and Methods for Discriminating Control Solution from a Physiological Sample |
| JP2007271623A (en) | 2006-03-31 | 2007-10-18 | Lifescan Inc | System and method for discriminating a control solution from a physiological sample |
| EP2267149A1 (en) | 2006-03-31 | 2010-12-29 | LifeScan, Inc. | A method of discriminating control solution from a physiological sample |
| EP1840219A1 (en) | 2006-03-31 | 2007-10-03 | LifeScan, Inc. | Systems and methods of discriminating control solution from a physiological sample |
| US20070227912A1 (en) | 2006-03-31 | 2007-10-04 | Lifescan, Inc. | Methods And Apparatus For Analyzing A Sample In The Presence Of Interferents |
| CA2582643A1 (en) | 2006-03-31 | 2007-09-30 | Lifescan, Inc. | Systems and methods of discriminating control solution from a physiological sample |
| CA2748433A1 (en) | 2006-03-31 | 2007-09-30 | Lifescan, Inc. | Systems and methods of discriminating control solution from a physiological sample |
| EP1839571A1 (en) | 2006-03-31 | 2007-10-03 | LifeScan, Inc. | Methods for analyzing a sample in the presence of interferents |
| US20070235346A1 (en) | 2006-04-11 | 2007-10-11 | Popovich Natasha D | System and methods for providing corrected analyte concentration measurements |
| WO2007131036A1 (en) | 2006-05-03 | 2007-11-15 | Bayer Healthcare Llc | Underfill detection system for an electrochemical biosensor |
| US20070256943A1 (en) | 2006-05-04 | 2007-11-08 | Popovich Natasha D | System and methods for automatically recognizing a control solution |
| WO2007130907A2 (en) | 2006-05-04 | 2007-11-15 | Home Diagnostics, Inc. | System and methods for automatically recognizing a control solution |
| US20090099787A1 (en) | 2006-05-08 | 2009-04-16 | Bayer Healthcare Llc | Abnormal Output Detection System For A Biosensor |
| WO2007133985A2 (en) | 2006-05-08 | 2007-11-22 | Bayer Healthcare Llc | Abnormal output detection system for a biosensor |
| JP2009536744A (en) | 2006-05-08 | 2009-10-15 | バイエル・ヘルスケア・エルエルシー | Abnormal output detection system for biosensor |
| WO2008004565A1 (en) | 2006-07-05 | 2008-01-10 | Panasonic Corporation | Method and apparatus for measuring liquid sample |
| EP2076168A1 (en) | 2006-09-05 | 2009-07-08 | Home Diagnostics, Inc. | System and methods for determining an analyte concentration incorporating a hematocrit correction |
| US20080083618A1 (en) | 2006-09-05 | 2008-04-10 | Neel Gary T | System and Methods for Determining an Analyte Concentration Incorporating a Hematocrit Correction |
| US20100276303A1 (en) | 2006-10-19 | 2010-11-04 | Panasonic Corporation | Method for measuring hematocrit value of blood sample, method for measuring concentration of analyte in blood sample, sensor chip and sensor unit |
| US20100089775A1 (en) | 2006-12-19 | 2010-04-15 | Apex Biotechnology Corp. | Electrochemical test strip, electrochemical test system, and measurement method using the same |
| US20100206749A1 (en) | 2007-09-27 | 2010-08-19 | Philosys Co., Ltd. | Method for corrected erroneous results of measurement in biosensors and apparatus using the same |
| US20090084687A1 (en) | 2007-09-28 | 2009-04-02 | Lifescan, Inc. | Systems and methods of discriminating control solution from a physiological sample |
| EP2098857A2 (en) | 2008-01-17 | 2009-09-09 | LifeScan, Inc. | System and method for measuring an analyte in a sample |
| AU2009200097A1 (en) | 2008-01-17 | 2009-08-06 | Lifescan, Inc. | System and method for measuring an analyte in a sample |
| US20090184004A1 (en) | 2008-01-17 | 2009-07-23 | Lifescan, Inc. | System and method for measuring an analyte in a sample |
| US20090301899A1 (en) | 2008-06-09 | 2009-12-10 | Lifescan, Inc. | System and method for measuring an analyte in a sample |
| AU2009202200A1 (en) | 2008-06-09 | 2009-12-24 | Lifescan, Inc. | System and method for measuring an analyte in a sample |
| US20110297554A1 (en) | 2008-12-08 | 2011-12-08 | Bayer Healthcare Llc | Complex Index Functions |
| US20110301857A1 (en) | 2010-06-07 | 2011-12-08 | Bayer Healthcare Llc | Slope-Based Compensation Including Secondary Output Signals |
Non-Patent Citations (79)
| Title |
|---|
| (Abstract Only) Kobayashi Yoshiaki et al., Biosensor. JP 61002060, Jan. 8, 1986. |
| AU Examination Report for 2009227823; dated Feb. 18, 2013; 3 pages. |
| AU Examination Report for 2012201912; dated Jan. 11, 2013; 4 pages. |
| AU Examination Report for 2012201916; dated Jan. 24, 2013; 4 pages. |
| AU report on 2009227823 dated Nov. 1, 2012. |
| Australian Examination Report for AU 2013263743; dated: Mar. 25, 2015; 4 pages. |
| Australian Examiner's first report on Patent Application No. 2007201377, dated Jun. 25, 2008. |
| Australian Examiner's first report on Patent Application No. 2009202200, dated Jul. 22, 2010 (3 pages). |
| Australian Examiner's Report for application No. 2007201377 dated Mar. 19, 2009, 3 pages. |
| Australian Examiners Report for application No. 2008221593 dated Mar. 30, 3011, 3 pages. |
| Australian Examiner's Report for application No. 2009200097 dated Jul. 2, 2010, 2 pages. |
| Australian Examiner's Report for application No. 2011201199 dated May 10, 2011, 2 pages. |
| Australian Patent Examination Report for AU 2013202702; dated Mar. 11, 2014 (6 pages). |
| Australian Patent Examination Report for AU 2013202708; dated Feb. 18, 2014 (6 pages). |
| Australian Patent Examination Report for AU 2013202716; dated Feb. 28, 2014 (3 pages). |
| Australian Search Report for Australian application No. 2008221593, 3 pages. |
| Canadian Examiner's Requisition for application No. 2582643 dated Mar. 10, 2010, 4 pages. |
| Canadian Examiner's Requisition for application No. 2582643 dated May 19, 2009, 4 pages. |
| Canadian Examiners Requisition for application No. 2639776 dated Dec. 21, 2010, 6 pages. |
| Canadian Examiner's Requisition for Application No. 2648625, dated Apr. 11, 2011, 3 pages. |
| Canadian Office Action and Search Report for CA 2,648,625; dated: Apr. 7, 2015 (5 pages). |
| Canadian Office Action for 2,748,433; dated Aug. 1, 2013; 3 pages. |
| Canadian Office Action for CA 2,668,237; dated Jun. 4, 2014 (3 pages). |
| Canadian Office Action for CA 2,748,433; Dated Nov. 3, 2014; 5 pages. |
| Cha, Kichul, et al., An electronic method for rapid measurement of haematocrit in blood samples; Physiol Meas, 1994. |
| Chinese Office Action and Search Report for CN 200810175601.0; dated Mar. 20, 2013; 7 pages. |
| Chinese Office Action and Search Report for CN 201310139029.3; Dated Sep. 3, 2014; 10 pages. |
| Chinese Office Action for CN 200810175601.0; dated Nov. 28, 2013 (6 pages). |
| Chinese Office Action for CN Application No. 200810175601.0; mailed Jul. 4, 2012; 4 pages. |
| Chinese Office Action issued Nov. 22, 2011 for Application No. 200910134602.5 (15 Pages). |
| CN report for 200910134602 dated Aug. 17, 2012. |
| EP Examination Report for EP 09 250 133,7; dated May 16, 2013; 4 pages. |
| EP Examination Report for EP 12 164 561,8; dated May 2, 2013; 2 pages. |
| EP report for 07251388 dated Jun. 5, 2012. |
| EP report for 08253148 dated Jun. 4, 2012. |
| EP report for 09251507.1 dated Sep. 13, 2012. |
| EP report for 10178905 dated Jun. 8, 2012. |
| EP report for 10178982 dated Jun. 5, 2012. |
| EP report for 12164561 dated Jul. 4, 2012. |
| EP report for 12173284 dated Sep. 7, 2012. |
| EP report for 12173292 dated Sep. 12, 2012. |
| EP report for 12173297 dated Sep. 14, 2012. |
| European Examination Report for application No. 07251388.0 dated Apr. 10, 1008, 4 pages. |
| European Examination Report for EP 09 251 507.1; dated Feb. 3, 2017; 2 pages. |
| European Extended Search Report for Application No. 07251388.0, dated Jul. 9, 2007, 6 pages. |
| European Extended Search Report for Application No. EP 09250133, dated Nov. 30, 2009, 10 pages. |
| European Extended Search Report for Application No. EP 09251507, dated Sep. 14, 2011, 11 pages. |
| European Office Action for EP 09 250 133.7; dated: Nov. 17, 2014; 2 pages. |
| European Office Action for EP 09 251 507.1; Dated: Jun. 17, 2016; 4 pages. |
| European Search Report for application No. 09251507.1 dated May 11, 2011, 5 pages. |
| European Search Report, Application No. EP 08253148.4 mailed Nov. 24, 2010, 7 pages. |
| European Search Report, Application No. EP 09250133, mailed Sep. 15, 2009. |
| European Search Report, Application No. EP 10178905, dated Nov. 25, 2010, 7 pages. |
| European Search Report, Application No. EP 10178982 mailed Nov. 22, 2010. |
| Indian Examination Report for IN 1627/KOL/2008; dated Mar. 27, 2013 (2 pages). |
| Japanese Office Action for Application No. JP 2007-087710, mailed Aug. 9, 2011, 2 pages. |
| Japanese Office Action for JP 2012-261693; dated Feb. 12, 2014 (5 pages). |
| Japanese Office Action for JP 2012-261693; dated: Mar. 24, 2015; 2 pages. |
| Japanese Office Action for JP 2012-261693; Dated: Sep. 2, 2014; 2 pages. |
| Japanese Office Action for JP 2013-129601; dated Mar. 11, 2014 (2 pages). |
| Japanese Office Action for JP 2014-098994; dated: Jan. 13, 2015; 2 pages. |
| Japanese Office Action for JP 2014-098994; Dated: Sep. 1, 2015; 2 pages. |
| Japanese Office Action for JP 2015-234775; dated Jul. 4, 2017; 2 pages. |
| Japanese Office Action for JP 2015-234775; dated: Nov. 29, 2016; 2 pages. |
| Japanese Office Action for JP Application No. 2009-137856; mailed Jul. 31, 2012; 3 pages. |
| Japanese Office Action for JP Application No. 2012-076986; mailed Sep. 4, 2012; 3 pages. |
| Japanese Office Action issued Jan. 10, 2012 for Application No. 2011-123761 (3 Pages). |
| Japanese Office Action issued Nov. 29, 2011 for Application No. 2009-006871 (3 Pages). |
| Japanese Office Action, Application No. JP 2009-006871 mailed Mar. 1, 2011. |
| JP Office Action for 2012-261693; dated Feb. 5, 2013; 2 pages. |
| JP report for 2009137856 dated Jul. 31, 2012. |
| JP report for 2012076986 dated Sep. 4, 2012. |
| Laszlo Daruhazi et al. "Cyclic Voltammetry for Reversible Redox-Electrode Reactions in Thin-Layer Cells With Closely Separated Working and Auxiliary Electrodes of the Same Size" in J. Electroanal. Chem., 264:77-89 (1989). |
| Numerical Recipes: The Art of Scientific Computing, Third Edition. William H. Press et al., Cambridge University Press, Published 2007. |
| Osamu, Niwa, et al., "Electrochemical Behavior of Redox Species at Interdigitated Array Electrodes with Different Geometries: Consideration of Redox Cycling and Collection Efficiency," Analytical Chemistry; Mar. 1990, vol. 62, No. 5, pp. 447-452. |
| Schmidt, "New Principles of amperometric enzyme electrodes . . ." Sensors and Actuators B; vol. 13, No. 1-3, May 1, 1993. |
| SG report for 200900312-0 dated Oct. 11, 2012. |
| Singapore Search Report and Written Opinion for SG 2013028881; dated: Nov. 21, 2014 and Mar. 11, 2015; (21 pages). |
| Wikipedia; Hematocrit; Retrieved on May 24, 2012 (3 pages). |
Also Published As
| Publication number | Publication date |
|---|---|
| CA2668237A1 (en) | 2009-12-09 |
| EP2482069A1 (en) | 2012-08-01 |
| ES2647238T3 (en) | 2017-12-20 |
| AU2009202200B2 (en) | 2011-01-06 |
| HK1172692A1 (en) | 2013-04-26 |
| EP2138841A2 (en) | 2009-12-30 |
| AU2009202200A1 (en) | 2009-12-24 |
| ES2481015T3 (en) | 2014-07-29 |
| EP2482069B1 (en) | 2014-05-14 |
| EP2138841A3 (en) | 2011-10-12 |
| EP2138841B1 (en) | 2017-10-18 |
| EP2138841B8 (en) | 2017-12-13 |
| JP5237201B2 (en) | 2013-07-17 |
| AU2011201224B2 (en) | 2012-04-12 |
| AU2011201224A1 (en) | 2011-04-07 |
| JP5934284B2 (en) | 2016-06-15 |
| JP5806195B2 (en) | 2015-11-10 |
| US8551320B2 (en) | 2013-10-08 |
| JP2013040972A (en) | 2013-02-28 |
| US20130008804A1 (en) | 2013-01-10 |
| JP2014142363A (en) | 2014-08-07 |
| JP2016048258A (en) | 2016-04-07 |
| JP6306557B2 (en) | 2018-04-04 |
| CA2668237C (en) | 2017-02-28 |
| JP2009294213A (en) | 2009-12-17 |
| US20090301899A1 (en) | 2009-12-10 |
Similar Documents
| Publication | Publication Date | Title |
|---|---|---|
| US9784707B2 (en) | System and method for measuring an analyte in a sample | |
| US9739749B2 (en) | System and method for measuring an analyte in a sample | |
| AU2012201916B2 (en) | System and method for measuring an analyte in a sample | |
| HK1138641A (en) | System and method for measuring an analyte in a sample | |
| HK1172692B (en) | Method for checking whether a test strip is sufficiently filled | |
| HK1138641B (en) | System and method for measuring an analyte in a sample | |
| HK1175531B (en) | Method of identifying a defect in a test strip | |
| HK1175247B (en) | Method of identifying a defect in a test strip | |
| HK1175246A (en) | Method of identifying an error in performing a test with a test strip | |
| HK1175246B (en) | Method of identifying an error in performing a test with a test strip | |
| HK1175531A (en) | Method of identifying a defect in a test strip | |
| HK1175247A (en) | Method of identifying a defect in a test strip | |
| HK1137809A (en) | System and method for measuring an analyte in a sample | |
| HK1137809B (en) | System and method for measuring an analyte in a sample |
Legal Events
| Date | Code | Title | Description |
|---|---|---|---|
| STCF | Information on status: patent grant | Free format text:PATENTED CASE | |
| AS | Assignment | Owner name:CILAG GMBH INTERNATIONAL, SWITZERLAND Free format text:ASSIGNMENT OF ASSIGNORS INTEREST;ASSIGNOR:LIFESCAN, INC.;REEL/FRAME:044639/0608 Effective date:20091117 Owner name:LIFESCAN, INC., PENNSYLVANIA Free format text:ASSIGNMENT OF ASSIGNORS INTEREST;ASSIGNORS:HODGES, ALASTAIR M.;CHATELIER, RONALD C.;REEL/FRAME:044639/0565 Effective date:20090528 | |
| AS | Assignment | Owner name:BANK OF AMERICA, N.A., AS COLLATERAL AGENT, NORTH CAROLINA Free format text:SECURITY AGREEMENT;ASSIGNOR:LIFESCAN IP HOLDINGS, LLC;REEL/FRAME:047179/0150 Effective date:20181001 Owner name:BANK OF AMERICA, N.A., AS COLLATERAL AGENT, NORTH Free format text:SECURITY AGREEMENT;ASSIGNOR:LIFESCAN IP HOLDINGS, LLC;REEL/FRAME:047179/0150 Effective date:20181001 | |
| AS | Assignment | Owner name:BANK OF AMERICA, N.A., AS COLLATERAL AGENT, NORTH CAROLINA Free format text:SECURITY AGREEMENT;ASSIGNOR:LIFESCAN IP HOLDINGS, LLC;REEL/FRAME:047186/0836 Effective date:20181001 Owner name:BANK OF AMERICA, N.A., AS COLLATERAL AGENT, NORTH Free format text:SECURITY AGREEMENT;ASSIGNOR:LIFESCAN IP HOLDINGS, LLC;REEL/FRAME:047186/0836 Effective date:20181001 | |
| AS | Assignment | Owner name:CILAG GMBH INTERNATIONAL, SWITZERLAND Free format text:ASSIGNMENT OF ASSIGNORS INTEREST;ASSIGNOR:LIFESCAN INC.;REEL/FRAME:050836/0737 Effective date:20181001 Owner name:LIFESCAN IP HOLDINGS, LLC, CALIFORNIA Free format text:ASSIGNMENT OF ASSIGNORS INTEREST;ASSIGNOR:CILAG GMBH INTERNATIONAL;REEL/FRAME:050837/0001 Effective date:20181001 | |
| MAFP | Maintenance fee payment | Free format text:PAYMENT OF MAINTENANCE FEE, 4TH YEAR, LARGE ENTITY (ORIGINAL EVENT CODE: M1551); ENTITY STATUS OF PATENT OWNER: LARGE ENTITY Year of fee payment:4 | |
| AS | Assignment | Owner name:BANK OF AMERICA, N.A., NORTH CAROLINA Free format text:FIRST LIEN PATENT SECURITY AGREEMENT;ASSIGNOR:LIFESCAN IP HOLDINGS, LLC;REEL/FRAME:063712/0430 Effective date:20230519 | |
| AS | Assignment | Owner name:BANK OF AMERICA, N.A., NORTH CAROLINA Free format text:SECOND LIEN PATENT SECURITY AGREEMENT;ASSIGNOR:LIFESCAN IP HOLDINGS, LLC;REEL/FRAME:063740/0080 Effective date:20230519 | |
| AS | Assignment | Owner name:JOHNSON & JOHNSON CONSUMER INC., NEW JERSEY Free format text:RELEASE OF SECOND LIEN PATENT SECURITY AGREEMENT RECORDED OCT. 3, 2018, REEL/FRAME 047186/0836;ASSIGNOR:BANK OF AMERICA, N.A.;REEL/FRAME:064206/0176 Effective date:20230627 Owner name:JANSSEN BIOTECH, INC., PENNSYLVANIA Free format text:RELEASE OF SECOND LIEN PATENT SECURITY AGREEMENT RECORDED OCT. 3, 2018, REEL/FRAME 047186/0836;ASSIGNOR:BANK OF AMERICA, N.A.;REEL/FRAME:064206/0176 Effective date:20230627 Owner name:LIFESCAN IP HOLDINGS, LLC, CALIFORNIA Free format text:RELEASE OF SECOND LIEN PATENT SECURITY AGREEMENT RECORDED OCT. 3, 2018, REEL/FRAME 047186/0836;ASSIGNOR:BANK OF AMERICA, N.A.;REEL/FRAME:064206/0176 Effective date:20230627 | |
| AS | Assignment | Owner name:CILAG GMBH INTERNATIONAL, SWITZERLAND Free format text:CORRECTIVE ASSIGNMENT TO CORRECT THE PROPERTY LIST BY ADDING PATENTS 6990849;7169116; 7351770;7462265;7468125; 7572356;8093903; 8486245;8066866;AND DELETE 10881560. PREVIOUSLY RECORDED ON REEL 050836 FRAME 0737. ASSIGNOR(S) HEREBY CONFIRMS THE ASSIGNMENT;ASSIGNOR:LIFESCAN INC.;REEL/FRAME:064782/0443 Effective date:20181001 | |
| AS | Assignment | Owner name:ANKURA TRUST COMPANY, LLC, AS SUCCESSOR AGENT, CONNECTICUT Free format text:TRANSFER OF SECURITY AGREEMENT RECORDED AT REEL 047179, FRAME 0150;ASSIGNOR:BANK OF AMERICA, N.A., AS RESIGNING AGENT;REEL/FRAME:069314/0022 Effective date:20241108 | |
| AS | Assignment | Owner name:WILMINGTON SAVINGS FUND SOCIETY, FSB, AS SUCCESSOR AGENT, DELAWARE Free format text:TRANSFER OF SECURITY AGREEMENT RECORDED AT REEL 063740, FRAME 0080;ASSIGNOR:BANK OF AMERICA, N.A., AS RESIGNING AGENT;REEL/FRAME:069340/0243 Effective date:20241108 | |
| FEPP | Fee payment procedure | Free format text:MAINTENANCE FEE REMINDER MAILED (ORIGINAL EVENT CODE: REM.); ENTITY STATUS OF PATENT OWNER: LARGE ENTITY | |
| FEPP | Fee payment procedure | Free format text:7.5 YR SURCHARGE - LATE PMT W/IN 6 MO, LARGE ENTITY (ORIGINAL EVENT CODE: M1555); ENTITY STATUS OF PATENT OWNER: LARGE ENTITY | |
| MAFP | Maintenance fee payment | Free format text:PAYMENT OF MAINTENANCE FEE, 8TH YEAR, LARGE ENTITY (ORIGINAL EVENT CODE: M1552); ENTITY STATUS OF PATENT OWNER: LARGE ENTITY Year of fee payment:8 |