US9727533B2 - Detecting anomalies in a time series - Google Patents
Detecting anomalies in a time seriesDownload PDFInfo
- Publication number
- US9727533B2 US9727533B2US14/282,902US201414282902AUS9727533B2US 9727533 B2US9727533 B2US 9727533B2US 201414282902 AUS201414282902 AUS 201414282902AUS 9727533 B2US9727533 B2US 9727533B2
- Authority
- US
- United States
- Prior art keywords
- time series
- linear regression
- value
- variance
- time
- Prior art date
- Legal status (The legal status is an assumption and is not a legal conclusion. Google has not performed a legal analysis and makes no representation as to the accuracy of the status listed.)
- Expired - Fee Related, expires
Links
Images


Classifications
- G—PHYSICS
- G06—COMPUTING OR CALCULATING; COUNTING
- G06F—ELECTRIC DIGITAL DATA PROCESSING
- G06F17/00—Digital computing or data processing equipment or methods, specially adapted for specific functions
- G06F17/10—Complex mathematical operations
- G06F17/18—Complex mathematical operations for evaluating statistical data, e.g. average values, frequency distributions, probability functions, regression analysis
- G—PHYSICS
- G06—COMPUTING OR CALCULATING; COUNTING
- G06F—ELECTRIC DIGITAL DATA PROCESSING
- G06F18/00—Pattern recognition
- G06F18/20—Analysing
- G06F18/24—Classification techniques
- G06F18/243—Classification techniques relating to the number of classes
- G06F18/2433—Single-class perspective, e.g. one-against-all classification; Novelty detection; Outlier detection
- G06K9/00536—
- G06K9/6284—
- G—PHYSICS
- G06—COMPUTING OR CALCULATING; COUNTING
- G06F—ELECTRIC DIGITAL DATA PROCESSING
- G06F2218/00—Aspects of pattern recognition specially adapted for signal processing
- G06F2218/12—Classification; Matching
Definitions
- This patent applicationgenerally relates to detecting anomalies in a time series, and more specifically, to determining whether an apparent anomaly is a true anomaly or a modeling consequence of a previous anomaly.
- time series data produced by a systemmay be analyzed to build models to extract patterns and predict future data. For example, the number of “likes” that are expected to be processed by a social network on a particular day may correlate with the number of “likes” that were processed on one or more previous days.
- a computing systemmay employ predictions to allocate computing resources, e.g., processors, memory, storage, etc., so that processing data does not exceed a particular threshold. For example, in response to a prediction that the system will process a large volume of data on a future day, more computing resources may be allocated to the system on that future day.
- computing resourcese.g., processors, memory, storage, etc.
- patternsmay generally exist in times series data, these patterns may occasionally be broken for various reasons, resulting in various anomalies. For example, the number of “like” actions in a social network may unexpectedly drop on a particular day due to a lack of cellular phone reception within a geographical region, preventing users from interacting with the social network on their cellular devices. Similarly, an Internet server or connection may have unexpectedly been unavailable or taken down for service, etc. Thus, an anomaly may cause observations (e.g. actual data) to deviate from predictions. Moreover, an anomaly may affect future predictions due to the time-dependent nature of particular data models, in that a particular model could make a prediction that echoes an anomaly that is unlikely to occur again. Such false predictions may cause an incorrect allocation of computing resources, which may lead to additional system instability or other issues.
- FIGS. 1A and 1Bare graph diagrams illustrating an example time series and related data.
- FIG. 2is a flow diagram illustrating an example process for detecting an anomaly.
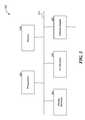
- FIG. 3is a block diagram illustrating example components of a computer system that may be used to implement various features of the disclosed embodiments.
- the technologybuilds a linear regression model for time series data, computes a prediction for a future time based on the linear regression model, determines whether a prediction error for the prediction is larger than a threshold and, if so, raises an alarm.
- p(t)may serve as a prediction of y(t) for a future time t.
- the least squares approachmay be used to estimate the values of weight vector w based on historical values as follows:
- weight vector wmay be constrained to be non-negative.
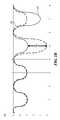
- FIGS. 1A and 1Bare graph diagrams illustrating an example time series and related data.
- the vertical axismeasures counts (e.g., 100's of “likes”) and the horizontal axis identifies time, e.g., days.
- FIG. 1Ashows an ideal (or “signal”) version ⁇ (t) of y(t), which is y(t) without anomalies, as well as the prediction p(t) of y(t).
- ⁇ (t)has a two-day rhythm in that data from two days ago predicts today's data well.
- FIG. 1Bshows y(t) as well as p(t) again for comparison.
- the difference between the prediction and the time series, p(t) ⁇ y(t),is referred to herein as the “prediction error,” and the difference between the prediction and the ideal (or “signal”) portion, p(t) ⁇ (t), is referred to herein as the “prediction deviation.”
- an anomalytypically corresponds to a large prediction error.
- the standard deviation of the prediction error with respect to data in which anomalies have not occurredcan be a good measure of uncertainty in the prediction.
- the standard deviation of the prediction error with respect to data in which anomalies have not occurredwhich is close to zero, may be computed from the data for days 1-4 as shown in FIG. 1B .
- the prediction erroris substantially larger than the standard deviation, such as greater than five times the standard deviation, an anomaly may be identified with sufficient confidence.
- the prediction error at day 5 104is substantially greater than the aforementioned standard deviation of close to zero as shown in FIG. 1B , and thus an anomaly may be identified for day 5.
- a large prediction errormay not necessarily point to an anomaly.
- the modelgives a large weight to data from two days ago in its prediction.
- a large dropoccurs as shown for y(t) in FIGS. 1B and 1 s detected as an anomaly.
- the prediction p(t)takes a large dip as shown in FIG. 1B , largely echoing what happened two days earlier and leading to another prediction error 102 that does not correspond to an anomaly in actual data y(t).
- This subsequent prediction errormay not be as large as the initial prediction error in general, as the model may depend on data at multiple past time points and not just the time point including the anomaly.
- an approach to dealing with the echo problemis to take into consideration the possibility that the prediction p(t) may be poor due to past anomalies and modify the approach of detecting anomalies.
- the standard deviation of the prediction deviation when p(t) is affected by anomalieswhich is generally greater than the standard deviation of the prediction error in which no anomalies have occurred, may be used instead for detecting anomalies.
- This approachmight work better as it accounts for data variance due to echoing anomalies.
- the prediction errorbe sufficiently larger than the standard deviation of the prediction deviation when p(t) is affected by anomalies, it is more likely to prevent identifying an echoing anomaly as an anomaly in actual data.
- the standard deviation of the prediction deviation when p(t) is affected by anomaliesmay theoretically be computed from the data for days 4-8 as shown in FIG. 1A .
- the variance of the prediction deviation when p(t) is affected by anomaliesmay be computed as follows:
- Vwould then represent the general uncertainty in the prediction, while C would correspond to additional uncertainty introduced by anomalies, likely causing echoing anomalies.
- Vcan be the square of the standard deviation of the prediction error with respect to data in which anomalies have not occurred as discussed above and could be computed from a portion of the time series that is deemed to have no anomalies. If the portion of time series used for this purpose in fact contains anomalies, for instance if the timing of past anomalies is not known, V can still be computed from that portion, usually leading to an only slightly larger number if anomalies are not too frequent. Assuming that n is also independent from one time point to the next, C may be computed as follows:
- p(t) ⁇ y(t)may be assumed to be drawn from a distribution with variance V+Var(n(t)).
- V+Var(n(t))may then be estimated as (p(t) ⁇ y(t)) 2 , with the constraint that it must be greater than V.
- Cmay be further computed as follows:
- both the prediction error and the associated weight for a time pointshould be large to lead to a significant contribution to C.
- the additional uncertaintywould be significant only when anomalous historical data falls on regions of large weights.
- FIG. 2is a flow diagram summarizing an example process for detecting an anomaly with respect to V+C.
- a linear-regression modelis built for a time series. As discussed above, the non-negative form of regularization may be applied in fitting the model.
- the variance and standard deviation of the prediction deviationis calculated.
- a thresholdmay be determined based on the calculated standard deviation, such as five times the calculated standard deviation. From then on, the model and the calculated standard deviation can be used for detecting anomalies at every time point.
- a prediction for the next time pointis calculated using the linear-regression model.
- whether the prediction error is bigger than the predetermined thresholdis determined.
- an alarmis raised for a potential anomaly.
- the thresholdmay prevent an alarm from being raised.
- the modelmay be updated at various times, such as periodically or after a specified number of anomalies occur.
- FIG. 3is a block diagram illustrating example components of a computer system that may be used to implement various features of the embodiments.
- the computing system 300may include one or more central processing units (“processors”) 305 , memory 310 , input/output devices 325 (e.g., keyboard and pointing devices, display devices), storage devices 320 (e.g., disk drives), and network adapters 330 (e.g., network interfaces) that are connected to an interconnect 315 .
- the interconnect 315is illustrated as an abstraction that represents any one or more separate physical buses, point to point connections, or both connected by appropriate bridges, adapters, or controllers.
- the interconnect 315may include, for example, a system bus, a Peripheral Component Interconnect (PCI) bus or PCI-Express bus, a HyperTransport or industry standard architecture (ISA) bus, a small computer system interface (SCSI) bus, a universal serial bus (USB), IIC ( 12 C) bus, or an Institute of Electrical and Electronics Engineers (IEEE) standard 1394 bus, also called “Firewire”.
- PCIPeripheral Component Interconnect
- ISAindustry standard architecture
- SCSIsmall computer system interface
- USBuniversal serial bus
- IIC12 C
- IEEEInstitute of Electrical and Electronics Engineers
- the memory 310 and storage devices 320are computer-readable storage media that may store instructions that implement at least portions of the various embodiments.
- the data structures and message structuresmay be stored or transmitted via a data transmission medium, such as a signal on a communications link.
- Various communications linksmay be used, such as the Internet, a local area network, a wide area network, or a point-to-point dial-up connection.
- computer readable mediacan include computer-readable storage media (e.g., “non transitory” media) and computer-readable transmission media.
- the instructions stored in memory 310can be implemented as software and/or firmware to program the processor(s) 305 to carry out actions described above.
- such software or firmwaremay be initially provided to the processing system 300 by downloading it from a remote system through the computing system 300 (e.g., via network adapter 330 ).
- programmable circuitrye.g., one or more microprocessors
- special-purpose hardwired circuitrymay be in the form of, for example, one or more ASICs, PLDs, FPGAs, etc.
- the disclosed technologyimplements a method of detecting anomalies in time series data, comprising: modeling a time series using a linear regression framework; representing the time series as a sum of a signal portion and a noise, wherein the signal portion corresponds to time-dependent data, and the noise removes time dependence from the data; calculating, for a specified time, a variance of a difference between a value of the time series predicted by the linear regression framework and a value of the signal portion; determining a threshold based on the calculated variance; and raising an alarm when a difference between a value of the time series predicted by the linear regression framework and an observed value of the time series for the specified time is larger than the threshold.
- the modelingcan include fitting the linear regression framework using a least squares approach with a non-negative form of regularization.
- the methodcan include calculating includes deriving the variance as a sum of a first variance of a difference between a value of the signal portion and a value of the signal portion estimated by the linear regression framework for the time point, and a second variance.
- the first variancecan be estimated from values of the time series determined to contain no anomalies.
- the linear regression frameworkcan be defined by a plurality of weights respectively associated with a plurality of past time periods, and the second variance can be estimated as a sum of, over a plurality of time periods, a product of, a square of the weight and a difference of, a square of, a difference between a value of the time series estimated by the linear regression framework and a value of the time series, and the first variance, for each of the time periods.
- the determined thresholdcan be five times the square root of the calculated variance.
- the technologycan include a computer-readable storage medium storing computer-executable instructions that, when executed, cause a computer to perform a method of detecting anomalies in time series data, comprising: instructions for modeling a time series using a linear regression framework; instructions for representing the time series as a sum of a signal portion and a noise, wherein the signal portion corresponds to time-dependent data, and the noise removes time dependence from the data; instructions for calculating, for a specified time, a variance of a difference between a value of the time series predicted by the linear regression framework and a value of the signal portion; instructions for determining a threshold based on the calculated variance; and instructions for raising an alarm when a difference between a value of the time series predicted by the linear regression framework and an observed value of the specified time is larger than the threshold.
- the technologyimplements a system for detecting anomalies in time series data, comprising: a modeling component configured to model a time series using a linear regression framework; a representing component configured to represent the time series as a sum of a signal portion and a noise, wherein the signal portion corresponds to time-dependent data, and the noise takes the data out of time dependence; a calculating component configured to calculate a variance of a difference between a value of the time series estimated by the linear regression framework and a value of the signal portion for a time point; a determining component configured to determine a threshold based on the calculated variance; and an alarm component configured to raise an alarm when a difference between a value of the time series estimated by the linear regression framework and an observed value of the time series for a time point is greater than the threshold.
Landscapes
- Engineering & Computer Science (AREA)
- Physics & Mathematics (AREA)
- Data Mining & Analysis (AREA)
- General Physics & Mathematics (AREA)
- Theoretical Computer Science (AREA)
- Pure & Applied Mathematics (AREA)
- Computational Mathematics (AREA)
- Mathematical Physics (AREA)
- Mathematical Optimization (AREA)
- Mathematical Analysis (AREA)
- General Engineering & Computer Science (AREA)
- Evolutionary Biology (AREA)
- Bioinformatics & Cheminformatics (AREA)
- Life Sciences & Earth Sciences (AREA)
- Bioinformatics & Computational Biology (AREA)
- Operations Research (AREA)
- Probability & Statistics with Applications (AREA)
- Algebra (AREA)
- Databases & Information Systems (AREA)
- Software Systems (AREA)
- Evolutionary Computation (AREA)
- Computer Vision & Pattern Recognition (AREA)
- Artificial Intelligence (AREA)
- Testing And Monitoring For Control Systems (AREA)
- Debugging And Monitoring (AREA)
Abstract
Description
p(t)=w·x(t),
x(t)=[y(t−1), . . . ,y(t−T)],w=[w1, . . . ,WT],
where T is typically chosen to be large enough to capture particular time dependencies. Once modeled, p(t) may serve as a prediction of y(t) for a future time t. The least squares approach may be used to estimate the values of weight vector w based on historical values as follows:
where the maximum value of i depends on the amount of past data available. In particular embodiments, the values of weight vector w may be constrained to be non-negative.
where the value of a is chosen using cross-validation. However, the high likelihood of dependence between randomly chosen validation sets and training sets can tend to lead to an over-fit solution. On the other hand, increasing the value of a often leads to an under-fit solution.
y(t)={circumflex over (Y)}(t)+n(t), with {circumflex over (X)}(t)=[{circumflex over (Y)}(t−1), . . . ,{circumflex over (Y)}(t−T)]
Claims (18)
Priority Applications (1)
| Application Number | Priority Date | Filing Date | Title |
|---|---|---|---|
| US14/282,902US9727533B2 (en) | 2014-05-20 | 2014-05-20 | Detecting anomalies in a time series |
Applications Claiming Priority (1)
| Application Number | Priority Date | Filing Date | Title |
|---|---|---|---|
| US14/282,902US9727533B2 (en) | 2014-05-20 | 2014-05-20 | Detecting anomalies in a time series |
Publications (2)
| Publication Number | Publication Date |
|---|---|
| US20150339265A1 US20150339265A1 (en) | 2015-11-26 |
| US9727533B2true US9727533B2 (en) | 2017-08-08 |
Family
ID=54556181
Family Applications (1)
| Application Number | Title | Priority Date | Filing Date |
|---|---|---|---|
| US14/282,902Expired - Fee RelatedUS9727533B2 (en) | 2014-05-20 | 2014-05-20 | Detecting anomalies in a time series |
Country Status (1)
| Country | Link |
|---|---|
| US (1) | US9727533B2 (en) |
Cited By (27)
| Publication number | Priority date | Publication date | Assignee | Title |
|---|---|---|---|---|
| WO2019224694A1 (en)* | 2018-05-24 | 2019-11-28 | International Business Machines Corporation | Anomaly detection |
| US10635563B2 (en) | 2016-08-04 | 2020-04-28 | Oracle International Corporation | Unsupervised method for baselining and anomaly detection in time-series data for enterprise systems |
| US10699211B2 (en) | 2016-02-29 | 2020-06-30 | Oracle International Corporation | Supervised method for classifying seasonal patterns |
| US10817803B2 (en) | 2017-06-02 | 2020-10-27 | Oracle International Corporation | Data driven methods and systems for what if analysis |
| US10855548B2 (en) | 2019-02-15 | 2020-12-01 | Oracle International Corporation | Systems and methods for automatically detecting, summarizing, and responding to anomalies |
| US10867421B2 (en) | 2016-02-29 | 2020-12-15 | Oracle International Corporation | Seasonal aware method for forecasting and capacity planning |
| US10885461B2 (en) | 2016-02-29 | 2021-01-05 | Oracle International Corporation | Unsupervised method for classifying seasonal patterns |
| US10915830B2 (en) | 2017-02-24 | 2021-02-09 | Oracle International Corporation | Multiscale method for predictive alerting |
| US10949436B2 (en) | 2017-02-24 | 2021-03-16 | Oracle International Corporation | Optimization for scalable analytics using time series models |
| US10963346B2 (en) | 2018-06-05 | 2021-03-30 | Oracle International Corporation | Scalable methods and systems for approximating statistical distributions |
| US10970186B2 (en) | 2016-05-16 | 2021-04-06 | Oracle International Corporation | Correlation-based analytic for time-series data |
| US10997517B2 (en) | 2018-06-05 | 2021-05-04 | Oracle International Corporation | Methods and systems for aggregating distribution approximations |
| US11082439B2 (en) | 2016-08-04 | 2021-08-03 | Oracle International Corporation | Unsupervised method for baselining and anomaly detection in time-series data for enterprise systems |
| US11138090B2 (en) | 2018-10-23 | 2021-10-05 | Oracle International Corporation | Systems and methods for forecasting time series with variable seasonality |
| US11222287B2 (en) | 2019-07-25 | 2022-01-11 | International Business Machines Corporation | Machine learning for failure event identification and prediction |
| US11232133B2 (en) | 2016-02-29 | 2022-01-25 | Oracle International Corporation | System for detecting and characterizing seasons |
| US11237939B2 (en)* | 2017-03-01 | 2022-02-01 | Visa International Service Association | Predictive anomaly detection framework |
| US20220180179A1 (en)* | 2020-12-09 | 2022-06-09 | International Business Machines Corporation | Detecting anomalies in computer systems based on forecasted timeseries |
| US11388040B2 (en) | 2018-10-31 | 2022-07-12 | EXFO Solutions SAS | Automatic root cause diagnosis in networks |
| US20220335347A1 (en)* | 2021-04-15 | 2022-10-20 | Business Objects Software Ltd | Time-series anomaly prediction and alert |
| US11522766B2 (en) | 2020-02-12 | 2022-12-06 | EXFO Solutions SAS | Method and system for determining root-cause diagnosis of events occurring during the operation of a communication network |
| US11533326B2 (en) | 2019-05-01 | 2022-12-20 | Oracle International Corporation | Systems and methods for multivariate anomaly detection in software monitoring |
| US11537940B2 (en) | 2019-05-13 | 2022-12-27 | Oracle International Corporation | Systems and methods for unsupervised anomaly detection using non-parametric tolerance intervals over a sliding window of t-digests |
| US11645293B2 (en) | 2018-12-11 | 2023-05-09 | EXFO Solutions SAS | Anomaly detection in big data time series analysis |
| US11887015B2 (en) | 2019-09-13 | 2024-01-30 | Oracle International Corporation | Automatically-generated labels for time series data and numerical lists to use in analytic and machine learning systems |
| US12001926B2 (en) | 2018-10-23 | 2024-06-04 | Oracle International Corporation | Systems and methods for detecting long term seasons |
| US12052134B2 (en) | 2021-02-02 | 2024-07-30 | Exfo Inc. | Identification of clusters of elements causing network performance degradation or outage |
Families Citing this family (13)
| Publication number | Priority date | Publication date | Assignee | Title |
|---|---|---|---|---|
| US8676680B2 (en) | 2006-02-03 | 2014-03-18 | Zillow, Inc. | Automatically determining a current value for a home |
| US10380653B1 (en) | 2010-09-16 | 2019-08-13 | Trulia, Llc | Valuation system |
| GB2507934A (en)* | 2011-09-21 | 2014-05-14 | Ibm | Method, device and computer program for detecting occurrence of abnormality |
| US11093982B1 (en) | 2014-10-02 | 2021-08-17 | Zillow, Inc. | Determine regional rate of return on home improvements |
| US9323599B1 (en)* | 2015-07-31 | 2016-04-26 | AppDynamics, Inc. | Time series metric data modeling and prediction |
| JP6661559B2 (en)* | 2017-02-03 | 2020-03-11 | 株式会社東芝 | Error detection device, error detection method and program |
| US10628252B2 (en)* | 2017-11-17 | 2020-04-21 | Google Llc | Real-time anomaly detection and correlation of time-series data |
| US11210158B2 (en) | 2017-11-29 | 2021-12-28 | Riverbed Technology, Inc. | Automated problem diagnosis on logs using anomalous telemetry analysis |
| CN109993092B (en)* | 2019-03-25 | 2021-03-16 | 清华大学 | Real-time high-sensitivity early identification method and device for abnormal light variation |
| CN110245047B (en)* | 2019-05-29 | 2023-11-24 | 创新先进技术有限公司 | Time sequence abnormality detection method, device and equipment |
| US11861748B1 (en) | 2019-06-28 | 2024-01-02 | MFTB Holdco, Inc. | Valuation of homes using geographic regions of varying granularity |
| CN111552921A (en)* | 2020-04-15 | 2020-08-18 | 成都飞机工业(集团)有限责任公司 | Flight data preprocessing method for anomaly detection |
| CN114707687B (en)* | 2021-12-21 | 2024-02-13 | 南京大学 | Decadal precipitation prediction method and system based on tropical atmospheric subseasonal oscillation signals |
Citations (2)
| Publication number | Priority date | Publication date | Assignee | Title |
|---|---|---|---|---|
| US7346471B2 (en)* | 2005-09-02 | 2008-03-18 | Microsoft Corporation | Web data outlier detection and mitigation |
| US8577649B2 (en)* | 2010-03-30 | 2013-11-05 | Kabushiki Kaisha Toshiba | Anomaly detecting apparatus |
- 2014
- 2014-05-20USUS14/282,902patent/US9727533B2/ennot_activeExpired - Fee Related
Patent Citations (2)
| Publication number | Priority date | Publication date | Assignee | Title |
|---|---|---|---|---|
| US7346471B2 (en)* | 2005-09-02 | 2008-03-18 | Microsoft Corporation | Web data outlier detection and mitigation |
| US8577649B2 (en)* | 2010-03-30 | 2013-11-05 | Kabushiki Kaisha Toshiba | Anomaly detecting apparatus |
Cited By (39)
| Publication number | Priority date | Publication date | Assignee | Title |
|---|---|---|---|---|
| US10970891B2 (en) | 2016-02-29 | 2021-04-06 | Oracle International Corporation | Systems and methods for detecting and accommodating state changes in modelling |
| US11232133B2 (en) | 2016-02-29 | 2022-01-25 | Oracle International Corporation | System for detecting and characterizing seasons |
| US10699211B2 (en) | 2016-02-29 | 2020-06-30 | Oracle International Corporation | Supervised method for classifying seasonal patterns |
| US11670020B2 (en) | 2016-02-29 | 2023-06-06 | Oracle International Corporation | Seasonal aware method for forecasting and capacity planning |
| US11928760B2 (en) | 2016-02-29 | 2024-03-12 | Oracle International Corporation | Systems and methods for detecting and accommodating state changes in modelling |
| US10867421B2 (en) | 2016-02-29 | 2020-12-15 | Oracle International Corporation | Seasonal aware method for forecasting and capacity planning |
| US10885461B2 (en) | 2016-02-29 | 2021-01-05 | Oracle International Corporation | Unsupervised method for classifying seasonal patterns |
| US11113852B2 (en) | 2016-02-29 | 2021-09-07 | Oracle International Corporation | Systems and methods for trending patterns within time-series data |
| US11080906B2 (en) | 2016-02-29 | 2021-08-03 | Oracle International Corporation | Method for creating period profile for time-series data with recurrent patterns |
| US11836162B2 (en) | 2016-02-29 | 2023-12-05 | Oracle International Corporation | Unsupervised method for classifying seasonal patterns |
| US10970186B2 (en) | 2016-05-16 | 2021-04-06 | Oracle International Corporation | Correlation-based analytic for time-series data |
| US11082439B2 (en) | 2016-08-04 | 2021-08-03 | Oracle International Corporation | Unsupervised method for baselining and anomaly detection in time-series data for enterprise systems |
| US10635563B2 (en) | 2016-08-04 | 2020-04-28 | Oracle International Corporation | Unsupervised method for baselining and anomaly detection in time-series data for enterprise systems |
| US10949436B2 (en) | 2017-02-24 | 2021-03-16 | Oracle International Corporation | Optimization for scalable analytics using time series models |
| US10915830B2 (en) | 2017-02-24 | 2021-02-09 | Oracle International Corporation | Multiscale method for predictive alerting |
| US11237939B2 (en)* | 2017-03-01 | 2022-02-01 | Visa International Service Association | Predictive anomaly detection framework |
| US11841786B2 (en) | 2017-03-01 | 2023-12-12 | Visa International Service Association | Predictive anomaly detection framework |
| US10817803B2 (en) | 2017-06-02 | 2020-10-27 | Oracle International Corporation | Data driven methods and systems for what if analysis |
| WO2019224694A1 (en)* | 2018-05-24 | 2019-11-28 | International Business Machines Corporation | Anomaly detection |
| US11860971B2 (en) | 2018-05-24 | 2024-01-02 | International Business Machines Corporation | Anomaly detection |
| GB2586565A (en)* | 2018-05-24 | 2021-02-24 | Ibm | Anomaly detection |
| US10963346B2 (en) | 2018-06-05 | 2021-03-30 | Oracle International Corporation | Scalable methods and systems for approximating statistical distributions |
| US10997517B2 (en) | 2018-06-05 | 2021-05-04 | Oracle International Corporation | Methods and systems for aggregating distribution approximations |
| US12001926B2 (en) | 2018-10-23 | 2024-06-04 | Oracle International Corporation | Systems and methods for detecting long term seasons |
| US11138090B2 (en) | 2018-10-23 | 2021-10-05 | Oracle International Corporation | Systems and methods for forecasting time series with variable seasonality |
| US11388040B2 (en) | 2018-10-31 | 2022-07-12 | EXFO Solutions SAS | Automatic root cause diagnosis in networks |
| US11736339B2 (en) | 2018-10-31 | 2023-08-22 | EXFO Solutions SAS | Automatic root cause diagnosis in networks |
| US11645293B2 (en) | 2018-12-11 | 2023-05-09 | EXFO Solutions SAS | Anomaly detection in big data time series analysis |
| US10855548B2 (en) | 2019-02-15 | 2020-12-01 | Oracle International Corporation | Systems and methods for automatically detecting, summarizing, and responding to anomalies |
| US11533326B2 (en) | 2019-05-01 | 2022-12-20 | Oracle International Corporation | Systems and methods for multivariate anomaly detection in software monitoring |
| US11949703B2 (en) | 2019-05-01 | 2024-04-02 | Oracle International Corporation | Systems and methods for multivariate anomaly detection in software monitoring |
| US11537940B2 (en) | 2019-05-13 | 2022-12-27 | Oracle International Corporation | Systems and methods for unsupervised anomaly detection using non-parametric tolerance intervals over a sliding window of t-digests |
| US11222287B2 (en) | 2019-07-25 | 2022-01-11 | International Business Machines Corporation | Machine learning for failure event identification and prediction |
| US11887015B2 (en) | 2019-09-13 | 2024-01-30 | Oracle International Corporation | Automatically-generated labels for time series data and numerical lists to use in analytic and machine learning systems |
| US11522766B2 (en) | 2020-02-12 | 2022-12-06 | EXFO Solutions SAS | Method and system for determining root-cause diagnosis of events occurring during the operation of a communication network |
| US20220180179A1 (en)* | 2020-12-09 | 2022-06-09 | International Business Machines Corporation | Detecting anomalies in computer systems based on forecasted timeseries |
| US12052134B2 (en) | 2021-02-02 | 2024-07-30 | Exfo Inc. | Identification of clusters of elements causing network performance degradation or outage |
| US20220335347A1 (en)* | 2021-04-15 | 2022-10-20 | Business Objects Software Ltd | Time-series anomaly prediction and alert |
| US12293320B2 (en)* | 2021-04-15 | 2025-05-06 | Business Objects Software Ltd. | Time-series anomaly prediction and alert |
Also Published As
| Publication number | Publication date |
|---|---|
| US20150339265A1 (en) | 2015-11-26 |
Similar Documents
| Publication | Publication Date | Title |
|---|---|---|
| US9727533B2 (en) | Detecting anomalies in a time series | |
| US9996444B2 (en) | Automated methods and systems for calculating hard thresholds | |
| US10565516B2 (en) | Updating prediction model | |
| CN108038040B (en) | Computer cluster performance index detection method, electronic equipment and storage medium | |
| US8880962B2 (en) | Maintenance planning and failure prediction from data observed within a time window | |
| CN110929799B (en) | Method, electronic device, and computer-readable medium for detecting abnormal user | |
| US11915311B2 (en) | User score model training and calculation | |
| US20180018575A1 (en) | Social collaboration in probabilistic prediction | |
| US20160328641A1 (en) | Automated Safety KPI Enhancement | |
| US20220382857A1 (en) | Machine Learning Time Series Anomaly Detection | |
| US9684872B2 (en) | Method and apparatus for generating data in a missing segment of a time data sequence | |
| JP6845126B2 (en) | Failure probability calculation device, failure probability calculation method and program | |
| US20170132531A1 (en) | Analysis device, analysis method, and program | |
| US20160104125A1 (en) | Computing system and method for providing information relating to maintenance actions | |
| CA2949351A1 (en) | Methods for statistical prediction of well production and reserves | |
| CN110874640B (en) | Distribution selection and simulation of intermittent data using machine learning (ML) | |
| US11042880B1 (en) | Authenticating users in the presence of small transaction volumes | |
| US20190220924A1 (en) | Method and device for determining key variable in model | |
| US20160147816A1 (en) | Sample selection using hybrid clustering and exposure optimization | |
| US20170141993A1 (en) | Optimizing the monitoring of an enterprise server environment | |
| US9632905B2 (en) | Data-agnostic adjustment of hard thresholds based on user feedback | |
| US10796036B2 (en) | Prediction of inhalable particles concentration | |
| US11928730B1 (en) | Training machine learning models with fairness improvement | |
| CN116386026B (en) | Training method of point cloud 3D detection model and point cloud detection method | |
| CN113793162A (en) | Logistics data processing method and device, storage medium and equipment |
Legal Events
| Date | Code | Title | Description |
|---|---|---|---|
| AS | Assignment | Owner name:FACEBOOK, INC., CALIFORNIA Free format text:ASSIGNMENT OF ASSIGNORS INTEREST;ASSIGNOR:THIBAUX, ROMAIN J.;REEL/FRAME:033643/0430 Effective date:20140814 | |
| STCF | Information on status: patent grant | Free format text:PATENTED CASE | |
| MAFP | Maintenance fee payment | Free format text:PAYMENT OF MAINTENANCE FEE, 4TH YEAR, LARGE ENTITY (ORIGINAL EVENT CODE: M1551); ENTITY STATUS OF PATENT OWNER: LARGE ENTITY Year of fee payment:4 | |
| AS | Assignment | Owner name:META PLATFORMS, INC., CALIFORNIA Free format text:CHANGE OF NAME;ASSIGNOR:FACEBOOK, INC.;REEL/FRAME:058871/0336 Effective date:20211028 | |
| FEPP | Fee payment procedure | Free format text:MAINTENANCE FEE REMINDER MAILED (ORIGINAL EVENT CODE: REM.); ENTITY STATUS OF PATENT OWNER: LARGE ENTITY | |
| LAPS | Lapse for failure to pay maintenance fees | Free format text:PATENT EXPIRED FOR FAILURE TO PAY MAINTENANCE FEES (ORIGINAL EVENT CODE: EXP.); ENTITY STATUS OF PATENT OWNER: LARGE ENTITY | |
| STCH | Information on status: patent discontinuation | Free format text:PATENT EXPIRED DUE TO NONPAYMENT OF MAINTENANCE FEES UNDER 37 CFR 1.362 | |
| FP | Lapsed due to failure to pay maintenance fee | Effective date:20250808 |