US9696903B2 - Real-time data visualization of streaming data - Google Patents
Real-time data visualization of streaming dataDownload PDFInfo
- Publication number
- US9696903B2 US9696903B2US15/197,733US201615197733AUS9696903B2US 9696903 B2US9696903 B2US 9696903B2US 201615197733 AUS201615197733 AUS 201615197733AUS 9696903 B2US9696903 B2US 9696903B2
- Authority
- US
- United States
- Prior art keywords
- data
- attribute
- value
- element set
- physical processors
- Prior art date
- Legal status (The legal status is an assumption and is not a legal conclusion. Google has not performed a legal analysis and makes no representation as to the accuracy of the status listed.)
- Active
Links
Images


Classifications
- G—PHYSICS
- G06—COMPUTING OR CALCULATING; COUNTING
- G06F—ELECTRIC DIGITAL DATA PROCESSING
- G06F16/00—Information retrieval; Database structures therefor; File system structures therefor
- G06F16/90—Details of database functions independent of the retrieved data types
- G06F16/903—Querying
- G06F16/90335—Query processing
- G—PHYSICS
- G06—COMPUTING OR CALCULATING; COUNTING
- G06F—ELECTRIC DIGITAL DATA PROCESSING
- G06F16/00—Information retrieval; Database structures therefor; File system structures therefor
- G06F16/20—Information retrieval; Database structures therefor; File system structures therefor of structured data, e.g. relational data
- G06F16/21—Design, administration or maintenance of databases
- G06F16/219—Managing data history or versioning
- G—PHYSICS
- G06—COMPUTING OR CALCULATING; COUNTING
- G06F—ELECTRIC DIGITAL DATA PROCESSING
- G06F16/00—Information retrieval; Database structures therefor; File system structures therefor
- G06F16/20—Information retrieval; Database structures therefor; File system structures therefor of structured data, e.g. relational data
- G06F16/24—Querying
- G06F16/245—Query processing
- G06F16/2455—Query execution
- G06F16/24568—Data stream processing; Continuous queries
- G—PHYSICS
- G06—COMPUTING OR CALCULATING; COUNTING
- G06F—ELECTRIC DIGITAL DATA PROCESSING
- G06F16/00—Information retrieval; Database structures therefor; File system structures therefor
- G06F16/20—Information retrieval; Database structures therefor; File system structures therefor of structured data, e.g. relational data
- G06F16/24—Querying
- G06F16/245—Query processing
- G06F16/2458—Special types of queries, e.g. statistical queries, fuzzy queries or distributed queries
- G06F16/2462—Approximate or statistical queries
- G—PHYSICS
- G06—COMPUTING OR CALCULATING; COUNTING
- G06F—ELECTRIC DIGITAL DATA PROCESSING
- G06F16/00—Information retrieval; Database structures therefor; File system structures therefor
- G06F16/20—Information retrieval; Database structures therefor; File system structures therefor of structured data, e.g. relational data
- G06F16/24—Querying
- G06F16/248—Presentation of query results
- G—PHYSICS
- G06—COMPUTING OR CALCULATING; COUNTING
- G06F—ELECTRIC DIGITAL DATA PROCESSING
- G06F16/00—Information retrieval; Database structures therefor; File system structures therefor
- G06F16/40—Information retrieval; Database structures therefor; File system structures therefor of multimedia data, e.g. slideshows comprising image and additional audio data
- G—PHYSICS
- G06—COMPUTING OR CALCULATING; COUNTING
- G06F—ELECTRIC DIGITAL DATA PROCESSING
- G06F16/00—Information retrieval; Database structures therefor; File system structures therefor
- G06F16/90—Details of database functions independent of the retrieved data types
- G06F16/903—Querying
- G06F16/9038—Presentation of query results
- G06F17/30017—
- G06F17/30309—
- G06F17/30516—
- G06F17/30536—
- G06F17/30554—
- G—PHYSICS
- G06—COMPUTING OR CALCULATING; COUNTING
- G06F—ELECTRIC DIGITAL DATA PROCESSING
- G06F3/00—Input arrangements for transferring data to be processed into a form capable of being handled by the computer; Output arrangements for transferring data from processing unit to output unit, e.g. interface arrangements
- G06F3/01—Input arrangements or combined input and output arrangements for interaction between user and computer
- G06F3/048—Interaction techniques based on graphical user interfaces [GUI]
- G06F3/0481—Interaction techniques based on graphical user interfaces [GUI] based on specific properties of the displayed interaction object or a metaphor-based environment, e.g. interaction with desktop elements like windows or icons, or assisted by a cursor's changing behaviour or appearance
- G06F3/04817—Interaction techniques based on graphical user interfaces [GUI] based on specific properties of the displayed interaction object or a metaphor-based environment, e.g. interaction with desktop elements like windows or icons, or assisted by a cursor's changing behaviour or appearance using icons
- G—PHYSICS
- G06—COMPUTING OR CALCULATING; COUNTING
- G06F—ELECTRIC DIGITAL DATA PROCESSING
- G06F3/00—Input arrangements for transferring data to be processed into a form capable of being handled by the computer; Output arrangements for transferring data from processing unit to output unit, e.g. interface arrangements
- G06F3/01—Input arrangements or combined input and output arrangements for interaction between user and computer
- G06F3/048—Interaction techniques based on graphical user interfaces [GUI]
- G06F3/0481—Interaction techniques based on graphical user interfaces [GUI] based on specific properties of the displayed interaction object or a metaphor-based environment, e.g. interaction with desktop elements like windows or icons, or assisted by a cursor's changing behaviour or appearance
- G06F3/0482—Interaction with lists of selectable items, e.g. menus
- G—PHYSICS
- G06—COMPUTING OR CALCULATING; COUNTING
- G06F—ELECTRIC DIGITAL DATA PROCESSING
- G06F3/00—Input arrangements for transferring data to be processed into a form capable of being handled by the computer; Output arrangements for transferring data from processing unit to output unit, e.g. interface arrangements
- G06F3/01—Input arrangements or combined input and output arrangements for interaction between user and computer
- G06F3/048—Interaction techniques based on graphical user interfaces [GUI]
- G06F3/0484—Interaction techniques based on graphical user interfaces [GUI] for the control of specific functions or operations, e.g. selecting or manipulating an object, an image or a displayed text element, setting a parameter value or selecting a range
- G06F3/04847—Interaction techniques to control parameter settings, e.g. interaction with sliders or dials
- G—PHYSICS
- G06—COMPUTING OR CALCULATING; COUNTING
- G06F—ELECTRIC DIGITAL DATA PROCESSING
- G06F3/00—Input arrangements for transferring data to be processed into a form capable of being handled by the computer; Output arrangements for transferring data from processing unit to output unit, e.g. interface arrangements
- G06F3/01—Input arrangements or combined input and output arrangements for interaction between user and computer
- G06F3/048—Interaction techniques based on graphical user interfaces [GUI]
- G06F3/0484—Interaction techniques based on graphical user interfaces [GUI] for the control of specific functions or operations, e.g. selecting or manipulating an object, an image or a displayed text element, setting a parameter value or selecting a range
- G06F3/0485—Scrolling or panning
- G06F3/04855—Interaction with scrollbars
- G—PHYSICS
- G06—COMPUTING OR CALCULATING; COUNTING
- G06F—ELECTRIC DIGITAL DATA PROCESSING
- G06F3/00—Input arrangements for transferring data to be processed into a form capable of being handled by the computer; Output arrangements for transferring data from processing unit to output unit, e.g. interface arrangements
- G06F3/01—Input arrangements or combined input and output arrangements for interaction between user and computer
- G06F3/048—Interaction techniques based on graphical user interfaces [GUI]
- G06F3/0484—Interaction techniques based on graphical user interfaces [GUI] for the control of specific functions or operations, e.g. selecting or manipulating an object, an image or a displayed text element, setting a parameter value or selecting a range
- G06F3/0486—Drag-and-drop
- G—PHYSICS
- G06—COMPUTING OR CALCULATING; COUNTING
- G06F—ELECTRIC DIGITAL DATA PROCESSING
- G06F3/00—Input arrangements for transferring data to be processed into a form capable of being handled by the computer; Output arrangements for transferring data from processing unit to output unit, e.g. interface arrangements
- G06F3/01—Input arrangements or combined input and output arrangements for interaction between user and computer
- G06F3/048—Interaction techniques based on graphical user interfaces [GUI]
- G06F3/0487—Interaction techniques based on graphical user interfaces [GUI] using specific features provided by the input device, e.g. functions controlled by the rotation of a mouse with dual sensing arrangements, or of the nature of the input device, e.g. tap gestures based on pressure sensed by a digitiser
- G06F3/0488—Interaction techniques based on graphical user interfaces [GUI] using specific features provided by the input device, e.g. functions controlled by the rotation of a mouse with dual sensing arrangements, or of the nature of the input device, e.g. tap gestures based on pressure sensed by a digitiser using a touch-screen or digitiser, e.g. input of commands through traced gestures
- G06F3/04883—Interaction techniques based on graphical user interfaces [GUI] using specific features provided by the input device, e.g. functions controlled by the rotation of a mouse with dual sensing arrangements, or of the nature of the input device, e.g. tap gestures based on pressure sensed by a digitiser using a touch-screen or digitiser, e.g. input of commands through traced gestures for inputting data by handwriting, e.g. gesture or text
- G—PHYSICS
- G06—COMPUTING OR CALCULATING; COUNTING
- G06Q—INFORMATION AND COMMUNICATION TECHNOLOGY [ICT] SPECIALLY ADAPTED FOR ADMINISTRATIVE, COMMERCIAL, FINANCIAL, MANAGERIAL OR SUPERVISORY PURPOSES; SYSTEMS OR METHODS SPECIALLY ADAPTED FOR ADMINISTRATIVE, COMMERCIAL, FINANCIAL, MANAGERIAL OR SUPERVISORY PURPOSES, NOT OTHERWISE PROVIDED FOR
- G06Q10/00—Administration; Management
- G06Q10/10—Office automation; Time management
- G—PHYSICS
- G06—COMPUTING OR CALCULATING; COUNTING
- G06F—ELECTRIC DIGITAL DATA PROCESSING
- G06F2203/00—Indexing scheme relating to G06F3/00 - G06F3/048
- G06F2203/048—Indexing scheme relating to G06F3/048
- G06F2203/04806—Zoom, i.e. interaction techniques or interactors for controlling the zooming operation
- G—PHYSICS
- G06—COMPUTING OR CALCULATING; COUNTING
- G06F—ELECTRIC DIGITAL DATA PROCESSING
- G06F3/00—Input arrangements for transferring data to be processed into a form capable of being handled by the computer; Output arrangements for transferring data from processing unit to output unit, e.g. interface arrangements
- G06F3/01—Input arrangements or combined input and output arrangements for interaction between user and computer
- G06F3/048—Interaction techniques based on graphical user interfaces [GUI]
- G06F3/0484—Interaction techniques based on graphical user interfaces [GUI] for the control of specific functions or operations, e.g. selecting or manipulating an object, an image or a displayed text element, setting a parameter value or selecting a range
- G06F3/04845—Interaction techniques based on graphical user interfaces [GUI] for the control of specific functions or operations, e.g. selecting or manipulating an object, an image or a displayed text element, setting a parameter value or selecting a range for image manipulation, e.g. dragging, rotation, expansion or change of colour
Definitions
- the inventionrelates generally to data visualization, including real-time data visualization of streaming data using touch-association-based creation and interaction, multi-data-store retrieval of data, multiple-query-based sharpening, and/or other features.
- the inventionaddressing these and other drawbacks relates to methods, apparatuses, and/or systems for facilitating real-time data visualization of streaming data.
- real-time, tactile, interactive data visualizationsthat enable users to easily swipe, pinch, zoom-in or zoom-out, drag-and-drop, rotate, or perform other operations to gain a better understanding of the data may be provided.
- Data streams from internal and/or external sourcesmay be combined, organized, and/or analyzed.
- Real-time data visualizationsmay be provided based on the results of the combining, organizing, and/or analyzing.
- a time-based slidermay enable users to seamlessly switch between live and historical streams that can come from various sources (e.g., real-time store, temporary data cache, historical data store, etc.).
- Real-time datamay be compared with a historical baseline based on simultaneously streaming from a real-time store, a temporary data cache, or a historical data store. It is understood that various features (e.g., components, operations, or other features) described herein may be implemented separately or in combination with other features.
- a system for facilitating real-time data visualization of streaming datamay comprise one or more servers (or other components) that include one or more processors configured to execute one or more computer program modules.
- the computer program modulesmay include a data visualization module, a control interface module, an input module, a switch module, a query module, or other modules.
- the data visualization modulemay be configured to provide, in a first portion of a user interface, a first data element set associated with a first attribute.
- the first data element setmay include individual first data elements. Each of the individual first data elements may represent a first value associated with the first attribute.
- the control interface modulemay be configured to provide, in a second portion of the user interface, a control element set that includes individual control elements. Each of the individual control elements may represent an attribute.
- the input modulemay be configured to receive a first touch-based input indicating an association of a first one of the individual control element (provided in the second portion of the user interface) with a first one of the individual first data elements (provided in the first portion of the user interface).
- the data visualization modulemay be configured to provide a second data element set associated with a second attribute in the first portion of the user interface responsive to the association indicated by the first touch-based input.
- the second attribute associated with the second data element setmay be different than the first attribute associated with the first data element set.
- the second attributemay be the attribute represented by the first one of the individual control elements.
- the second data element setmay include individual second data elements. Each of the individual second data elements may represent a second value that is associated with the second attribute and that correspond to the first value represented by the first one of the first individual data elements.
- the association indicated by the first touch-based inputmay correspond to dragging the first one of the individual control elements onto the first one of the individual first data elements or dragging the first one of the individual first data elements onto the first one of the individual control elements.
- the first touch-based inputmay indicate another association of the first one of the individual control elements with a second one of the individual first data elements.
- the other association indicated by the first touch-based inputmay correspond to dragging the first one of the individual control elements onto the second one of the individual first data elements or dragging the second one of the individual first data elements onto the first one of the individual control elements.
- the data visualization modulemay provide a third data element set associated with the second attribute (of the second data element set) in the first portion of the user interface with the second data element set.
- the third element setmay include individual third data elements.
- Each of the individual third data elementsmay represent a second value associated with the second attribute and correspond to the first value represented by the second one of the first individual data elements.
- the data visualization modulemay be configured to determine that the second attribute is the attribute represented by the first one of the individual control elements responsive to the association indicated by the first touch-based input.
- the data visualization modulemay be configured to provide the second data element set in the first portion of the user interface responsive to determining that the second attribute is the attribute represented by the first one of the individual control elements.
- the input modulemay be configured to receive a second touch-based input indicating a zoom operation relating to a first one of the individual second data elements (of the second data element set).
- the data visualization modulemay be configured to provide, in the first portion of the user interface, a third data element set associated with a third attribute different than the second attribute responsive to the zoom operation indicated by the second touch-based input.
- the third data element setmay include individual third data elements. Each of the individual third data elements may represent a third value associated with the third attribute.
- the zoom operationmay comprise a zoom-in operation. Responsive to determining that the zoom operation comprises the zoom-in operation, the data visualization module may be configured to provide the third data element set in the first portion of the user interface such that each of the individual third data elements of the third data element set corresponds to the first value represented by the first one of the individual first data elements (of the first data element set) and the second value represented by the first one of the individual second data elements (of the second data element set).
- the zoom operationcomprises a zoom-out operation. Responsive to determining that the zoom operation comprises the zoom-out operation, the data visualization module may be configured to such that the third attribute is the first attribute associated with the first data element set.
- the data visualization modulemay be configured to determine that the third attribute (associated with the third data element set) is hierarchically lower or higher than the second attribute responsive to the zoom operation indicated by the second touch-based input.
- the data visualization modulemay be configured to, responsive to determining that the third attribute is hierarchically lower or higher than the second attribute, provide the third data element set in the first portion of the user interface based on the third data element set being associated with the third attribute.
- the query modulemay be configured to perform queries relating to the second attribute (associated with the second data element set) across a plurality of sources responsive to the association (of the first one of the individual control elements of the control element set with the first one of the individual first data elements of the first data element set) indicated by the first touch-based input.
- the query modulemay be configured to receive individual subsets of data relating to the second values (represented by the individual second data elements of the second data element set).
- the data visualization modulemay be configured to predict at least some of the second values using the individual subsets of data based on a determination that other subsets of data relating to the at least some of the second values have not yet been received.
- the data visualization modulemay be configured to generate the individual second data elements (of the second data element set) based on the prediction.
- the second data element setmay be provided based on the generated individual second data elements.
- the data visualization modulemay be configured to provide, in a first portion of a user interface, a first data element set that includes individual first data elements representing first values associated with at least one attribute.
- the control interface modulemay be configured to provide, in a second portion of the user interface, a sliding-based control element that includes a moveable control element and points associated with times.
- the data visualization modulemay be configured to dynamically update the provided first data element set in real-time responsive to real-time streaming of data from a plurality of sources.
- the provided first data element setmay be dynamically updated such that the individual first data elements represent dynamically updated values of the first values in lieu of the first values.
- the input modulemay be configured to receive a first touch-based input indicating moving of the movable control element (of the sliding-based control element) to a first one of the points that is associated with a first one of the times.
- the switch modulemay be configured to, responsive to the moving of the movable control element indicated by the first touch-based input, determine whether to stream data from a temporary data cache or a historical data store to obtain second values that are associated with the at least one attribute and that correspond to the first one of the times.
- the data visualization modulemay be configured to obtain the second values based on the determination of whether to stream data from the temporary data cache or the historical data store.
- the data visualization modulemay be configured to provide, in the first portion of the user interface, a second data element set that includes individual second data elements representing the obtained second values (that are associated with the at least one attribute and that correspond to the first one of the times).
- the first one of the timesmay correspond to a time of a recent dynamic update of the provided first data element set.
- the data visualization modulemay be configured to dynamically update the provided second data element set responsive to streaming of data from the historical data store.
- the provided second data element setmay, for example, be dynamically updated such that the individual second data elements represent dynamically updated values of the second values in lieu of the second values.
- the data visualization modulemay be configured to simultaneously provide, in the first portion of the user interface, the dynamically updated first data element set and the dynamically updated second data element set.
- the dynamically updated first data element setmay correspond to a first time period.
- the dynamically updated second data element setmay correspond to a second time period different than the first time period.
- the dynamically updated first data element set and the dynamically updated second data element setmay continuously correspond to a same reference point of time of the first time period and the second time period.
- the query modulemay be configured to perform queries relating to the at least one attribute (associated with the first data element set) on the historical data store responsive to a determination to stream data from the historical data store.
- the query modulemay be configured to receive individual subsets of data relating to the second values (that are associated with the at least one attribute and that correspond to the first one of the times) responsive to performing of the queries.
- the data visualization modulemay be configured to predict at least some of the second values using the individual subsets of data based on a determination that other subsets of data relating to the at least some of the second values have not yet been received.
- the data visualization modulemay be configured to generate the individual second data elements based on the prediction.
- the second data element setmay be provided based on the generated individual second data elements.
- FIG. 1illustrates a diagram of a system for facilitating real-time data visualization of streaming data, in accordance with one or more implementations.
- FIG. 2Aillustrates an exemplary diagram of a user interface for facilitating real-time data visualization of streaming data, in accordance with one or more implementations.
- FIGS. 2B, 2C, and 2Dillustrate exemplary diagrams of components of a user interface for facilitating real-time data visualization of streaming data, in accordance with one or more implementations.
- FIGS. 2E, 2F, 2G, 2H, 2I, and 2Jillustrate exemplary diagrams of different views of a user interface for facilitating real-time data visualization of streaming data, in accordance with one or more implementations.
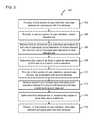
- FIG. 3illustrates a flowchart of processing operations for facilitating touch-association-based creation of and interaction with visualizations, in accordance with one or more implementations.
- FIG. 4illustrates a flowchart of processing operations for facilitating sliding-based control associated with multi-data-store retrieval of data, in accordance with one or more implementations.
- FIG. 5illustrates a diagram of a data visualization architecture, in accordance with one or more implementations.
- FIG. 6illustrates a diagram of a user interface for creating or modifying visualizations, in accordance with one or more implementations.
- FIG. 7illustrates a diagram of a stream processing engine configured to perform micro-queries to generate data visualizations, in accordance with one or more implementations.
- FIG. 1illustrates a diagram of system 100 for facilitating real-time data visualization of streaming data, in accordance with one or more implementations.
- System 100may comprise one or more servers 102 .
- Server 102(or servers 102 ) may be configured to communicate with one or more user devices 104 according to a client/server architecture (e.g., over communication network 106 or via other communication medium). Users may access system 100 via user devices 104 .
- client/server architecturee.g., over communication network 106 or via other communication medium.
- Server 102may be configured to execute one or more computer program modules to facilitate real-time data visualization of streaming data.
- the computer program modulesmay include a data visualization module 108 , a control interface module 110 , an input module 112 , a switch module 114 , a query module 116 , or other modules.
- Data visualization module 108may be configured to provide, in a first portion of a user interface, a first data element set associated with a first attribute.
- the first data element setmay include individual first data elements. Each of the individual first data elements may represent a first value associated with the first attribute.
- Control interface module 110may be configured to provide, in a second portion of the user interface, a control element set that includes individual control elements. Each of the individual control elements may represent an attribute.
- FIG. 2Aillustrates an exemplary diagram of a user interface 200 for facilitating real-time data visualization of streaming data, in accordance with one or more implementations.
- user interface 200may include portions 202 , 204 , and 206 .
- Portion 202may include control elements 208 .
- Each of the control elements 208may be represent an attribute of a plurality of attributes.
- control element 208 amay represent Attribute A that is associated with a value type 1 (e.g., general number, currency, target, or other types)
- control element 208 bmay represent Attribute B that is associated with a value type 2 (e.g., general number, currency, target, or other types).
- Portion 204may include axis information sections 210 and 212 , along with data elements 214 .
- Data elements 214may be associated with at least one attribute. Attributes associated with data elements 214 may, for instance, be indicated in axis information sections 210 and 212 . Each of the data elements 214 may represent a value associated with an attribute indicated in at least one of axis information sections 210 and 212 .
- axis information section 210may indicate Attribute H along with values associated with Attribute H (e.g., overall revenue or other attribute).
- axis information section 212may indicate Attribute I (e.g., product category or other attribute).
- a usermay swipe, zoom-in or zoom-out, filter, or perform other actions on portion 204 of user interface 200 to explore other available data elements 214 that may not currently be in the viewable area of portion 204 or initiate requests for other data elements.
- attributes relating to product salesmay include product category, product group, product satisfaction, stock-keeping unit (SKU), transaction time, user city, user state, user gender, user income, volume, overall revenue, average revenue, or other attributes.
- SKUstock-keeping unit
- Table 1 belowmay represent attributes (e.g., first row) and values associated with the attributes (e.g., other rows) that may be streamed in real-time prior to processing of the data stream by a stream processing engine.
- the overall revenue values for each of the product category valuesmay be calculated by a stream processing engine based on the product price values corresponding to product sales for a certain time period (e.g., current day, week, month, year, etc.).
- data element 214 amay represent the overall revenue from sales of women's watches for the current year thus far
- data element 214 bmay represent the overall revenue from sales of rings for the current year thus far
- data element 214 cmay present the overall revenue from sales of bracelets for the current year thus far
- data element 214 dmay present the overall revenue from sales of men's watches for the current year thus far, and so on.
- the set of data elements 214may be updated continuously to represent the most up-to-date overall revenue values for each of the product category values (e.g., calculated based on product price values corresponding to recent product sales during the certain time period) and/or the most update-to-date set of product category values (e.g., a new data element 214 may be added to the set of data elements 214 to represent overall revenue from product sales of a product category that the company recently started selling).
- data visualization module 108may determine how to handle new/unknown attributes, existing attributes, new/unknown values, existing values, or other information based on crowd sourcing.
- User actionsmay, for instance, be monitored by one or more modules (e.g., crowd sourcing module or other module) of system 100 to determine data dependencies (e.g., which attributes are frequently looked at hierarchically by users, which sources are frequently combined together by users, etc.), similarities among attributes, values, etc. (e.g., which attributes are frequently grouped together), users with expertise in certain domains (e.g., indicating users that are to be prompted by system 100 to inquiry on how to handle new/unknown information), or other information.
- data dependenciese.g., which attributes are frequently looked at hierarchically by users, which sources are frequently combined together by users, etc.
- similarities among attributes, values, etc.e.g., which attributes are frequently grouped together
- users with expertise in certain domainse.g., indicating users that are to be prompted by system 100 to
- portion 206may include a pause/play button 216 for pausing or playing the data visualization, an indicator 218 specifying that the data visualization is live data, and a sliding-based control element 220 having a movable control element 222 for rewinding to visualize historical data, fast-forwarding back to visualizing live data, fast-forwarding to visualize predictions of future data, etc.
- the data visualization that is depicted in portion 204may represent live data.
- a usermay, for example, slide movable control element 222 to the left on sliding-based control element 220 to switch the data visualization of the live data to a data visualization of historical data.
- a usermay modify the view of user interface 200 (e.g., changing the view of a bar chart to one of a bubble chart) such that portion 204 presents data elements 224 in lieu of data elements 214 (which are shown in FIG. 2A ).
- Individual ones of data elements 224may correspond to individual ones of data elements 214 .
- Data element 224 amay correspond to data element 214 a
- data element 224 bmay correspond to data element 214 b
- data element 224 cmay correspond to data element 214 c , and so on.
- data elements 214 a and 224 amay each represent the product category value “Women's Watch” associated with the product category attribute and the overall revenue value “$120,000” associated with the overall revenue attribute.
- Data elements 214 b and 224 bmay each represent the product category value “Ring” associated with the product category attribute and the overall revenue value “$95,000” associated with the overall revenue attribute.
- data elements 214 of FIG. 2Amay represent the individual overall revenue values of the different product categories by the individual heights of the data elements 214 (e.g., a higher bar may indicate higher overall revenue).
- data elements 224 of FIG. 2Emay represent the individual overall revenue values of the different product categories by the individual sizes of the data elements 214 (e.g., a larger circle may indicate higher overall revenue).
- a usermay cause data elements 224 to simultaneously represent values associated with an additional attribute (e.g., using other user interface control elements (not shown for illustrative convenience)).
- the usermay activate window 226 to utilize color to represent values associated with the additional attribute.
- the values to be further represented by data elements 224 through the use of different colorsmay be product satisfaction values associated with the product satisfaction attribute.
- the usermay utilize moveable control elements 228 on sliding-based control element 230 to define the value ranges for each of the different colors (which are illustrated as different patterns on FIG. 2F ) that will be reflected by data elements 224 .
- the first color on the left side of the sliding-based control element 230represents product satisfaction values between and including ⁇ 5.0 and ⁇ 1.0.
- the second color in the middle of the sliding-based control element 230represents product satisfaction values between ⁇ 1.0 and 1.0.
- the third color in the right side of the sliding-based control elementrepresents product satisfaction values between and including 1.0 and 5.0.
- data elements 224may indicate that, for a particular data set, women's watches (e.g., represented by data element 224 a ) are generally given a low product satisfaction rating compared to other products, and rings (e.g., represented by data element 224 b are generally given a high product satisfaction rating compared to other products.
- a usermay cause data elements 224 to simultaneously present values associated with further attributes (e.g., using other user interface control elements (not shown for illustrative convenience)).
- the usermay cause data elements 224 to further represent the average income of consumers purchasing a particular product category based on the x-axis position of a given data element 224 and the average price of products in the product category based on the y-axis position of the given data element 224 (e.g., greater x-axis position may represent a higher average income, greater y-axis position may represent a high average price, etc.).
- the attributes and/or the attribute valuesmay drive the color, size, x-axis and y-axis positions, labels, or other features of data elements 224 , for instance, as the attributes and/or the attribute values represented by data elements 224 are dynamically updated based on continuous streaming of data (e.g., from a single source, from multiple sources, etc.).
- a usermay modify the view of user interface 200 such that portion 204 simultaneously presents data elements 214 representing live up-to-date data along with data elements 232 representing historical data.
- FIG. 2Hmay illustrate joining data based on time to generate data visualizations.
- data elements 214 and data elements 232may be associated with the same attributes (e.g., the attribute “Product Category” or other attribute).
- data elements 214may represent values that correspond to the current day, while data elements 232 may represent values that correspond to a previous day (e.g., one day before the current day).
- Data element 214 amay, for instance, represent the overall revenue from sales of women's watches for the current day up until the current time.
- Data element 232 amay represent the overall revenue from sales of women's watches for the previous day up until a reference time corresponding to the current time. As data elements 214 are updated to reflect the current time, data elements 232 may be updated to reflect a reference time that corresponds to the current time.
- data regarding the number of pizzas ordered and the number of tweetsmay be joined based on geographic area by data visualization module 108 as tweet-related data and the pizza-related data are streamed in and received by data visualization module 108 .
- data visualization module 108may generate data elements 234 to represent the join data.
- Data elements 234may, for instance, represent the number of pizzas ordered compared to the number of tweets in one or more geographical areas.
- one of the data elements 234may represent the pizza/tweet numbers in an area in northern California, one of the data elements 234 may represent the pizza/tweet numbers in an area in central California, one of the data elements 234 may represent the pizza/tweet numbers in an area in southern California, and one of the data elements 234 may represent the pizza/tweet numbers in an area in southern Nevada.
- the number of tweets in a geographic areamay be represented by the overall size of the data element 234 corresponding to the geographic area where larger data elements 234 represent more tweets in corresponding geographic areas than smaller data elements 234 .
- the number of pizzas ordered in a geographic areamay be represented by a sub-element (e.g., the white portion) within the data element 234 corresponding to the geographic area where the size of the sub-element within the data element 234 represents a ratio of the number of tweets vs. the number of pizzas ordered in the geographic area. If, for instance, the size of the sub-element is one-fourth the overall size of the data element 234 , the represented ratio may be 1000 tweets to 25 pizzas ordered in the geographic area. On the other hand, if the size of the sub-element is the same as the overall size of the data element 234 , the represented ratio may be 10 tweets to 1 pizza ordered.
- data elements 234may indicate that there are substantially more tweets in the area in southern Nevada (e.g., Las Vegas) than the area in northern California, and that the ratio of tweets to pizzas ordered in the area in southern Nevada is substantially greater than the ratio of tweets to pizzas ordered in the area in northern California.
- Data elements 234may also indicate that there are more tweets in the area in central California than the area in southern California, but that the ratio of tweets to pizzas ordered in the area in central California is substantially less than the ratio of tweets to pizzas ordered in the area in southern California.
- the overall size of a given data element 234 for a geographic areamay be based on the number of tweets in the geographic area and may not be based on the number of pizzas ordered in the geographic area.
- the size of the sub-element within the data element 234may be based on both the number of tweets in the geographic area and the number of pizzas ordered in the geographic area (e.g., a result of being based on the ratio of tweets vs. pizzas ordered).
- data elements presented on a user interfacemay indicate the ratio of the number of tweets vs. the number of pizzas ordered in one or more geographic areas without actually indicating the absolute number of tweets or the absolute number of pizzas ordered.
- the sizes of two different data elements corresponding to two geographic areasmay be approximately the same size on the user interface because the tweet/pizza ratios are approximately the same in the two geographic areas.
- the data elements corresponding to the two areasmay still be roughly the same size.
- user interface 200may allow users to save visualizations shown by FIG. 2A, 2E, 2F, 2G, 2H, 2I , or 2 J (or other visualizations) and securely share them with others. Once shared, the other users may view the visualizations, manipulate the visualizations, or even create new visualizations and share the new visualizations with others.
- Input module 112may be configured to receive a first touch-based input indicating an association of a first one of the individual control element (provided in the second portion of the user interface) with a first one of the individual first data elements (provided in the first portion of the user interface).
- Data visualization module 108may be configured to provide a second data element set associated with a second attribute in the first portion of the user interface responsive to the association indicated by the first touch-based input.
- the second attribute associated with the second data element setmay be different than the first attribute associated with the first data element set.
- the second attributemay be the attribute represented by the first one of the individual control elements.
- the second data element setmay include individual second data elements. Each of the individual second data elements may represent a second value that is associated with the second attribute and that correspond to the first value represented by the first one of the first individual data elements.
- control element 208 amay represent the attribute “User City,” and the other control elements 208 may represent other attributes relating to product sales (e.g., product category, product group, product satisfaction, stock-keeping unit (SKU), transaction time, user state, user gender, user income, volume, overall revenue, average revenue, or other attributes).
- product salese.g., product category, product group, product satisfaction, stock-keeping unit (SKU), transaction time, user state, user gender, user income, volume, overall revenue, average revenue, or other attributes.
- Data element 214 amay represent the product category value “Women's Watch” associated with the product category attribute and the overall revenue value “$120,000” associated with the overall revenue attribute.
- the other data elements 214may represent other product category values associated with the product category attribute and other overall revenue values associated with the overall revenue attribute.
- control element 208 ae.g., representing the user city attribute
- data element 214 ae.g., representing the product category value “Women's Watch” and the overall revenue value $120,000
- information relating to the product category value “Women's Watch”may be queried based on the user city attribute.
- a requestmay be initiated for data elements that are associated with the user city attribute and the overall revenue attribute, and that correspond to the product category value “Women's Watch.”
- the overall revenue values from sales of women's watches in each of the cities that correspond to user city valuesmay, for instance, be calculated by a stream processing engine for a certain time period (e.g., current day, week, month, year, etc.).
- the requested data elementsmay represent the overall revenues from sales of women's watches in each of the cities for the certain time period thus far.
- a first one of the requested data elementsmay represent the overall revenue from sales of women's watches in New York for the certain time period thus far
- a second one of the requested data elementsmay represent the overall revenue from sales of women's watches in Los Angeles for the certain time period thus far
- a third one of the requested data elementsmay represent the overall revenue from sales of women's watches in Chicago for the certain time period thus far
- the requested data elementsmay be provided in portion 204 of user interface 200 .
- system 100may allow users to visualize information relating to one or more particular data elements or other elements, for example, via touch-based interactions.
- the first touch-based inputmay indicate another association of the first one of the individual control elements with a second one of the individual first data elements.
- the other association indicated by the first touch-based inputmay correspond to dragging the first one of the individual control elements onto the second one of the individual first data elements or dragging the second one of the individual first data elements onto the first one of the individual control elements.
- data visualization module 108may provide a third data element set associated with the second attribute (of the second data element set) in the first portion of the user interface with the second data element set.
- the third element setmay include individual third data elements.
- Each of the individual third data elementsmay represent a second value associated with the second attribute and correspond to the first value represented by the second one of the first individual data elements.
- control element 208 amay represent the attribute “User City.”
- Data element 214 amay represent the product category value “Women's Watch” associated with the product category attribute and the overall revenue value “$120,000” associated with the overall revenue attribute.
- Data element 214 bmay represent the product category value “Ring” associated with the product category attribute and the overall revenue value “$95,000” associated with the overall revenue attribute.
- a usermay touch and drag control element 208 a onto both data elements 214 a and 214 b , for instance, by hovering control element 208 a over data element 214 a for a predetermined amount of time without releasing control element 208 a and then releasing control element 208 a onto data element 214 b .
- Such user actionmay cause information relating to the product category values “Women's Watch” or “Ring” to be queried based on the user city attribute.
- a requestmay be initiated for data elements that are associated with the user city attribute and the overall revenue attribute, and that correspond to the product category values “Women's Watch” or “Ring.”
- the overall revenue values from sales of women's watches and rings in each of the cities corresponding to the user city valuesmay, for instance, be calculated by a stream processing engine for a certain time period.
- the requested data elementsmay represent the overall revenues from sales of women's watches and rings in each of the cities for the certain time period thus far.
- a first one of the requested data elementsmay represent the overall revenue from sales of women's watches and rings in New York for the certain time period thus far
- a second one of the requested data elementsmay represent the overall revenue from sales of women's watches and rings in Los Angeles for the certain time period thus far
- a third one of the requested data elementsmay represent the overall revenue from sales of women's watches and rings in Chicago for the certain time period thus far
- the requested data elementsmay be provided in portion 204 of user interface 200 .
- data visualization module 108may be configured to determine that the second attribute is the attribute represented by the first one of the individual control elements responsive to the association indicated by the first touch-based input.
- Data visualization module 108may be configured to provide the second data element set in the first portion of the user interface responsive to determining that the second attribute is the attribute represented by the first one of the individual control elements.
- control element 208 amay represent the attribute “User City.”
- Data element 214 amay represent the product category value “Women's Watch” associated with the attribute “Product Category,” and the overall revenue value “$120,000” associated with the attribute “Overall Revenue.”
- the user city attributemay be determined as the attribute represented by control element 208 a .
- information relating to the product category value “Women's Watch”may be queried based on the determined user city attribute.
- input module 112may be configured to receive a second touch-based input indicating a zoom operation relating to a first one of the individual second data elements (of the second data element set).
- Data visualization module 108may be configured to provide, in the first portion of the user interface, a third data element set associated with a third attribute different than the second attribute responsive to the zoom operation indicated by the second touch-based input.
- the third data element setmay include individual third data elements. Each of the individual third data elements may represent a third value associated with the third attribute.
- the zoom operationmay comprise a zoom-in operation. Responsive to determining that the zoom operation comprises the zoom-in operation, data visualization module 108 may be configured to provide the third data element set in the first portion of the user interface such that each of the individual third data elements of the third data element set corresponds to the first value represented by the first one of the individual first data elements (of the first data element set) and the second value represented by the first one of the individual second data elements (of the second data element set).
- dragging of control element 208 aonto data element 214 a (e.g., representing the product category value “Women's Watch” associated with the product category attribute) may trigger initiation of a request for data elements that are associated with the user city attribute and that correspond to the product category value “Women's Watch.”
- the requested data elementsmay, for example, represent the overall revenues from sales of women's watches in each of the cities corresponding to the user city values (e.g., New York, Los Angeles, Chicago, Houston, Philadelphia, Phoenix, San Diego, etc.) for the certain time period thus far.
- the requested data elementsmay be provided in portion 204 of user interface 200 .
- the usermay perform a zoom-in gesture on a particular one of the requested data elements (e.g., representing one of the user city values). If, for instance, the user performs a zoom-in gesture on the particular one of the requested data elements, a further request for data elements that are associated with an attribute different than the user city attribute and the product category attribute, and that correspond to the product category value “Women's Watch” and the user city value represented by the particular one of the requested data elements.
- the further requested data elementse.g., that is provided in portion 204 responsive to the performed zoom-in gesture
- the zoom operationcomprises a zoom-out operation. Responsive to determining that the zoom operation comprises the zoom-out operation, data visualization module 108 may be configured to such that the third attribute is the first attribute associated with the first data element set. With respect to the above scenario, the user may perform a zoom-out gesture in lieu of performing the zoom-in gesture. In one use case, the zoom-out gesture may trigger a further request for data elements that are associated with the product category attribute. For example, the further requested data elements (e.g., that is provided in portion 204 responsive to the performed zoom-out gesture) may include one or more of data elements 214 or updated versions of data elements 214 .
- data visualization module 108may be configured to determine that the third attribute (associated with the third data element set) is hierarchically lower or higher than the second attribute responsive to the zoom operation indicated by the second touch-based input.
- Data visualization module 108may be configured to, responsive to determining that the third attribute is hierarchically lower or higher than the second attribute, provide the third data element set in the first portion of the user interface based on the third data element set being associated with the third attribute.
- attributesmay be hierarchically arranged such that zoom-in operations may trigger a request for further information relating to one or more values represented by data elements of a currently-presented data element set based on attributes that are hierarchically lower than an attribute associated with the currently-presented data element set.
- attributesmay be hierarchically arranged such that zoom-out operations may trigger a request for broader information than what is provided by a currently-presented data element set based on attributes that are hierarchically higher than an attribute associated with the current-presented data element set.
- a hierarchical structuremay indicate that the user gender attribute is associated with a hierarchical level lower than the user city attribute.
- the data elements representing the number of men and the number of women that purchased women's watches in New York during a certain time periodmay be presented in portion 204 of user interface 200 (e.g., in response to the zoom-in gesture performed in the above zoom-in operation scenario) based on the determination that the user gender attribute is a hierarchical level lower than the user city attribute.
- a hierarchical structuremay be modified to indicate that the product category attribute is a hierarchical level higher than the user city attribute when control element 208 a (e.g., representing the attribute “User City”) is dragged onto data element 214 a (e.g., representing the product category value “Women's Watch” associated with the product category attribute).
- control element 208 ae.g., representing the attribute “User City”
- data element 214 ae.g., representing the product category value “Women's Watch” associated with the product category attribute.
- one or more data elements 214 or updated versions of data elements 214may be presented in portion 204 of user interface 200 (e.g., in response to the zoom-out gesture performed in the above zoom-out operation scenario) based on the determination that the product category attribute is a hierarchical level higher than the user city attribute.
- query module 116may be configured to perform queries relating to the second attribute (associated with the second data element set) responsive to the association (of the first one of the individual control elements of the control element set with the first one of the individual first data elements of the first data element set) indicated by the first touch-based input.
- Query module 116may be configured to receive individual subsets of data relating to the second values (represented by the individual second data elements of the second data element set).
- Data visualization module 108may be configured to predict at least some of the second values using the individual subsets of data based on a determination that other subsets of data relating to the at least some of the second values have not yet been received.
- Data visualization module 108may be configured to generate the individual second data elements (of the second data element set) based on the prediction. The second data element set may be provided based on the generated individual second data elements.
- micro-query delegationmay be performed to enable faster real-time results of large streaming data by performing numerous micro-queries on a distributed data store.
- An approximation of the final data valuesmay be performed based on results from a subset of the micro-queries that are completed by extrapolating from the resulting data that has been processed thus far to estimate the final data values before all of the micro-queries are completed.
- Data elementsmay be generated based on the approximated data values to present users with approximated visualized information without having to wait for all of the micro-queries to be completed.
- the final data valuesmay be calculated and then utilized to generate data elements based on the final data values to replace the approximated data elements, thereby “sharpening” the data elements.
- user experiencemay be improved by providing users with visualized information representing final data values without having to wait for all of the results from the micro-queries to be received by predicting what the final data values will likely be based on results from a subset of the micro-queries that have been received.
- the visualized information generated based on the approximated data valuesmay provide a user with sufficient information to determine his/her next action, thereby reducing unnecessary waste of time.
- the usermay, for instance, interrupt the “sharpening” process (e.g., replacement of the approximated data elements with further approximations or data elements generated based on a full set of results) by performing his/her next action (e.g., zooming-in, changing an attribute begin displayed, using a sliding time bar to change a time of the data to be presented, etc.).
- the interruptionmay terminate further processing of the remaining micro-queries whose results are no longer needed, thereby saving processing resources.
- data visualization module 108may be configured to provide, in a first portion of a user interface, a first data element set that includes individual first data elements representing first values associated with at least one attribute.
- Control interface module 110may be configured to provide, in a second portion of the user interface, a sliding-based control element that includes a moveable control element and points associated with times.
- Data visualization module 108may be configured to dynamically update the provided first data element set in real-time responsive to real-time streaming of data from a plurality of sources.
- the provided first data element setmay be dynamically updated such that the individual first data elements represent dynamically updated values of the first values in lieu of the first values.
- data elements 214 and/or 224may continuously change in appearance to reflect updated values as data is continuously streamed from the plurality of sources.
- the sourcesmay comprise internal sources (e.g., intranet, database, file stores, Hadoop Distributed File System (HDFS), local area network, etc.) and/or external sources (e.g., Internet, external data stores, APIs, third-party sources, etc.).
- internal sourcese.g., intranet, database, file stores, Hadoop Distributed File System (HDFS), local area network, etc.
- external sourcese.g., Internet, external data stores, APIs, third-party sources, etc.
- Input module 112may be configured to receive a first touch-based input indicating moving of the movable control element (of the sliding-based control element) to a first one of the points that is associated with a first one of the times.
- Switch module 114may be configured to, responsive to the moving of the movable control element indicated by the first touch-based input, determine whether to stream data from a temporary data cache or a historical data store to obtain second values that are associated with the at least one attribute and that correspond to the first one of the times.
- Data visualization module 108may be configured to obtain the second values based on the determination of whether to stream data from the temporary data cache or the historical data store.
- real-time datamay be streamed from the plurality of sources (e.g., internal or external sources) and storage of the streamed data may occur at both the temporary data cache and the historical data store.
- the streamed datamay, for example, be stored at the temporary data cache for a predetermined period of time, while the streamed data may be stored at the historical data store for an indefinite period of time or otherwise a substantially longer predetermined period of time than the temporary data cache.
- storage of the streamed datamay be performed faster at the temporary data cache than storage of the streamed data at the historical data store.
- Switch module 114may, for example, intelligently determine whether to stream data from the temporary data cache or the historical data store to obtain historical data for generating data elements representing values that relate to the historical data based on the data to be streamed, the time associated with the second values, or other criteria.
- data elements 214may represent the first values that are associated with the at least one attribute (e.g., the attribute “Product Category” or other attributes).
- the first valuesmay, for example, include the most up-to-date values for a certain time period thus far (e.g., a current day, week, month, year, etc.).
- switch module 114may determine to stream data from the historical data store to obtain data necessary for determining values that are to be represented by the requested data elements.
- switch module 114may determine to stream data from two or more of a real-time store (e.g., reflecting data streams associated with the most up-to-date from a plurality of sources), a temporary data cache (e.g., storing data for a short-term period), and a historical data store (e.g., storing data for a long-term period or indefinitely) to generate a data visualization.
- a real-time storee.g., reflecting data streams associated with the most up-to-date from a plurality of sources
- a temporary data cachee.g., storing data for a short-term period
- a historical data storee.g., storing data for a long-term period or indefinitely
- Data elements 236 amay be generated (e.g., by data visualization module 108 ) based on data streamed from at least a historical data store.
- Data elements 236 bmay be generated based on data streamed from at least a temporary data cache.
- Data element 236 cmay be generated based on data from at least a real-time store. In one use case, data element 236 c may continue to grow in height as data is continuously streamed in from one or more sources to reflect the most up-to-date data in real-time.
- Data visualization module 108may be configured to provide, in the first portion of the user interface, a second data element set that includes individual second data elements representing the obtained second values (that are associated with the at least one attribute and that correspond to the first one of the times).
- the first one of the timesmay correspond to a time of a recent dynamic update of the provided first data element set.
- movable control element 222may be moved to a point associated with the same reference minute, the same hour, etc., during the previous day as the most recent update of the provided first data element set that includes data elements 214 (e.g., the point may be associated with 2 PM for the previous day while the most recent update was performed at 2 PM on the current day).
- data visualization module 108may be configured to dynamically update the provided second data element set responsive to streaming of data from the historical data store.
- the provided second data element setmay, for example, be dynamically updated such that the individual second data elements represent dynamically updated values of the second values in lieu of the second values.
- Data visualization module 108may be configured to simultaneously provide, in the first portion of the user interface, the dynamically updated first data element set and the dynamically updated second data element set.
- the dynamically updated first data element setmay correspond to a first time period.
- the dynamically updated second data element setmay correspond to a second time period different than the first time period.
- the dynamically updated first data element set and the dynamically updated second data element setmay continuously correspond to a same reference point of time of the first time period and the second time period.
- data elements 214 and data elements 232may be associated with the same attributes (e.g., the attribute “Product Category” or other attribute). However, data elements 214 may represent values that correspond to the current day, while data elements 232 may represent values that correspond to a previous day (e.g., one day before the current day). As an example, data element 214 a may represent the overall revenue from sales of women's watches for the current day up until the current time. Data element 232 a may represent the overall revenue from sales of women's watches for the previous day up until a reference time corresponding to the current time. As data elements 214 are updated to reflect the current time, data elements 232 may be updated to reflect a reference time that corresponds to the current time.
- attributese.g., the attribute “Product Category” or other attribute.
- data elements 214may represent values that correspond to the current day
- data elements 232may represent values that correspond to a previous day (e.g., one day before the current day).
- data element 214 amay represent the overall
- the simultaneous presentation of data elements 214 and 232may be based on a comparison mode being activated and/or the moving of the movable control element 222 to a particular point along sliding-based control element 220 .
- the simultaneous presentationmay be based on the comparison mode being activated and/or the selection of one of the options (e.g., “Yesterday,” “Last Week,” “Last Month,” “Last Year,” etc.) depicted in portion 202 of user interface 200 .
- usersmay compare real-time data with corresponding historical baselines.
- FIG. 2Hmay illustrate joining data together based on time to generate data visualizations
- data streams of the same or different typesmay be joined based on any number of criteria (e.g., time, geography, or other criteria) to generate data visualizations relating to one or more of the data streams.
- criteriae.g., time, geography, or other criteria
- query module 116may be configured to perform queries relating to the at least one attribute (associated with the first data element set) on the historical data store responsive to a determination to stream data from the historical data store.
- Query module 116may be configured to receive individual subsets of data relating to the second values (that are associated with the at least one attribute and that correspond to the first one of the times) responsive to performing of the queries.
- Data visualization module 108may be configured to predict at least some of the second values using the individual subsets of data based on a determination that other subsets of data relating to the at least some of the second values have not yet been received.
- Data visualization module 108may be configured to generate the individual second data elements based on the prediction.
- the second data element setmay be provided based on the generated individual second data elements.
- micro-query delegationmay be performed to enable faster real-time results of large streaming data by performing numerous micro-queries on a distributed data store (e.g., the historical data store or other data store).
- An approximation of the final data valuesmay be performed based on results from a subset of the micro-queries that are completed by extrapolating from the resulting data that has been processed thus far to estimate the final data values before all of the micro-queries are completed.
- Data elementsmay be generated based on the approximated data values to present users with approximated visualized information without having to wait for all of the micro-queries to be completed.
- the final data valuesmay be calculated and then utilized to generate data elements based on the final data values to replace the approximated data elements, thereby “sharpening” the data elements.
- swipe, pinch, zoom-in or zoom-out, drag-and-drop, rotate, or other operations described hereinmay be implemented separately or in combination with other features.
- retrieval of data from multiple data storese.g., real-time stores, temporary data cache, historical data store, or other data store
- sharpening of data visualizations, or other operations described hereinmay be implemented separately or in combination with other features (e.g., the abilities to swipe, pinch, zoom-in or zoom-out, drag-and-drop, or rotate).
- User device 104may comprise any type of mobile terminal, fixed terminal, and/or other device.
- user device 104may comprise a desktop computer, a notebook computer, a netbook computer, a tablet computer, a smartphone, a navigation device, an electronic book device, a gaming device, and/or any other user device.
- user device 104may comprise the accessories and peripherals of these devices.
- User device 104may also support any type of interface to the user (such as “wearable” circuitry, etc.).
- Communication network 106 of system 100may comprise one or more networks such as a data network, a wireless network, a telephony network, and/or other communication networks.
- a data networkmay comprise any local area network (LAN), metropolitan area network (MAN), wide area network (WAN), a public data network (e.g., the Internet), short range wireless network, and/or any other suitable packet-switched network.
- the wireless networkmay, for example, comprise a cellular network and may employ various technologies including enhanced data rates for global evolution (EDGE), general packet radio service (GPRS), global system for mobile communications (GSM), Internet protocol multimedia subsystem (IMS), universal mobile telecommunications system (UMTS), etc., as well as any other suitable wireless medium (e.g., worldwide interoperability for microwave access (WiMAX), Long Term Evolution (LTE) networks, code division multiple access (CDMA), wideband code division multiple access (WCDMA), wireless fidelity (WiFi), wireless LAN (WLAN), Bluetooth, Internet Protocol (IP) data casting, satellite, mobile ad-hoc network (MANET), etc.).
- EDGEenhanced data rates for global evolution
- GPRSgeneral packet radio service
- GSMglobal system for mobile communications
- IMSInternet protocol multimedia subsystem
- UMTSuniversal mobile telecommunications system
- WiMAXworldwide interoperability for microwave access
- LTELong Term Evolution
- CDMAcode division multiple access
- WCDMAwideband
- server 102may include an electronic storage 118 , one or more processors 120 , and/or other components. Server 102 may include communication lines, or ports to enable the exchange of information with network 106 and/or other computing platforms. Illustration of server 102 in FIG. 1 is not intended to be limiting. Server 102 may include a plurality of hardware, software, and/or firmware components operating together to provide the functionality attributed herein to server 102 . For example, server 102 may be implemented by a cloud of computing platforms operating together as server 102 .
- Electronic storage 118may comprise non-transitory storage media that electronically stores information.
- the electronic storage media of electronic storage 118may include one or both of system storage that is provided integrally (i.e., substantially non-removable) with server 102 and/or removable storage that is removably connectable to server 102 via, for example, a port (e.g., a USB port, a firewire port, etc.) or a drive (e.g., a disk drive, etc.).
- a porte.g., a USB port, a firewire port, etc.
- a drivee.g., a disk drive, etc.
- Electronic storage 118may include one or more of optically readable storage media (e.g., optical disks, etc.), magnetically readable storage media (e.g., magnetic tape, magnetic hard drive, floppy drive, etc.), electrical charge-based storage media (e.g., EEPROM, RAM, etc.), solid-state storage media (e.g., flash drive, etc.), and/or other electronically readable storage media.
- Electronic storage 118may include one or more virtual storage resources (e.g., cloud storage, a virtual private network, and/or other virtual storage resources).
- Electronic storage 118may store software algorithms, information determined by processor 120 , information received from server 102 , information received from user devices 104 , and/or other information that enables server 102 to function as described herein.
- electronic storagemay comprise a non-transitory, tangible computer-readable storage medium with an executable program stored thereon, wherein the program instructs a microprocessor to perform some or all of the functionality of modules 106 , 108 , 110 , 112 , 114 , 116 , and/or other modules.
- Processor 120may be configured to provide information processing capabilities in server 102 .
- processor 120may include one or more of a digital processor, an analog processor, a digital circuit designed to process information, an analog circuit designed to process information, a state machine, and/or other mechanisms for electronically processing information.
- processor 120is shown in FIG. 1 as a single entity, this is for illustrative purposes only.
- processor 120may include a plurality of processing units. These processing units may be physically located within the same device, or processor 120 may represent processing functionality of a plurality of devices operating in coordination.
- Processor 120may be configured to execute modules 106 , 108 , 110 , 112 , 114 , 116 , and/or other modules.
- Processor 120may be configured to execute modules 106 , 108 , 110 , 112 , 114 , 116 , and/or other modules by software; hardware; firmware; some combination of software, hardware, and/or firmware; and/or other mechanisms for configuring processing capabilities on processor 120 .
- modules 106 , 108 , 110 , 112 , 114 , and 116are illustrated in FIG. 1 as being co-located within a single processing unit, in implementations in which processor 120 includes multiple processing units, one or more of modules 106 , 108 , 110 , 112 , 114 , and/or 116 may be located remotely from the other modules.
- the description of the functionality provided by the different modules 106 , 108 , 110 , 112 , 114 , and/or 116 described belowis for illustrative purposes, and is not intended to be limiting, as any of modules 106 , 108 , 110 , 112 , 114 , and/or 116 may provide more or less functionality than is described.
- modules 106 , 108 , 110 , 112 , 114 , and/or 116may be eliminated, and some or all of its functionality may be provided by other ones of modules 106 , 108 , 110 , 112 , 114 , and/or 116 .
- processor 120may be configured to execute one or more additional modules that may perform some or all of the functionality attributed below to one of modules 106 , 108 , 110 , 112 , 114 , and/or 116 .
- FIG. 3illustrates a flowchart of processing operations for facilitating touch-association-based creation of and interaction with visualizations, in accordance with one or more implementations.
- the operations of process 300 presented beloware intended to be illustrative. In some implementations, process 300 may be accomplished with one or more additional operations not described, and/or without one or more of the operations discussed. Additionally, the order in which the operations of process 300 are illustrated in FIG. 3 and described below is not intended to be limiting.
- one or more operations of process 300may be implemented in one or more processing devices (e.g., a digital processor, an analog processor, a digital circuit designed to process information, an analog circuit designed to process information, a state machine, and/or other mechanisms for electronically processing information).
- the one or more processing devicesmay include one or more devices executing some or all of the operations of process 300 in response to instructions stored electronically on an electronic storage medium.
- the one or more processing devicesmay include one or more devices configured through hardware, firmware, and/or software to be specifically designed for execution of one or more of the operations of process 300 .
- a first data element set associated with a first attributemay be provided in a first portion of a user interface.
- the first data element setmay include individual first data elements.
- Each of the individual first data elementsmay represent a first value associated with the first attribute.
- Operation 302may be performed by a data visualization module that is the same as or similar to data visualization module 108 , in accordance with one or more implementations.
- a control element set that include individual control elementsmay be provided in a second portion of the user interface.
- Each of the individual control elementsrepresents an attribute.
- Operation 304may be performed by a control interface module that is the same as or similar to control interface module 110 , in accordance with one or more implementations.
- a first touch-based input indicating an association of a first one of the individual control elements with a first one of the individual first data elementsmay be received.
- the association indicated by the first touch-based inputmay correspond to dragging the first one of the individual control elements onto the first one of the individual first data elements or dragging the first one of the individual first data elements onto the first one of the individual control elements.
- Operation 306may be performed by an input module that is the same as or similar to input module 112 , in accordance with one or more implementations.
- a second attributemay be determined to be the attribute represented by the first one of the individual control elements. Operation 308 may be performed by a data visualization module that is the same as or similar to data visualization module 108 , in accordance with one or more implementations.
- a second data element set associated with the second attributemay be provided in the first portion of the user interface.
- the second attributemay be different than the first attribute (associated with the first data element set).
- the second data element setmay include individual second data elements. Each of the individual second data elements may represent a second value associated with the second attribute and correspond to the first value represented by the first one of the first individual data elements.
- Operation 310may be performed by a data visualization module that is the same as or similar to data visualization module 108 , in accordance with one or more implementations.
- a second touch-based input indicating a zoom operation relating to a first one of the individual second data elementsmay be received. Operation 312 may be performed by an input module that is the same as or similar to input module 112 , in accordance with one or more implementations.
- a third attribute that is hierarchically lower or higher than the second attributemay be determined. Operation 314 may be performed by a data visualization module that is the same as or similar to data visualization module 108 , in accordance with one or more implementations.
- a third data element set associated with the third attributemay be provided in the first portion of the user interface.
- the third data element setmay include individual third data elements.
- Each of the individual third data elementsmay represent a third value associated with the third attribute.
- Operation 316may be performed by a data visualization module that is the same as or similar to data visualization module 108 , in accordance with one or more implementations.
- the zoom operationmay comprise a zoom-in operation.
- the first attributeassociated with the first data element set
- the second attributeassociated with the second data element set
- the third attributemay be hierarchically lower than the second attribute.
- Each of the individual third data elements (of the third data element set)may correspond to the first value represented by the first one of the individual first data elements and the second value represented by the first one of the individual second data elements.
- hierarchically higher attributesmay correspond to higher-level views of data.
- Hierarchically lower attributesmay correspond to lower-level views of data.
- the zoom operationmay comprise a zoom-out operation.
- the first attribute and the third attributemay be hierarchically higher than the second attribute.
- the third attributemay be the first attribute.
- FIG. 4illustrates a flowchart of processing operations for facilitating sliding-based control associated with multi-data-store retrieval of data, in accordance with one or more implementations.
- the operations of process 400 presented beloware intended to be illustrative. In some implementations, process 400 may be accomplished with one or more additional operations not described, and/or without one or more of the operations discussed. Additionally, the order in which the operations of process 400 are illustrated in FIG. 4 and described below is not intended to be limiting.
- one or more operations of process 400may be implemented in one or more processing devices (e.g., a digital processor, an analog processor, a digital circuit designed to process information, an analog circuit designed to process information, a state machine, and/or other mechanisms for electronically processing information).
- the one or more processing devicesmay include one or more devices executing some or all of the operations of process 400 in response to instructions stored electronically on an electronic storage medium.
- the one or more processing devicesmay include one or more devices configured through hardware, firmware, and/or software to be specifically designed for execution of one or more of the operations of process 400 .
- a first data element set associated with at least one attributemay be provided in a first portion of a user interface.
- the first data element setmay include individual first data elements representing first values associated with the at least one attribute.
- Operation 402may be performed by a data visualization module that is the same as or similar to data visualization module 108 , in accordance with one or more implementations.
- a sliding-based control elementthat includes a movable control element and points associated with times may be provided in a second portion of the user interface. Operation 404 may be performed by a control interface module that is the same as or similar to control interface module 110 , in accordance with one or more implementations.
- the provided first data element setmay be dynamically updated in real-time responsive to real-time streaming of data from a plurality of sources.
- the provided first data element setmay be dynamically updated such that the individual first data elements may represent dynamically updated values of the first values in lieu of the first values.
- Operation 406may be performed by a data visualization module that is the same as or similar to data visualization module 108 , in accordance with one or more implementations.
- a first touch-based input indicating moving of the movable control element to a first one of the points that is associated with a first one of the timesmay be received. Operation 408 may be performed by an input module that is the same as or similar to input module 112 , in accordance with one or more implementations.
- Operation 410a determination to stream data from a historical data store in lieu of streaming data from a temporary data cache to obtain second values that are associated with the at least one attribute and that correspond to the first one of the times may be effectuated. Operation 410 may be performed by a switch module that is the same as or similar to switch module 114 , in accordance with one or more implementations.
- queries relating to the at least one attributemay be performed on the historical data store to stream data from the historical data store.
- Operation 412may be performed by a query module that is the same as or similar to query module 116 , in accordance with one or more implementations.
- Operation 414individual subsets of data relating to the second values (that are associated with the at least one attribute and that correspond to the first one of the times) may be received. Operation 414 may be performed by a query module that is the same as or similar to query module 116 , in accordance with one or more implementations.
- individual second data elements that represent the second valuesmay be generated as the individual subsets of data are received.
- at least some of the second valuesmay be predicted using the individual subsets of data based on a determination that other subsets of data relating to the at least some of the second values have not yet been received.
- the individual second data elementsmay be generated based on the prediction.
- Operation 416may be performed by a data visualization module that is the same as or similar to data visualization module 108 , in accordance with one or more implementations.
- a second data element set that includes the individual second data elements (representing the second values)may be provided in the first portion of the user interface. Operation 418 may be performed by a data visualization module that is the same as or similar to data visualization module 108 , in accordance with one or more implementations.
- the provided second data element setmay be dynamically updated responsive to streaming of data from the historical data store.
- the provided second data element setmay be dynamically updated such that the individual second data elements represent dynamically updated values of the second values in lieu of the second values.
- Operation 420may be performed by a data visualization module that is the same as or similar to data visualization module 108 , in accordance with one or more implementations.
- the dynamically updated first data element set and the dynamically updated second data element setmay be simultaneously provided in the first portion of the user interface.
- the dynamically updated first data element setmay correspond to a first time period.
- the dynamically updated second data element setmay correspond to a second time period different than the first time period.
- the dynamically updated first data element set and the dynamically updated second data element setmay continuously correspond to a same reference point of time of the first time period and the second time period.
- Operation 422may be performed by a data visualization module that is the same as or similar to data visualization module 108 , in accordance with one or more implementations.
- FIG. 5illustrates a diagram of a data visualization architecture 500 , in accordance with one or more implementations.
- datamay be streamed or otherwise received from sources 502 (e.g., to obtain live data, up-to-date data, etc.) or a historical data store 504 .
- Connector studio 506may allow administrative users or other users modify connector library 508 , for example, by adding, modifying, or removing data connector modules that specify which data streams from the various sources 502 or from historical data store are to be combined by data connectors 510 .
- Datamay be streamed to data switch 512 and/or to data profiler 514 .
- Data profiler 514may, for example, profile the streamed data to associate the streamed data with data types (e.g., general number, currency, target, network address, email address, data state, or other types). Profiled streamed data may be stored in temporary data cache 516 .
- data typese.g., general number, currency, target, network address, email address, data state, or other types.
- Profiled streamed datamay be stored in temporary data cache 516 .
- data controller 518may work with data switch 512 , data profiler 514 , stream processing engine 520 , or other components of data visualization architecture 500 .
- Data switch 512may stream data to stream processing engine 520 for processing.
- Stream and service studio 522may allow administrative users or other users modify stream math library 524 and a set of web service calls 526 , for example, by adding, modify, or removing stream math modules or web services call 526 .
- Stream processing engine 520may utilize the stream math modules or web service calls 526 to process the streamed data.
- Visualization studio 528may allow administrative users or other users to modify visualization library 530 , for example, by adding, modifying, or removing visualization modules.
- Visualization engine 532may utilize the visualization modules of visualization library 530 to visualize the results of the processing of the data by stream processing engine 520 .
- the results of the processingmay be transmitted from stream processing engine 520 to visualization engine 532 .
- the visualized resultsmay be transmitted to devices 534 .
- FIG. 6illustrates a diagram of a user interface 600 for creating or modifying visualizations, in accordance with one or more implementations.
- user interface 600may include a code editing portion 602 and a live preview portion 604 .
- User interface 600may, for example, allow a user to write code from scratch to create new visualization modules or modify code of an existing visualization module.
- live preview portion 604may present a preview of the visualization based on real-time streaming data.
- the codemay automatically be applied to real-time data streams to generate and present data visualizations reflecting the addition or modification of the code.
- the code in the coding edition portion 602may be saved for later use or shared to other users.
- FIG. 7illustrates a diagram 700 of a stream processing engine configured to perform micro-queries to generate data visualizations, in accordance with one or more implementations.
- stream processing engine 702may perform numerous micro-queries on a distributed data store 704 .
- stream processing engine 702may include a micro-query generator, a micro-query handler, and a projection engine.
- the micro-query generatormay perform a plurality of micro-queries on distributed store 704 (e.g., comprising numerous data nodes at which data is stored) to update a current data visualization (e.g., updating a current data element set), generate a new data visualization (e.g., generating a new data element set), or facilitate other automated or user-requested operations.
- the micro-query handlermay begin receiving streams of data from multiple ones of the data nodes.
- the projection enginemay approximate or otherwise predict the final data values to generate data elements representing the final data values based on the subset of results. When the results from all of the micro-queries have been received, the actual final data values may be calculated, and the actual final data values may be utilized to generate data elements to replace the approximated data elements.
- a data visualization corresponding to a trend report for the last 30 daysmay be requested where each data elements of the data visualization may correspond to a specific day.
- the micro-query generatormay perform micro-queries to obtain data associated with the trend report from distributed data store 704 .
- the micro-query generatormay initiate at least 2 queries for each of the last 30 days, resulting in at least 60 queries to obtain the data associated with the trend report.
- the first query for a particular daymay, for instance, obtain results corresponding to 6 specific minutes spaced throughout the day.
- the results corresponding to the 6 specific minutesmay be utilized (e.g., by the projection engine) to approximate the final data value corresponding to the entire day.
- the approximated data valuemay be used to generate and present a data element corresponding to the particular day. Subsequently, the second query for the particular day may obtain results corresponding to the remaining minutes in the day. The results corresponding to the 6 specific minutes and the remaining minutes may be utilized to generate the actual final data value corresponding to the entire day. The actual final data value may be used to generate an updated data element corresponding to the particular day. The approximated data element may then be replaced by the updated data element to “sharpen” the requested data visualization. Such approximations and sharpening of the data visualization may further be performed for all of the other days of the trend report.
- each data elementmay be sharpened two or more times before the user is presented with a data element set that is generated based on actual final data values calculated using results from all of the micro-queries.
- a first query for a particular daymay obtain results corresponding to 3 minutes spaced throughout the day
- a second query for the particular daymay obtain results corresponding to 60 other minutes spaced throughout the day
- a third query for the particular daymay obtain results corresponding to the remaining minutes of the day.
- the results corresponding to the 3 minutes of the daymay be utilized to approximate the final data value corresponding to the entire day, and the approximated final data value may be utilized to generate and present a data element corresponding to the particular day.
- the results corresponding to the 3 minutes of the day and the results corresponding to the 60 minutes of the daymay be utilized to approximate the final data value corresponding to the entire day, and the approximated final data value may be utilized to generate and present an updated data element corresponding to the particular day to replace the previous approximated data element corresponding to the particular day.
- all the results for the daymay be utilized to calculate the actual final data value corresponding to the entire day.
- the actual final data valuemay be utilized to generate and present another updated data element to replace the approximated data element.
Landscapes
- Engineering & Computer Science (AREA)
- Theoretical Computer Science (AREA)
- General Engineering & Computer Science (AREA)
- Physics & Mathematics (AREA)
- General Physics & Mathematics (AREA)
- Databases & Information Systems (AREA)
- Data Mining & Analysis (AREA)
- Computational Linguistics (AREA)
- Human Computer Interaction (AREA)
- Business, Economics & Management (AREA)
- Strategic Management (AREA)
- Human Resources & Organizations (AREA)
- Entrepreneurship & Innovation (AREA)
- Probability & Statistics with Applications (AREA)
- General Business, Economics & Management (AREA)
- Tourism & Hospitality (AREA)
- Quality & Reliability (AREA)
- Operations Research (AREA)
- Marketing (AREA)
- Economics (AREA)
- Fuzzy Systems (AREA)
- Mathematical Physics (AREA)
- Software Systems (AREA)
- Multimedia (AREA)
- User Interface Of Digital Computer (AREA)
Abstract
Description
| TABLE 1 | |||
| Transaction # | Product Category | Product Price | . . . |
| 0054454031 | Women's Watch | $300.00 | . . . |
| 0054454032 | Ring | $250.00 | . . . |
| 0054454033 | Bracelet | $350.00 | . . . |
| 0054454034 | Men's Watch | $350.00 | . . . |
| . . . | . . . | . . . | . . . |
Claims (20)
Priority Applications (1)
| Application Number | Priority Date | Filing Date | Title |
|---|---|---|---|
| US15/197,733US9696903B2 (en) | 2013-08-09 | 2016-06-29 | Real-time data visualization of streaming data |
Applications Claiming Priority (3)
| Application Number | Priority Date | Filing Date | Title |
|---|---|---|---|
| US13/963,668US8631325B1 (en) | 2013-08-09 | 2013-08-09 | Real-time data visualization of streaming data |
| US14/153,664US9411807B2 (en) | 2013-08-09 | 2014-01-13 | Real-time data visualization of streaming data |
| US15/197,733US9696903B2 (en) | 2013-08-09 | 2016-06-29 | Real-time data visualization of streaming data |
Related Parent Applications (1)
| Application Number | Title | Priority Date | Filing Date |
|---|---|---|---|
| US14/153,664ContinuationUS9411807B2 (en) | 2013-08-09 | 2014-01-13 | Real-time data visualization of streaming data |
Publications (2)
| Publication Number | Publication Date |
|---|---|
| US20160313911A1 US20160313911A1 (en) | 2016-10-27 |
| US9696903B2true US9696903B2 (en) | 2017-07-04 |
Family
ID=49886188
Family Applications (7)
| Application Number | Title | Priority Date | Filing Date |
|---|---|---|---|
| US13/963,668ActiveUS8631325B1 (en) | 2013-08-09 | 2013-08-09 | Real-time data visualization of streaming data |
| US14/153,690Active2034-05-02US9396190B2 (en) | 2013-08-09 | 2014-01-13 | Real-time data visualization of streaming data |
| US14/153,664Active2034-06-04US9411807B2 (en) | 2013-08-09 | 2014-01-13 | Real-time data visualization of streaming data |
| US15/188,975ActiveUS9612742B2 (en) | 2013-08-09 | 2016-06-21 | Real-time data visualization of streaming data |
| US15/197,733ActiveUS9696903B2 (en) | 2013-08-09 | 2016-06-29 | Real-time data visualization of streaming data |
| US15/428,136ActiveUS9946811B2 (en) | 2013-08-09 | 2017-02-08 | Presentation of streaming data |
| US15/858,935AbandonedUS20180121565A1 (en) | 2013-08-09 | 2017-12-29 | System and method for reducing data presentation delays |
Family Applications Before (4)
| Application Number | Title | Priority Date | Filing Date |
|---|---|---|---|
| US13/963,668ActiveUS8631325B1 (en) | 2013-08-09 | 2013-08-09 | Real-time data visualization of streaming data |
| US14/153,690Active2034-05-02US9396190B2 (en) | 2013-08-09 | 2014-01-13 | Real-time data visualization of streaming data |
| US14/153,664Active2034-06-04US9411807B2 (en) | 2013-08-09 | 2014-01-13 | Real-time data visualization of streaming data |
| US15/188,975ActiveUS9612742B2 (en) | 2013-08-09 | 2016-06-21 | Real-time data visualization of streaming data |
Family Applications After (2)
| Application Number | Title | Priority Date | Filing Date |
|---|---|---|---|
| US15/428,136ActiveUS9946811B2 (en) | 2013-08-09 | 2017-02-08 | Presentation of streaming data |
| US15/858,935AbandonedUS20180121565A1 (en) | 2013-08-09 | 2017-12-29 | System and method for reducing data presentation delays |
Country Status (1)
| Country | Link |
|---|---|
| US (7) | US8631325B1 (en) |
Families Citing this family (46)
| Publication number | Priority date | Publication date | Assignee | Title |
|---|---|---|---|---|
| US10001898B1 (en) | 2011-07-12 | 2018-06-19 | Domo, Inc. | Automated provisioning of relational information for a summary data visualization |
| US9792017B1 (en) | 2011-07-12 | 2017-10-17 | Domo, Inc. | Automatic creation of drill paths |
| US9202297B1 (en) | 2011-07-12 | 2015-12-01 | Domo, Inc. | Dynamic expansion of data visualizations |
| USD735732S1 (en)* | 2013-03-12 | 2015-08-04 | Hewlett-Packard Development Company, L.P. | Display screen with graphical user interface |
| USD721086S1 (en)* | 2013-04-01 | 2015-01-13 | Track180, Inc. | Display screen with graphical user interface |
| USD737319S1 (en)* | 2013-06-09 | 2015-08-25 | Apple Inc. | Display screen or portion thereof with graphical user interface |
| US8631325B1 (en) | 2013-08-09 | 2014-01-14 | Zoomdata, Inc. | Real-time data visualization of streaming data |
| USD762682S1 (en)* | 2014-01-17 | 2016-08-02 | Beats Music, Llc | Display screen or portion thereof with animated graphical user interface |
| US20160246485A1 (en)* | 2014-04-07 | 2016-08-25 | Benjamin Rigler Halpern | Visual representations of multivariate data indicating elements of contribution |
| USD774540S1 (en) | 2014-05-08 | 2016-12-20 | Express Scripts, Inc. | Display screen with a graphical user interface |
| USD773518S1 (en) | 2014-05-08 | 2016-12-06 | Express Scripts, Inc. | Display screen with a graphical user interface |
| US10304224B2 (en)* | 2014-05-28 | 2019-05-28 | Entit Software Llc | Dynamic graphic entity determination |
| USD762693S1 (en) | 2014-09-03 | 2016-08-02 | Apple Inc. | Display screen or portion thereof with graphical user interface |
| WO2016044809A1 (en)* | 2014-09-19 | 2016-03-24 | DIVA Networks, Inc. | Method and system for controlling devices with a chat interface |
| US11030552B1 (en)* | 2014-10-31 | 2021-06-08 | Tibco Software Inc. | Context aware recommendation of analytic components |
| USD786283S1 (en)* | 2015-02-20 | 2017-05-09 | Google Inc. | Portion of a display panel with a graphical user interface |
| USD789393S1 (en)* | 2015-02-20 | 2017-06-13 | Google Inc. | Portion of a display panel with a graphical user interface |
| USD788136S1 (en)* | 2015-02-20 | 2017-05-30 | Google Inc. | Portion of a display panel with a graphical user interface |
| US9251276B1 (en) | 2015-02-27 | 2016-02-02 | Zoomdata, Inc. | Prioritization of retrieval and/or processing of data |
| US9817871B2 (en) | 2015-02-27 | 2017-11-14 | Zoomdata, Inc. | Prioritized retrieval and/or processing of data via query selection |
| USD775185S1 (en) | 2015-03-06 | 2016-12-27 | Apple Inc. | Display screen or portion thereof with graphical user interface |
| US9389909B1 (en)* | 2015-04-28 | 2016-07-12 | Zoomdata, Inc. | Prioritized execution of plans for obtaining and/or processing data |
| USD772269S1 (en) | 2015-06-05 | 2016-11-22 | Apple Inc. | Display screen or portion thereof with graphical user interface |
| USD778312S1 (en)* | 2015-07-01 | 2017-02-07 | Dynamic Controls | Display screen or portion thereof with icon |
| USD784396S1 (en)* | 2015-09-02 | 2017-04-18 | Samsung Electronics Co., Ltd | Display screen or portion thereof with graphical user interface |
| EP3493083A4 (en)* | 2016-07-26 | 2019-08-14 | FUJIFILM Corporation | CONTENT SEARCHING DEVICE, ITS OPERATING METHOD, PROGRAMMING THEREOF, AND CONTENT SEARCHING SYSTEM |
| US10459939B1 (en) | 2016-07-31 | 2019-10-29 | Splunk Inc. | Parallel coordinates chart visualization for machine data search and analysis system |
| US10861202B1 (en) | 2016-07-31 | 2020-12-08 | Splunk Inc. | Sankey graph visualization for machine data search and analysis system |
| US10853380B1 (en) | 2016-07-31 | 2020-12-01 | Splunk Inc. | Framework for displaying interactive visualizations of event data |
| US11037342B1 (en)* | 2016-07-31 | 2021-06-15 | Splunk Inc. | Visualization modules for use within a framework for displaying interactive visualizations of event data |
| US10459938B1 (en) | 2016-07-31 | 2019-10-29 | Splunk Inc. | Punchcard chart visualization for machine data search and analysis system |
| USD824923S1 (en)* | 2016-08-08 | 2018-08-07 | Kpmg Llp | Display screen with graphical user interface for map information |
| US9942312B1 (en) | 2016-12-16 | 2018-04-10 | Zoomdata, Inc. | System and method for facilitating load reduction at a landing zone |
| USD851109S1 (en)* | 2017-08-29 | 2019-06-11 | General Electric Company | Display screen or portion thereof with graphical user interface |
| USD851667S1 (en) | 2017-09-29 | 2019-06-18 | Humantelligence Inc. | Display screen with graphical user interface for assessment instructions |
| USD880506S1 (en) | 2017-11-03 | 2020-04-07 | Humantelligence Inc. | Display screen with user interface for culture analytics |
| USD871429S1 (en)* | 2017-11-13 | 2019-12-31 | Humantelligence Inc. | Display screen with graphical user interface for culture analytics |
| USD878403S1 (en) | 2017-11-14 | 2020-03-17 | Humantelligence Inc. | Display screen with user interface for culture analytics |
| USD879132S1 (en) | 2018-06-03 | 2020-03-24 | Apple Inc. | Electronic device with graphical user interface |
| USD893512S1 (en) | 2018-09-10 | 2020-08-18 | Apple Inc. | Electronic device with graphical user interface |
| USD910068S1 (en) | 2019-05-28 | 2021-02-09 | Apple Inc. | Display screen or portion thereof with graphical user interface |
| USD962963S1 (en)* | 2021-03-01 | 2022-09-06 | Honeywell International Inc. | Display screen or portion thereof with graphical user interface |
| KR102801432B1 (en)* | 2021-06-11 | 2025-04-30 | 카페24 주식회사 | Growing shopping mall analysis method, apparatus, and system |
| US12072859B1 (en)* | 2022-10-26 | 2024-08-27 | Splunk Inc. | Accessibility controls for manipulating data visualizations |
| CN116089555B (en)* | 2022-12-29 | 2024-01-19 | 中建电子信息技术有限公司 | CIM platform-based three-dimensional space data acquisition and light weight system and method |
| CN120277081B (en)* | 2025-06-09 | 2025-08-22 | 北京法伯宏业科技发展有限公司 | A dynamic data prediction system based on big data platform |
Citations (124)
| Publication number | Priority date | Publication date | Assignee | Title |
|---|---|---|---|---|
| US4769772A (en) | 1985-02-28 | 1988-09-06 | Honeywell Bull, Inc. | Automated query optimization method using both global and parallel local optimizations for materialization access planning for distributed databases |
| US6026397A (en)* | 1996-05-22 | 2000-02-15 | Electronic Data Systems Corporation | Data analysis system and method |
| US6072493A (en)* | 1997-03-31 | 2000-06-06 | Bellsouth Corporation | System and method for associating services information with selected elements of an organization |
| US20020091994A1 (en)* | 1997-10-24 | 2002-07-11 | Scott C. Mccready | Systems and methods for software evaluation and performance measurement |
| US6505246B1 (en)* | 1998-12-30 | 2003-01-07 | Candle Distributed Solutions, Inc. | User interface for system management applications |
| US6519604B1 (en) | 2000-07-19 | 2003-02-11 | Lucent Technologies Inc. | Approximate querying method for databases with multiple grouping attributes |
| US20030158913A1 (en) | 2002-02-15 | 2003-08-21 | Agnoli Giovanni M. | System, method, and computer program product for media publishing request processing |
| US20030182261A1 (en) | 2002-02-15 | 2003-09-25 | Patterson James Edmund | Queuing model for a plurality of servers |
| US6633873B1 (en) | 1999-02-16 | 2003-10-14 | Fujitsu Limited | Distributed data retrieval system including mechanism for predicting an amount of response data |
| US20030225644A1 (en) | 2002-06-04 | 2003-12-04 | Fabio Casati | Dynamic prioritization of activities |
| US20040193631A1 (en)* | 1999-08-06 | 2004-09-30 | Hiroya Kumashio | System for document management and information processing |
| US20040221053A1 (en) | 2003-04-30 | 2004-11-04 | International Business Machines Corporation | Method and system for efficient data transmission in interactive networked environments |
| US20040249810A1 (en) | 2003-06-03 | 2004-12-09 | Microsoft Corporation | Small group sampling of data for use in query processing |
| US20050165753A1 (en) | 2004-01-23 | 2005-07-28 | Harr Chen | Building and using subwebs for focused search |
| US20050234890A1 (en) | 2004-02-19 | 2005-10-20 | Urs Enzler | Generation of database queries from database independent selection conditions |
| US20060036600A1 (en) | 2001-01-12 | 2006-02-16 | Microsoft Corporation | Database aggregation query result estimator |
| US20060047830A1 (en) | 2004-03-23 | 2006-03-02 | Pctel, Inc. | Pctel14100U method and system for automatic data transfer on a network-connected device |
| US20060106759A1 (en) | 2004-11-01 | 2006-05-18 | Hitachi, Ltd. | Computer system, computer, data access method and database system |
| US20060155920A1 (en) | 2004-12-16 | 2006-07-13 | Smith Peter J | Non-volatile memory and method with multi-stream updating |
| US20060265288A1 (en) | 2005-05-17 | 2006-11-23 | Payless Certified Diamonds.Com, Inc. | Diamond retailer, wholesaler and consumer finder, tracker and sales system |
| US20060293872A1 (en) | 2004-03-16 | 2006-12-28 | M-I L.L.C. | Three-dimensional wellbore analysis and visualization |
| US20070022256A1 (en) | 2005-07-19 | 2007-01-25 | Cantin Jason F | Method, apparatus, and computer program product for a cache coherency protocol state that predicts locations of shared memory blocks |
| WO2007068279A1 (en) | 2005-12-14 | 2007-06-21 | Piaton, Alain, Nicolas | Method and computer system for updating a database from a server to at least one client |
| US20070162425A1 (en) | 2006-01-06 | 2007-07-12 | International Business Machines Corporation | System and method for performing advanced cost/benefit analysis of asynchronous operations |
| US20070174188A1 (en) | 2006-01-25 | 2007-07-26 | Fish Robert D | Electronic marketplace that facilitates transactions between consolidated buyers and/or sellers |
| US20070208607A1 (en)* | 2001-11-09 | 2007-09-06 | Prasanna Amerasinghe | Method for forecasting and revenue management |
| US20070226178A1 (en) | 2006-03-24 | 2007-09-27 | International Business Machines Corporation | Predictable query execution through early materialization |
| US7308445B2 (en) | 2000-11-08 | 2007-12-11 | Overture Services, Inc. | Method for estimating coverage of web search engines |
| US7340409B1 (en) | 1996-09-20 | 2008-03-04 | Ulwick Anthony W | Computer based process for strategy evaluation and optimization based on customer desired outcomes and predictive metrics |
| US20080065588A1 (en) | 2006-08-24 | 2008-03-13 | Craig Stephen Aldrich | Selectively Logging Query Data Based On Cost |
| US7373389B2 (en) | 2003-08-27 | 2008-05-13 | Spoke Software | Periodic update of data in a relationship system |
| US7467131B1 (en) | 2003-09-30 | 2008-12-16 | Google Inc. | Method and system for query data caching and optimization in a search engine system |
| US20090013089A1 (en) | 2006-01-20 | 2009-01-08 | Michael Sullivan | Systems and Methods for Discerning and Controlling Communication Traffic |
| US7502366B1 (en) | 2000-05-23 | 2009-03-10 | Advanced Micro Devices, Inc. | Arrangement in a network switch for prioritizing data frames based on user-defined frame attributes |
| US20090132906A1 (en)* | 2004-10-27 | 2009-05-21 | Justsystems Corporation | Document processing device and document processing method |
| US20090144103A1 (en)* | 2007-11-30 | 2009-06-04 | Sap Ag | Method and System Incorporating Business Rules and Price Optimization for Financial System |
| US20090150343A1 (en) | 2007-12-05 | 2009-06-11 | Kayak Software Corporation | Multi-Phase Search And Presentation For Vertical Search Websites |
| US20090177667A1 (en) | 2008-01-07 | 2009-07-09 | International Business Machines Corporation | Smart Data Caching Using Data Mining |
| US20090177988A1 (en) | 2008-01-08 | 2009-07-09 | International Business Machines Corporation | Generating data queries using a graphical selection tree |
| US20090241176A1 (en) | 2008-03-21 | 2009-09-24 | Microsoft Corporation | Load balancing in server computer systems |
| US20090259522A1 (en)* | 2006-05-02 | 2009-10-15 | Jamie Rapperport | System and methods for generating quantitative pricing power and risk scores |
| US20090287814A1 (en) | 2008-05-14 | 2009-11-19 | Microsoft Corporation | Visualization of streaming real-time data |
| US20090300544A1 (en)* | 2008-05-30 | 2009-12-03 | Mike Psenka | Enhanced user interface and data handling in business intelligence software |
| US20090322755A1 (en) | 2008-06-26 | 2009-12-31 | Microsoft Corporation | Declarative approach for visuzliation |
| US20090328054A1 (en) | 2008-06-26 | 2009-12-31 | Microsoft Corporation | Adapting message delivery assignments with hashing and mapping techniques |
| US20100010984A1 (en) | 2008-07-14 | 2010-01-14 | Disney Enterprises, Inc. | Method and system for dynamically generating a search result |
| US20100017740A1 (en)* | 2008-07-17 | 2010-01-21 | Microsoft Corporation | Pan and zoom control |
| US7673278B2 (en) | 2007-11-29 | 2010-03-02 | Tokyo Electron Limited | Enhanced process yield using a hot-spot library |
| US7680781B1 (en) | 2005-03-04 | 2010-03-16 | Teradata Us, Inc. | Automatic search query generation and results set management |
| US7688322B2 (en) | 2005-01-18 | 2010-03-30 | Oculus Info Inc. | System and method for data visualization using a synchronous display of sequential time data and on-map planning |
| US20100131654A1 (en) | 2008-11-25 | 2010-05-27 | Microsoft Corporation | Platform for enabling terminal services virtualization |
| US20100153429A1 (en) | 2008-12-11 | 2010-06-17 | Yu Xu | System, method, and computer-readable medium for optimizing processing of queries featuring maximum or minimum equality conditions in a parallel processing system |
| US20100162152A1 (en) | 2008-12-18 | 2010-06-24 | Microsoft Corporation | Data Visualization Interactivity Architecture |
| US7761324B2 (en)* | 2001-11-09 | 2010-07-20 | Siebel Systems, Inc. | Forecasting and revenue management system |
| US20100185619A1 (en) | 2009-01-22 | 2010-07-22 | Alibaba Group Holding Limited | Sampling analysis of search queries |
| US20100205128A1 (en) | 2009-02-12 | 2010-08-12 | Decisive Analytics Corporation | Method and apparatus for analyzing and interrelating data |
| US7792835B2 (en) | 2006-07-25 | 2010-09-07 | Mypoints.Com Inc. | Method of efficient target query selection ranging |
| US7814042B2 (en) | 2004-08-17 | 2010-10-12 | Oracle International Corporation | Selecting candidate queries |
| US20110055202A1 (en) | 2009-08-31 | 2011-03-03 | Heimendinger Scott M | Predictive data caching |
| US20110137896A1 (en) | 2009-12-07 | 2011-06-09 | Sony Corporation | Information processing apparatus, predictive conversion method, and program |
| US20110202841A1 (en)* | 2010-02-12 | 2011-08-18 | Dempster Benjamin I | Computer-based project management |
| US8027854B2 (en) | 2000-09-22 | 2011-09-27 | Ita Software, Inc. | Method, system, and computer program product for interfacing with information sources |
| US20110246388A1 (en) | 2010-04-05 | 2011-10-06 | Kalengo Llc | System and method for providing financial asset pricing chart with aggregated, ranked and filtered articles |
| US20110271071A1 (en) | 2010-04-28 | 2011-11-03 | Hitachi, Ltd. | Storage apparatus and hierarchical data management method for storage apparatus |
| US20110289185A1 (en) | 2010-05-21 | 2011-11-24 | Brian Heder | Method, system, and apparatus for transitioning from ipv4 to ipv6 |
| US20120023120A1 (en) | 2010-07-22 | 2012-01-26 | Google Inc. | Predictive query suggestion caching |
| US8122223B2 (en) | 2008-04-18 | 2012-02-21 | International Business Machines Corporation | Access speculation predictor with predictions based on memory region prior requestor tag information |
| US20120089920A1 (en) | 2010-10-06 | 2012-04-12 | Stephen Gregory Eick | Platform and method for analyzing real-time position and movement data |
| US20120095958A1 (en) | 2008-06-18 | 2012-04-19 | Zeitera, Llc | Distributed and Tiered Architecture for Content Search and Content Monitoring |
| US8180720B1 (en) | 2007-07-19 | 2012-05-15 | Akamai Technologies, Inc. | Content delivery network (CDN) cold content handling |
| US20120151399A1 (en) | 2010-12-13 | 2012-06-14 | Microsoft Corporation | Bull's-eye multidimensional data visualization |
| US20120173759A1 (en) | 2010-12-29 | 2012-07-05 | Mugdha Agarwal | Systems and Methods for Policy Based Integration to Horizontally Deployed WAN Optimization Appliances |
| US20120203762A1 (en) | 2011-02-04 | 2012-08-09 | Subbarao Kakarlamudi | Systems and methods for holding a query |
| US20120210119A1 (en) | 2004-06-14 | 2012-08-16 | Arthur Baxter | Method and Apparatus for Secure Internet Browsing |
| US20120254316A1 (en) | 2011-03-28 | 2012-10-04 | Ontario, Canada) | Communications system including trusted server to verify a redirection request and associated methods |
| US20120271748A1 (en) | 2005-04-14 | 2012-10-25 | Disalvo Dean F | Engineering process for a real-time user-defined data collection, analysis, and optimization tool (dot) |
| US20120299965A1 (en) | 2011-05-23 | 2012-11-29 | Microsoft Corporation | Calculating zoom level timeline data |
| US20130066895A1 (en) | 2008-07-10 | 2013-03-14 | Yung Choi | Providing Suggestion and Translation Thereof In Accordance With A Partial User Entry |
| US20130083031A1 (en) | 2011-09-29 | 2013-04-04 | Schlumberger Technology Corporation | Customizable User Interface for Real-Time Oilfield Data Visualization |
| US20130111467A1 (en) | 2011-10-27 | 2013-05-02 | Cisco Technology, Inc. | Dynamic Server Farms |
| US20130173707A1 (en) | 2011-12-29 | 2013-07-04 | Sony Computer Entertainment Inc. | Information source selection system, information source selection method, and program |
| US8489982B2 (en)* | 1999-05-21 | 2013-07-16 | E-Numerate Solutions, Inc. | Reusable data markup language |
| US20130208591A1 (en) | 2010-10-22 | 2013-08-15 | Telefonaktiebolaget L M Ericsson (Publ) | Mobile-Access Information Based Adaptation of Network Address Lookup for Differentiated Handling of Data Traffic |
| US8521574B1 (en) | 2012-06-20 | 2013-08-27 | International Business Machines Corporation | Prioritizing client accounts |
| US8542117B1 (en) | 2010-02-18 | 2013-09-24 | Athoc, Inc. | Predictive alert targeting for mass notification systems |
| US20130268520A1 (en) | 2012-04-04 | 2013-10-10 | Microsoft Corporation | Incremental Visualization for Structured Data in an Enterprise-level Data Store |
| US8566788B2 (en) | 2003-07-02 | 2013-10-22 | Amazon.Com, Inc. | Predictive prefetching to improve parallelization of data retrieval subtasks |
| US20130297646A1 (en) | 2012-05-03 | 2013-11-07 | Hiromichi Watari | Systems and methods of accessing distributed data |
| US20130304798A1 (en) | 2012-05-10 | 2013-11-14 | Microsoft Corporation | Predicting and retrieving data for preloading on client device |
| CN103412922A (en) | 2013-08-12 | 2013-11-27 | 曙光信息产业股份有限公司 | Data query processing method |
| US8631325B1 (en) | 2013-08-09 | 2014-01-14 | Zoomdata, Inc. | Real-time data visualization of streaming data |
| WO2014011708A2 (en) | 2012-07-12 | 2014-01-16 | Microsoft Corporation | Progressive query computation using streaming architectures |
| US20140156343A1 (en) | 2012-06-18 | 2014-06-05 | ServiceSource International, Inc. | Multi-tier channel partner management for recurring revenue sales |
| US20140207756A1 (en) | 2012-12-19 | 2014-07-24 | International Business Machines Corporation | Using temporary performance objects for enhanced query performance |
| US8849730B2 (en) | 2011-12-15 | 2014-09-30 | Microsoft Corporation | Prediction of user response actions to received data |
| US20140301191A1 (en) | 2013-04-05 | 2014-10-09 | Telefonaktiebolaget L M Ericsson (Publ) | User plane traffic handling using network address translation and request redirection |
| US20140310470A1 (en) | 2013-04-16 | 2014-10-16 | Facebook, Inc. | Intelligent caching |
| US20140358634A1 (en) | 2013-05-31 | 2014-12-04 | Automotivemastermind, Llc | Method of generating a prioritized listing of customers using a purchase behavior prediction score |
| US20140359471A1 (en) | 2011-12-06 | 2014-12-04 | autoGraph, Inc. | Consumer self-profiling gui, analysis and rapid information presentation tools |
| US20150006615A1 (en) | 2013-06-27 | 2015-01-01 | Cisco Technology, Inc. | Dynamic content distribution network selection based on context from transient criteria |
| US20150006483A1 (en) | 2012-09-10 | 2015-01-01 | Oracle International Corporation | Preventing database replication conflicts in a distributed environment |
| US8938688B2 (en) | 1998-12-04 | 2015-01-20 | Nuance Communications, Inc. | Contextual prediction of user words and user actions |
| US20150046429A1 (en) | 2013-08-12 | 2015-02-12 | International Business Machines Corporation | Smart Query Plan with Visual Optimizations to Improve Responsiveness |
| US20150088919A1 (en) | 2013-09-20 | 2015-03-26 | Oracle International Corporation | Transforming a query to reuse stored data |
| US20150106431A1 (en) | 2003-06-26 | 2015-04-16 | Microsoft Corporation | Method and system for distributing load by redirecting traffic |
| US20150161211A1 (en) | 2013-12-06 | 2015-06-11 | Vmware, Inc. | Predictive query result computation |
| US9069864B2 (en) | 2012-09-21 | 2015-06-30 | Google Inc. | Prioritizing a content item for a user |
| US20150254307A1 (en) | 2014-03-10 | 2015-09-10 | Interana, Inc. | System and methods for rapid data analysis |
| US20150261773A1 (en) | 2012-07-04 | 2015-09-17 | Qatar Foundation | System and Method for Automatic Generation of Information-Rich Content from Multiple Microblogs, Each Microblog Containing Only Sparse Information |
| US9158786B1 (en) | 2014-10-01 | 2015-10-13 | Bertram Capital Management, Llc | Database selection system and method to automatically adjust a database schema based on an input data |
| US9172809B1 (en) | 2014-06-19 | 2015-10-27 | Avaya Inc. | System and method for prioritizing customers and predicting service escalation |
| US20150324356A1 (en) | 2012-11-16 | 2015-11-12 | Telefonica, S.A. | A method and a system for creating a user profile for recommendation purposes |
| US20150334091A1 (en) | 2000-11-03 | 2015-11-19 | Pulse Secure, Llc | Method and System for Providing Secure Access to Private Networks |
| US20150341407A1 (en) | 2014-05-21 | 2015-11-26 | Sony Corporation | System, method, and computer program product for media publishing request processing |
| US20160004744A1 (en) | 2013-03-07 | 2016-01-07 | Brian Charles ERIKSSON | Top-k search using selected pairwise comparisons |
| US9235637B1 (en) | 2004-06-22 | 2016-01-12 | Google Inc. | Systems and methods for generating predicted queries and corresponding search results |
| US9251276B1 (en) | 2015-02-27 | 2016-02-02 | Zoomdata, Inc. | Prioritization of retrieval and/or processing of data |
| WO2016021019A1 (en) | 2014-08-07 | 2016-02-11 | 株式会社野村総合研究所 | Market-price processing system |
| CN105677511A (en) | 2015-12-30 | 2016-06-15 | 首都师范大学 | Data writing method and apparatus for reducing synchronization overheads |
| US20160224641A1 (en) | 2015-02-03 | 2016-08-04 | Red Hat, Inc. | Obtaining incremental updates from a database using a partial query |
| US20160239765A1 (en) | 2015-02-17 | 2016-08-18 | Amadeus S.A.S. | Personalized ranking for search results of a travel-related database query |
| US9424336B2 (en) | 2012-09-14 | 2016-08-23 | Salesforce.Com, Inc. | Facilitating distributed data processing for dynamic and efficient generation of search results in an on-demand services environment |
| US20160246519A1 (en) | 2015-02-20 | 2016-08-25 | Netapp, Inc. | Solid state device parity caching in a hybrid storage array |
| US20160321270A1 (en) | 2010-08-19 | 2016-11-03 | Google Inc. | Predictive query completion and predictive search results |
Family Cites Families (28)
| Publication number | Priority date | Publication date | Assignee | Title |
|---|---|---|---|---|
| US8028314B1 (en) | 2000-05-26 | 2011-09-27 | Sharp Laboratories Of America, Inc. | Audiovisual information management system |
| US6928428B1 (en)* | 2000-11-27 | 2005-08-09 | Microsoft Corporation | Distributed confidential contextual querying |
| US20020078075A1 (en) | 2000-12-15 | 2002-06-20 | Colson James C. | System, method, and program product for prioritizing synchronizable data |
| US6912649B2 (en) | 2002-03-13 | 2005-06-28 | International Business Machines Corporation | Scheme to encode predicted values into an instruction stream/cache without additional bits/area |
| WO2005015366A2 (en)* | 2003-08-08 | 2005-02-17 | Electric Power Group, Llc | Real-time performance monitoring and management system |
| US8732234B2 (en) | 2005-06-07 | 2014-05-20 | Yahoo! Inc. | Providing relevant non-requested content to a mobile device |
| US20070239645A1 (en) | 2006-03-28 | 2007-10-11 | Ping Du | Predictive preprocessing of request |
| US7580941B2 (en) | 2006-06-13 | 2009-08-25 | Microsoft Corporation | Automated logical database design tuning |
| US20080154827A1 (en) | 2006-12-20 | 2008-06-26 | Connors Laurence A | Method of comparing actual and user predicted changes in data |
| US7921100B2 (en)* | 2008-01-02 | 2011-04-05 | At&T Intellectual Property I, L.P. | Set similarity selection queries at interactive speeds |
| US8589503B2 (en) | 2008-04-04 | 2013-11-19 | Mcafee, Inc. | Prioritizing network traffic |
| US8135655B2 (en) | 2008-10-02 | 2012-03-13 | Global Healthcare Exchange, Llc | Dynamic intelligent objects |
| EP2761510A4 (en) | 2011-09-29 | 2015-08-05 | Cirro Inc | Federated query engine for federation of data queries across structure and unstructured data |
| US8601474B2 (en) | 2011-10-14 | 2013-12-03 | International Business Machines Corporation | Resuming execution of an execution plan in a virtual machine |
| US8930347B2 (en) | 2011-12-14 | 2015-01-06 | International Business Machines Corporation | Intermediate result set caching for a database system |
| US9158814B2 (en) | 2012-03-30 | 2015-10-13 | International Business Machines Corporation | Obtaining partial results from a database query |
| US8838579B2 (en) | 2012-04-26 | 2014-09-16 | Sap Ag | Data flow graph optimization using adaptive rule chaining |
| JP5967672B2 (en) | 2012-04-27 | 2016-08-10 | 株式会社日立製作所 | Database management system, computer, database management method |
| WO2013161081A1 (en) | 2012-04-27 | 2013-10-31 | 株式会社日立製作所 | Database management system, computer, and database management method |
| US8862571B2 (en)* | 2012-06-29 | 2014-10-14 | International Business Machines Corporation | Predicate pushdown with late materialization in database query processing |
| US9443016B2 (en) | 2013-02-08 | 2016-09-13 | Verbify Inc. | System and method for generating and interacting with a contextual search stream |
| WO2014127158A1 (en) | 2013-02-14 | 2014-08-21 | Tibco Software Inc. | Application congestion control |
| US20150032768A1 (en) | 2013-03-15 | 2015-01-29 | Expedia, Inc. | Managing item queries |
| US10268638B2 (en) | 2013-11-27 | 2019-04-23 | Paraccel Llc | Limiting plan choice for database queries using plan constraints |
| US10628417B2 (en) | 2013-12-01 | 2020-04-21 | Paraccel Llc | Physical planning of database queries using partial solutions |
| US10915449B2 (en) | 2013-12-19 | 2021-02-09 | Hewlett Packard Enterprise Development Lp | Prioritizing data requests based on quality of service |
| US10255365B2 (en) | 2014-08-29 | 2019-04-09 | Facebook, Inc. | Priming search results on online social networks |
| US9811559B2 (en) | 2014-09-01 | 2017-11-07 | Mapquest, Inc. | Computerized systems and methods for identifying points-of-interest using customized query prediction |
- 2013
- 2013-08-09USUS13/963,668patent/US8631325B1/enactiveActive
- 2014
- 2014-01-13USUS14/153,690patent/US9396190B2/enactiveActive
- 2014-01-13USUS14/153,664patent/US9411807B2/enactiveActive
- 2016
- 2016-06-21USUS15/188,975patent/US9612742B2/enactiveActive
- 2016-06-29USUS15/197,733patent/US9696903B2/enactiveActive
- 2017
- 2017-02-08USUS15/428,136patent/US9946811B2/enactiveActive
- 2017-12-29USUS15/858,935patent/US20180121565A1/ennot_activeAbandoned
Patent Citations (143)
| Publication number | Priority date | Publication date | Assignee | Title |
|---|---|---|---|---|
| US4769772A (en) | 1985-02-28 | 1988-09-06 | Honeywell Bull, Inc. | Automated query optimization method using both global and parallel local optimizations for materialization access planning for distributed databases |
| US6026397A (en)* | 1996-05-22 | 2000-02-15 | Electronic Data Systems Corporation | Data analysis system and method |
| US7340409B1 (en) | 1996-09-20 | 2008-03-04 | Ulwick Anthony W | Computer based process for strategy evaluation and optimization based on customer desired outcomes and predictive metrics |
| US6072493A (en)* | 1997-03-31 | 2000-06-06 | Bellsouth Corporation | System and method for associating services information with selected elements of an organization |
| US20020091994A1 (en)* | 1997-10-24 | 2002-07-11 | Scott C. Mccready | Systems and methods for software evaluation and performance measurement |
| US8938688B2 (en) | 1998-12-04 | 2015-01-20 | Nuance Communications, Inc. | Contextual prediction of user words and user actions |
| US6505246B1 (en)* | 1998-12-30 | 2003-01-07 | Candle Distributed Solutions, Inc. | User interface for system management applications |
| US6633873B1 (en) | 1999-02-16 | 2003-10-14 | Fujitsu Limited | Distributed data retrieval system including mechanism for predicting an amount of response data |
| US8489982B2 (en)* | 1999-05-21 | 2013-07-16 | E-Numerate Solutions, Inc. | Reusable data markup language |
| US20040193631A1 (en)* | 1999-08-06 | 2004-09-30 | Hiroya Kumashio | System for document management and information processing |
| US7502366B1 (en) | 2000-05-23 | 2009-03-10 | Advanced Micro Devices, Inc. | Arrangement in a network switch for prioritizing data frames based on user-defined frame attributes |
| US6519604B1 (en) | 2000-07-19 | 2003-02-11 | Lucent Technologies Inc. | Approximate querying method for databases with multiple grouping attributes |
| US8027854B2 (en) | 2000-09-22 | 2011-09-27 | Ita Software, Inc. | Method, system, and computer program product for interfacing with information sources |
| US20150334091A1 (en) | 2000-11-03 | 2015-11-19 | Pulse Secure, Llc | Method and System for Providing Secure Access to Private Networks |
| US7308445B2 (en) | 2000-11-08 | 2007-12-11 | Overture Services, Inc. | Method for estimating coverage of web search engines |
| US20060036600A1 (en) | 2001-01-12 | 2006-02-16 | Microsoft Corporation | Database aggregation query result estimator |
| US7761324B2 (en)* | 2001-11-09 | 2010-07-20 | Siebel Systems, Inc. | Forecasting and revenue management system |
| US20070208607A1 (en)* | 2001-11-09 | 2007-09-06 | Prasanna Amerasinghe | Method for forecasting and revenue management |
| US20030182261A1 (en) | 2002-02-15 | 2003-09-25 | Patterson James Edmund | Queuing model for a plurality of servers |
| US7333974B2 (en) | 2002-02-15 | 2008-02-19 | Cognos, Inc. | Queuing model for a plurality of servers |
| US20030158913A1 (en) | 2002-02-15 | 2003-08-21 | Agnoli Giovanni M. | System, method, and computer program product for media publishing request processing |
| US7155475B2 (en) | 2002-02-15 | 2006-12-26 | Sony Corporation | System, method, and computer program product for media publishing request processing |
| US20030225644A1 (en) | 2002-06-04 | 2003-12-04 | Fabio Casati | Dynamic prioritization of activities |
| US7822658B2 (en) | 2002-06-04 | 2010-10-26 | Hewlett-Packard Development Company, L.P. | Dynamic prioritization of activities |
| US20040221053A1 (en) | 2003-04-30 | 2004-11-04 | International Business Machines Corporation | Method and system for efficient data transmission in interactive networked environments |
| US8140698B2 (en) | 2003-04-30 | 2012-03-20 | International Business Machines Corporation | Method and system for efficient data transmission in interactive networked environments |
| US20040249810A1 (en) | 2003-06-03 | 2004-12-09 | Microsoft Corporation | Small group sampling of data for use in query processing |
| US20150106431A1 (en) | 2003-06-26 | 2015-04-16 | Microsoft Corporation | Method and system for distributing load by redirecting traffic |
| US8566788B2 (en) | 2003-07-02 | 2013-10-22 | Amazon.Com, Inc. | Predictive prefetching to improve parallelization of data retrieval subtasks |
| US7373389B2 (en) | 2003-08-27 | 2008-05-13 | Spoke Software | Periodic update of data in a relationship system |
| US7467131B1 (en) | 2003-09-30 | 2008-12-16 | Google Inc. | Method and system for query data caching and optimization in a search engine system |
| US20050165753A1 (en) | 2004-01-23 | 2005-07-28 | Harr Chen | Building and using subwebs for focused search |
| US20050234890A1 (en) | 2004-02-19 | 2005-10-20 | Urs Enzler | Generation of database queries from database independent selection conditions |
| US20060293872A1 (en) | 2004-03-16 | 2006-12-28 | M-I L.L.C. | Three-dimensional wellbore analysis and visualization |
| US20060047830A1 (en) | 2004-03-23 | 2006-03-02 | Pctel, Inc. | Pctel14100U method and system for automatic data transfer on a network-connected device |
| US20120210119A1 (en) | 2004-06-14 | 2012-08-16 | Arthur Baxter | Method and Apparatus for Secure Internet Browsing |
| US9235637B1 (en) | 2004-06-22 | 2016-01-12 | Google Inc. | Systems and methods for generating predicted queries and corresponding search results |
| US7814042B2 (en) | 2004-08-17 | 2010-10-12 | Oracle International Corporation | Selecting candidate queries |
| US20090132906A1 (en)* | 2004-10-27 | 2009-05-21 | Justsystems Corporation | Document processing device and document processing method |
| US20060106759A1 (en) | 2004-11-01 | 2006-05-18 | Hitachi, Ltd. | Computer system, computer, data access method and database system |
| US7693816B2 (en) | 2004-11-01 | 2010-04-06 | Hitachi, Ltd. | Computer system, computer, data access method and database system |
| US20060155920A1 (en) | 2004-12-16 | 2006-07-13 | Smith Peter J | Non-volatile memory and method with multi-stream updating |
| US7688322B2 (en) | 2005-01-18 | 2010-03-30 | Oculus Info Inc. | System and method for data visualization using a synchronous display of sequential time data and on-map planning |
| US7680781B1 (en) | 2005-03-04 | 2010-03-16 | Teradata Us, Inc. | Automatic search query generation and results set management |
| US20120271748A1 (en) | 2005-04-14 | 2012-10-25 | Disalvo Dean F | Engineering process for a real-time user-defined data collection, analysis, and optimization tool (dot) |
| US20060265288A1 (en) | 2005-05-17 | 2006-11-23 | Payless Certified Diamonds.Com, Inc. | Diamond retailer, wholesaler and consumer finder, tracker and sales system |
| US20070022256A1 (en) | 2005-07-19 | 2007-01-25 | Cantin Jason F | Method, apparatus, and computer program product for a cache coherency protocol state that predicts locations of shared memory blocks |
| WO2007068279A1 (en) | 2005-12-14 | 2007-06-21 | Piaton, Alain, Nicolas | Method and computer system for updating a database from a server to at least one client |
| US20070162425A1 (en) | 2006-01-06 | 2007-07-12 | International Business Machines Corporation | System and method for performing advanced cost/benefit analysis of asynchronous operations |
| US20090013089A1 (en) | 2006-01-20 | 2009-01-08 | Michael Sullivan | Systems and Methods for Discerning and Controlling Communication Traffic |
| US20070174188A1 (en) | 2006-01-25 | 2007-07-26 | Fish Robert D | Electronic marketplace that facilitates transactions between consolidated buyers and/or sellers |
| US20070226178A1 (en) | 2006-03-24 | 2007-09-27 | International Business Machines Corporation | Predictable query execution through early materialization |
| US20090259522A1 (en)* | 2006-05-02 | 2009-10-15 | Jamie Rapperport | System and methods for generating quantitative pricing power and risk scores |
| US7792835B2 (en) | 2006-07-25 | 2010-09-07 | Mypoints.Com Inc. | Method of efficient target query selection ranging |
| US20080065588A1 (en) | 2006-08-24 | 2008-03-13 | Craig Stephen Aldrich | Selectively Logging Query Data Based On Cost |
| US8180720B1 (en) | 2007-07-19 | 2012-05-15 | Akamai Technologies, Inc. | Content delivery network (CDN) cold content handling |
| US7673278B2 (en) | 2007-11-29 | 2010-03-02 | Tokyo Electron Limited | Enhanced process yield using a hot-spot library |
| US20090144103A1 (en)* | 2007-11-30 | 2009-06-04 | Sap Ag | Method and System Incorporating Business Rules and Price Optimization for Financial System |
| US20090150343A1 (en) | 2007-12-05 | 2009-06-11 | Kayak Software Corporation | Multi-Phase Search And Presentation For Vertical Search Websites |
| US8972434B2 (en) | 2007-12-05 | 2015-03-03 | Kayak Software Corporation | Multi-phase search and presentation for vertical search websites |
| US20090177667A1 (en) | 2008-01-07 | 2009-07-09 | International Business Machines Corporation | Smart Data Caching Using Data Mining |
| US9563657B2 (en) | 2008-01-08 | 2017-02-07 | International Business Machines Corporation | Generating data queries using a graphical selection tree |
| US20090177988A1 (en) | 2008-01-08 | 2009-07-09 | International Business Machines Corporation | Generating data queries using a graphical selection tree |
| US8539565B2 (en) | 2008-03-21 | 2013-09-17 | Microsoft Corporation | Load balancing in server computer systems |
| US20090241176A1 (en) | 2008-03-21 | 2009-09-24 | Microsoft Corporation | Load balancing in server computer systems |
| US8122223B2 (en) | 2008-04-18 | 2012-02-21 | International Business Machines Corporation | Access speculation predictor with predictions based on memory region prior requestor tag information |
| US20090287814A1 (en) | 2008-05-14 | 2009-11-19 | Microsoft Corporation | Visualization of streaming real-time data |
| US20090300544A1 (en)* | 2008-05-30 | 2009-12-03 | Mike Psenka | Enhanced user interface and data handling in business intelligence software |
| US8959108B2 (en) | 2008-06-18 | 2015-02-17 | Zeitera, Llc | Distributed and tiered architecture for content search and content monitoring |
| US20120095958A1 (en) | 2008-06-18 | 2012-04-19 | Zeitera, Llc | Distributed and Tiered Architecture for Content Search and Content Monitoring |
| US20090328054A1 (en) | 2008-06-26 | 2009-12-31 | Microsoft Corporation | Adapting message delivery assignments with hashing and mapping techniques |
| US20090322755A1 (en) | 2008-06-26 | 2009-12-31 | Microsoft Corporation | Declarative approach for visuzliation |
| US8095935B2 (en) | 2008-06-26 | 2012-01-10 | Microsoft Corporation | Adapting message delivery assignments with hashing and mapping techniques |
| US20130066895A1 (en) | 2008-07-10 | 2013-03-14 | Yung Choi | Providing Suggestion and Translation Thereof In Accordance With A Partial User Entry |
| US8090715B2 (en) | 2008-07-14 | 2012-01-03 | Disney Enterprises, Inc. | Method and system for dynamically generating a search result |
| US20100010984A1 (en) | 2008-07-14 | 2010-01-14 | Disney Enterprises, Inc. | Method and system for dynamically generating a search result |
| US20100017740A1 (en)* | 2008-07-17 | 2010-01-21 | Microsoft Corporation | Pan and zoom control |
| US20100131654A1 (en) | 2008-11-25 | 2010-05-27 | Microsoft Corporation | Platform for enabling terminal services virtualization |
| US20100153429A1 (en) | 2008-12-11 | 2010-06-17 | Yu Xu | System, method, and computer-readable medium for optimizing processing of queries featuring maximum or minimum equality conditions in a parallel processing system |
| US20100162152A1 (en) | 2008-12-18 | 2010-06-24 | Microsoft Corporation | Data Visualization Interactivity Architecture |
| US20100185619A1 (en) | 2009-01-22 | 2010-07-22 | Alibaba Group Holding Limited | Sampling analysis of search queries |
| US20100205128A1 (en) | 2009-02-12 | 2010-08-12 | Decisive Analytics Corporation | Method and apparatus for analyzing and interrelating data |
| US20110055202A1 (en) | 2009-08-31 | 2011-03-03 | Heimendinger Scott M | Predictive data caching |
| US20110137896A1 (en) | 2009-12-07 | 2011-06-09 | Sony Corporation | Information processing apparatus, predictive conversion method, and program |
| US20110202841A1 (en)* | 2010-02-12 | 2011-08-18 | Dempster Benjamin I | Computer-based project management |
| US8542117B1 (en) | 2010-02-18 | 2013-09-24 | Athoc, Inc. | Predictive alert targeting for mass notification systems |
| US20110246388A1 (en) | 2010-04-05 | 2011-10-06 | Kalengo Llc | System and method for providing financial asset pricing chart with aggregated, ranked and filtered articles |
| US20110271071A1 (en) | 2010-04-28 | 2011-11-03 | Hitachi, Ltd. | Storage apparatus and hierarchical data management method for storage apparatus |
| US20110289185A1 (en) | 2010-05-21 | 2011-11-24 | Brian Heder | Method, system, and apparatus for transitioning from ipv4 to ipv6 |
| US20120023120A1 (en) | 2010-07-22 | 2012-01-26 | Google Inc. | Predictive query suggestion caching |
| US20160321270A1 (en) | 2010-08-19 | 2016-11-03 | Google Inc. | Predictive query completion and predictive search results |
| US20120089920A1 (en) | 2010-10-06 | 2012-04-12 | Stephen Gregory Eick | Platform and method for analyzing real-time position and movement data |
| US20130208591A1 (en) | 2010-10-22 | 2013-08-15 | Telefonaktiebolaget L M Ericsson (Publ) | Mobile-Access Information Based Adaptation of Network Address Lookup for Differentiated Handling of Data Traffic |
| US20120151399A1 (en) | 2010-12-13 | 2012-06-14 | Microsoft Corporation | Bull's-eye multidimensional data visualization |
| US20120173759A1 (en) | 2010-12-29 | 2012-07-05 | Mugdha Agarwal | Systems and Methods for Policy Based Integration to Horizontally Deployed WAN Optimization Appliances |
| US20120203762A1 (en) | 2011-02-04 | 2012-08-09 | Subbarao Kakarlamudi | Systems and methods for holding a query |
| US20120254316A1 (en) | 2011-03-28 | 2012-10-04 | Ontario, Canada) | Communications system including trusted server to verify a redirection request and associated methods |
| US20120299965A1 (en) | 2011-05-23 | 2012-11-29 | Microsoft Corporation | Calculating zoom level timeline data |
| US20130083031A1 (en) | 2011-09-29 | 2013-04-04 | Schlumberger Technology Corporation | Customizable User Interface for Real-Time Oilfield Data Visualization |
| US20130111467A1 (en) | 2011-10-27 | 2013-05-02 | Cisco Technology, Inc. | Dynamic Server Farms |
| US9154549B2 (en) | 2011-10-27 | 2015-10-06 | Cisco Technology, Inc. | Dynamic server farms |
| US20140359471A1 (en) | 2011-12-06 | 2014-12-04 | autoGraph, Inc. | Consumer self-profiling gui, analysis and rapid information presentation tools |
| US8849730B2 (en) | 2011-12-15 | 2014-09-30 | Microsoft Corporation | Prediction of user response actions to received data |
| US9357020B2 (en) | 2011-12-29 | 2016-05-31 | Sony Corporation | Information source selection system, information source selection method, and program |
| US20130173707A1 (en) | 2011-12-29 | 2013-07-04 | Sony Computer Entertainment Inc. | Information source selection system, information source selection method, and program |
| US20130268520A1 (en) | 2012-04-04 | 2013-10-10 | Microsoft Corporation | Incremental Visualization for Structured Data in an Enterprise-level Data Store |
| US20130297646A1 (en) | 2012-05-03 | 2013-11-07 | Hiromichi Watari | Systems and methods of accessing distributed data |
| US8892638B2 (en) | 2012-05-10 | 2014-11-18 | Microsoft Corporation | Predicting and retrieving data for preloading on client device |
| US20130304798A1 (en) | 2012-05-10 | 2013-11-14 | Microsoft Corporation | Predicting and retrieving data for preloading on client device |
| US20140156343A1 (en) | 2012-06-18 | 2014-06-05 | ServiceSource International, Inc. | Multi-tier channel partner management for recurring revenue sales |
| US8521574B1 (en) | 2012-06-20 | 2013-08-27 | International Business Machines Corporation | Prioritizing client accounts |
| US20150261773A1 (en) | 2012-07-04 | 2015-09-17 | Qatar Foundation | System and Method for Automatic Generation of Information-Rich Content from Multiple Microblogs, Each Microblog Containing Only Sparse Information |
| WO2014011708A2 (en) | 2012-07-12 | 2014-01-16 | Microsoft Corporation | Progressive query computation using streaming architectures |
| US20150006483A1 (en) | 2012-09-10 | 2015-01-01 | Oracle International Corporation | Preventing database replication conflicts in a distributed environment |
| US9424336B2 (en) | 2012-09-14 | 2016-08-23 | Salesforce.Com, Inc. | Facilitating distributed data processing for dynamic and efficient generation of search results in an on-demand services environment |
| US9069864B2 (en) | 2012-09-21 | 2015-06-30 | Google Inc. | Prioritizing a content item for a user |
| US20150324356A1 (en) | 2012-11-16 | 2015-11-12 | Telefonica, S.A. | A method and a system for creating a user profile for recommendation purposes |
| US20140207756A1 (en) | 2012-12-19 | 2014-07-24 | International Business Machines Corporation | Using temporary performance objects for enhanced query performance |
| US20160004744A1 (en) | 2013-03-07 | 2016-01-07 | Brian Charles ERIKSSON | Top-k search using selected pairwise comparisons |
| US20140301191A1 (en) | 2013-04-05 | 2014-10-09 | Telefonaktiebolaget L M Ericsson (Publ) | User plane traffic handling using network address translation and request redirection |
| US9507718B2 (en) | 2013-04-16 | 2016-11-29 | Facebook, Inc. | Intelligent caching |
| US20140310470A1 (en) | 2013-04-16 | 2014-10-16 | Facebook, Inc. | Intelligent caching |
| US9047616B2 (en) | 2013-05-31 | 2015-06-02 | Automotivemastermind, Llc | Method of generating a prioritized listing of customers using a purchase behavior prediction score |
| US20140358634A1 (en) | 2013-05-31 | 2014-12-04 | Automotivemastermind, Llc | Method of generating a prioritized listing of customers using a purchase behavior prediction score |
| US20150006615A1 (en) | 2013-06-27 | 2015-01-01 | Cisco Technology, Inc. | Dynamic content distribution network selection based on context from transient criteria |
| US20150046815A1 (en) | 2013-08-09 | 2015-02-12 | Zoomdata, Inc. | Real-time data visualization of streaming data |
| US20150046449A1 (en) | 2013-08-09 | 2015-02-12 | Zoomdata, Inc. | Real-time data visualization of streaming data |
| US8631325B1 (en) | 2013-08-09 | 2014-01-14 | Zoomdata, Inc. | Real-time data visualization of streaming data |
| CN103412922A (en) | 2013-08-12 | 2013-11-27 | 曙光信息产业股份有限公司 | Data query processing method |
| US20150046429A1 (en) | 2013-08-12 | 2015-02-12 | International Business Machines Corporation | Smart Query Plan with Visual Optimizations to Improve Responsiveness |
| US20150088919A1 (en) | 2013-09-20 | 2015-03-26 | Oracle International Corporation | Transforming a query to reuse stored data |
| US20150161211A1 (en) | 2013-12-06 | 2015-06-11 | Vmware, Inc. | Predictive query result computation |
| US20150254307A1 (en) | 2014-03-10 | 2015-09-10 | Interana, Inc. | System and methods for rapid data analysis |
| US20150341407A1 (en) | 2014-05-21 | 2015-11-26 | Sony Corporation | System, method, and computer program product for media publishing request processing |
| US9521176B2 (en) | 2014-05-21 | 2016-12-13 | Sony Corporation | System, method, and computer program product for media publishing request processing |
| US9172809B1 (en) | 2014-06-19 | 2015-10-27 | Avaya Inc. | System and method for prioritizing customers and predicting service escalation |
| WO2016021019A1 (en) | 2014-08-07 | 2016-02-11 | 株式会社野村総合研究所 | Market-price processing system |
| US9158786B1 (en) | 2014-10-01 | 2015-10-13 | Bertram Capital Management, Llc | Database selection system and method to automatically adjust a database schema based on an input data |
| US20160224641A1 (en) | 2015-02-03 | 2016-08-04 | Red Hat, Inc. | Obtaining incremental updates from a database using a partial query |
| US20160239765A1 (en) | 2015-02-17 | 2016-08-18 | Amadeus S.A.S. | Personalized ranking for search results of a travel-related database query |
| US20160246519A1 (en) | 2015-02-20 | 2016-08-25 | Netapp, Inc. | Solid state device parity caching in a hybrid storage array |
| US9251276B1 (en) | 2015-02-27 | 2016-02-02 | Zoomdata, Inc. | Prioritization of retrieval and/or processing of data |
| CN105677511A (en) | 2015-12-30 | 2016-06-15 | 首都师范大学 | Data writing method and apparatus for reducing synchronization overheads |
Non-Patent Citations (23)
| Title |
|---|
| Baron Schwartz, "Selecting Representative Samples From a Stream of Queries", Jul. 3, 2015 downloaded from URL <https://www.vividcortex.com/blog/2015/07/03/representative-samples-stream-queries/>, 6 pages. |
| Bennett et al., "Feature-Based Statistical Analysis of Combustion Simulation Data", IEEE Transactions on Visualization and Computer Graphics, vol. 17, No. 12, Dec. 2011, pp. 1822-1831 (10 pages). |
| Daniel Gomes et al., "Webstore: a Manager for Incremental Storage of Contents", Nov. 2004, downloaded from URLhttp://repositorio.ul.pt/bitstream/10455/2910/1/04-15.pdf, 22 pages. |
| Final Office Action mailed on Apr. 27, 2017 in corresponding U.S. Appl. No. 15/190,153 (17 pages). |
| Final Office Action mailed on Feb. 9, 2017 in corresponding U.S. Appl. No. 15/010,986 (29 pages). |
| Hussam Abu-Libdeh et al., "RACS: A Case for Cloud Storage Diversity", SoCC'10, Jun. 10-11, 2010, downloaded from URL>http://pubs.0xff.ps/papers/racs-socc.pdf>, 11 pages. |
| Kandel et al., "Enterprise Data Analysis and Visualization: An Interview Study", IEEE Transactions on Visualization and Computer Graphics, vol. 18, No. 12, Dec. 2012, pp. 2017-2026 (10 pages). |
| Keim et al., "Information Visualization and Visual Data Mining", IEEE Transactions on Visualization and Computer Graphics, vol. 8, No. 1, Jan.-Mar. 2002, pp. 1-8. |
| Non-Final Office Action as issued in U.S. Appl. No. 15/188,975, dated Aug. 19, 2016. |
| Non-Final Office Action as issued in U.S. Appl. No. 15/190,153, dated Oct. 14, 2016. |
| Non-Final Office Action mailed on Feb. 17, 2017 in corresponding U.S. Appl. No. 15/382,249 (15 pages). |
| Non-Final Office Action mailed on Feb. 17, 2017 in corresponding U.S. Appl. No. 15/382,522 (24 pages). |
| Non-Final Office Action mailed on Feb. 22, 2017 in corresponding U.S. Appl. No. 15/382,513 (25 pages). |
| Non-Final Office Action mailed on Feb. 28, 2017 in corresponding U.S. Appl. No. 15/382,510 (26 pages). |
| Non-Final Office Action mailed on Mar. 13, 2017 in corresponding U.S. Appl. No. 15/428,136 (19 pages). |
| Non-Final Office Action mailed on Mar. 21, 2017 in corresponding U.S. Appl. No. 15/409,499 (34 pages). |
| Non-Final Office Action mailed on Mar. 24, 2017 in corresponding U.S. Appl. No. 15/382,534 (13 pages). |
| P. Kuppusamy et al. "Cluster Based Cooperative Caching Approach Through Mobility Prophecy in MANET", Computing Communication & Networking Technologies (ICCCNT), Third International Conference on. IEEE, Jul. 26-28, 2012, 10 pages. |
| Pham et al., "Visualization of Diversity in Large Multivariate Data Sets", IEEE Transactions on Visualization and Computer Graphics, vol. 16, No. 6, Nov./Dec. 2010, pp. 1053-1062 (10 pages). |
| Rubel et al., "Integrating Data Clustering and Visualization for the Analysis of 3D Gene Expression Data", IEEE/ACM Transactions on Computational Biology and Bioinformatics, vol. 7, No. 1, Jan.-Mar. 2010, pp. 64-79 (16 pages). |
| Surajit Chaudhuri et al., "Optimized Stratified Sampling for Approximate Query Processing", ACM Transactions on Database Systems, vol. 32, No. 2, Article 9, Jun. 2007, downloaded from URL<http://ranger.uta.edu/˜gdas/websitepages/preprints-papers/a9-chaudhuri.pdf>, 50 pages. |
| Valeria Cardellini et al., "Dynamic Load Balancing on Web-server Systems", IEEE Internet Computing, vol. 3, No. 3, May-Jun. 1999, pp. 28-39. |
| Yu et al., "Visual Mining of Multimedia Data for Social and Behavioral Studies", IEEE Symposium on Visual Analytics Science and Technology, Oct. 21-23, 2008, pp. 155-162 (8 pages). |
Also Published As
| Publication number | Publication date |
|---|---|
| US8631325B1 (en) | 2014-01-14 |
| US9946811B2 (en) | 2018-04-17 |
| US20150046449A1 (en) | 2015-02-12 |
| US20160306861A1 (en) | 2016-10-20 |
| US20150046815A1 (en) | 2015-02-12 |
| US20160313911A1 (en) | 2016-10-27 |
| US9411807B2 (en) | 2016-08-09 |
| US9396190B2 (en) | 2016-07-19 |
| US9612742B2 (en) | 2017-04-04 |
| US20180121565A1 (en) | 2018-05-03 |
| US20170147711A1 (en) | 2017-05-25 |
Similar Documents
| Publication | Publication Date | Title |
|---|---|---|
| US9696903B2 (en) | Real-time data visualization of streaming data | |
| US12346389B2 (en) | Data visualization implementation | |
| US10496940B2 (en) | Presenting resource utilization in a user interface | |
| US10656789B2 (en) | Locating event on timeline | |
| JP2024096906A (en) | Techniques for data-driven correlation of metrics | |
| CN113110784B (en) | Semantic distance-based assignment of data elements to visualization edges | |
| US10460485B2 (en) | Multi-dimensional data visualization | |
| US9811567B2 (en) | Prioritization of retrieval and/or processing of data | |
| US9817871B2 (en) | Prioritized retrieval and/or processing of data via query selection | |
| US11556940B2 (en) | Taste profile system | |
| CA3050995C (en) | Managing event databases using histogram-based analysis | |
| WO2016154426A1 (en) | System and methods for a multi-display collaboration environment | |
| US20180032967A1 (en) | Calendar management for recommending availability of an invitee | |
| KR20200072258A (en) | Methode and apparatus of providing user interface | |
| US20160026633A1 (en) | Devices, systems and methods for rendering, updating and communicating relationship information | |
| US20200302453A1 (en) | A system and method for simulating a game to indicate a sales team progress on a mobile device | |
| Lambeck et al. | Changing concepts in human-computer interaction in real-time enterprise systems |
Legal Events
| Date | Code | Title | Description |
|---|---|---|---|
| AS | Assignment | Owner name:ZOOMDATA, INC., VIRGINIA Free format text:ASSIGNMENT OF ASSIGNORS INTEREST;ASSIGNORS:LANGSETH, JUSTIN;AREF, FARZAD;ALARCON, JORGE;AND OTHERS;REEL/FRAME:039070/0619 Effective date:20130809 | |
| STCF | Information on status: patent grant | Free format text:PATENTED CASE | |
| AS | Assignment | Owner name:VENTURE LENDING & LEASING VIII, INC., CALIFORNIA Free format text:SECURITY INTEREST;ASSIGNOR:ZOOMDATA, INC.;REEL/FRAME:045210/0545 Effective date:20180131 | |
| AS | Assignment | Owner name:VENTURE LENDING & LEASING IX, INC., CALIFORNIA Free format text:SECURITY INTEREST;ASSIGNOR:ZOOMDATA, INC.;REEL/FRAME:047733/0087 Effective date:20181204 Owner name:VENTURE LENDING & LEASING VIII, INC., CALIFORNIA Free format text:SECURITY INTEREST;ASSIGNOR:ZOOMDATA, INC.;REEL/FRAME:047733/0087 Effective date:20181204 | |
| AS | Assignment | Owner name:PNC BANK, NATIONAL ASSOCIATION, PENNSYLVANIA Free format text:SECURITY INTEREST;ASSIGNOR:ZOOMDATA, INC.;REEL/FRAME:049357/0079 Effective date:20190417 | |
| AS | Assignment | Owner name:ZOOMDATA, INC., CALIFORNIA Free format text:RELEASE BY SECURED PARTY;ASSIGNORS:VENTURE LENDING & LEASING VIII, INC.;VENTURE LENDING & LEASING IX, INC;REEL/FRAME:049526/0324 Effective date:20190603 Owner name:ZOOMDATA, INC., CALIFORNIA Free format text:RELEASE BY SECURED PARTY;ASSIGNOR:VENTURE LENDING & LEASING VIII, INC.;REEL/FRAME:049526/0451 Effective date:20190603 | |
| MAFP | Maintenance fee payment | Free format text:PAYMENT OF MAINTENANCE FEE, 4TH YR, SMALL ENTITY (ORIGINAL EVENT CODE: M2551); ENTITY STATUS OF PATENT OWNER: SMALL ENTITY Year of fee payment:4 | |
| AS | Assignment | Owner name:ZOOMDATA, INC., VIRGINIA Free format text:RELEASE OF SECURITY INTEREST : RECORDED AT REEL/FRAME - 049357/0079;ASSIGNOR:PNC BANK, NATIONAL ASSOCIATION;REEL/FRAME:056155/0868 Effective date:20210401 | |
| AS | Assignment | Owner name:GOLUB CAPITAL LLC, AS COLLATERAL AGENT, ILLINOIS Free format text:PATENT SECURITY AGREEMENT;ASSIGNORS:ZOOMDATA, INC.;IZENDA, INC.;REEL/FRAME:056447/0243 Effective date:20210601 | |
| FEPP | Fee payment procedure | Free format text:ENTITY STATUS SET TO UNDISCOUNTED (ORIGINAL EVENT CODE: BIG.); ENTITY STATUS OF PATENT OWNER: LARGE ENTITY | |
| MAFP | Maintenance fee payment | Free format text:PAYMENT OF MAINTENANCE FEE, 8TH YEAR, LARGE ENTITY (ORIGINAL EVENT CODE: M1552); ENTITY STATUS OF PATENT OWNER: LARGE ENTITY Year of fee payment:8 |