US9618639B2 - Method and system for image-guided fault extraction from a fault-enhanced seismic image - Google Patents
Method and system for image-guided fault extraction from a fault-enhanced seismic imageDownload PDFInfo
- Publication number
- US9618639B2 US9618639B2US13/781,277US201313781277AUS9618639B2US 9618639 B2US9618639 B2US 9618639B2US 201313781277 AUS201313781277 AUS 201313781277AUS 9618639 B2US9618639 B2US 9618639B2
- Authority
- US
- United States
- Prior art keywords
- fault
- image
- path
- fault point
- point
- Prior art date
- Legal status (The legal status is an assumption and is not a legal conclusion. Google has not performed a legal analysis and makes no representation as to the accuracy of the status listed.)
- Active, expires
Links
- 238000000034methodMethods0.000titleclaimsabstractdescription74
- 238000000605extractionMethods0.000titleclaimsabstractdescription21
- 230000004044responseEffects0.000claimsdescription6
- 238000010191image analysisMethods0.000claims2
- 230000008569processEffects0.000description14
- 238000012545processingMethods0.000description9
- 238000004458analytical methodMethods0.000description5
- 238000004891communicationMethods0.000description5
- VNWKTOKETHGBQD-UHFFFAOYSA-NmethaneChemical compoundCVNWKTOKETHGBQD-UHFFFAOYSA-N0.000description4
- 238000010586diagramMethods0.000description3
- 238000012986modificationMethods0.000description3
- 230000004048modificationEffects0.000description3
- 238000004590computer programMethods0.000description2
- 230000006870functionEffects0.000description2
- 239000003345natural gasSubstances0.000description2
- 238000007792additionMethods0.000description1
- 238000013459approachMethods0.000description1
- 230000001427coherent effectEffects0.000description1
- 239000003086colorantSubstances0.000description1
- 239000013065commercial productSubstances0.000description1
- 238000010276constructionMethods0.000description1
- 230000001186cumulative effectEffects0.000description1
- 238000013479data entryMethods0.000description1
- 238000013461designMethods0.000description1
- 238000005553drillingMethods0.000description1
- 238000005516engineering processMethods0.000description1
- 239000012530fluidSubstances0.000description1
- 239000007789gasSubstances0.000description1
- 238000003709image segmentationMethods0.000description1
- 238000003384imaging methodMethods0.000description1
- 230000002452interceptive effectEffects0.000description1
- 238000013507mappingMethods0.000description1
- 239000000463materialSubstances0.000description1
- 230000007246mechanismEffects0.000description1
- 239000000203mixtureSubstances0.000description1
- 230000003287optical effectEffects0.000description1
- 230000000007visual effectEffects0.000description1
Images


Classifications
- G—PHYSICS
- G01—MEASURING; TESTING
- G01V—GEOPHYSICS; GRAVITATIONAL MEASUREMENTS; DETECTING MASSES OR OBJECTS; TAGS
- G01V1/00—Seismology; Seismic or acoustic prospecting or detecting
- G01V1/28—Processing seismic data, e.g. for interpretation or for event detection
- G01V1/30—Analysis
- G01V1/301—Analysis for determining seismic cross-sections or geostructures
- G—PHYSICS
- G01—MEASURING; TESTING
- G01V—GEOPHYSICS; GRAVITATIONAL MEASUREMENTS; DETECTING MASSES OR OBJECTS; TAGS
- G01V1/00—Seismology; Seismic or acoustic prospecting or detecting
- G01V1/28—Processing seismic data, e.g. for interpretation or for event detection
- G01V1/34—Displaying seismic recordings or visualisation of seismic data or attributes
- G01V1/345—Visualisation of seismic data or attributes, e.g. in 3D cubes
- G—PHYSICS
- G01—MEASURING; TESTING
- G01V—GEOPHYSICS; GRAVITATIONAL MEASUREMENTS; DETECTING MASSES OR OBJECTS; TAGS
- G01V1/00—Seismology; Seismic or acoustic prospecting or detecting
- G01V1/28—Processing seismic data, e.g. for interpretation or for event detection
- G01V1/30—Analysis
- G—PHYSICS
- G01—MEASURING; TESTING
- G01V—GEOPHYSICS; GRAVITATIONAL MEASUREMENTS; DETECTING MASSES OR OBJECTS; TAGS
- G01V2210/00—Details of seismic processing or analysis
- G01V2210/60—Analysis
- G01V2210/65—Source localisation, e.g. faults, hypocenters or reservoirs
Definitions
- aspects of the present disclosurerelate to a system and process for interpreting faults from fault-enhanced seismic images. More particularly, aspects of the present disclosure involve a computing system configured to assist an analyst to rapidly and accurately identify and model geologic fault surfaces in two-dimensional and three-dimensional fault-enhanced seismic images.
- Horizons and faultsare fundamental geologic features that describe the geology, geometry, and topology of the subsurface of the earth. Faults compartmentalize the subsurface and are indicators of deformation over geologic time. Faults can act as permeable conduits or impermeable seals affecting the flow of subsurface fluids and gases. Thus, the understanding of faults in an area is often useful for the prospecting of oil and natural gas. Furthermore, seismologists are also tasked with identifying geologic fault hazards that are dangerous when drilling and extracting oil and natural gas. Hence, rapid and accurate mapping of geologic faults has high economic and safety value.
- seismic methodThere are a variety of methods used for producing images that outline subsurface terrain.
- One technique that is often usedinvolves radiating energy into the ground and measuring the reflections at various sensors. This imaging technique is referred to as the seismic method.
- This imaging techniqueis referred to as the seismic method.
- three-dimensional seismic images of the underground geology, geometry, and topologycan be created.
- fault linesare depicted in these seismic images by visible lines.
- a seismologistmay study these lines to determine fault locations for use in prospecting.
- the coherence cube methodwas developed to enhance fault features in seismic images.
- the coherence cube methodin turn has lead to a variety of methods for extracting, or interpreting, fault traces or surfaces from fault-enhanced seismic images. These methods tend to be done manually.
- Manual fault interpretationis usually performed by a trained geologist manually identifying image points that correspond to particular faults and interpolating these points with smooth curves or surfaces, independent of the fault image. High fidelity fault curves or surfaces can be produced only by manually identifying numerous fault points in the fault image.
- Manual interpretation of geological faults in seismic imagesis a tedious, error-prone and largely non-reproducible process.
- One method for extracting curves in 2-D imagesis to use a shortest path algorithm.
- This methodvariously known as “Intelligent Scissors” or “Livewire”, has proven useful for image segmentation in the commercial product Photoshop®. It has not, however, previously been employed for fault interpretation of seismic images.
- a methodfor performing image-guided fault extraction from a fault-enhanced seismic image using at least one processor.
- the fault-enhanced seismic imageincludes a plurality of image slices.
- the methodincludes displaying a fault-enhanced seismic image and receiving a selection of a particular image slice of the plurality of image slices from a user.
- the methodalso includes displaying the particular image slice and receiving a first input designating a first fault point in the particular image slice and receiving a second input designating a second fault point in the particular image slice.
- the methodalso includes defining a fault path between the first fault point and the second fault surface that corresponds to a calculated least cost path.
- the methodfurther includes generating the fault path for display.
- a systemfor performing image-guided fault extraction from a fault-enhanced seismic image.
- the systemincludes a data source that stores a plurality of fault-enhanced seismic images. Each of the plurality of fault-enhanced seismic images includes a plurality of image slices.
- the systemincludes at least one processor and an application executable by at least one processor.
- the executed applicationdisplays a selected one of the plurality of fault-enhanced seismic image.
- the executed applicationalso receives a selection of a particular image slice of plurality of image slices from a user and displays the particular image slice.
- the executed applicationalso receive a first input designating a first fault point in the particular image slice and receives a second input designating a second fault point in the particular image slice.
- the executed applicationfurther identifies a fault path between the first fault point and the second fault point that corresponds to a calculated least cost path and generates the fault path for display.
- FIG. 1depicts an example of a three-dimensional fault enhanced seismic image.
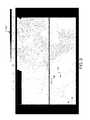
- FIG. 2depicts a horizontal slice from the 3-D fault image shown FIG. 1 .
- FIG. 3depicts a block diagram outlining an example method for performing image-guided fault extraction from a fault-enhanced seismic image in accordance with the present disclosure.
- FIG. 4A-Cdepict example data points and distances between those data points using various weighting algorithms in accordance with the present disclosure
- FIG. 5depicts an interpolated fault path on a horizontal slice that was derived in accordance with the present disclosure.
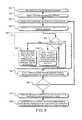
- FIG. 6depicts a block diagram outlining an example method for performing image-guided fault extraction from a fault-enhanced seismic image in accordance with the present disclosure.
- FIG. 7depicts an interpolated fault path along with similar paths on a horizontal slice that was derived in accordance with the present disclosure.
- FIG. 8is a block diagram illustrating an example of a general purpose computing system that may be used in the application of the present disclosure.
- Implementations of the present disclosureinvolve a system and method for performing image-guided fault extraction from a fault-enhanced seismic image.
- the present disclosureprovides for a system and method that divides three-dimensional fault-enhanced seismic images into a series of two-dimensional seismic images and then provides for a semi-automated system for performing fault extraction. This may be accomplished through the use of semi-automatic, or guided, extraction of features indicative of geologic faults in fault enhanced seismic images. This semi-automated system reduces the time required for the interpretation of fault images, while also increasing the accuracy and reproducibility of extracted fault surfaces.
- the three-dimensional fault-enhanced seismic imageis essentially a plurality of data samples from a three-dimensional space. These data samples are then mapped to colors or shades and are used to show a physical attribute throughout the three-dimensional space. In this example, the dark curves on the image indicate the intersection of fault surfaces with each plane of the image.
- Image-guided fault extractionallows for an interactive method of creating smooth surfaces that are aligned with fault features from three-dimensional fault-enhanced seismic images retrieved from, for example, a database or other three-dimensional fault-enhanced seismic image data source.
- the fault-enhanced seismic imagemay be created using any known methodology.
- the coherence cube methodsuch as described above, can be used to create the three-dimensional fault-enhanced seismic image. It is contemplated, however, that other fault-enhanced seismic image generation methods or techniques maybe used.
- the fault-enhanced seismic imageincludes a large plurality of data points mapped onto a three-dimensional coordinate system where the shade of each pixel represents a data and the location of the pixel is representative of a location in the ground.
- the three-dimensional fault-enhanced seismic image 100may be divided into a series of horizontal slices, each slice corresponding to a two-dimensional representation of a surface at a specified depth or time.
- a two-dimensional slice 200 of the three-dimensional fault-enhanced seismic image 100is depicted. Again, each pixel in this image has a shade representative of a data value and the location in the image represents a physical location in the slice.
- the three-dimensional fault-enhanced seismic imagemay be sliced in any way. For example, three-dimensional fault-enhanced seismic image may be sliced into two-dimensional slices at each height in the image. Similar to in FIG. 1 , the dark curves depicted are the intersection of fault surfaces with the plane of the image.
- a fault-enhanced seismic imagemay either be provided or the system may be in electronic communication with the appropriate equipment for acquiring or creating a fault-enhanced seismic image (operation 310 ). If the provided fault-enhanced seismic image is a three-dimensional image, then the image-guided fault extraction may slice the three-dimensional image into a series of two-dimensional image slices for analysis (operation 320 ). For example, two-dimensional (2-D) image slice may be selected according to a user input designating a specific depth or depths for analysis. The selected 2-d image slice may be horizontal, as above, vertical or any other orientation.
- the userinteracts with an input form to select particular axis of the fault-enhanced images that correspond a particular image slice.
- the usermay interact with an input form via a graphical user interface displayed via a computing device to enter x, y, and z coordinates in the image.
- the usermay interact with the input form via the graphical user to enter x and y, coordinates in the image and a specified time, t.
- the present systempermits users to create and interpret on planar slices of any orientation. Users are enabled to select slices perpendicular to the predominant strike of the fault they are interpreting or a constant-time (or -depth) slice.
- systemmay start at one of the end of the three-dimensional image and iterate through each two-dimensional slice of the three-dimensional image.
- systemmay randomly or semi-randomly sample slices from the three-dimensional image in order to minimize the number of computations made.
- a first point and second point on a fault surface on the two-dimensional slicemay be selected for fault extraction (operations 330 , 340 ).
- the useruses an input device, such as a mouse, to pan across and/or zoom in and out of the two-dimensional slice image being displayed, for example, on a computer monitor, and to position a mouse pointer at a first voxel or pixel location in the image.
- the userselects (e.g., double clicks) this first location, which is marked by an X, circle, square, or other displayable element that identifies a selected point.
- the useruses the input device to pan across and/or zoom in and out of the two-dimensional slice image and selects on a second voxel or pixel location in the image, which is marked by an X, circle, square, or another displayable element.
- a selection assist lineis generated and used to select the first and second points.
- the usermay use the same technique to select points, but only selects points that are recognized as being on the generated selection assist line.
- the selection assist linecan be used to assist the user in connecting the first and second points, in a way that the interpolating curve follows the ridges in the image. If the ridges are very curved, the shortest weighted path between two points may not actually follow the ridge. The user can recognize such curvature and add the second point such that the interpolating curve does indeed follow the ridge, and then add a third point on the ridge, etc.
- the first and second pointsmay be selected according to any criteria and may be selected by a user or automatically by the system.
- first and second pointsare selected such that each of the points is on the same fault surface on the two-dimensional slice.
- a usermay identify a first point 210 and a second point 220 points on the same single fault line 230 .
- the systemmay interpolate values to create a fault curve between the first and second fault points 210 , 220 .
- This interpolated curveprovides an accurate estimation of the location of the fault surface.
- the interpolationmay be performed by determining the “shortest path” between the two points (operation 350 ). In this case, determining the shortest path involves analyzing the image to determine a path that is the easiest or least geographically costly path between the first and second fault points 210 , 220 .
- determining the shortest path between two points on a fault linemay be calculated using a shortest path algorithm.
- each data point in the imagemay be inputted into a graph-like data structure with each node in the graph corresponding to data point in the two-dimensional image that is connected to neighboring nodes by weighted edges.
- the weights of the edgesmust be determined.
- the weights of the edgesmay be determined using one or more weighting algorithms. For example, the weights may be determined by finding geometric or geodesic distance between two data points, by using the difference in orientation between the edges and the local orientations of the image, or by comparing the similarity of data point.
- the edge weighting method usedmay be determined according to a user selection, a user preference, or may be automatically determined by the system. For example, if the edge weights (e.g., geodesic distance) between two nearby points are low, both points have high fault likelihood and (optionally) if the orientation of the edge between the two points is aligned with the predominant orientation of the fault, as determined by the orientation of the image at the points. As another example, if the edge weights (e.g., geodesic distance) between two nearby points are high, both points have low fault likelihood.
- the shortest pathmay be determined. To find the shortest path between the first fault point 210 and the second fault point 220 any shortest path algorithm may be used.
- geodesic distanceis used herein to refer to a distance between two points in an image which takes into account image content.
- the geodesic distancestake into account intensity gradients of the image elements (i.e., pixels) an image.
- an edge-weight or distance between each data pointmay be calculated based on how likely to be part of a continuous fault.
- the geodesic distance between data point valuesmay correlate with a fault, while some data point difference values may be known to correlate with not being part of a fault.
- the systemmay be configured so that the shorter a distance is between two data points, the more likely the points are part of a fault.
- each data pointmay have a value ranging from zero to one and values that are closer to one are known to correlate more to faults than values that are further than one.
- a distance functionmay be:
- cis the weighted distance between neighboring sample points with fault values p and q, respectively.
- neighboring sample pointsrefer to, for example, adjacent voxels in an image.
- the systemmay start at any point and iterate through every data sample point in the two-dimensional slice along possible paths between the first and second fault points and determine the distance between every point and the points neighboring point.
- the total weighted distance between the first and second fault pointsmay be the cumulative weighted distances between all of the points in a path.
- the systemmay then iterate through all of the possible paths between the first fault point and the second fault point to identify the path that minimizes connection costs (i.e., has the lowest sum of weights)
- Any potential shortest path algorithmmay be utilized to find the shortest path between the first fault point and the second fault point.
- the systemmay be configured to determine a path length for every possible path between the first and second fault points and then return the shortest path.
- the systemmay be configured to skip paths that are unlikely to yield the shortest path.
- the weighted distances between data pointsmay depend on the difference in orientation between the local orientation of the two-dimensional image and a direction vector connecting two adjacent sample data points (e.g., see direction vector 430 in FIG. 4B ).
- the weighted distance between two adjacent pixelsmay depend on both the pixel values and their orientation relative to the local image orientation.
- the local orientation of the imagemay be computed from the gradient structure tensor, while the direction vector may be a vector that connects adjacent pixels.
- the weighted distance between two adjacent pixelsmay depend on both the pixel values and their orientation relative to the local image slice orientation.
- the differencemay be calculated such that the more aligned the two orientations are, the lower the connection cost is between two samples, while the less aligned the two orientations are, the higher the connection cost between the samples.
- any relevant shortest path algorithmmay be used to find the shortest distance between the first and second fault points.
- the distances between data pointsmay depend on the difference in value between neighboring samples. In this example, the more similar the two samples, the lower the connection cost between the two samples.
- the values at each data pointmay be subtracted and the distance between the points may be set to the absolute value of the difference. Again, once the distances between data points are known, any relevant shortest path algorithm may be used to find the shortest distance between the first and second fault points.
- FIGS. 4A-Can example simplified collection of sample points is depicted in order to show the described distance algorithms.
- this two-dimensional sliceonly has twelve data points each with a value ranging from zero to one and are connected to data points that are to the left, right, above, and below the data point.
- FIGS. 4A-Care being used to demonstrate the various weighting methods described above and that, in practice, the two-dimensional images being analyzed usually contain significantly more data points.
- FIG. 4Adepicts a graph with node distances determined using the geodesic distance between each pair of connected data points using Equation 1 (above). The distance between each node has been calculated and then the overall shortest path has been determined based on the total distance between points 410 and 420 . In this case, the shortest path travels through four data points and has a total distance of one.
- the systemis responsive to image orientation to bias connection costs between sample points. For example, sample points in image slices for some regions may be difficult to discern visual differences due to, for example, noise in the image. As a result, without biasing, the system would likely determine the shortest path between two selected points to correspond to a straight line. However, the present system enables a user to leverage larger scale patterns observed in the image to determine a local average orientation of the image.
- the local orientation of the imagemay be computed from the gradient structure tensor.
- the systemenables a user to input a bias factor to add or multiply to calculated edge weights between neighboring sample points in the image slice to determine a more accurate fault path between selected fault points.
- the edge weightis determined as function of pixel values and bias data supplied by the local image orientation.
- the weighted distance between two adjacent pixelsmay depend on both the pixel values and their orientation relative to the local image orientation.
- the systemmay calculate the connection cost between each sample by taking the difference between each pair of samples. That is, the path is not determined based on total overall distance, but rather the distance between each of the adjacent sample points determines the path In this case, the shortest distance also follows the same path as in FIG. 4A .
- connection costsmay be aggregate value of the connection costs determined by the chosen two or more of the above algorithms.
- the connection costs between samplesmay include the total connection costs using each of the above algorithms.
- FIG. 5an example of a two-dimensional slice of a three-dimensional fault-enhanced seismic image is depicted.
- a first fault point 510 and a second fault point 520were selected and the resulting least cost path 530 between the points was interpolated.
- the least cost path 530provides a close approximation of the dark fault line depicted.
- a fault-enhanced seismic imagemay be created or loaded (operation 600 ).
- the fault-enhanced seismic imagemay be created using any method creating a fault-enhanced seismic image, and the system may be in electronic communication with any equipment required for creating the fault-enhanced seismic image so that it may send commands to the equipment and receive any data from the equipment.
- a two-dimensional slice of imagemay be selected by a user or automated process (operation 610 ).
- a first fault point and a second fault point on a fault surfacemay then be selected (operations 620 )
- a least cost pathmay then be interpolated between the first and second fault points by first using one or more of the above described weighting algorithms to determine distances between data points and then applying a shortest path algorithm to interpolate the fault (operation 630 ).
- one or more additional fault pointsmay be available for performing further analysis. For example, a user or automated process may select one or more additional fault points on the same fault surface as the first and second fault points. In some cases, the system may prompt the user that more fault points are required. For example, if there are multiple shortest paths available, the system may prompt the user to select another fault point so that the correct path can be interpolated.
- additional fault pointsmay be selected to allow for the extension of the interpolated least cost path or additional fault points may be added between the first and second fault points in order to modify the least cost path.
- the systemis configured to allow for the modification of the least cost path according to one or more additional fault points (operation 640 ).
- the systemmay first check to see if any additional fault points have been provided (operation 642 ). After interpolating a path, the system may display the interpolated path overlaid on the two-dimensional image slice and prompt the user about whether they would like to add any additional fault points. If another fault point has been selected or is otherwise available, a user may select whether the additional fault point will be used to extend the interpolated path or to modify the interpolated path.
- the systemmay automatically analyze the location of additional fault point and evaluate whether the interpolated path should be extended or modified according to the location of the third fault point relative to the first fault point, the second fault point, and/or the interpolated path.
- the interpolated pathmay be extended from the first fault point to the additional fault point or from the second fault point to the additional fault point (operation 644 ). If the additional fault point is added for modifying the interpolated path, the path is modified such that it includes the shortest interpolated path between the first fault point and the additional fault point and the shortest interpolated path between the additional fault point and the second fault point (operation 646 ). Again, the modification may utilize one or more of the weighting methods described above in conjunction with a conventional shortest path algorithm. After either an extended path or a modified path has been interpolated additional fault points may be entered or selected and the process may be repeated until a satisfactory interpolated path has been determined.
- the systemmay create a similar path (e.g., see FIG. 7 ) using segments of smooth interpolating curves between some pairs of fault points (operation 650 ).
- the systemcreates a refined interpolated smooth surface curve by fitting a smooth surface (or curve in 2-D) to the fault points and previously interpolated or surface curves.
- the systemautomatically slices the image volume in directions that are approximately perpendicular to the interpolated smooth surface curve. For each slice, the system further interpolates between the intersections of the previously interpolated curves with that slice, using the image to guide the interpolation according to a shortest path algorithm. A user can repeatedly initiate this interpolation process until satisfied with the quality of the surface or until the surface has been sampled to the same resolution as the image.
- the systemcan be configured to compute the weighted path length along the smooth surface, between the intersections of previously interpolated curves, and choose to automatically interpolate between the intersections only if the weighted distance along the sampled curve exceeds some threshold.
- the systemcan selectively improve the quality of the extracted surface by working only on slices that have the worst correspondence between the smooth surface and the fault-enhanced image.
- This processmay then be repeated for each two-dimensional slice in the three-dimensional image (operation 660 ).
- the systemmay construct and display an interpolating fault surface that is constrained by the interpolating fault paths (operation 670 ). These interpolating fault surfaces may then be modified by adding additional fault points and interpolating additional fault paths or by deleting or modifying previously interpolated paths (operation 680 ).
- FIG. 8depicts an exemplary image-guided fault extraction system (IGFES) 800 in accordance with aspects of the invention.
- the IGFES 800includes a computing device 802 or other computing device or system that includes an image-guided fault extraction application (IGFEA) 804 .
- the IGFES 800also includes a data source 806 that stores three-dimensional fault-enhanced seismic images.
- the data sourceis illustrated as being located on the computing device 802 , it is contemplated that the data source 806 may be a database that is located on another computing device or computing system that is connected to the computing device 802 .
- the computing device 802can be a laptop computer, a personal digital assistant, a tablet computer, standard personal computer, or another processing device.
- the computing device 802includes a display 808 , such as a computer monitor, for displaying data and/or graphical user interfaces.
- the computing device 802may also include an input device 810 , such as a keyboard or a pointing device (e.g., a mouse, trackball, pen, or touch screen) to interact with various data entry forms to submit image slice selection data and/or surface fault point input data.
- a keyboard or a pointing devicee.g., a mouse, trackball, pen, or touch screen
- a displayed fault-enhanced seismic imageis itself an entry form that is responsive to user input.
- the user of the computing device 802can interact with fault-enhanced seismic image to submit image slice selection data by using the mouse to select a particular region of the fault-enhanced seismic image. It is also contemplated that the user may submit image slice selection data by interacting with one or more displayed fields (not shown) to enter coordinates corresponding to a particular image slice. After entering the submit image slice selection data, an image slice selection request is generated and provided to the IGFEA 804 for processing.
- a displayed image sliceis itself another entry form that is responsive to user input.
- the user of the computing device 802can interact with the displayed image slice to submit surface fault point input data by using the mouse to select at least two particular points on the image slice. It is also contemplated that the user may submit surface fault point input data by interacting with one or more displayed fields (not shown) to enter coordinates corresponding to each of the at least two particular points.
- a fault path identification requestis generated and provided to the IGFEA 804 for processing.
- the IGFES 800is depicted as being implemented on a single computing device, it is contemplated that in other aspects the IGFEA 804 may be executed by a server computing device (not shown) that receives the image slice selection request, the fault path identification request, and/or other input data from a remote client computer (not shown) via a communication network, such as the Internet.
- the computing device 802includes a processing system 812 that includes one or more processors or other processing devices.
- the computing device 802also includes a computer readable medium (“CRM”) 814 configured with the IGFEA 804 .
- the IGFEA 804includes instructions or modules that are executable by the processing system 812 to perform interpretation on faults from fault-enhanced seismic images.
- the CRM 814may include volatile media, nonvolatile media, removable media, non-removable media, and/or another available medium that can be accessed by the computing device 200 .
- the CRM 814comprises computer storage media and communication media.
- Computer storage mediaincludes nontransient memory, volatile media, nonvolatile media, removable media, and/or non-removable media implemented in a method or technology for storage of information, such as computer readable instructions, data structures, program modules, or other data.
- Communication mediamay embody computer readable instructions, data structures, program modules, or other data and include an information delivery media or system.
- a GUI module 816displays a fault-enhanced seismic image received from, for example, the data source 806 in response to a fault-enhanced seismic image retrieval request.
- the fault-enhanced seismic image retrieval requestis generated, for example, by a user of the computing device 802 interacting with an image retrieval request from (not shown).
- the fault-enhanced seismic imagecan be displayed as described in connection with operations 310 and 320 of FIG. 3 .
- the fault-enhanced seismic imagecan be segmented or divided into image slices.
- the GUI modules 816displays a particular image slice, such as described above in connection with operation 320 of FIG. 3 , in response to an image slice selection request.
- a fault path generation module 818generates a curve that corresponds to the “shortest path” between at least two points selected in the particular image slice in response to a fault path identification request.
- the at least two pointscorresponds to the user selecting at least a first pixel location a second pixel location in the image slice, such as described above in connection with operations 330 and 340 .
- the fault path generation module 818determines the shortest path by performing interpolation, such as described in connection with operation 350 of FIG. 3 , to identify the path that is the easiest or least geographically costly path between first and second fault points.
- the fault path generation moduledetermines the shortest path between two points by using shortest path algorithms, such as described above in reference to FIG. 2 .
- a modified fault path generation module 820modifies a previously determined the least cost path or shortest path in response to the entry of one or more additional fault points. For example, the modified fault path generation module modifies the previously determined the least cost path or shortest path as described above in connection with operations 640 - 650 of FIG. 6 .
- the fault path generation module 818further performs the following processing steps during an automatic interpolation between the previously interpolated fault curves: (1) identify a first image slice and create a first fault curve on that first image slice using the process described above in connection with FIG. 2 and FIG. 3 ; (2) identify a second image slice that is roughly parallel to the first image slice and create a second fault curve on that second image slice that corresponds to the same fault traced in (1); (3) automatically process a sequence of image slices that are roughly perpendicular to the first and second image slices, such that each of those image slices intersects the first fault curve and second fault curve created in steps (1) and (2), respectively.
- the fault path generation module 818For each particular slice of the sequence of image slices, the fault path generation module 818 further identifies the intersection of the first fault curve with that particular slice that acts as a first fault point and identifies the intersection of the second fault curve with that particular slice that acts as a second fault point. The fault path generation module 818 then connects these two fault points for that particular slice using the least cost path method described above in connection with FIG. 2 and FIG. 3 .
- the fault path generation module 818selects which perpendicular planes to process by computing the cost of the path along the smoothly interpolated surface between the first and second fault curves on each perpendicular plane and will only automatically process the sequence of image slices roughly perpendicular to the first and second image slices as described above when the cost along the smooth path exceeds a threshold value.
- the described disclosuremay be provided as a computer program product, or software, that may include a machine-readable medium having stored thereon instructions, which may be used to program a computer system (or other electronic devices) to perform a process according to the present disclosure.
- a machine-readable mediumincludes any mechanism for storing information in a form (e.g., software, processing application) readable by a machine (e.g., a computer).
- the machine-readable mediummay include, but is not limited to, magnetic storage medium (e.g., floppy diskette), optical storage medium (e.g., CD-ROM); magneto-optical storage medium; read only memory (ROM); random access memory (RAM); erasable programmable memory (e.g., EPROM and EEPROM); flash memory; or other types of medium suitable for storing electronic instructions.
- magnetic storage mediume.g., floppy diskette
- optical storage mediume.g., CD-ROM
- magneto-optical storage mediume.g., magneto-optical storage medium
- ROMread only memory
- RAMrandom access memory
- EPROM and EEPROMerasable programmable memory
- flash memoryor other types of medium suitable for storing electronic instructions.
Landscapes
- Engineering & Computer Science (AREA)
- Remote Sensing (AREA)
- Physics & Mathematics (AREA)
- Life Sciences & Earth Sciences (AREA)
- Acoustics & Sound (AREA)
- Environmental & Geological Engineering (AREA)
- Geology (AREA)
- General Life Sciences & Earth Sciences (AREA)
- General Physics & Mathematics (AREA)
- Geophysics (AREA)
- Apparatus For Radiation Diagnosis (AREA)
- Image Processing (AREA)
Abstract
Description
Claims (16)
Priority Applications (1)
| Application Number | Priority Date | Filing Date | Title |
|---|---|---|---|
| US13/781,277US9618639B2 (en) | 2012-03-01 | 2013-02-28 | Method and system for image-guided fault extraction from a fault-enhanced seismic image |
Applications Claiming Priority (2)
| Application Number | Priority Date | Filing Date | Title |
|---|---|---|---|
| US201261605288P | 2012-03-01 | 2012-03-01 | |
| US13/781,277US9618639B2 (en) | 2012-03-01 | 2013-02-28 | Method and system for image-guided fault extraction from a fault-enhanced seismic image |
Publications (2)
| Publication Number | Publication Date |
|---|---|
| US20130229891A1 US20130229891A1 (en) | 2013-09-05 |
| US9618639B2true US9618639B2 (en) | 2017-04-11 |
Family
ID=49042774
Family Applications (1)
| Application Number | Title | Priority Date | Filing Date |
|---|---|---|---|
| US13/781,277Active2035-04-23US9618639B2 (en) | 2012-03-01 | 2013-02-28 | Method and system for image-guided fault extraction from a fault-enhanced seismic image |
Country Status (1)
| Country | Link |
|---|---|
| US (1) | US9618639B2 (en) |
Cited By (11)
| Publication number | Priority date | Publication date | Assignee | Title |
|---|---|---|---|---|
| US9911210B1 (en) | 2014-12-03 | 2018-03-06 | Drilling Info, Inc. | Raster log digitization system and method |
| CN108374657A (en)* | 2018-02-02 | 2018-08-07 | 东北石油大学 | Well breakpoint automatic identifying method |
| US10459098B2 (en) | 2013-04-17 | 2019-10-29 | Drilling Info, Inc. | System and method for automatically correlating geologic tops |
| US10577895B2 (en) | 2012-11-20 | 2020-03-03 | Drilling Info, Inc. | Energy deposit discovery system and method |
| US10853893B2 (en) | 2013-04-17 | 2020-12-01 | Drilling Info, Inc. | System and method for automatically correlating geologic tops |
| US10908316B2 (en) | 2015-10-15 | 2021-02-02 | Drilling Info, Inc. | Raster log digitization system and method |
| US11119235B2 (en) | 2017-08-25 | 2021-09-14 | Exxonmobil Upstream Research Company | Automated seismic interpretation using fully convolutional neural networks |
| US11320551B2 (en) | 2018-12-11 | 2022-05-03 | Exxonmobil Upstream Research Company | Training machine learning systems for seismic interpretation |
| US11693139B2 (en) | 2018-12-11 | 2023-07-04 | ExxonMobil Technology and Engineering Company | Automated seismic interpretation-guided inversion |
| US20230358910A1 (en)* | 2022-05-06 | 2023-11-09 | Landmark Graphics Corporation | Automated fault segment generation |
| US11965997B2 (en) | 2021-10-19 | 2024-04-23 | Landmark Graphics Corporation | Determining fault surfaces from fault attribute volumes |
Families Citing this family (18)
| Publication number | Priority date | Publication date | Assignee | Title |
|---|---|---|---|---|
| US9618639B2 (en) | 2012-03-01 | 2017-04-11 | Drilling Info, Inc. | Method and system for image-guided fault extraction from a fault-enhanced seismic image |
| GB2503507B (en)* | 2012-06-29 | 2015-04-15 | Foster Findlay Ass Ltd | Adaptive fault tracking |
| US9804282B2 (en)* | 2014-02-17 | 2017-10-31 | General Electric Company | Computer-assisted fault interpretation of seismic data |
| WO2017171783A1 (en)* | 2016-03-31 | 2017-10-05 | Landmark Graphics Corporation | Subterranean formation fault prediction system |
| US11480438B2 (en)* | 2016-10-07 | 2022-10-25 | Google Llc | Identifying and displaying smooth and demarked paths |
| CN107368839B (en)* | 2017-06-22 | 2020-05-12 | 南京师范大学 | An automatic extraction method of fault plane based on DEM |
| CN109425898B (en)* | 2017-08-21 | 2020-07-03 | 中国石油化工股份有限公司 | Method for identifying fault by utilizing longitudinal and transverse evolution of slice and section |
| CN108254784B (en)* | 2017-12-11 | 2020-09-08 | 中国石油天然气股份有限公司 | Fault identification method, device and system based on two-dimensional seismic data |
| CN110749924B (en)* | 2018-07-24 | 2021-12-24 | 中国石油化工股份有限公司 | Fracture zone identification method |
| CN111580156B (en)* | 2019-02-18 | 2022-12-02 | 中国石油天然气股份有限公司 | Automatic picking method and system for seismic zero-value slices |
| US11175423B2 (en)* | 2019-08-22 | 2021-11-16 | Schlumberger Technology Corporation | Real time deformation of seismic slices using programmable shaders |
| CN114252913A (en)* | 2020-09-25 | 2022-03-29 | 中国石油天然气股份有限公司 | Method and device for identifying plane fault information |
| CN114252914B (en)* | 2020-09-25 | 2025-02-07 | 中国石油天然气股份有限公司 | A method and device for determining the distribution of a fracture system |
| CN112363209B (en)* | 2020-11-09 | 2023-07-25 | 高军 | Fault three-dimensional digital detection method |
| CN115373021B (en)* | 2022-08-25 | 2025-04-11 | 电子科技大学 | A method for tracking seismic horizons based on a global perspective |
| CN117310818A (en)* | 2023-10-23 | 2023-12-29 | 北京派特杰奥科技有限公司 | Post-stack seismic data processing method and device based on image-guided three-dimensional filtering |
| CN118519192B (en)* | 2024-05-14 | 2025-05-02 | 中国地质大学(武汉) | A 3D fault identification method based on fusion of seismic data gradient attributes and semantic enhancement |
| CN119444911B (en)* | 2025-01-10 | 2025-04-08 | 北京大学 | Two-photon microscope and related microscopic imaging method |
Citations (28)
| Publication number | Priority date | Publication date | Assignee | Title |
|---|---|---|---|---|
| US4633400A (en) | 1984-12-21 | 1986-12-30 | Conoco Inc. | Method for waveform feature extraction from seismic signals |
| US5056066A (en) | 1990-06-25 | 1991-10-08 | Landmark Graphics Corporation | Method for attribute tracking in seismic data |
| US5835882A (en) | 1997-01-31 | 1998-11-10 | Phillips Petroleum Company | Method for determining barriers to reservoir flow |
| US5987388A (en) | 1997-12-26 | 1999-11-16 | Atlantic Richfield Company | Automated extraction of fault surfaces from 3-D seismic prospecting data |
| US6223126B1 (en) | 1999-10-20 | 2001-04-24 | Phillips Petroleum Company | Multi-attribute seismic waveform classification |
| US20040015296A1 (en) | 2000-07-17 | 2004-01-22 | Emmanuel Causse | Seismic processing with general non-hyperbolic travel-time corrections |
| US20040220790A1 (en) | 2003-04-30 | 2004-11-04 | Cullick Alvin Stanley | Method and system for scenario and case decision management |
| US20040260476A1 (en) | 2003-04-10 | 2004-12-23 | Schlumberger Technology Corporation | Extrema classification |
| US20060052937A1 (en) | 2004-09-07 | 2006-03-09 | Landmark Graphics Corporation | Method, systems, and computer readable media for optimizing the correlation of well log data using dynamic programming |
| US7054753B1 (en) | 2003-11-14 | 2006-05-30 | Williams Ralph A | Method of locating oil and gas exploration prospects by data visualization and organization |
| US7069149B2 (en)* | 2001-12-14 | 2006-06-27 | Chevron U.S.A. Inc. | Process for interpreting faults from a fault-enhanced 3-dimensional seismic attribute volume |
| US20090043507A1 (en) | 2007-08-01 | 2009-02-12 | Austin Geomodeling, Inc. | Method and system for dynamic, three-dimensional geological interpretation and modeling |
| US7525349B2 (en) | 2006-08-14 | 2009-04-28 | University Of Washington | Circuit for classifying signals |
| US20090125288A1 (en) | 2005-11-26 | 2009-05-14 | The University Court Of The University Of Edinburgh | Hydrocarbon Recovery From a Hydrocarbon Reservoir |
| US20100125349A1 (en) | 2008-11-17 | 2010-05-20 | Landmark Graphics Corporation, A Halliburton Company | Systems and Methods for Dynamically Developing Wellbore Plans With a Reservoir Simulator |
| US20100214870A1 (en) | 2009-02-23 | 2010-08-26 | Randolph Pepper | Method and apparatus for dynamic extraction of extrema-based geometric primitives in 3d voxel volumes |
| US20110002194A1 (en) | 2008-05-22 | 2011-01-06 | Matthias Imhof | Method For Geophysical and Geological Interpretation of Seismic Volumes In The Domains of Depth, Time, and Age |
| US20110011595A1 (en) | 2008-05-13 | 2011-01-20 | Hao Huang | Modeling of Hydrocarbon Reservoirs Using Design of Experiments Methods |
| US20110042098A1 (en) | 2008-05-09 | 2011-02-24 | Matthias Georg Imhof | Method For Geophysical And Stratigraphic Interpretation Using Waveform Anomalies |
| US20110115787A1 (en) | 2008-04-11 | 2011-05-19 | Terraspark Geosciences, Llc | Visulation of geologic features using data representations thereof |
| US20110213577A1 (en) | 2008-03-25 | 2011-09-01 | Abb Research Ltd. | Method and apparatus for analyzing waveform signals of a power system |
| US20110313743A1 (en) | 2010-06-16 | 2011-12-22 | Foroil | Method of Improving the Production of a Mature Gas or Oil Field |
| US8265876B1 (en) | 2008-11-08 | 2012-09-11 | Ihs Global Inc. | Seismic horizon autopicking using orientation vector field |
| US20120253770A1 (en) | 2010-02-12 | 2012-10-04 | David Stern | Method and System For Creating History Matched Simulation Models |
| US20130090855A1 (en) | 2011-08-26 | 2013-04-11 | John Rasmus | Methods for evaluating inflow and outflow in a subterraean wellbore |
| US20130229891A1 (en) | 2012-03-01 | 2013-09-05 | Transform Software & Services, Inc. | Method and system for image-guided fault extraction from a fault-enhanced seismic image |
| US20130262052A1 (en) | 2012-04-03 | 2013-10-03 | Jean-Laurent Mallet | System and method for generating an implicit model of geological horizons |
| US20140254884A1 (en) | 2013-03-11 | 2014-09-11 | Peter Adrian Spencer Elkington | Methods of and Apparatuses for Identifying Geological Characteristics in Boreholes |
- 2013
- 2013-02-28USUS13/781,277patent/US9618639B2/enactiveActive
Patent Citations (28)
| Publication number | Priority date | Publication date | Assignee | Title |
|---|---|---|---|---|
| US4633400A (en) | 1984-12-21 | 1986-12-30 | Conoco Inc. | Method for waveform feature extraction from seismic signals |
| US5056066A (en) | 1990-06-25 | 1991-10-08 | Landmark Graphics Corporation | Method for attribute tracking in seismic data |
| US5835882A (en) | 1997-01-31 | 1998-11-10 | Phillips Petroleum Company | Method for determining barriers to reservoir flow |
| US5987388A (en) | 1997-12-26 | 1999-11-16 | Atlantic Richfield Company | Automated extraction of fault surfaces from 3-D seismic prospecting data |
| US6223126B1 (en) | 1999-10-20 | 2001-04-24 | Phillips Petroleum Company | Multi-attribute seismic waveform classification |
| US20040015296A1 (en) | 2000-07-17 | 2004-01-22 | Emmanuel Causse | Seismic processing with general non-hyperbolic travel-time corrections |
| US7069149B2 (en)* | 2001-12-14 | 2006-06-27 | Chevron U.S.A. Inc. | Process for interpreting faults from a fault-enhanced 3-dimensional seismic attribute volume |
| US20040260476A1 (en) | 2003-04-10 | 2004-12-23 | Schlumberger Technology Corporation | Extrema classification |
| US20040220790A1 (en) | 2003-04-30 | 2004-11-04 | Cullick Alvin Stanley | Method and system for scenario and case decision management |
| US7054753B1 (en) | 2003-11-14 | 2006-05-30 | Williams Ralph A | Method of locating oil and gas exploration prospects by data visualization and organization |
| US20060052937A1 (en) | 2004-09-07 | 2006-03-09 | Landmark Graphics Corporation | Method, systems, and computer readable media for optimizing the correlation of well log data using dynamic programming |
| US20090125288A1 (en) | 2005-11-26 | 2009-05-14 | The University Court Of The University Of Edinburgh | Hydrocarbon Recovery From a Hydrocarbon Reservoir |
| US7525349B2 (en) | 2006-08-14 | 2009-04-28 | University Of Washington | Circuit for classifying signals |
| US20090043507A1 (en) | 2007-08-01 | 2009-02-12 | Austin Geomodeling, Inc. | Method and system for dynamic, three-dimensional geological interpretation and modeling |
| US20110213577A1 (en) | 2008-03-25 | 2011-09-01 | Abb Research Ltd. | Method and apparatus for analyzing waveform signals of a power system |
| US20110115787A1 (en) | 2008-04-11 | 2011-05-19 | Terraspark Geosciences, Llc | Visulation of geologic features using data representations thereof |
| US20110042098A1 (en) | 2008-05-09 | 2011-02-24 | Matthias Georg Imhof | Method For Geophysical And Stratigraphic Interpretation Using Waveform Anomalies |
| US20110011595A1 (en) | 2008-05-13 | 2011-01-20 | Hao Huang | Modeling of Hydrocarbon Reservoirs Using Design of Experiments Methods |
| US20110002194A1 (en) | 2008-05-22 | 2011-01-06 | Matthias Imhof | Method For Geophysical and Geological Interpretation of Seismic Volumes In The Domains of Depth, Time, and Age |
| US8265876B1 (en) | 2008-11-08 | 2012-09-11 | Ihs Global Inc. | Seismic horizon autopicking using orientation vector field |
| US20100125349A1 (en) | 2008-11-17 | 2010-05-20 | Landmark Graphics Corporation, A Halliburton Company | Systems and Methods for Dynamically Developing Wellbore Plans With a Reservoir Simulator |
| US20100214870A1 (en) | 2009-02-23 | 2010-08-26 | Randolph Pepper | Method and apparatus for dynamic extraction of extrema-based geometric primitives in 3d voxel volumes |
| US20120253770A1 (en) | 2010-02-12 | 2012-10-04 | David Stern | Method and System For Creating History Matched Simulation Models |
| US20110313743A1 (en) | 2010-06-16 | 2011-12-22 | Foroil | Method of Improving the Production of a Mature Gas or Oil Field |
| US20130090855A1 (en) | 2011-08-26 | 2013-04-11 | John Rasmus | Methods for evaluating inflow and outflow in a subterraean wellbore |
| US20130229891A1 (en) | 2012-03-01 | 2013-09-05 | Transform Software & Services, Inc. | Method and system for image-guided fault extraction from a fault-enhanced seismic image |
| US20130262052A1 (en) | 2012-04-03 | 2013-10-03 | Jean-Laurent Mallet | System and method for generating an implicit model of geological horizons |
| US20140254884A1 (en) | 2013-03-11 | 2014-09-11 | Peter Adrian Spencer Elkington | Methods of and Apparatuses for Identifying Geological Characteristics in Boreholes |
Non-Patent Citations (33)
| Title |
|---|
| Admasu, Fitsum et al.; "Automatic method for correlating horizones across faults in 3d seismic data;" Computer Vision and Pattern Recognition, 2004, CVPR 2004, Proceedings of the 2004 IEEE Computer Society Conference, vol. 1, 6 pages.* |
| Andersen, et al.; "Seismic Waveform Classification: Techniques and Benefits," Dated Mar. 2004; pp. 26-29; (4 pgs.). |
| Aurnhammer et al. "A Genetic Algorithm for Automated Horizon Correlation Across Faults in Seismic Images", IEEE Transactions on Evolutionary Computation, vol. 9. No. 2. Apr. 2005.* |
| Brown et al., Seismic Event Tracking by Global Path Optimization, 76th Annual International Meeting, SEG, Expanded Abstracts, 1063-1067, 2006 (4 pgs). |
| Can, Buynamin. Probabilistic performance forecasting for unconventional reservoirs with stretched-exponential model. Diss. Texas A&M University, 2001; (74 pgs.). |
| Castro de Matos, et al. "Unsupervised Seismic Facies Analysis Using Wavelet Transform and Self-Organizing Maps" dated Dec. 13, 2006; vol. 72, No. 1, pp. P9-P21, 19 Figs.; (13 pgs.). |
| Coleou, et al.; "Unsupervised Seismic Facies Classification: A Review and Comparison of Techniques and Implementation" dated Oct. 2003; pp. 942-953; (7 pgs.). |
| Diersen et al.; "Classification of Seismic Windows Using Artificial Neural Networks" dated 2011; pp. 1-10; (10 pgs.). |
| E. W. Dijkstra; "A Note on Two Problems in Connexion with Graphs" dated Jun. 11, 1959; pp. 269-271; (3 pgs.). |
| Hintze, J.L. (2007), NCSS Data Analysis User's Guide III, Regression and Curve Fitting. NCSS 2007. Retrieved from http://ness.wpengine.netdna-cdn.com/wp-content/uploads/2012/09/NCSSUG3.pdf, pp. 1-653; (653 pgs.). |
| Hollt, et al.; "Interactive Seismic Interpretation with Piecewise Global Energy Minimization" dated Mar. 1, 2011; pp. 5966; (8 pgs.). |
| Jeong, et al.; "A Fast Iterative Method for Eikonal Equations" dated Jul. 23, 2008; vol. 30, No. 5, pp. 2512-2534; (23 pgs.). |
| Kass et al., Snakes: Active Contour Models, International Journal of Computer Vision, 321-331, 1988 (11 pgs). |
| Mortensen et al., Interactive Segmentation with Intelligent Scissors, Graphical Models and Image Processing, 60(5):349-384 (1998) (48 pgs). |
| Ouenes, Ahmed, et al. "Practical use of neural networks in tight gas fractured reservoirs: application to the San Juan Basin." Paper SPE 39968 (1998); (8 pgs.). |
| Pages from Website: http://www.neuralog.com/pades/NeuraLog.html, printed Dec. 3, 2015 (2 pgs). |
| PCT International Preliminary Report on Patentability of PCT/US13/34546; dated Oct. 7, 2014; (12 pgs.). |
| PCT International Preliminary Report on Patentability of PCT/US13/68348; dated May 5, 2015; (5 pgs.). |
| PCT International Preliminary Report on Patentability of PCT/US13/70838; dated May 26, 2015; (6 pgs.). |
| PCT International Search Report of PCT/US13/68348; dated Apr. 29, 2014; (3 pgs.). |
| PCT International Search Report of PCT/US13/68349; dated Jan. 30, 2014; (3 pgs.). |
| PCT International Search Report of PCT/US13/70838; dated Apr. 9, 2014; (3 pgs.). |
| PCT International Search Report of PCT/US14/34546; dated Sep. 22, 2014; (3 pgs.). |
| PCT Written Opinion of the International Searching Authority of PCT/US13/68348; dated Apr. 29, 2014; (4 pgs.). |
| PCT Written Opinion of the International Searching Authority of PCT/US13/68349; dated Jan. 30, 2014; (5 pgs.). |
| PCT Written Opinion of the International Searching Authority of PCT/US13/70838; dated Apr. 9, 2014; (5 pgs.). |
| PCT Written Opinion of the International Searching Authority of PCT/US14/34546; dated Sep. 22, 2014; (8 pgs.). |
| Roy, et al.; "Automatic Seismic Facies Classification with Kohonen Self Organizing Maps-a Tutorial" dated Dec. 2010; pp. 6-14; (9 pgs.). |
| Roy, et al.; "Automatic Seismic Facies Classification with Kohonen Self Organizing Maps—a Tutorial" dated Dec. 2010; pp. 6-14; (9 pgs.). |
| Vander Valk, P.A., and P. Yang. "Investigation of key parameters in SAGD wellbore design and operation." Journal of Canadian Petroleum Technology 46.6 Jun. 2007: 49-56; (8 pgs.). |
| W. Welch, A. Witkin, Free Form Shape Design Using Triangulated Surfaces, Computer Graphics, 28, Proc. SIGGRAPH '94, 1994 (preprint) (10 pgs). |
| Watson, A. Ted, et al. NMR characterizations of properties of heterogeneous media. Research Report, Final Report. US Department of Energy, DOE Award No. DE-AC26-99BC15202, Texas A&M University, Jan. 2005., pp. 1-151; (151 pgs.). |
| Wikipedia. Wikipedia, Overfitting. Revision from Aug. 23, 2012. pp. 1-3. Retrieved from http://en.wikipedia.org/w/index.php?title=Overfitting&oldid=508784472; (3 pgs.). |
Cited By (17)
| Publication number | Priority date | Publication date | Assignee | Title |
|---|---|---|---|---|
| US10577895B2 (en) | 2012-11-20 | 2020-03-03 | Drilling Info, Inc. | Energy deposit discovery system and method |
| US11268353B2 (en) | 2012-11-20 | 2022-03-08 | Enverus, Inc. | Energy deposit discovery system and method |
| US11704748B2 (en) | 2013-04-17 | 2023-07-18 | Enverus, Inc. | System and method for automatically correlating geologic tops |
| US10459098B2 (en) | 2013-04-17 | 2019-10-29 | Drilling Info, Inc. | System and method for automatically correlating geologic tops |
| US10853893B2 (en) | 2013-04-17 | 2020-12-01 | Drilling Info, Inc. | System and method for automatically correlating geologic tops |
| US10776967B2 (en) | 2014-12-03 | 2020-09-15 | Drilling Info, Inc. | Raster log digitization system and method |
| US9911210B1 (en) | 2014-12-03 | 2018-03-06 | Drilling Info, Inc. | Raster log digitization system and method |
| US11340380B2 (en) | 2015-10-15 | 2022-05-24 | Enverus, Inc. | Raster log digitization system and method |
| US10908316B2 (en) | 2015-10-15 | 2021-02-02 | Drilling Info, Inc. | Raster log digitization system and method |
| US11119235B2 (en) | 2017-08-25 | 2021-09-14 | Exxonmobil Upstream Research Company | Automated seismic interpretation using fully convolutional neural networks |
| CN108374657B (en)* | 2018-02-02 | 2021-10-19 | 东北石油大学 | Automatic identification method of well breakpoint |
| CN108374657A (en)* | 2018-02-02 | 2018-08-07 | 东北石油大学 | Well breakpoint automatic identifying method |
| US11320551B2 (en) | 2018-12-11 | 2022-05-03 | Exxonmobil Upstream Research Company | Training machine learning systems for seismic interpretation |
| US11693139B2 (en) | 2018-12-11 | 2023-07-04 | ExxonMobil Technology and Engineering Company | Automated seismic interpretation-guided inversion |
| US11965997B2 (en) | 2021-10-19 | 2024-04-23 | Landmark Graphics Corporation | Determining fault surfaces from fault attribute volumes |
| US20230358910A1 (en)* | 2022-05-06 | 2023-11-09 | Landmark Graphics Corporation | Automated fault segment generation |
| US12287442B2 (en)* | 2022-05-06 | 2025-04-29 | Landmark Graphics Corporation | Automated fault segment generation |
Also Published As
| Publication number | Publication date |
|---|---|
| US20130229891A1 (en) | 2013-09-05 |
Similar Documents
| Publication | Publication Date | Title |
|---|---|---|
| US9618639B2 (en) | Method and system for image-guided fault extraction from a fault-enhanced seismic image | |
| US11704748B2 (en) | System and method for automatically correlating geologic tops | |
| US9804282B2 (en) | Computer-assisted fault interpretation of seismic data | |
| Thore et al. | Structural uncertainties: Determination, management, and applications | |
| Wellmann et al. | Towards incorporating uncertainty of structural data in 3D geological inversion | |
| CA2713019C (en) | Gridless geological modeling | |
| Caumon et al. | Three-dimensional implicit stratigraphic model building from remote sensing data on tetrahedral meshes: theory and application to a regional model of La Popa Basin, NE Mexico | |
| EP2987003B1 (en) | System and method for automatically correlating geologic tops | |
| US9134443B2 (en) | Segment identification and classification using horizon structure | |
| EP2350901B1 (en) | Tracking geologic object and detecting geologic anomalies in exploration seismic data volume | |
| US9239398B2 (en) | Method of generating and combining multiple horizons to determine a seismic horizon and its uncertainty | |
| GB2474740A (en) | Gridless geological modeling of a structural framework | |
| US20140163943A1 (en) | System for modeling geologic structures | |
| Smith et al. | Machine-learning assisted interpretation: Integrated fault prediction and extraction case study from the Groningen gas field, Netherlands | |
| CN120105052A (en) | A copper mine prediction method based on multi-source data | |
| WO2022245869A1 (en) | Utilization of geologic orientation data | |
| CN110244359A (en) | A Calculation Method for Edge Detection of Abnormal Body Based on Improved Seismic Slicing Technology | |
| Marchesini et al. | Assessing the influence of morpho-structural setting on landslide abundance | |
| Liang et al. | A workflow for interpretation of fracture characteristics based on digital outcrop models: a case study on ebian XianFeng profile in Sichuan Basin | |
| Perrier et al. | Enhanced AI-Driven Automatic Dip Picking in Horizontal Wells Through Deep Learning, Clustering, and Interpolation, in Real Time | |
| Ndam Njikam et al. | 3D structural modeling approach by discretization of a basic structural map associated with magnetic data | |
| US20240111067A1 (en) | Faulted seismic horizon mapping | |
| Penasa et al. | Vombat: an open source tool for creating stratigraphic logs from virtual outcrops | |
| Höllt | Visual workflows for oil and gas exploration | |
| Monnet et al. | ISOPAQ, a MATLAB program for stratigraphic and isopach mapping: example application to the French Bajocian (Jurassic) sediments |
Legal Events
| Date | Code | Title | Description |
|---|---|---|---|
| AS | Assignment | Owner name:TRANSFORM SOFTWARE & SERVICES, INC., COLORADO Free format text:ASSIGNMENT OF ASSIGNORS INTEREST;ASSIGNORS:WITTE, DEAN CLIFFORD;GRANT, CHRISTIAN WINFIELD;EMANUEL, MARK JEFFREY;AND OTHERS;REEL/FRAME:030177/0072 Effective date:20130402 | |
| AS | Assignment | Owner name:GCI CAPITAL MARKETS LLC, AS ADMINISTRATIVE AGENT, Free format text:SECURITY AGREEMENT;ASSIGNOR:TRANSFORM SOFTWARE AND SERVICES, INC.;REEL/FRAME:030660/0455 Effective date:20130619 | |
| AS | Assignment | Owner name:DRILLING INFO, INC., TEXAS Free format text:ASSIGNMENT OF ASSIGNORS INTEREST;ASSIGNOR:TRANSFORM SOFTWARE & SERVICES, INC.;REEL/FRAME:033255/0103 Effective date:20140625 | |
| AS | Assignment | Owner name:GOLUB CAPITAL MARKETS LLC, AS ADMINISTRATIVE AGENT Free format text:SECURITY INTEREST;ASSIGNOR:DRILLING INFO, INC.;REEL/FRAME:040537/0831 Effective date:20161130 | |
| STCF | Information on status: patent grant | Free format text:PATENTED CASE | |
| AS | Assignment | Owner name:TRANSFORM SOFTWARE AND SERVICES, INC., COLORADO Free format text:RELEASE BY SECURED PARTY;ASSIGNOR:GOLUB CAPITAL MARKETS LLC (F/K/A GCI CAPITAL MARKETS LLC), AS ADMINISTRATIVE AGENT;REEL/FRAME:046507/0255 Effective date:20180730 Owner name:DRILLING INFO, INC., TEXAS Free format text:RELEASE BY SECURED PARTY;ASSIGNOR:GOLUB CAPITAL MARKETS LLC (F/K/A GCI CAPITAL MARKETS LLC), AS ADMINISTRATIVE AGENT;REEL/FRAME:046508/0784 Effective date:20180730 Owner name:GOLUB CAPITAL MARKETS LLC, AS AGENT, ILLINOIS Free format text:FIRST LIEN INTELLECTUAL PROPERTY SECURITY AGREEMENT;ASSIGNOR:DRILLING INFO, INC.;REEL/FRAME:046672/0947 Effective date:20180730 | |
| AS | Assignment | Owner name:DBD CREDIT FUNDING LLC, NEW YORK Free format text:SECURITY INTEREST;ASSIGNORS:GLOBALVIEW SOFTWARE, INC.;DRILLING INFO, INC.;REEL/FRAME:046527/0532 Effective date:20180730 | |
| MAFP | Maintenance fee payment | Free format text:PAYMENT OF MAINTENANCE FEE, 4TH YR, SMALL ENTITY (ORIGINAL EVENT CODE: M2551); ENTITY STATUS OF PATENT OWNER: SMALL ENTITY Year of fee payment:4 | |
| AS | Assignment | Owner name:ENVERUS, INC., TEXAS Free format text:CHANGE OF NAME;ASSIGNOR:DRILLING INFO, INC.;REEL/FRAME:057968/0816 Effective date:20210922 | |
| AS | Assignment | Owner name:DRILLING INFO, INC., TEXAS Free format text:RELEASE OF FIRST LIEN SECURITY INTEREST IN PATENTS AT R/F 046672/0947;ASSIGNOR:GOLUB CAPITAL MARKETS LLC, AS AGENT;REEL/FRAME:066122/0466 Effective date:20231222 Owner name:DRILLING INFO, INC., TEXAS Free format text:RELEASE BY SECURED PARTY;ASSIGNOR:DBD CREDIT FUNDING LLC;REEL/FRAME:065943/0580 Effective date:20231222 Owner name:GLOBALVIEW SOFTWARE, INC., TEXAS Free format text:RELEASE BY SECURED PARTY;ASSIGNOR:DBD CREDIT FUNDING LLC;REEL/FRAME:065943/0580 Effective date:20231222 Owner name:GOLUB CAPITAL MARKETS LLC, AS COLLATERAL AGENT, ILLINOIS Free format text:SECURITY INTEREST;ASSIGNOR:ENVERUS, INC.;REEL/FRAME:065943/0954 Effective date:20231222 | |
| FEPP | Fee payment procedure | Free format text:ENTITY STATUS SET TO UNDISCOUNTED (ORIGINAL EVENT CODE: BIG.); ENTITY STATUS OF PATENT OWNER: LARGE ENTITY | |
| MAFP | Maintenance fee payment | Free format text:PAYMENT OF MAINTENANCE FEE, 8TH YEAR, LARGE ENTITY (ORIGINAL EVENT CODE: M1552); ENTITY STATUS OF PATENT OWNER: LARGE ENTITY Year of fee payment:8 |