US9508082B1 - Offline location-based consumer metrics using online signals - Google Patents
Offline location-based consumer metrics using online signalsDownload PDFInfo
- Publication number
- US9508082B1 US9508082B1US13/573,783US201213573783AUS9508082B1US 9508082 B1US9508082 B1US 9508082B1US 201213573783 AUS201213573783 AUS 201213573783AUS 9508082 B1US9508082 B1US 9508082B1
- Authority
- US
- United States
- Prior art keywords
- data
- location
- consumer interaction
- brand
- online
- Prior art date
- Legal status (The legal status is an assumption and is not a legal conclusion. Google has not performed a legal analysis and makes no representation as to the accuracy of the status listed.)
- Active, expires
Links
Images


Classifications
- G—PHYSICS
- G06—COMPUTING OR CALCULATING; COUNTING
- G06Q—INFORMATION AND COMMUNICATION TECHNOLOGY [ICT] SPECIALLY ADAPTED FOR ADMINISTRATIVE, COMMERCIAL, FINANCIAL, MANAGERIAL OR SUPERVISORY PURPOSES; SYSTEMS OR METHODS SPECIALLY ADAPTED FOR ADMINISTRATIVE, COMMERCIAL, FINANCIAL, MANAGERIAL OR SUPERVISORY PURPOSES, NOT OTHERWISE PROVIDED FOR
- G06Q30/00—Commerce
- G06Q30/02—Marketing; Price estimation or determination; Fundraising
- G06Q30/0241—Advertisements
- G06Q30/0242—Determining effectiveness of advertisements
- G06Q30/0246—Traffic
- G—PHYSICS
- G06—COMPUTING OR CALCULATING; COUNTING
- G06Q—INFORMATION AND COMMUNICATION TECHNOLOGY [ICT] SPECIALLY ADAPTED FOR ADMINISTRATIVE, COMMERCIAL, FINANCIAL, MANAGERIAL OR SUPERVISORY PURPOSES; SYSTEMS OR METHODS SPECIALLY ADAPTED FOR ADMINISTRATIVE, COMMERCIAL, FINANCIAL, MANAGERIAL OR SUPERVISORY PURPOSES, NOT OTHERWISE PROVIDED FOR
- G06Q30/00—Commerce
- G06Q30/02—Marketing; Price estimation or determination; Fundraising
- G06Q30/0201—Market modelling; Market analysis; Collecting market data
- G06Q30/0204—Market segmentation
- G06Q30/0205—Market segmentation based on location or geographical consideration
- G—PHYSICS
- G06—COMPUTING OR CALCULATING; COUNTING
- G06Q—INFORMATION AND COMMUNICATION TECHNOLOGY [ICT] SPECIALLY ADAPTED FOR ADMINISTRATIVE, COMMERCIAL, FINANCIAL, MANAGERIAL OR SUPERVISORY PURPOSES; SYSTEMS OR METHODS SPECIALLY ADAPTED FOR ADMINISTRATIVE, COMMERCIAL, FINANCIAL, MANAGERIAL OR SUPERVISORY PURPOSES, NOT OTHERWISE PROVIDED FOR
- G06Q30/00—Commerce
- G06Q30/02—Marketing; Price estimation or determination; Fundraising
- G06Q30/0207—Discounts or incentives, e.g. coupons or rebates
- G06Q30/0224—Discounts or incentives, e.g. coupons or rebates based on user history
- G—PHYSICS
- G06—COMPUTING OR CALCULATING; COUNTING
- G06Q—INFORMATION AND COMMUNICATION TECHNOLOGY [ICT] SPECIALLY ADAPTED FOR ADMINISTRATIVE, COMMERCIAL, FINANCIAL, MANAGERIAL OR SUPERVISORY PURPOSES; SYSTEMS OR METHODS SPECIALLY ADAPTED FOR ADMINISTRATIVE, COMMERCIAL, FINANCIAL, MANAGERIAL OR SUPERVISORY PURPOSES, NOT OTHERWISE PROVIDED FOR
- G06Q30/00—Commerce
- G06Q30/02—Marketing; Price estimation or determination; Fundraising
- G06Q30/0241—Advertisements
- G06Q30/0251—Targeted advertisements
- G—PHYSICS
- G06—COMPUTING OR CALCULATING; COUNTING
- G06Q—INFORMATION AND COMMUNICATION TECHNOLOGY [ICT] SPECIALLY ADAPTED FOR ADMINISTRATIVE, COMMERCIAL, FINANCIAL, MANAGERIAL OR SUPERVISORY PURPOSES; SYSTEMS OR METHODS SPECIALLY ADAPTED FOR ADMINISTRATIVE, COMMERCIAL, FINANCIAL, MANAGERIAL OR SUPERVISORY PURPOSES, NOT OTHERWISE PROVIDED FOR
- G06Q30/00—Commerce
- G06Q30/02—Marketing; Price estimation or determination; Fundraising
- G06Q30/0241—Advertisements
- G06Q30/0272—Period of advertisement exposure
- G—PHYSICS
- G06—COMPUTING OR CALCULATING; COUNTING
- G06F—ELECTRIC DIGITAL DATA PROCESSING
- G06F16/00—Information retrieval; Database structures therefor; File system structures therefor
- G06F17/30—
Definitions
- Metricsare very important to the operation of a business. Businesses use metrics to plan future expansion, assess customer interest in products, receive feedback about areas for improvement, and so forth. Metrics may include sales information (e.g., for specifics products and specific locations), customer opinions, product volume, inventory, and so on. Traditional brick and mortar businesses collect metrics through their own unique processes depending on how they track sales. For example, some accounting systems provide metrics, while some businesses may dedicate whole departments to gathering and tracking metrics-related information. Online businesses, such as e-commerce websites, benefit from an inherent collection of metrics. Because their visitors and sales occur electronically, a good trail of the consumer's behavior and actions is available.
- Secret shoppersare hired by many stores with physical locations to test the customer experience at those locations.
- a secret shopperis a survey respondent paid to go to a store, shop there, and report to the company or a third party about various aspects of the shopping experience.
- Storesmay test how locations are treating customers, how locations are complying with regulations, whether particular rare conditions (e.g., a peanut allergy at a restaurant) were handled appropriately by staff, and so on.
- Secret shoppersare very useful for location-specific analysis, but they may fail to capture the experience of every customer and customer type, and the process misses the types of places (typically online) where customers of a business share opinions today.
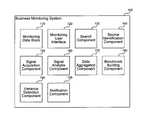
- FIG. 1is a block diagram that illustrates components of the business monitoring system, in one embodiment.
- FIG. 2is a flow diagram that illustrates processing of the business monitoring system to build metrics by tracking online occurrences and inferring offline behavior from those occurrences, in one embodiment.
- FIG. 3is a flow diagram that illustrates processing of the business monitoring system to receive a request to monitor a brand's performance at a physical location through online events, in one embodiment.
- FIG. 4is a display diagram that illustrates a metric reporting dashboard of the business monitoring system, in one embodiment.
- FIG. 5is a display diagram that illustrates four widgets for displaying business metrics, in one embodiment.
- FIG. 6is a display diagram that illustrates two more widgets for displaying business metrics, in one embodiment.
- FIG. 7is a display diagram that shows a map-based display of metrics, in one embodiment.
- a business monitoring systemis described herein that is based on a bottom up architecture, ensuring that local content explicitly tied to a brand location surfaces—regardless of a match to a pre-determined set of keywords.
- the systembrings together the previously separate worlds of social media and offline secret shopper and similar programs.
- owners of brandsare able to monitor the local voice of the customer to detect local and regional trends in sentiment and activity, build benchmarks and goals for local storefronts, evaluate in-store operations and customer service trends, and measure the local impact of marketing and advertising initiatives.
- the systemcollects and analyzes signals from online sources, producing reports, analytics, benchmarks, and alerts regarding offline activity at the local/store-front level.
- the systemnormalizes the signals from various sources (reviews, check-ins, mentions, and so on), analyzes the signals at the individual location level, aggregates the data across various dimensions, builds benchmarks for comparison, and fires triggers notifying appropriate people upon detecting a meaningful variance.
- the resulting systemproduces alerts, trends, and analyses for offline/in-store location-based activity, using online signals. Comparisons between trends and analyses produced by the system have correlated meaningfully with offline verification.
- the business monitoring systemprovides a rich and timely set of information to business decision makers.
- locationmay refer to any specific venue or physical address, perhaps within a larger address (e.g., a storefront within a mall, or a concession stand at a baseball stadium).
- a siterefers to an online website or service where people talk about offline activity (e.g., Facebook, Twitter, online forums, and so on).
- a sourcerefers to a particular page or venue within a site talking about a particular location (e.g., “The White House's Facebook Place page”).
- a consumer or source memberis a person who interacts with a source.
- a brandis a set of locations with some associated metadata.
- a signalis any content retrieved or recorded from a source, including check-ins, reviews, mentions, and the like.
- a signalalso includes the change in consumer count (e.g., added/removed a fan/follower).
- the information provided by the business monitoring systemcan be used for a wide variety of applications relevant to improving business operations.
- applicationsare provided in the following paragraphs by way of example, including monitoring effectiveness of online and offline marketing campaigns, detecting in-store operational problems, identifying storefront innovation, producing competitive intelligence, and inferring store groupings based on implicit customer profiles.
- the first example described hereinis using the business monitoring system to monitor the effectiveness of online and offline marketing campaigns.
- Staffcan instruct the system to time-box a set of locations, producing an overall view of a marketing campaign, measuring the signals captured—reflecting both online and offline results.
- the viewincludes both overall change metrics (new people engaged with the tracked locations during the period, total amount of activity/signal data generated at the tracked locations during the period, and so on) and trends within the campaign (day by day or week by week performance within the locations tracked).
- An exampleis the measurement of the effectiveness of a new billboard advertisement placed near a store location (or in the same city, for example).
- the systemgathers online signals and can compare the consumer sentiment towards the business before and after the billboard goes up.
- the changes measuredare sufficiently granular and can be compared with changes at other locations (e.g., a control group) to determine an amount of change that can be inferred to result from the billboard.
- online signalsprovide data of the effectiveness of offline advertising.
- the campaigncan be compared both to historical and concurrent benchmarks. For instance, if the campaign tracks five locations for eight weeks, the system can compare the campaign to the metrics of those same five locations for the eight weeks prior to the campaign start, as well as to the metrics of the other locations within the brand during those same eight weeks. The system can weigh the concurrent benchmark comparison by location count to produce comparative metrics. If the five locations added 100 followers and the other 10 locations added 50 followers, the five locations generated four times more followers than the other locations (the five locations generated 20 followers per location, while the 10 generated only five per location), and this change can be appropriately correlated with the campaign.
- Notificationsprovide a way for the recipient to be informed when a set of locations begin generating an abnormally high number of complaints, and expose the trending topics and complaints themselves to the recipient. These notifications in turn often include specific customer feedback about staff, facilities, service, or other operational issues. The recipient of the notification can then work with the customer to resolve the complaint, and work with the locations involved to address the underlying operational problem. Other metrics may also contribute to a report of operational problems, such as a sales drop at one location compared to other comparable locations during the same period.
- Another exampleis using the business monitoring system to identify storefront innovation.
- locations that are performing significantly better than other locations at certain metricscan be highlighted graphically.
- the person reviewing the highlighted performancecan drill into the activity reflected in the metrics, and determine whether there are particular topics or messages that encouraged the improved customer behavior. Additionally, the person can reach out to the staff responsible for the particular improved locations to request detail as to what other efforts they have taken to improve the performance of their locations. This can assist in improving other locations.
- the business monitoring systemcan also be used to produce competitive intelligence.
- the systemcan generate specific benchmarks for the locations of competitive brands, tracking their publicly available data. Those benchmarks can be used to compare the brand to its competitors on a brand-wide, segment by segment, or location basis, using the metrics tracked as part of the system.
- the business monitoring systemcan also be used to infer store groupings based on implicit customer profiles.
- Each of the profiles that left the signals on the sourcesare collected and themselves analyzed, generating several quantitative dimensions.
- One dimensionmay include a number of interactions overall, grouped by type (check-in, review, mention, and so on), grouped by sentiment (positive vs. neutral vs. negative).
- Another dimensionmay include a number of interactions containing words from a series of word lists (e.g., a word list containing swears, another containing brand names or trademarks, and so on). There can exist standardized word lists used for all brands, as well as brand-specific word lists.
- the resulting dimensionshave a single number for the profile for each word list (“this person left feedback mentioning a brand name three times”), as well as series of numbers, one per word within each word list (“this person left feedback mentioning ‘big mac’ two times”).
- Another dimensionis demographic data, either inferred or explicit—age range, gender, education level, and hometown.
- Another dimensionis location data—quantifying the number of times the person interacted with an individual location, with a location in a town/city, with a location in a state/region.
- Another locationis temporal data—quantifying how often the person interacts during the day vs. during the night, as well as weekday vs. weekend, and season.
- Other dimensionsmay include additional quantitative data extracted from the profile metadata and interaction history.
- the qualitative profile dimensionsare fed into a sparse matrix and clustered with a vector clustering process, such as bisecting K-Means, producing 50+ clusters.
- the locations within the brandare then grouped according to how often profiles from each of the clusters interact with them.
- the resulting grouping of locationscan then be used to target marketing campaigns (e.g., “people like *this* go to these locations, so run a targeted campaign there”), define custom location segments for benchmarking (e.g., “this location is performing significantly better [or worse] than other locations with similar customers”).
- FIG. 1is a block diagram that illustrates components of the business monitoring system, in one embodiment.
- the system 100includes a monitoring data store 110 , monitoring user interface 120 , search component 130 , source identification component 140 , signal acquisition component 150 , signal analysis component 160 , data aggregation component 170 , benchmark building component 180 , variance detection component 190 , and notification component 195 . Each of these components is described in further detail herein.
- the monitoring data store 110stores data collected and analyzed by the system 100 to build metrics for reporting to one or more report recipients.
- the report recipientsmay include the brand owners, competitors, service providers, or any other party interested in a business.
- the monitoring data store 110may include one or more files, file systems, hard drives, databases, cloud-based storage services, or any other facility for storing data. From an interactive perspective, the data store 110 may be partitioned and queried independently on a brand basis. For benchmarking/non-interactive purposes, cross-brand queries are supported, though interactivity is not required.
- the monitoring data store 110builds a historical log of data collected over time, so that comparisons can be made to detect relevant events and to suggest action changes or marketing improvements.
- the monitoring data store 110includes location data that provides a collection of geographic points (“locations”), grouped together into “brands”, representing the locations to be tracked.
- the location data storealso includes brand-specific categorization of each location (e.g., “store type” of “kiosk” vs. “store type” of “stand-alone”), and references to the sources from which each location can acquire local signal data.
- the monitoring data store 110also contains data acquired from each signal. Data from each signal is retrieved and analyzed, with signal data stored by “source”, which in turn is tied to zero or more “locations”, and tied to one “brand”.
- the contentmay include cached data and derived metadata to categorize the signal data.
- the monitoring data store 110also contains benchmark information. Brands and locations themselves have metadata tied to them—both implicitly defined (e.g., geographic, demographic, industry classification, brand/location type) and explicitly defined (e.g., brand-determined categorizations). Signal data is stored in aggregate according to the benchmark dimensions available, tied to a time component to track changes over time (e.g., to record the fact that coffee shops in Seattle had on average X new visitors in July 2011, or Y customer interactions on Aug. 3, 2011).
- the monitoring user interface 120receives input from report recipients to define the type of monitoring information to be tracked and outputs reports to report recipients that contain the requested monitoring information.
- the user interface 120includes a facility to define locations and sources within a brand, specify triggers for alerting (to whom and when), and to query aggregate brand data interactively.
- the interface 120may include a web interface with web-based forms, interactive maps and graphs, downloadable spreadsheets, and emails delivered to notify recipients of triggering activity.
- the interfacemay also include one or more mobile applications (e.g., for a smartphone or tablet), desktop applications, and a programmatic interface (e.g., a web service or object model) through which other services can leverage the power of the business monitoring system 100 to provide extended services.
- the search component 130provides query-based access to the monitoring data store 110 for answering business inquiries.
- the data displayedis a set of rollup values stored in various databases, but for ad-hoc queries and content drill-down, the content is indexed in an inverted index system (e.g., Solr/Lucene), exposing a high performance query interface with faceting on location, source type, interaction type, sentiment, segment, and demographic data.
- the search component 130allows business owners or others to extract data along any axis that interests them, and can provide answers to specific questions (e.g., what products are buyers near store X interested in, how effect of the advertisements placed in region Y, and so forth).
- the source identification component 140identifies signal sources relevant for a particular location and brand.
- each locationis coded with latitude and longitude, as well as the location's name (a local nickname, trade name, or the brand's name).
- each of the integrated source sitesis queried to identify the source page for that location's signals. The manner of querying depends on the source site itself (e.g., through a Foursquare venue search application-programming interface (API), through a third party database such as Locationary or Factual, or through a third party search engine/index such as Google with site search filters).
- APIFoursquare venue search application-programming interface
- the systemperiodically tries to fill in gaps through crowdsourcing the source discovery.
- the systemmay create Mechanical Turk Human Intelligence Tasks (HITs) that request that Mechanical Turk workers look at a search results page and pick the source associated with the business/location. These tasks may show the high-level criteria (location name, address, and site), display the search results page for that site's search, and then pay out a small amount (e.g., $0.04) to have the worker enter the correct source's uniform resource locator (URL).
- the systemverifies sources by checking their general accuracy (e.g., are they for a supported site?).
- the systemassociates the sources with the location provided, with an implicitly determined location within the brand (e.g., by parsing address information from the source data), or with the brand as a whole.
- Clients/brands and support staffperiodically review the sources found and their assignment to locations to provide another layer of validation. Sources can be trivially disabled or reassigned to another location, as needed.
- the signal acquisition component 150acquires new data from specified signal sources.
- a set of sitesare identified and integrations developed for each, designed to acquire signals through the site's API or web interface while complying with appropriate terms of use and query limitations.
- Sitesare selected as they increase in prominence for location-based consumer activity, and may include Foursquare, Gowalla, Facebook Places, Facebook, Twitter, Yelp, CitySearch, InsiderPages, Citygrid, Judysbook, Yahoo Local, Google Places, and others. Integrations use a site-provided API where available and appropriate, but may also use standard web scraping/crawling tools to parse available metadata.
- the component 150queries sites for their sources periodically (e.g., daily). The query rate may vary based on the terms of service for the individual sites, performance, or other factors. When queried, various types of signals are acquired, such as total number of consumers who have interacted with the source, total number of interactions to date, content those consumers have shared, ratings or metadata associated with individual interactions, as well as metadata about the individual source and location itself
- the signal analysis component 160analyzes data received from each source to identify brand and location relevant information. Each piece of content is analyzed for both structural and textual meaning, as well as for demographic metadata about the person who left the content. In some embodiments, content analysis is performed asynchronously whenever new data is acquired. Structural data includes the name of the person who left the signal, any picture associated with their profile, the date/time that the data was left, and any explicit scores or topics entered. Textual analysis may be performed using standard search engine technology (e.g., Lucene/Solr) to identify the topics and phrases within the data.
- standard search engine technologye.g., Lucene/Solr
- semantic analysisis performed on the textual signal left, extracting both high-level mood estimates and additional normalized topics. Semantic analysis can be performed with standard off-the-shelf text analysis engines, such as OpenAmplify's web service, or via proprietary solutions.
- demographic analysisis performed on the textual signal left as well, augmenting any explicitly provided demographic data about the author who left the content (e.g., age, gender, education level).
- implicit demographic datacan be estimated using statistically derived text models, powered by models such as locally trained Bayesian classifiers or a web service such as uClassify.
- the data aggregation component 170aggregates data to discover trends and useful information across retrieved data points. On a periodic (e.g., day-by-day) basis, the component 170 compactly summarizes the state of individual sources into useful statistics, such as: total number of people that have followed or interacted with the source, total number of people that have a bidirectional relationship with the source, and total number of check-ins, reviews, and messages that have been left at the source.
- the source summariesare aggregated into location summaries, combining the data in each location's sources into useful statistics by day (or other grouping), including: new messages, check-ins, and reviews added that day, number of new messages that are overall positive in nature, number of new messages that are overall negative in nature, number of new messages that are overall neutral in nature, total number of messages received, new followers added that day (unidirectional relationship), and new fans added that day (bidirectional relationship).
- the data aggregation component 170then groups location aggregation by brand-defined dimensions, such as store type, state, region, and department.
- the locations associated with each of the segments in each dimensionare rolled up into a segment summary with a few useful statistics by period.
- the rollupis an aggregation with each record showing data such as the total new fans on a particular day for all “kiosk” locations or the total number of new positive signals for all locations managed by a particular person.
- the benchmark building component 180builds relevant benchmarks for tracking brand information.
- Benchmarksare both intra-brand and system-wide.
- Intra-brand benchmarksare built from the historical trends of individual sources, locations, and segments.
- Inter-brand benchmarksare built by using the additional metadata tied to locations and brands to determine which locations and segments should be compared against each other (e.g., coffee shops to coffee shops, rural shops to rural shops instead of rural shops to urban shops, and so on).
- intra-brand benchmarksare built implicitly by persisting and querying the aggregate analysis data.
- inter-brand benchmarksare built both explicitly and on an ad-hoc basis. They are built by using the location and brand metadata to define a particular type of benchmark (e.g., industry benchmark), the function to classify which locations belong in each category (e.g., Standard Industrial Classification (SIC)/North American Industry Classification System (NAICS) code), and then aggregating the underlying location summaries accordingly. Benchmarks can also be broken down with additional categorization (e.g., an industry plus population benchmark), which uses more complex classification functions (e.g., SIC/NAICS code plus Urban/Suburban/Rural).
- SICStandard Industrial Classification
- NAICSNorth American Industry Classification System
- benchmarksare built according to actual values, as well as with derivative functions, such as percent growth per capita for the town/city the location is in, percent growth per online community member, and percent growth per source site community size (e.g., total number of Twitter users, total number of Foursquare users). Benchmarks may be persisted and queried in the same way that brands as a whole are, using dimensions and segments to store the aggregate data then snapshotted using summary data.
- the variance detection component 190detects defined occurrences in the data that indicate anomalies or other events of interest.
- Each brandcan define a set of triggers, specifying who should be notified when certain attributes exceed the normal parameters.
- triggersare defined within the brand at the individual location level, at the segment level, at the brand level, or at some combination thereof. Triggers can be defined to be evaluated on a daily, weekly, or other basis. When a trigger is due to be evaluated, the locations being covered are compared across the defined aspects to the appropriate benchmark, and if the data varies more than expected, the trigger is fired, producing a notification.
- Triggerscan be defined on any of the tracked metrics, such as people engaged with the store, positive or negative mentions, number of interactions or reviews, and so forth. Triggers can be tracked against the associated locations' historical trends as a benchmark (e.g., “did these stores have significantly more or less check-ins this week than they usually did over the last 6-12 months?”), or against another benchmark in the system (e.g., “did these stores have significantly more or less check-ins this week than other coffee shops had?”). Triggers may define the threshold for notification (e.g., “>5% above the average”), use the standard deviation as the implicit threshold (e.g., “it usually varies ⁇ 5 to +5%, but if it varies by 8%, fire the trigger”), or apply other criteria.
- the threshold for notificatione.g., “>5% above the average”
- use the standard deviation as the implicit thresholde.g., “it usually varies ⁇ 5 to +5%, but if it varies by 8%, fire the trigger”
- the notification component 195provides a notification based on detected events from the variance detection component 190 .
- the notification componentmay use email, text messaging, push notifications to a mobile device, or any other facility for communicating with users configured to be notified when events occur.
- the notification component 195may include information in the notification such as a textual description of the event that led to the notification, a severity of the event, and so forth.
- the notification component 195may be configured to notify multiple people in relation to the same event (e.g., a store manager and district manager).
- the computing device on which the business monitoring system is implementedmay include a central processing unit, memory, input devices (e.g., keyboard and pointing devices), output devices (e.g., display devices), and storage devices (e.g., disk drives or other non-volatile storage media).
- the memory and storage devicesare computer-readable storage media that may be encoded with computer-executable instructions (e.g., software) that implement or enable the system.
- the data structures and message structuresmay be stored on computer-readable storage media. Any computer-readable media claimed herein include only those media falling within statutorily patentable categories.
- the systemmay also include one or more communication links over which data can be transmitted. Various communication links may be used, such as the Internet, a local area network, a wide area network, a point-to-point dial-up connection, a cell phone network, and so on.
- Embodiments of the systemmay be implemented in various operating environments that include personal computers, server computers, handheld or laptop devices, multiprocessor systems, microprocessor-based systems, programmable consumer electronics, digital cameras, network PCs, minicomputers, mainframe computers, distributed computing environments that include any of the above systems or devices, set top boxes, systems on a chip (SOCs), and so on.
- the computer systemsmay be cell phones, personal digital assistants, smart phones, personal computers, programmable consumer electronics, digital cameras, and so on.
- the systemmay be described in the general context of computer-executable instructions, such as program modules, executed by one or more computers or other devices.
- program modulesinclude routines, programs, objects, components, data structures, and so on that perform particular tasks or implement particular abstract data types.
- functionality of the program modulesmay be combined or distributed as desired in various embodiments.
- FIG. 2is a flow diagram that illustrates processing of the business monitoring system to build metrics by tracking online occurrences and inferring offline behavior from those occurrences, in one embodiment.
- the systemreceives a list of one or more sources that provide online signals relevant to a particular physical location and brand.
- the systemmay access the list of sources from a data store where the source list was stored after a brand owner or other person configured the system to track metrics for the physical location and brand.
- the sourcesmay include a variety of online locations, specified by URL or other identifier, where consumers of the physical location and brand congregate online and discuss the business represented by the physical location and brand.
- the sourcesmay include social networks (e.g., Facebook, Google+, Twitter), online forums, location-based sites (e.g., Foursquare, Yelp), and so forth.
- the systemselects a first source from the list of sources from which to collect updated signal data. On subsequent iterations, the system selects the next source in the list of sources until all sources have been processed. The system may perform this process on a periodic basis (e.g., daily) for each brand and physical location tracked. In some embodiments, the system may combine effort for gathering data from each source where a source contains data for multiple physical locations and/or brands. The system may also adhere to configured thresholds for acquiring data based on terms of use or other acceptable use policies of each source.
- the systemacquires signal data from the selected source.
- the signal datamay include user posts, user activities (e.g., likes, mentions), or other user activities, that provide information related to the users' opinions or experiences with respect to the physical location and/or brand.
- the systemmay acquire data by accessing programmatic APIs of each source, accessing an exposed web service, crawling a website and scraping data, or other data collection method.
- the systemacquires the data and stores the data in a monitoring data store for analysis to derive metrics for the business.
- the systemanalyzes the acquired signal data to identify information related to the particular physical location and brand.
- the systemmay perform a variety of types of content, semantic, demographic, and other analysis to determine the content and nature of each acquired content item.
- Information analyzedmay include an author of each content item, whether the content item is overall favorable or unfavorable, products mentioned in the content item, a message or sentiment conveyed by the content item, and so forth.
- the systemloops to block 220 to select the next source.
- the systemmay process sources in parallel, acquiring signal data from each or from multiple sources at the same time for increased efficiency.
- the systemaggregates signal data acquired from the sources to identify cross-source trends.
- the systemrolls up data from each source to produce overall metrics for benchmarks such as number of total posts, number of positive mentions, number of negative mentions, change in statistics from a prior period (e.g., drop/rise in day-over-day opinion), and so forth.
- the systempaints a more complete picture of how people congregating online view an offline, physical business location.
- the systembuilds one or more benchmarks that track brand information by comparing historical information to the acquired and aggregated signal data.
- the systemdetermines comparable locations and segments to determine which historical data to compare. Comparisons may occur between locations of the same brand, between brands of similar types (e.g., coffee shops), and so on.
- the systemmay include a variety of explicitly and implicitly defined benchmarks.
- the systemimplicitly builds benchmarks by identifying similar data across brands and locations and identifying past matching brands and/or locations as similar for comparison. Benchmarks may use acquired data directly as well as derivative data calculated upon the acquired data.
- the systemdetects one or more variances in the acquired and aggregated data compared with the historical information to determine whether one or more triggers have been met for notifying a user.
- a variancemay include any deviation from an expected value for any tracked metrics, including both explicitly and implicitly defined variances.
- Customers of the systemmay define their own trigger points at which to be notified, and the system may define default trigger points based on historical information and observing values that are out of character or represent a significant change.
- decision block 290if the system detects that a trigger condition has been met, then the system continues at block 295 , else the system completes. Whether the system notifies a user or not, the processing to detect variances, build benchmarks, aggregate data, and acquire signals is stored in a data store so that the resulting data can be compared with that of subsequent and later periods.
- the systemnotifies a user that at least one metric satisfies a trigger.
- the notificationmay include any type of communication, such as a text message, instant message, email, phone call, push notification, or other communication.
- the notificationmay be addressed to any user that has set up notifications, such as a manager of a retail location, a competitor, or others.
- the notificationallows the recipient user to act upon the information, either by changing marketing or taking other actions (e.g., increasing employee training, offering a new product, and so forth).
- FIG. 3is a flow diagram that illustrates processing of the business monitoring system to receive a request to monitor a brand's performance at a physical location through online events, in one embodiment.
- the systemreceives a monitoring request from a requesting user, wherein the monitoring request specifies one or more brands and physical locations for which to monitor online activity to infer offline behavior.
- the systemmay receive the request through a web-based user interface that brand owners, competitors, service providers, or other users access to submit requests for particular data from the system.
- the systemmay collect additional information and create a stored user profile for the requesting users so that the requesting user can access the site on an ongoing basis to receive reports and other forms of brand metric output.
- the systemreceives an identification of at least one physical site for which the requesting users wants to collect metrics.
- the site identificationmay include an address, name, latitude/longitude values, or other identifier that distinguishes a particular location of a business.
- the systemseparate tracks each physical location of a business and may receive multiple site identifications that can be tracked so that metrics for the locations can be compared with each other and with competing locations.
- the systemreceives a selection of one or more sources to track for online activity related to the identified physical site.
- the systemmay receive a set of sources identified by the requesting user and/or may automatically determine one or more sources to monitor, based on configuration from an administrator, previously identified online sources, or other method.
- the systemselects sources that are likely to capture a complete and useful impression of how well the business is performing at its offline locations based on activity between users of online sources.
- the systemdefines one or more benchmarks based upon which to monitor the selected sources for activity.
- the benchmarksmay be received from the requesting user and specify particular data and/or inquiries that the user expects to be able to satisfy from the monitored sources.
- the benchmarksmay include data directly available from sources as well as derivative data. In some cases, benchmarks are defined as comparisons between two data sets collected at different times, such as records for the same brand and location from today and the same day last year, today and yesterday, today and this day last month, and so forth.
- the systemsets one or more triggers based on a threshold received from the requesting user that indicates at least one benchmark value for which the requesting user requests to be notified.
- a triggerspecifies a point in the data beyond which the requesting user wants to be informed of changes in the data so that the user can react appropriately. For example, if online sentiment expressed towards a location becomes sharply negative in a short period, the requesting user may want to know. Likewise, if after a costly advertising campaign a location experiences a rapid increase in foot traffic or other metrics, the user may want to be notified. Triggers allow users of the system to set these points of interest.
- the systemstores a monitoring definition that includes the received brand, physical location, sources, benchmarks, and triggers.
- the systemstores this information in a data store accessed by processes for acquiring data from the sources, analyzing the data, and notifying requesting users of any satisfied trigger conditions. After block 360 , these steps conclude.
- the following figuresillustrate example user interfaces produced by the business monitoring system, in one embodiment.
- FIG. 4is a display diagram that illustrates a metric reporting dashboard of the business monitoring system, in one embodiment.
- the dashboard 400includes various widgets that display to a user of the system collected metrics for a business. For example, there are widgets for showing custom location segments and views 405 , consumer sentiment scoring 410 , most active online communities 415 , historical sentiment trends 420 , by location trends 425 , smart consumer profiles 430 , report sharing settings 435 , social statistics for all locations 440 , by location statistics 445 , integrated maps 450 , location trending 455 , and location drill down information 460 . From each of these, the user can select and drill down to further understand or evaluate the underlying data.
- FIG. 5is a display diagram that illustrates four widgets for displaying business metrics, in one embodiment.
- the widgetsmay be displayed in a dashboard like that shown with reference to FIG. 4 or on separate detail pages.
- the diagramincludes a first widget 510 that displays information to a regional manager for his entire region.
- the first widget 510summarizes various statistics for the manager's region, such as community size and recent increase in that size.
- the second widget 520displays locations monitored for the district manager, sorted by messages detected at various online sources. The manager can use this to see which locations are receiving the most online buzz or other activity.
- a third widget 530shows the most common positive feedback topics for the monitored locations.
- a fourth widget 540breaks the reported community size up by state.
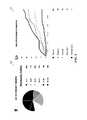
- FIG. 6is a display diagram that illustrates two more widgets for displaying business metrics, in one embodiment.
- the diagramincludes a fifth widget 610 that displays ages of community members displayed as a pie graph. The system gathers this information when the online signals are acquired, from demographic data provided by a particular source, or inferred from other information.
- the diagramalso includes a sixth widget 620 that displays regions that have received the most negative feedback. This may help a district manager or other executive to identify trouble spots so that action can be taken to address any problems.
- FIG. 7is a display diagram that shows a map-based display of metrics, in one embodiment.
- the display 710includes a map 720 followed by a list of locations 730 sorted by rank.
- the business monitoring systemcalculates a VenueRank that factors in various acquired metrics such as consumer sentiment, community growth/size, activity/engagement, a factor of how easily a business can be found online, and potentially other information to arrive at a relative ranking between business locations.
- the VenueRankis based on positive reviews and is time based so that older reviews roll off over time. The VenueRank thus reflects those business locations that are most highly regarded, and can be divided by various business segments, geographical regions, and so forth. By sorting the list of locations 730 , a user can quickly identify those business locations that are highly regarded for the area displayed within the map 720 .
Landscapes
- Business, Economics & Management (AREA)
- Strategic Management (AREA)
- Engineering & Computer Science (AREA)
- Accounting & Taxation (AREA)
- Development Economics (AREA)
- Finance (AREA)
- Entrepreneurship & Innovation (AREA)
- Game Theory and Decision Science (AREA)
- Economics (AREA)
- Marketing (AREA)
- Physics & Mathematics (AREA)
- General Business, Economics & Management (AREA)
- General Physics & Mathematics (AREA)
- Theoretical Computer Science (AREA)
- Data Mining & Analysis (AREA)
- Management, Administration, Business Operations System, And Electronic Commerce (AREA)
Abstract
Description
Claims (20)
Priority Applications (5)
| Application Number | Priority Date | Filing Date | Title |
|---|---|---|---|
| US13/573,783US9508082B1 (en) | 2011-10-03 | 2012-10-03 | Offline location-based consumer metrics using online signals |
| US15/332,921US10049383B2 (en) | 2011-10-03 | 2016-10-24 | Offline location-based consumer metrics using online signals |
| US16/037,087US10366410B2 (en) | 2011-10-03 | 2018-07-17 | Offline location-based consumer metrics using online signals |
| US16/445,261US10600079B2 (en) | 2011-10-03 | 2019-06-19 | Offline location-based consumer metrics using online signals |
| US16/805,350US20200273068A1 (en) | 2011-10-03 | 2020-02-28 | Offline location-based consumer metrics using online signals |
Applications Claiming Priority (2)
| Application Number | Priority Date | Filing Date | Title |
|---|---|---|---|
| US201161542460P | 2011-10-03 | 2011-10-03 | |
| US13/573,783US9508082B1 (en) | 2011-10-03 | 2012-10-03 | Offline location-based consumer metrics using online signals |
Related Child Applications (1)
| Application Number | Title | Priority Date | Filing Date |
|---|---|---|---|
| US15/332,921ContinuationUS10049383B2 (en) | 2011-10-03 | 2016-10-24 | Offline location-based consumer metrics using online signals |
Publications (1)
| Publication Number | Publication Date |
|---|---|
| US9508082B1true US9508082B1 (en) | 2016-11-29 |
Family
ID=57351566
Family Applications (5)
| Application Number | Title | Priority Date | Filing Date |
|---|---|---|---|
| US13/573,783Active2033-07-16US9508082B1 (en) | 2011-10-03 | 2012-10-03 | Offline location-based consumer metrics using online signals |
| US15/332,921ActiveUS10049383B2 (en) | 2011-10-03 | 2016-10-24 | Offline location-based consumer metrics using online signals |
| US16/037,087ActiveUS10366410B2 (en) | 2011-10-03 | 2018-07-17 | Offline location-based consumer metrics using online signals |
| US16/445,261ActiveUS10600079B2 (en) | 2011-10-03 | 2019-06-19 | Offline location-based consumer metrics using online signals |
| US16/805,350PendingUS20200273068A1 (en) | 2011-10-03 | 2020-02-28 | Offline location-based consumer metrics using online signals |
Family Applications After (4)
| Application Number | Title | Priority Date | Filing Date |
|---|---|---|---|
| US15/332,921ActiveUS10049383B2 (en) | 2011-10-03 | 2016-10-24 | Offline location-based consumer metrics using online signals |
| US16/037,087ActiveUS10366410B2 (en) | 2011-10-03 | 2018-07-17 | Offline location-based consumer metrics using online signals |
| US16/445,261ActiveUS10600079B2 (en) | 2011-10-03 | 2019-06-19 | Offline location-based consumer metrics using online signals |
| US16/805,350PendingUS20200273068A1 (en) | 2011-10-03 | 2020-02-28 | Offline location-based consumer metrics using online signals |
Country Status (1)
| Country | Link |
|---|---|
| US (5) | US9508082B1 (en) |
Cited By (21)
| Publication number | Priority date | Publication date | Assignee | Title |
|---|---|---|---|---|
| US20140200988A1 (en)* | 2013-01-15 | 2014-07-17 | Datorama Technologies, Ltd. | System and method for normalizing campaign data gathered from a plurality of advertising platforms |
| US20140297399A1 (en)* | 2012-11-14 | 2014-10-02 | MarketBridge Inc. | System and method for providing social media marketing performance and feedback |
| US20150073894A1 (en)* | 2013-09-06 | 2015-03-12 | Metamarkets Group Inc. | Suspect Anomaly Detection and Presentation within Context |
| US20160284037A1 (en)* | 2015-03-23 | 2016-09-29 | Optum, Inc. | Social media healthcare analytics |
| US20180053196A1 (en)* | 2016-08-17 | 2018-02-22 | Observa, Inc. | System and method for optimizing an observation campaign in response to observed real-world data |
| US20180054657A1 (en)* | 2016-08-17 | 2018-02-22 | International Business Machines Corporation | System and method for targeting mass media ads on the television to given physical locations using online activity profiles at the locations |
| US9965772B2 (en)* | 2013-01-15 | 2018-05-08 | Datorama Technologies, Ltd. | System and method for unifying user-level data across different media platforms |
| CN109583932A (en)* | 2018-09-29 | 2019-04-05 | 阿里巴巴集团控股有限公司 | A kind of method, apparatus and electronic equipment of generation activity crowd |
| US10417258B2 (en) | 2013-12-19 | 2019-09-17 | Exposit Labs, Inc. | Interactive multi-dimensional nested table supporting scalable real-time querying of large data volumes |
| US10515386B2 (en) | 2013-01-15 | 2019-12-24 | Datorama Technologies, Ltd. | System and method for performing cross-platform big data analytics |
| US20200019897A1 (en)* | 2018-07-11 | 2020-01-16 | Bank Of America Corporation | Intelligent Dynamic Entity Data Control System |
| US10754877B2 (en) | 2013-01-15 | 2020-08-25 | Datorama Technologies, Ltd. | System and method for providing big data analytics on dynamically-changing data models |
| US10902439B2 (en) | 2016-08-17 | 2021-01-26 | Observa, Inc. | System and method for collecting real-world data in fulfillment of observation campaign opportunities |
| US10997616B2 (en) | 2016-11-23 | 2021-05-04 | Observa, Inc. | System and method for correlating collected observation campaign data with sales data |
| US11004100B2 (en) | 2016-08-17 | 2021-05-11 | Observa, Inc. | System and method for coordinating a campaign for observers of real-world data |
| US11093958B2 (en) | 2016-11-23 | 2021-08-17 | Observa, Inc. | System and method for facilitating real-time feedback in response to collection of real-world data |
| US11488182B2 (en) | 2018-06-22 | 2022-11-01 | Observa, Inc. | System and method for identifying content in a web-based marketing environment |
| US11488135B2 (en) | 2016-11-23 | 2022-11-01 | Observa, Inc. | System and method for using user rating in real-world data observation campaign |
| US11494721B1 (en)* | 2017-08-28 | 2022-11-08 | Thomas Lah | Artificial intelligence system for electronically monitoring and analyzing data transmitted through multiple electronic channels to suggest actions for increasing the effectiveness of data transmitted through the channels |
| US11551305B1 (en) | 2011-11-14 | 2023-01-10 | Economic Alchemy Inc. | Methods and systems to quantify and index liquidity risk in financial markets and risk management contracts thereon |
| CN120146897A (en)* | 2025-03-19 | 2025-06-13 | 橙客时代(北京)网络科技有限公司 | Traffic venue screening method, system and storage medium for marketing |
Families Citing this family (10)
| Publication number | Priority date | Publication date | Assignee | Title |
|---|---|---|---|---|
| US20180357684A1 (en)* | 2017-01-12 | 2018-12-13 | Hefei University Of Technology | Method for identifying prefereed region of product, apparatus and storage medium thereof |
| CN110084653A (en)* | 2019-05-13 | 2019-08-02 | 北京小度信息科技有限公司 | A kind of data processing method, device, server and storage medium |
| US12205148B2 (en)* | 2020-02-03 | 2025-01-21 | Anagog Ltd. | Distributed content serving |
| US11842156B2 (en)* | 2020-05-13 | 2023-12-12 | Early Warning Services, Llc | Systems and methods of artificially intelligent sentiment analysis |
| CN112100474B (en)* | 2020-11-02 | 2021-02-02 | 成都智元汇信息技术股份有限公司 | Passenger service quality public opinion supervision system and method |
| US20220277249A1 (en)* | 2021-02-26 | 2022-09-01 | Intuit Inc. | Benchmarking based on company vendor data |
| US20230004999A1 (en)* | 2021-06-30 | 2023-01-05 | On24, Inc. | Methods, Systems, And Apparatuses For User Segmentation And Analysis |
| US20230214860A1 (en)* | 2021-12-30 | 2023-07-06 | Ozyegin Universitesi | Model of Brand Health |
| US11838170B1 (en)* | 2022-05-11 | 2023-12-05 | Truist Bank | Messaging segmentation based on data flow informatics |
| US20250217822A1 (en)* | 2024-01-02 | 2025-07-03 | Truist Bank | Signaling upon contact trajectory having likelihood for intersection by use of a diversion vehicle |
Citations (8)
| Publication number | Priority date | Publication date | Assignee | Title |
|---|---|---|---|---|
| US6055573A (en)* | 1998-12-30 | 2000-04-25 | Supermarkets Online, Inc. | Communicating with a computer based on an updated purchase behavior classification of a particular consumer |
| US20050222906A1 (en)* | 2002-02-06 | 2005-10-06 | Chen Timothy T | System and method of targeted marketing |
| US20080183717A1 (en)* | 2002-03-07 | 2008-07-31 | Man Jit Singh | Clickstream analysis methods and systems |
| US20080270209A1 (en)* | 2007-04-25 | 2008-10-30 | Michael Jon Mauseth | Merchant scoring system and transactional database |
| US20110087519A1 (en)* | 2009-10-09 | 2011-04-14 | Visa U.S.A. Inc. | Systems and Methods for Panel Enhancement with Transaction Data |
| US20110119126A1 (en)* | 2009-11-19 | 2011-05-19 | Google Inc. | Online Monitoring Systems to Determine Offline Advertising Effectiveness |
| US20110196741A1 (en)* | 2010-02-09 | 2011-08-11 | Yahoo! Inc. | Online and offline integrated profile in advertisement targeting |
| US8676628B2 (en)* | 2009-09-11 | 2014-03-18 | Roil Results Pty Limited | Method and system for determining effectiveness of marketing |
Family Cites Families (16)
| Publication number | Priority date | Publication date | Assignee | Title |
|---|---|---|---|---|
| US6748318B1 (en)* | 1993-05-18 | 2004-06-08 | Arrivalstar, Inc. | Advanced notification systems and methods utilizing a computer network |
| AU2001253438A1 (en)* | 2000-04-14 | 2001-10-30 | E-Vantage International, Inc. | Method and system for delivering foreign exchange risk management advisory solutions to a designated market |
| US7363249B1 (en)* | 2001-06-04 | 2008-04-22 | Boesjes Eimar M | Multiply-integrated system for product inventory, sales, and distribution |
| US8600924B2 (en)* | 2001-11-14 | 2013-12-03 | Retaildna, Llc | Method and system to manage multiple party rewards using a single account and artificial intelligence |
| US20090276309A1 (en)* | 2001-11-14 | 2009-11-05 | Retaildna, Llc | Self learning method and system for managing an advertisement |
| US20090164391A1 (en)* | 2001-11-14 | 2009-06-25 | Retaildna, Llc | Self learning method and system to revenue manage a published price in a retail environment |
| US7899707B1 (en)* | 2002-06-18 | 2011-03-01 | Ewinwin, Inc. | DAS predictive modeling and reporting function |
| US8306851B2 (en)* | 2003-02-27 | 2012-11-06 | Murphy Oil Usa, Inc. | Automated price management system |
| US20060173773A1 (en)* | 2003-07-10 | 2006-08-03 | Ettinger Richard W Jr | Systems and methods for automated offer-based negotiation |
| US20060206347A1 (en)* | 2005-03-11 | 2006-09-14 | Lockheed Martin Corporation | Network centric system and method for processing information |
| US7779099B2 (en)* | 2006-03-16 | 2010-08-17 | Us Beverage Net Inc. | Distributed intelligent systems and methods therefor |
| US20070294128A1 (en)* | 2006-06-02 | 2007-12-20 | Wedemeyer Dan J | Automated online methodology for forecasting and anticipating alternative futures developments |
| US9031857B2 (en)* | 2007-04-03 | 2015-05-12 | International Business Machines Corporation | Generating customized marketing messages at the customer level based on biometric data |
| US20100223157A1 (en)* | 2007-10-15 | 2010-09-02 | Simardip Kalsi | Online virtual knowledge marketplace |
| US20090182630A1 (en)* | 2008-01-11 | 2009-07-16 | Jonathan Otto | System and method for enabling point of sale functionality in a wireless communications device |
| US8504456B2 (en)* | 2009-12-01 | 2013-08-06 | Bank Of America Corporation | Behavioral baseline scoring and risk scoring |
- 2012
- 2012-10-03USUS13/573,783patent/US9508082B1/enactiveActive
- 2016
- 2016-10-24USUS15/332,921patent/US10049383B2/enactiveActive
- 2018
- 2018-07-17USUS16/037,087patent/US10366410B2/enactiveActive
- 2019
- 2019-06-19USUS16/445,261patent/US10600079B2/enactiveActive
- 2020
- 2020-02-28USUS16/805,350patent/US20200273068A1/enactivePending
Patent Citations (14)
| Publication number | Priority date | Publication date | Assignee | Title |
|---|---|---|---|---|
| US6298330B1 (en)* | 1998-12-30 | 2001-10-02 | Supermarkets Online, Inc. | Communicating with a computer based on the offline purchase history of a particular consumer |
| US20020004754A1 (en)* | 1998-12-30 | 2002-01-10 | Will H Gardenswartz | Communicating with a computer based on the offline purchase history of a particular consumer |
| US20020046105A1 (en)* | 1998-12-30 | 2002-04-18 | Supermarkets Online, Inc. | Communicating with a computer based on the offline purchase history of a particular consumer |
| US6055573A (en)* | 1998-12-30 | 2000-04-25 | Supermarkets Online, Inc. | Communicating with a computer based on an updated purchase behavior classification of a particular consumer |
| US20050222906A1 (en)* | 2002-02-06 | 2005-10-06 | Chen Timothy T | System and method of targeted marketing |
| US7814139B2 (en)* | 2002-03-07 | 2010-10-12 | Complete, Inc. | Systems and methods for clickstream analysis to modify an off-line business process involving forecasting demand |
| US20080183717A1 (en)* | 2002-03-07 | 2008-07-31 | Man Jit Singh | Clickstream analysis methods and systems |
| US20080270209A1 (en)* | 2007-04-25 | 2008-10-30 | Michael Jon Mauseth | Merchant scoring system and transactional database |
| US8725597B2 (en)* | 2007-04-25 | 2014-05-13 | Google Inc. | Merchant scoring system and transactional database |
| US8676628B2 (en)* | 2009-09-11 | 2014-03-18 | Roil Results Pty Limited | Method and system for determining effectiveness of marketing |
| US20110087519A1 (en)* | 2009-10-09 | 2011-04-14 | Visa U.S.A. Inc. | Systems and Methods for Panel Enhancement with Transaction Data |
| US20120109709A1 (en)* | 2009-10-09 | 2012-05-03 | Visa U.S.A. Inc. | Systems and Methods for Panel Enhancement with Transaction Data |
| US20110119126A1 (en)* | 2009-11-19 | 2011-05-19 | Google Inc. | Online Monitoring Systems to Determine Offline Advertising Effectiveness |
| US20110196741A1 (en)* | 2010-02-09 | 2011-08-11 | Yahoo! Inc. | Online and offline integrated profile in advertisement targeting |
Non-Patent Citations (3)
| Title |
|---|
| Goel, S., Hofman, J. M., Lahaie, S., Pennock, D. M., & Watts, D. J. Predicting consumer behavior with Web search.* |
| Partridge, Kurt, and Bo Begole. "Activity-based advertising." Pervasive Advertising. Springer London, 2011. 83-101.* |
| You, Chuang-Wen, et al. "Using mobile phones to monitor shopping time at physical stores." IEEE Pervasive Computing 10.2 (2011): 37-43.* |
Cited By (34)
| Publication number | Priority date | Publication date | Assignee | Title |
|---|---|---|---|---|
| US11599892B1 (en)* | 2011-11-14 | 2023-03-07 | Economic Alchemy Inc. | Methods and systems to extract signals from large and imperfect datasets |
| US11551305B1 (en) | 2011-11-14 | 2023-01-10 | Economic Alchemy Inc. | Methods and systems to quantify and index liquidity risk in financial markets and risk management contracts thereon |
| US11587172B1 (en) | 2011-11-14 | 2023-02-21 | Economic Alchemy Inc. | Methods and systems to quantify and index sentiment risk in financial markets and risk management contracts thereon |
| US12373890B1 (en) | 2011-11-14 | 2025-07-29 | Economic Alchemy Inc. | Methods and systems to quantify and index correlation risk in financial markets and risk management contracts thereon |
| US11941645B1 (en) | 2011-11-14 | 2024-03-26 | Economic Alchemy Inc. | Methods and systems to extract signals from large and imperfect datasets |
| US11593886B1 (en) | 2011-11-14 | 2023-02-28 | Economic Alchemy Inc. | Methods and systems to quantify and index correlation risk in financial markets and risk management contracts thereon |
| US11854083B1 (en) | 2011-11-14 | 2023-12-26 | Economic Alchemy Inc. | Methods and systems to quantify and index liquidity risk in financial markets and risk management contracts thereon |
| US20140297399A1 (en)* | 2012-11-14 | 2014-10-02 | MarketBridge Inc. | System and method for providing social media marketing performance and feedback |
| US10395271B2 (en)* | 2013-01-15 | 2019-08-27 | Datorama Technologies, Ltd. | System and method for normalizing campaign data gathered from a plurality of advertising platforms |
| US10515386B2 (en) | 2013-01-15 | 2019-12-24 | Datorama Technologies, Ltd. | System and method for performing cross-platform big data analytics |
| US11042899B2 (en)* | 2013-01-15 | 2021-06-22 | Datorama Technologies, Ltd. | System and method for tracking users across a plurality of media platforms |
| US10754877B2 (en) | 2013-01-15 | 2020-08-25 | Datorama Technologies, Ltd. | System and method for providing big data analytics on dynamically-changing data models |
| US9965772B2 (en)* | 2013-01-15 | 2018-05-08 | Datorama Technologies, Ltd. | System and method for unifying user-level data across different media platforms |
| US20140200988A1 (en)* | 2013-01-15 | 2014-07-17 | Datorama Technologies, Ltd. | System and method for normalizing campaign data gathered from a plurality of advertising platforms |
| US20150073894A1 (en)* | 2013-09-06 | 2015-03-12 | Metamarkets Group Inc. | Suspect Anomaly Detection and Presentation within Context |
| US10417258B2 (en) | 2013-12-19 | 2019-09-17 | Exposit Labs, Inc. | Interactive multi-dimensional nested table supporting scalable real-time querying of large data volumes |
| US20160284037A1 (en)* | 2015-03-23 | 2016-09-29 | Optum, Inc. | Social media healthcare analytics |
| US11023946B2 (en)* | 2015-03-23 | 2021-06-01 | Optum, Inc. | Social media healthcare analytics |
| US11004100B2 (en) | 2016-08-17 | 2021-05-11 | Observa, Inc. | System and method for coordinating a campaign for observers of real-world data |
| US20180054657A1 (en)* | 2016-08-17 | 2018-02-22 | International Business Machines Corporation | System and method for targeting mass media ads on the television to given physical locations using online activity profiles at the locations |
| US20180053196A1 (en)* | 2016-08-17 | 2018-02-22 | Observa, Inc. | System and method for optimizing an observation campaign in response to observed real-world data |
| US11405696B2 (en)* | 2016-08-17 | 2022-08-02 | International Business Machines Corporation | System and method for targeting mass media ads on the television to given physical locations using online activity profiles at the locations |
| US10990986B2 (en)* | 2016-08-17 | 2021-04-27 | Observa, Inc. | System and method for optimizing an observation campaign in response to observed real-world data |
| US10902439B2 (en) | 2016-08-17 | 2021-01-26 | Observa, Inc. | System and method for collecting real-world data in fulfillment of observation campaign opportunities |
| US11093958B2 (en) | 2016-11-23 | 2021-08-17 | Observa, Inc. | System and method for facilitating real-time feedback in response to collection of real-world data |
| US11488135B2 (en) | 2016-11-23 | 2022-11-01 | Observa, Inc. | System and method for using user rating in real-world data observation campaign |
| US10997616B2 (en) | 2016-11-23 | 2021-05-04 | Observa, Inc. | System and method for correlating collected observation campaign data with sales data |
| US11494721B1 (en)* | 2017-08-28 | 2022-11-08 | Thomas Lah | Artificial intelligence system for electronically monitoring and analyzing data transmitted through multiple electronic channels to suggest actions for increasing the effectiveness of data transmitted through the channels |
| US11488182B2 (en) | 2018-06-22 | 2022-11-01 | Observa, Inc. | System and method for identifying content in a web-based marketing environment |
| US20200019897A1 (en)* | 2018-07-11 | 2020-01-16 | Bank Of America Corporation | Intelligent Dynamic Entity Data Control System |
| US11100436B2 (en)* | 2018-07-11 | 2021-08-24 | Bank Of America Corporation | Intelligent dynamic entity data control system |
| CN109583932B (en)* | 2018-09-29 | 2023-04-07 | 创新先进技术有限公司 | Method and device for generating active crowd and electronic equipment |
| CN109583932A (en)* | 2018-09-29 | 2019-04-05 | 阿里巴巴集团控股有限公司 | A kind of method, apparatus and electronic equipment of generation activity crowd |
| CN120146897A (en)* | 2025-03-19 | 2025-06-13 | 橙客时代(北京)网络科技有限公司 | Traffic venue screening method, system and storage medium for marketing |
Also Published As
| Publication number | Publication date |
|---|---|
| US10600079B2 (en) | 2020-03-24 |
| US10049383B2 (en) | 2018-08-14 |
| US20200273068A1 (en) | 2020-08-27 |
| US10366410B2 (en) | 2019-07-30 |
| US20200043040A1 (en) | 2020-02-06 |
| US20190012701A1 (en) | 2019-01-10 |
| US20170140419A1 (en) | 2017-05-18 |
Similar Documents
| Publication | Publication Date | Title |
|---|---|---|
| US10600079B2 (en) | Offline location-based consumer metrics using online signals | |
| US11315142B2 (en) | Method and system for correlating social media conversions | |
| US20200051099A1 (en) | Sales prediction systems and methods | |
| US20160171103A1 (en) | Systems and Methods for Gathering, Merging, and Returning Data Describing Entities Based Upon Identifying Information | |
| US8972275B2 (en) | Optimization of social media engagement | |
| JP5596152B2 (en) | Information matching method and system on electronic commerce website | |
| US9626685B2 (en) | Systems and methods of mapping attention | |
| US20180365710A1 (en) | Website interest detector | |
| US9213733B2 (en) | Computerized internet search system and method | |
| US20130085803A1 (en) | Brand analysis | |
| US20110264531A1 (en) | Watching a user's online world | |
| US20130035982A1 (en) | Method and system for creating targeted advertising utilizing social media activity | |
| US20130304726A1 (en) | Methods and systems useful for identifying the most influent social media users in query-based social data streams | |
| US9251530B1 (en) | Apparatus and method for model-based social analytics | |
| US20130204822A1 (en) | Tools and methods for determining relationship values | |
| JP2013526747A (en) | Data collection, tracking and analysis methods for multimedia including impact analysis and impact tracking | |
| US20190050874A1 (en) | Associating ip addresses with locations where users access content | |
| US9641556B1 (en) | Apparatus and method for identifying constituents in a social network | |
| CN110637317A (en) | Distributed node cluster for establishing digital contact points across multiple devices on a digital communications network | |
| US20140278796A1 (en) | Identifying Target Audience for a Product or Service | |
| WO2013142759A1 (en) | Computerized internet search system and method | |
| US20110264525A1 (en) | Searching a user's online world | |
| US10929892B2 (en) | Marketing to consumers using data obtained from abandoned GPS searches | |
| Diapouli et al. | Behavioural Analytics using Process Mining in On-line Advertising. | |
| WO2013177230A1 (en) | Optimization of social media engagement |
Legal Events
| Date | Code | Title | Description |
|---|---|---|---|
| AS | Assignment | Owner name:VALUEVINE, INC., WASHINGTON Free format text:ASSIGNMENT OF ASSIGNORS INTEREST;ASSIGNORS:MANNIX, PETE M.;CRIST, NEIL P.;REEL/FRAME:037289/0648 Effective date:20151209 | |
| AS | Assignment | Owner name:GROUPON, INC., ILLINOIS Free format text:ASSIGNMENT OF ASSIGNORS INTEREST;ASSIGNOR:VALUEVINE, INC.;REEL/FRAME:037485/0307 Effective date:20150618 | |
| STCF | Information on status: patent grant | Free format text:PATENTED CASE | |
| MAFP | Maintenance fee payment | Free format text:PAYMENT OF MAINTENANCE FEE, 4TH YEAR, LARGE ENTITY (ORIGINAL EVENT CODE: M1551); ENTITY STATUS OF PATENT OWNER: LARGE ENTITY Year of fee payment:4 | |
| AS | Assignment | Owner name:JPMORGAN CHASE BANK, N.A., ILLINOIS Free format text:SECURITY INTEREST;ASSIGNORS:GROUPON, INC.;LIVINGSOCIAL, LLC;REEL/FRAME:053294/0495 Effective date:20200717 | |
| AS | Assignment | Owner name:LIVINGSOCIAL, LLC (F/K/A LIVINGSOCIAL, INC.), ILLINOIS Free format text:RELEASE BY SECURED PARTY;ASSIGNOR:JPMORGAN CHASE BANK, N.A.;REEL/FRAME:066676/0001 Effective date:20240212 Owner name:GROUPON, INC., ILLINOIS Free format text:RELEASE BY SECURED PARTY;ASSIGNOR:JPMORGAN CHASE BANK, N.A.;REEL/FRAME:066676/0001 Effective date:20240212 Owner name:LIVINGSOCIAL, LLC (F/K/A LIVINGSOCIAL, INC.), ILLINOIS Free format text:TERMINATION AND RELEASE OF SECURITY INTEREST IN INTELLECTUAL PROPERTY RIGHTS;ASSIGNOR:JPMORGAN CHASE BANK, N.A.;REEL/FRAME:066676/0251 Effective date:20240212 Owner name:GROUPON, INC., ILLINOIS Free format text:TERMINATION AND RELEASE OF SECURITY INTEREST IN INTELLECTUAL PROPERTY RIGHTS;ASSIGNOR:JPMORGAN CHASE BANK, N.A.;REEL/FRAME:066676/0251 Effective date:20240212 | |
| MAFP | Maintenance fee payment | Free format text:PAYMENT OF MAINTENANCE FEE, 8TH YEAR, LARGE ENTITY (ORIGINAL EVENT CODE: M1552); ENTITY STATUS OF PATENT OWNER: LARGE ENTITY Year of fee payment:8 | |
| AS | Assignment | Owner name:BYTEDANCE INC., DELAWARE Free format text:ASSIGNMENT OF ASSIGNORS INTEREST;ASSIGNOR:GROUPON, INC.;REEL/FRAME:068833/0811 Effective date:20240226 |