US9461896B2 - Methods and systems for efficient updating of time-aligned graphs in a monitoring system - Google Patents
Methods and systems for efficient updating of time-aligned graphs in a monitoring systemDownload PDFInfo
- Publication number
- US9461896B2 US9461896B2US13/715,381US201213715381AUS9461896B2US 9461896 B2US9461896 B2US 9461896B2US 201213715381 AUS201213715381 AUS 201213715381AUS 9461896 B2US9461896 B2US 9461896B2
- Authority
- US
- United States
- Prior art keywords
- time
- metrics
- future time
- time window
- buffer
- Prior art date
- Legal status (The legal status is an assumption and is not a legal conclusion. Google has not performed a legal analysis and makes no representation as to the accuracy of the status listed.)
- Active, expires
Links
- 238000000034methodMethods0.000titleclaimsdescription20
- 238000012544monitoring processMethods0.000titleabstractdescription52
- 238000012545processingMethods0.000description7
- 239000003795chemical substances by applicationSubstances0.000description6
- 230000008901benefitEffects0.000description4
- 230000000007visual effectEffects0.000description3
- 230000006870functionEffects0.000description2
- 238000005259measurementMethods0.000description2
- 238000013459approachMethods0.000description1
- 230000000694effectsEffects0.000description1
- 238000005516engineering processMethods0.000description1
- 238000005457optimizationMethods0.000description1
- 230000004043responsivenessEffects0.000description1
- 238000006467substitution reactionMethods0.000description1
- 230000001360synchronised effectEffects0.000description1
- 239000002699waste materialSubstances0.000description1
Images


Classifications
- H—ELECTRICITY
- H04—ELECTRIC COMMUNICATION TECHNIQUE
- H04L—TRANSMISSION OF DIGITAL INFORMATION, e.g. TELEGRAPHIC COMMUNICATION
- H04L43/00—Arrangements for monitoring or testing data switching networks
- H04L43/04—Processing captured monitoring data, e.g. for logfile generation
- H04L43/045—Processing captured monitoring data, e.g. for logfile generation for graphical visualisation of monitoring data
- H—ELECTRICITY
- H04—ELECTRIC COMMUNICATION TECHNIQUE
- H04L—TRANSMISSION OF DIGITAL INFORMATION, e.g. TELEGRAPHIC COMMUNICATION
- H04L43/00—Arrangements for monitoring or testing data switching networks
- H04L43/08—Monitoring or testing based on specific metrics, e.g. QoS, energy consumption or environmental parameters
- H04L43/0805—Monitoring or testing based on specific metrics, e.g. QoS, energy consumption or environmental parameters by checking availability
- H04L43/0817—Monitoring or testing based on specific metrics, e.g. QoS, energy consumption or environmental parameters by checking availability by checking functioning
Definitions
- Application performance managementrelates to technologies and systems for monitoring and managing the performance of applications. For example, application performance management is commonly used to monitor and manage transactions performed by an application running on a server to a client.
- a key piece of functionality for monitoring applicationsis to display the monitoring data.
- One exampleis the use of dashboards to represent data visually.
- the data in each graphis commonly provided in the form of time-value pairs for a given metric: the time at which a measurement was taken, and the corresponding value of the metric.
- a dashboardwill consolidate multiple graphs for different monitoring data metrics in the same display.
- the updates for different metricsmay occur at different intervals.
- the dashboard's time axisneeds to be redrawn with every new data point. If there are several metrics updating frequently, then the time axis and all the related graphs have to also be updated. As a result, the dashboard must update itself rapidly, making it difficult to view and interpret. In addition, rapid updates waste processing resources that would otherwise be used to improve system performance.
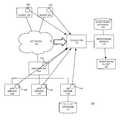
- FIG. 1illustrates an exemplary system in accordance with the principles of the present invention.
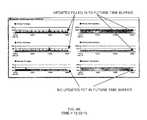
- FIG. 2illustrates a dashboard with a single graph having a time window and a future time buffer in accordance with the principles of the present invention.
- FIG. 3illustrates an exemplary process flow in accordance with an embodiment of the present invention.
- FIGS. 4A-4Dillustrate examples of a dashboard with multiple graphs employing a future time buffer in accordance with the principles of the present invention.
- the embodimentsrelate to displaying data, for example, in a dashboard as part of a user interface.
- the dashboardhas a defined time window, which specifies how much data is displayed, and a future time buffer.
- the dashboardmay comprise a plurality of graphical representations, graphical elements, or simply, graphs, for various types of monitoring data metrics. Updates to each of the graphs may occur at different intervals even though the graphs are aligned to the same time window in the dashboard.
- the future time bufferminimizes the amount of redrawing required in the presence of updates at different times and/or frequencies.
- the future time bufferallows a brief overflow period for updates to be added to the graphs while keeping all the graphs on a common time axis.
- the time window of the dashboardis then shifted forward once the current time reaches the end of the future time buffer.
- the embodimentsmay be useful, for example, for displaying a variety of metrics and data in real-time or near real-time in a time-aligned fashion.
- the embodimentsmay be implemented in displaying data for application performance monitoring data, network performance data, data from sensors, financial data, etc.
- Those skilled in the artwill recognize that the embodiments can be applicable to any form of multiple, real-time, asynchronous, data from one or more sources in which a time-aligned display is desired.
- FIG. 1illustrates an exemplary system to support an application and an application performance management (or monitoring) system.
- the application performance management system 100may collect a wide variety of metrics and display these metrics to the user for monitoring or analysis.
- the application performance management system 100may provide a dashboard.
- the dashboardmay comprise multiple graphs for various metrics that are aligned to a common time axis and time window using a future time buffer.
- the application management system 100may collect metrics related to processor utilization, memory usage, network traffic, latency, and the like.
- the components of an exemplary system 100are provided with reference to FIG. 1 .
- the system 100may comprise a set of clients 102 , a web server 104 , application servers 106 , a database server 108 , a database 110 , and application performance management system 112 .
- the application performance management system 112may comprise a collector 114 , a monitoring server 116 , and a monitoring database 118 .
- the application performance management system 112may also be accessed via a monitoring client 120 .
- Clients 102refer to any device requesting and accessing services of applications provided by system 100 .
- Clients 102may be implemented using known hardware and software.
- clients 102may be implemented on a personal computer, a laptop computer, a tablet computer, a smart phone, and the like.
- Such devicesare well known to those skilled in the art and may be employed in one embodiment.
- the clients 102may access various applications based on client software running or installed on the clients 102 .
- the clients 102may execute a thick client, a thin client, or hybrid client.
- the clients 102may access applications via a thin client, such as a browser application like Internet Explore, Firefox, etc.
- Programming for these thin clientsmay include, for example, JavaScript/AJX, JSP, ASP, PHP, Flash, Siverlight, and others.
- Such browsers and programming codeare known to those skilled in the art.
- the clients 102may execute a thick client, such as a stand-alone application, installed on the clients 102 .
- a thick clientsuch as a stand-alone application
- Programming for thick clientsmay be based on the .NET framework, Java, Visual Studio, etc.
- Web server 104provides content for the applications of system 100 over a network, such as network 124 .
- Web server 104may be implemented using known hardware and software to deliver application content.
- web server 104may deliver content via HTML pages and employ various IP protocols, such as HTTP.
- Application servers 106provide a hardware and software environment on which the applications of system 1000 may execute.
- applications servers 106may be implemented based as Java Application Servers, Windows Server implement a .NET framework, LINUX, UNIX, WebSphere, etc. running on known hardware platforms.
- Application servers 106may be implemented on the same hardware platform as the web server 104 , or as shown in FIG. 1 , they may be implemented on their own hardware.
- application servers 106may provide various applications, such as mail, word processors, spreadsheets, point-of-sale, multimedia, etc. Application servers 106 may perform various transaction related to requests by the clients 102 . In addition, application servers 106 may interface with the database server 108 and database 110 on behalf of clients 102 , implement business logic for the applications, and other functions known to those skilled in the art.
- Database server 108provides database services to database 110 for transactions and queries requested by clients 102 .
- Database server 108may be implemented using known hardware and software.
- database server 108may be implemented based on Oracle, DB2, Ingres, SQL Server, MySQL, etc. software running on a server.
- Database 110represents the storage infrastructure for data and information requested by clients 102 .
- Database 110may be implemented using known hardware and software.
- database 110may be implemented as relational database based on known database management systems, such as SQL, MySQL, etc.
- Database 110may also comprise other types of databases, such as, object oriented databases, XML databases, and so forth.
- Application performance management system 112represents the hardware and software used for monitoring and managing the applications provided by system 100 . As shown, application performance management system 112 may comprise a collector 114 , a monitoring server 116 , a monitoring database 118 , a monitoring client 120 , and agents 122 . These components will now be further described.
- Collector 114collects application performance information from the components of system 100 .
- collector 114may receive information from clients 102 , web server 104 , application servers 106 , database server 108 , and network 124 .
- the application performance informationmay comprise a variety of information, such as trace files, system logs, etc.
- Collector 114may be implemented using known hardware and software.
- collector 114may be implemented as software running on a general-purpose server.
- collector 114may be implemented as an appliance or virtual machine running on a server.
- Monitoring server 116hosts the application performance management system. Monitoring server 116 may be implemented using known hardware and software. Monitoring server 116 may be implemented as software running on a general-purpose server. Alternatively, monitoring server 116 may be implemented as an appliance or virtual machine running on a server.
- Monitoring database 118provides a storage infrastructure for storing the application performance information processed by the monitoring server 116 .
- Monitoring database 118may be implemented using known hardware and software.
- Monitoring client 120serves as a user interface for accessing monitoring server 116 .
- monitoring client 120may be implemented as a personal computer running an application or web browser accessing the monitoring server 120 .
- the monitoring client 120is configured to display a dashboard having one or more graphs for various collected metrics.
- the monitoring client 120may display the dashboard, for example, using an installed application or web browser based on data received from monitoring server 116 .
- Some examples of a dashboard for a user interface by monitoring client 120are provided with reference to FIGS. 4A-4D .
- Agents 122serve as instrumentation for the application performance management system. As shown, the agents 122 may be distributed and running on the various components of system 100 . Agents 122 may be implemented as software running on the components or may be a hardware device coupled to the component. For example, agents 122 may implement monitoring instrumentation for Java and .NET framework applications. In one embodiment, the agents 122 implement, among other things, tracing of method calls for various transactions.
- Network 124serves as a communications infrastructure for the system 100 .
- Network 124may comprise various known network elements, such as routers, firewalls, hubs, switches, etc.
- network 124may support various communications protocols, such as TCP/IP.
- Network 124may refer to any scale of network, such as a local area network, a metropolitan area network, a wide area network, the Internet, etc.
- FIG. 2illustrates a dashboard with a single element or graph having a time window and a future time buffer in accordance with the principles of the present invention.
- the monitoring server 116 or monitoring client 120may provide a display shown as dashboard 200 .
- the dashboard 200may comprise a graph that is configured as shown in FIG. 2 .
- a dashboard 200is displaying a single graph for a time-varying metric.
- the time window 202may be segmented based on a time interval 204 .
- the time interval 204may be any appropriate size, such as seconds, minutes, hours, days, etc.
- updatesmay, for example, come in every second, every minute, etc.
- FIG. 2shows a single graph, the embodiments allow the dashboard 200 to show multiple time-varying metrics together in the same display panel and using the same time axis.
- FIGS. 4A-4Dillustrate a dashboard with multiple graphs for different metrics.
- a future time buffer 206is added to the time window 202 .
- updatescan be added to graphs in the dashboard 200 without shifting the data or time axis on every addition of new data points.
- the time window 202when the current live time matches the end of the future time buffer 206 , then the time window 202 will shift forward the amount of the time window 202 and add a future time buffer 206 to provide a buffer of future time in dashboard 200 .
- the future time buffer 206may be sized in various ways. In some embodiments, the future time buffer 206 is determined based on a percentage of the time window 202 , such as approximately 10% of the time window 202 . Accordingly, the future time buffer 206 allows data in the dashboard 200 to continue to fill in at its normal rate, but allows the dashboard 200 to update its common time axis and shift the time window 202 at fixed or dynamic intervals. This feature allows, among other things, a better visual experience and conservation of processing resources.
- the size of the future time buffer 206may be rounded to the nearest round time interval.
- a pre-determined set of round time intervalssuch as 1 day; 12 hours; 8 hours; 4 hours; 1 hour; 30 minutes; 15 minutes; 10 minutes; 5 minutes; 1 minute; 30 seconds; 15 seconds; 10 seconds, etc. are used to determine the size of the future time buffer 206 .
- the set of round time intervalsmay also be determined dynamically.
- the future time buffer 206may also be checked to ensure that it is at least a minimum size.
- the size of the future time buffer 206may be required to be greater than or equal to a threshold percentage of the size of the time interval 204 , such as 75%, 80%, 90%, etc.
- a time window 202may be 15 minutes and segmented into intervals 204 of 1 minute.
- the monitoring server 116 or monitoring client 120may then round to the nearest round interval. In the present example, the nearest round interval may be 1 minute. Therefore, in the example provided above, the dashboard 200 may employ a future time buffer 206 of 1 minute.
- FIG. 3illustrates an exemplary process flow for displaying a dashboard.
- the application monitoring system 100receives a desired duration for the time window 202 .
- the durationmay be provided to the system 100 in a variety of ways. For example, a user may access monitoring client 120 and specify a desired duration for the time window 202 . Alternatively, the monitoring server 116 may determine the duration of time window 202 .
- the future time buffer 206is determined for the time window 202 .
- the monitoring server 116 or monitoring client 120may determine the future time buffer 206 .
- the monitoring server 116may stream data and specify the duration for time window 202 and future time buffer 206 for a dashboard 200 displayed on monitoring client 120 .
- the monitoring client 120may itself control the configuration of the dashboard 200 , for example, based on user preferences.
- the future time buffer 206is determined based on a percentage of the time window 202 relative to the size of the time interval 204 by which time window 202 is segmented and the nearest round interval.
- the future time buffer 206may be based on percentages, such as 5%, 10%, 15%, etc. of the time window 202 .
- the time interval 204may be various sizes, such as 1 second, 10 seconds, 30 seconds, 1 minute, 1 hour, etc.
- various round intervalsmay be specified for the use of future time buffer 206 such as 1 day; 12 hours; 8 hours; 4 hours; 1 hour; 30 minutes; 15 minutes; 10 minutes; 5 minutes; 1 minute; 30 seconds; 15 seconds; 10 seconds, etc.
- the use of these parameters for determining the future time buffer 206provides several advantages. First, it provides a large enough future time buffer 206 to allow for different update intervals used by the various metrics displayed in the dashboard 200 . Second, the embodiments attempt to provide a future time buffer 206 that is small enough that it doesn't interfere with the responsiveness of the dashboard 200 . Other advantages and uses of the future time buffer 206 may be recognized by those skilled in the art.
- the dashboard 200is checked for whether the current time has reached the end of the future time buffer 206 . If not, then processing repeats. If yes, then processing proceeds to phase 306 .
- the future time buffer 206allows data for different graphs in the dashboard 200 to continue to fill in at their normal rate, but allows the dashboard 200 to update its common time axis and shift the time window 202 at fixed or dynamic intervals. For example, data for one graph may fill in, and in effect, overflow into the future time buffer 206 , while another graph is awaiting updates.
- the future time buffer 206provides a buffer for some of the graphs in dashboard 200 to update without disturbing other graphs that are still awaiting updates.
- the dashboard 200shifts the time window forward.
- the dashboard 200shifts the time window 202 in one of various ways.
- the dashboard 200may shift the time window 202 by the amount of the future time buffer 206 .
- the dashboard 200may shift the time window 202 forward by one or more time intervals 204 , such as 1 minute, 2 minutes, etc.
- the dashboard 200adds the future time buffer 206 to the shifted time window 202 .
- the dashboard 200may use the same size for future time buffer 206 .
- the dashboard 200may recalculate the size of the future time buffer 206 each time when shifting time window 202 forward.
- other variationsmay be implemented in the embodiments.
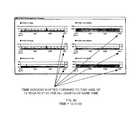
- FIGS. 4A-4Dillustrate examples of a dashboard with multiple graphs employing a future time buffer in accordance with the principles of the present invention.
- the initial axiswill preferably have clean start and end times that are divisible by the time buffer, e.g. 12:15:00 and 012:16:00.
- FIGS. 4B-4Dshow examples of updates to one or more of the graphs in a dashboard without having to update the unaffected graphs. That is, the use of a future time buffer effectively dampens or reduces the effective update frequency of the time window that is shared across all of the graphs in a dashboard.
- the time window of the graphsmust be shifted and the graphs redrawn each time data is updated for any one of the graphs.
- the graphsmay be redrawn an excessive number of times, thereby consuming valuable processing resources and creating a visually unappealing display (i.e. where the time axis is constantly changing). For example, if one graph is updated every 15 seconds, another every 30 seconds, and another every minute, then a conventional display will shift the time window and redraw all three graphs at least four times every minute.
- the embodimentscan be configured to shift the time window and redraw the graphs only once in the presence of this same mix of updates.
- the prior art approachis especially problematic for asynchronous updates, which may arrive at virtually any time relative to each other. For example, even where multiple graphs are receiving updates at the same time interval (e.g., every 30 seconds), those updates may not be synchronized. Accordingly, a first graph may receive its 30-second update at one time, a second graph may receive its 30-second update at another time, and so on. These asynchronous updates will thus multiply the number of times that the graphs must be redrawn. Therefore, where multiple graphs are time-aligned, conventional dashboards may consume an excessive amount of resources to maintain the time-alignment by redrawing all of the graphs after each individual graph receives updated data.
- each dashboardshows four graphs showing CPU metrics, which are getting data updates every 15 seconds, and two graphs showing memory metrics, which are getting data updates every 45 seconds. That is, the graphs for the memory metrics are updating slower than the graphs for the CPU metrics.
- the dashboardsdisplay a 15-minute time window and use a future time buffer of 1 minute using a 10% portion of the time window and a 90% threshold of the interval.
- the six graphsare aligned to the same time window and future time buffer, i.e., the time axis spans from 12:15:00 to 12:31:00.
- the highest round interval, 1 minuteis thus the time buffer.
- the dashboardshows data from 12:15:00 to 12:31:00, i.e., the 15-minute time window plus a 1-minute future time buffer.
- the dashboardshows exemplary metrics collected for application monitoring, such as CPU usage, CPU interrupts, memory usage, and free memory.
- the embodimentsmay be used for displaying any type of data, especially any sort of real-time, asynchronously updated data.
- the dashboardis now shown after 15 seconds have elapsed, i.e., the time is now 12:30:15.
- the dashboardis still on the same time axis of data, i.e., 12:15:00 to 12:31:00.
- updates for the four CPU graphsare filled in and are now shown in the future time buffer, i.e., the period from 12:30:00 to 12:31:00.
- the two memory graphshave not yet been updated. Notably, all of the graphs remain on the same time axis of 12:15:00 to 12:31:00 and do not have to be redrawn yet.
- the dashboardis now shown after 45 seconds have elapsed, i.e., the time is now 12:15:45. Updates have been received for memory usage and free memory and have filled in to the appropriate graphs. Of note, however, the graphs of the dashboard do not have to be redrawn because these new updates can be displayed in the future time buffer. In contrast, in a conventional dashboard display, these new updates to the memory metrics would require further redrawing of all the dashboard graphs. Accordingly, in this example, the embodiments have avoided the need for at least three (i.e. after 15, 30, and 45 seconds) and as many as fourteen (i.e. where all of the data updates arrive asynchronously) redraws of the dashboard graphs.
- the dashboardhas shifted the time window forward by 1 minute, i.e., the time axis now starts at 12:16:00.
- the dashboardhas also added the future time buffer again, and thus, the time axis ends at 12:32:00.
- the embodimentsreduce the frequency that the graphs and display elements have to be redrawn, especially in the presence of asynchronous updates.
- the graphs in a conventional dashboardwould have been redrawn at least four times and as many as eighteen times, this example of the embodiments only requires one redrawing for the same time period.
- the embodimentsprovide a more intuitive display that is also efficient in the use of processing resources needed by the monitoring server 116 or monitoring client 120 .
Landscapes
- Engineering & Computer Science (AREA)
- Data Mining & Analysis (AREA)
- Computer Networks & Wireless Communication (AREA)
- Signal Processing (AREA)
- Environmental & Geological Engineering (AREA)
- Debugging And Monitoring (AREA)
Abstract
Description
Claims (19)
Priority Applications (1)
| Application Number | Priority Date | Filing Date | Title |
|---|---|---|---|
| US13/715,381US9461896B2 (en) | 2011-12-15 | 2012-12-14 | Methods and systems for efficient updating of time-aligned graphs in a monitoring system |
Applications Claiming Priority (2)
| Application Number | Priority Date | Filing Date | Title |
|---|---|---|---|
| US201161576172P | 2011-12-15 | 2011-12-15 | |
| US13/715,381US9461896B2 (en) | 2011-12-15 | 2012-12-14 | Methods and systems for efficient updating of time-aligned graphs in a monitoring system |
Publications (2)
| Publication Number | Publication Date |
|---|---|
| US20130159512A1 US20130159512A1 (en) | 2013-06-20 |
| US9461896B2true US9461896B2 (en) | 2016-10-04 |
Family
ID=48611367
Family Applications (1)
| Application Number | Title | Priority Date | Filing Date |
|---|---|---|---|
| US13/715,381Active2035-05-12US9461896B2 (en) | 2011-12-15 | 2012-12-14 | Methods and systems for efficient updating of time-aligned graphs in a monitoring system |
Country Status (1)
| Country | Link |
|---|---|
| US (1) | US9461896B2 (en) |
Cited By (1)
| Publication number | Priority date | Publication date | Assignee | Title |
|---|---|---|---|---|
| US20160134486A1 (en)* | 2014-11-07 | 2016-05-12 | Itamar Haber | Systems, methods, and media for presenting metric data |
Families Citing this family (17)
| Publication number | Priority date | Publication date | Assignee | Title |
|---|---|---|---|---|
| US20150120373A1 (en)* | 2013-10-25 | 2015-04-30 | Jabil Circuit, Inc. | Systems and methods for risk processing and visualization of supply chain management system data |
| US8819208B2 (en) | 2010-03-05 | 2014-08-26 | Solidfire, Inc. | Data deletion in a distributed data storage system |
| US9054992B2 (en) | 2011-12-27 | 2015-06-09 | Solidfire, Inc. | Quality of service policy sets |
| US9838269B2 (en) | 2011-12-27 | 2017-12-05 | Netapp, Inc. | Proportional quality of service based on client usage and system metrics |
| WO2014149154A1 (en)* | 2013-03-15 | 2014-09-25 | Battelle Memorial Institute | Multi-domain situational awareness for infrastructure monitoring |
| US12423637B2 (en) | 2013-10-25 | 2025-09-23 | Jabil Inc. | Systems and methods for providing diagnostics for a supply chain |
| US10489396B2 (en) | 2014-01-30 | 2019-11-26 | International Business Machines Corporation | Asynchronous updates of management policies in content management systems |
| US20150244795A1 (en) | 2014-02-21 | 2015-08-27 | Solidfire, Inc. | Data syncing in a distributed system |
| EP2998912A1 (en)* | 2014-09-19 | 2016-03-23 | Siemens Aktiengesellschaft | Method, system and web application for monitoring a manufacturing process |
| US9836229B2 (en) | 2014-11-18 | 2017-12-05 | Netapp, Inc. | N-way merge technique for updating volume metadata in a storage I/O stack |
| US9608880B1 (en) | 2015-02-19 | 2017-03-28 | Dell Products L.P. | Systems and methods for real-time performance monitoring |
| US9762460B2 (en)* | 2015-03-24 | 2017-09-12 | Netapp, Inc. | Providing continuous context for operational information of a storage system |
| US10536355B1 (en)* | 2015-06-17 | 2020-01-14 | EMC IP Holding Company LLC | Monitoring and analytics system |
| US10929022B2 (en) | 2016-04-25 | 2021-02-23 | Netapp. Inc. | Space savings reporting for storage system supporting snapshot and clones |
| US10642763B2 (en) | 2016-09-20 | 2020-05-05 | Netapp, Inc. | Quality of service policy sets |
| US11140242B2 (en)* | 2017-12-15 | 2021-10-05 | New Relic, Inc. | System for processing coherent data |
| JP6997337B2 (en)* | 2018-04-12 | 2022-01-17 | ヒタチ ヴァンタラ エルエルシー | User interface optimization for delayed data |
Citations (9)
| Publication number | Priority date | Publication date | Assignee | Title |
|---|---|---|---|---|
| US6097399A (en)* | 1998-01-16 | 2000-08-01 | Honeywell Inc. | Display of visual data utilizing data aggregation |
| US20030110007A1 (en)* | 2001-07-03 | 2003-06-12 | Altaworks Corporation | System and method for monitoring performance metrics |
| US7027051B2 (en)* | 2001-06-29 | 2006-04-11 | International Business Machines Corporation | Graphical user interface for visualization of sampled data compared to entitled or reference levels |
| US7324535B1 (en)* | 2003-04-10 | 2008-01-29 | Cisco Technology, Inc. | Methods and apparatus for maintaining a queue |
| US20090044171A1 (en)* | 2007-07-12 | 2009-02-12 | The Mathworks, Inc. | Continuous time mode-driven simulations in a graphical modeling environment |
| US20100318931A1 (en)* | 2009-06-10 | 2010-12-16 | International Business Machines Corporation | Model-Driven Display of Metric Annotations On A Resource/Relationship Graph |
| US20120173215A1 (en)* | 2010-12-30 | 2012-07-05 | Cerner Innovation, Inc. | Real-Time Predictive Simulation Modeling |
| US8250257B1 (en)* | 2010-12-08 | 2012-08-21 | Emc Corporation | Techniques for balancing system I/O load |
| US20130106861A1 (en)* | 2011-11-02 | 2013-05-02 | International Business Machines Corporation | Simplified graphical analysis of multiple data series |
- 2012
- 2012-12-14USUS13/715,381patent/US9461896B2/enactiveActive
Patent Citations (9)
| Publication number | Priority date | Publication date | Assignee | Title |
|---|---|---|---|---|
| US6097399A (en)* | 1998-01-16 | 2000-08-01 | Honeywell Inc. | Display of visual data utilizing data aggregation |
| US7027051B2 (en)* | 2001-06-29 | 2006-04-11 | International Business Machines Corporation | Graphical user interface for visualization of sampled data compared to entitled or reference levels |
| US20030110007A1 (en)* | 2001-07-03 | 2003-06-12 | Altaworks Corporation | System and method for monitoring performance metrics |
| US7324535B1 (en)* | 2003-04-10 | 2008-01-29 | Cisco Technology, Inc. | Methods and apparatus for maintaining a queue |
| US20090044171A1 (en)* | 2007-07-12 | 2009-02-12 | The Mathworks, Inc. | Continuous time mode-driven simulations in a graphical modeling environment |
| US20100318931A1 (en)* | 2009-06-10 | 2010-12-16 | International Business Machines Corporation | Model-Driven Display of Metric Annotations On A Resource/Relationship Graph |
| US8250257B1 (en)* | 2010-12-08 | 2012-08-21 | Emc Corporation | Techniques for balancing system I/O load |
| US20120173215A1 (en)* | 2010-12-30 | 2012-07-05 | Cerner Innovation, Inc. | Real-Time Predictive Simulation Modeling |
| US20130106861A1 (en)* | 2011-11-02 | 2013-05-02 | International Business Machines Corporation | Simplified graphical analysis of multiple data series |
Cited By (1)
| Publication number | Priority date | Publication date | Assignee | Title |
|---|---|---|---|---|
| US20160134486A1 (en)* | 2014-11-07 | 2016-05-12 | Itamar Haber | Systems, methods, and media for presenting metric data |
Also Published As
| Publication number | Publication date |
|---|---|
| US20130159512A1 (en) | 2013-06-20 |
Similar Documents
| Publication | Publication Date | Title |
|---|---|---|
| US9461896B2 (en) | Methods and systems for efficient updating of time-aligned graphs in a monitoring system | |
| AU2023201395B2 (en) | Data stream processing language for analyzing instrumented software | |
| JP6989628B2 (en) | Optimizing user interface data caching for future actions | |
| EP3404899B1 (en) | Adaptive computation and faster computer operation | |
| US8904243B2 (en) | Event management systems and methods | |
| JP5450841B2 (en) | Mechanisms for supporting user content feeds | |
| US10469979B2 (en) | Managing data access in mobile devices | |
| US9378337B2 (en) | Data item deletion in a database system | |
| US9910755B2 (en) | Retrieval of authoritative measurement data from in-memory datastores | |
| US9882830B2 (en) | Architecture for metrics aggregation without service partitioning | |
| US20160378552A1 (en) | Automatic scaling of computing resources using aggregated metrics | |
| EP2877944B1 (en) | Heuristic caching to personalize applications | |
| US9882982B2 (en) | Datastore for aggregated measurements for metrics | |
| US11537576B2 (en) | Assisted problem identification in a computing system | |
| CN109684079B (en) | Display data processing method and device and electronic equipment | |
| US10324943B2 (en) | Auto-monitoring and adjustment of dynamic data visualizations | |
| US8306953B2 (en) | Online management of historical data for efficient reporting and analytics | |
| US20240176732A1 (en) | Advanced application of model operations in energy | |
| US9880919B2 (en) | Aggregation of metrics data with fine granularity | |
| Nieke et al. | Analysis of CERN computing infrastructure and monitoring data | |
| CN113760671A (en) | Online task diagnosis method and device and electronic equipment | |
| Hou et al. | An autonomic monitoring framework of web service-enabled application software for the hybrid distributed HPC infrastructure | |
| CN118528773A (en) | Data display method, device and vehicle-mounted system applied to vehicle-mounted processor | |
| CN118233389A (en) | Access flow control method and device | |
| CN114490079A (en) | Distributed processing method, apparatus, device, medium, and program product for multiple data sources |
Legal Events
| Date | Code | Title | Description |
|---|---|---|---|
| AS | Assignment | Owner name:OPNET TECHNOLOGIES, INC., MARYLAND Free format text:ASSIGNMENT OF ASSIGNORS INTEREST;ASSIGNORS:GROVES, GREG;ROGNER, ERIC;BERMAN, DAVID;REEL/FRAME:029473/0805 Effective date:20121214 | |
| AS | Assignment | Owner name:OPNET TECHNOLOGIES LLC, MARYLAND Free format text:CHANGE OF NAME;ASSIGNOR:OPNET TECHNOLOGIES, INC.;REEL/FRAME:030411/0290 Effective date:20130401 | |
| AS | Assignment | Owner name:RIVERBED TECHNOLOGY, INC., CALIFORNIA Free format text:ASSIGNMENT OF ASSIGNORS INTEREST;ASSIGNOR:OPNET TECHNOLOGIES LLC;REEL/FRAME:030459/0372 Effective date:20130401 | |
| AS | Assignment | Owner name:JPMORGAN CHASE BANK, N.A., AS ADMINISTRATIVE AGENT, NEW YORK Free format text:PATENT SECURITY AGREEMENT;ASSIGNOR:RIVERBED TECHNOLOGY, INC.;REEL/FRAME:032421/0162 Effective date:20131220 Owner name:JPMORGAN CHASE BANK, N.A., AS ADMINISTRATIVE AGENT Free format text:PATENT SECURITY AGREEMENT;ASSIGNOR:RIVERBED TECHNOLOGY, INC.;REEL/FRAME:032421/0162 Effective date:20131220 | |
| AS | Assignment | Owner name:RIVERBED TECHNOLOGY, INC., CALIFORNIA Free format text:RELEASE OF SECURITY INTEREST IN PATENTS;ASSIGNOR:BARCLAYS BANK PLC;REEL/FRAME:035521/0069 Effective date:20150424 | |
| AS | Assignment | Owner name:MORGAN STANLEY SENIOR FUNDING, INC., AS COLLATERAL AGENT, NEW YORK Free format text:SECURITY INTEREST;ASSIGNOR:RIVERBED TECHNOLOGY, INC.;REEL/FRAME:035561/0363 Effective date:20150424 Owner name:MORGAN STANLEY SENIOR FUNDING, INC., AS COLLATERAL Free format text:SECURITY INTEREST;ASSIGNOR:RIVERBED TECHNOLOGY, INC.;REEL/FRAME:035561/0363 Effective date:20150424 | |
| AS | Assignment | Owner name:RIVERBED TECHNOLOGY, INC., CALIFORNIA Free format text:CORRECTIVE ASSIGNMENT TO CORRECT THE CONVEYING PARTY NAME PREVIOUSLY RECORDED ON REEL 035521 FRAME 0069. ASSIGNOR(S) HEREBY CONFIRMS THE RELEASE OF SECURITY INTEREST IN PATENTS;ASSIGNOR:JPMORGAN CHASE BANK, N.A.;REEL/FRAME:035807/0680 Effective date:20150424 | |
| FEPP | Fee payment procedure | Free format text:PAYOR NUMBER ASSIGNED (ORIGINAL EVENT CODE: ASPN); ENTITY STATUS OF PATENT OWNER: LARGE ENTITY | |
| STCF | Information on status: patent grant | Free format text:PATENTED CASE | |
| MAFP | Maintenance fee payment | Free format text:PAYMENT OF MAINTENANCE FEE, 4TH YEAR, LARGE ENTITY (ORIGINAL EVENT CODE: M1551); ENTITY STATUS OF PATENT OWNER: LARGE ENTITY Year of fee payment:4 | |
| AS | Assignment | Owner name:ALTER DOMUS (US) LLC, AS COLLATERAL AGENT, ILLINOIS Free format text:PATENT SECURITY AGREEMENT;ASSIGNOR:RIVERBED TECHNOLOGY, INC.;REEL/FRAME:055514/0249 Effective date:20201231 | |
| AS | Assignment | Owner name:MACQUARIE CAPITAL FUNDING LLC, NEW YORK Free format text:SECURITY INTEREST;ASSIGNORS:RIVERBED HOLDINGS, INC.;RIVERBED TECHNOLOGY, INC.;ATERNITY LLC;REEL/FRAME:056397/0750 Effective date:20210420 | |
| AS | Assignment | Owner name:ATERNITY LLC, CALIFORNIA Free format text:RELEASE OF SECURITY INTEREST IN PATENTS RECORED AT REEL 056397, FRAME 0750;ASSIGNOR:MACQUARIE CAPITAL FUNDING LLC;REEL/FRAME:057983/0356 Effective date:20211012 Owner name:RIVERBED TECHNOLOGY, INC., CALIFORNIA Free format text:RELEASE OF SECURITY INTEREST IN PATENTS RECORED AT REEL 056397, FRAME 0750;ASSIGNOR:MACQUARIE CAPITAL FUNDING LLC;REEL/FRAME:057983/0356 Effective date:20211012 Owner name:RIVERBED HOLDINGS, INC., CALIFORNIA Free format text:RELEASE OF SECURITY INTEREST IN PATENTS RECORED AT REEL 056397, FRAME 0750;ASSIGNOR:MACQUARIE CAPITAL FUNDING LLC;REEL/FRAME:057983/0356 Effective date:20211012 | |
| AS | Assignment | Owner name:ALTER DOMUS (US) LLC, AS COLLATERAL AGENT, ILLINOIS Free format text:PATENT SECURITY AGREEMENT SUPPLEMENT - SECOND LIEN;ASSIGNORS:RIVERBED HOLDINGS, INC.;RIVERBED TECHNOLOGY, INC.;ATERNITY LLC;REEL/FRAME:057810/0559 Effective date:20211013 Owner name:MORGAN STANLEY SENIOR FUNDING, INC., AS COLLATERAL AGENT, MARYLAND Free format text:PATENT SECURITY AGREEMENT SUPPLEMENT - FIRST LIEN;ASSIGNORS:RIVERBED HOLDINGS, INC.;RIVERBED TECHNOLOGY, INC.;ATERNITY LLC;REEL/FRAME:057810/0502 Effective date:20211013 | |
| AS | Assignment | Owner name:WILMINGTON TRUST, NATIONAL ASSOCIATION, MINNESOTA Free format text:PATENT SECURITY AGREEMENT;ASSIGNORS:RIVERBED TECHNOLOGY, INC.;ATERNITY LLC;REEL/FRAME:057943/0386 Effective date:20211013 | |
| AS | Assignment | Owner name:WILMINGTON TRUST, NATIONAL ASSOCIATION, AS U.S. COLLATERAL AGENT, MINNESOTA Free format text:SECURITY INTEREST;ASSIGNORS:RIVERBED TECHNOLOGY LLC (FORMERLY RIVERBED TECHNOLOGY, INC.);ATERNITY LLC;REEL/FRAME:058486/0216 Effective date:20211207 | |
| AS | Assignment | Owner name:ATERNITY LLC, MASSACHUSETTS Free format text:TERMINATION AND RELEASE OF SECURITY INTEREST IN PATENTS;ASSIGNOR:WILMINGTON TRUST, NATIONAL ASSOCIATION, AS U.S. COLLATERAL AGENT;REEL/FRAME:058593/0169 Effective date:20211207 Owner name:RIVERBED TECHNOLOGY, INC., CALIFORNIA Free format text:TERMINATION AND RELEASE OF SECURITY INTEREST IN PATENTS;ASSIGNOR:WILMINGTON TRUST, NATIONAL ASSOCIATION, AS U.S. COLLATERAL AGENT;REEL/FRAME:058593/0169 Effective date:20211207 Owner name:ATERNITY LLC, MASSACHUSETTS Free format text:TERMINATION AND RELEASE OF SECURITY INTEREST IN PATENTS;ASSIGNOR:ALTER DOMUS (US) LLC, AS COLLATERAL AGENT;REEL/FRAME:058593/0108 Effective date:20211207 Owner name:RIVERBED TECHNOLOGY, INC., CALIFORNIA Free format text:TERMINATION AND RELEASE OF SECURITY INTEREST IN PATENTS;ASSIGNOR:ALTER DOMUS (US) LLC, AS COLLATERAL AGENT;REEL/FRAME:058593/0108 Effective date:20211207 Owner name:ATERNITY LLC, MASSACHUSETTS Free format text:TERMINATION AND RELEASE OF SECURITY INTEREST IN PATENTS;ASSIGNOR:MORGAN STANLEY SENIOR FUNDING, INC., AS COLLATERAL AGENT;REEL/FRAME:058593/0046 Effective date:20211207 Owner name:RIVERBED TECHNOLOGY, INC., CALIFORNIA Free format text:TERMINATION AND RELEASE OF SECURITY INTEREST IN PATENTS;ASSIGNOR:MORGAN STANLEY SENIOR FUNDING, INC., AS COLLATERAL AGENT;REEL/FRAME:058593/0046 Effective date:20211207 | |
| AS | Assignment | Owner name:RIVERBED TECHNOLOGY LLC, CALIFORNIA Free format text:CHANGE OF NAME;ASSIGNOR:RIVERBED TECHNOLOGY, INC.;REEL/FRAME:059232/0551 Effective date:20211207 | |
| AS | Assignment | Owner name:RIVERBED HOLDINGS, INC., CALIFORNIA Free format text:RELEASE BY SECURED PARTY;ASSIGNOR:ALTER DOMUS (US) LLC, AS COLLATERAL AGENT;REEL/FRAME:064673/0739 Effective date:20211207 Owner name:ATERNITY LLC, MASSACHUSETTS Free format text:RELEASE BY SECURED PARTY;ASSIGNOR:ALTER DOMUS (US) LLC, AS COLLATERAL AGENT;REEL/FRAME:064673/0739 Effective date:20211207 Owner name:RIVERBED TECHNOLOGY, INC., CALIFORNIA Free format text:RELEASE BY SECURED PARTY;ASSIGNOR:ALTER DOMUS (US) LLC, AS COLLATERAL AGENT;REEL/FRAME:064673/0739 Effective date:20211207 | |
| MAFP | Maintenance fee payment | Free format text:PAYMENT OF MAINTENANCE FEE, 8TH YEAR, LARGE ENTITY (ORIGINAL EVENT CODE: M1552); ENTITY STATUS OF PATENT OWNER: LARGE ENTITY Year of fee payment:8 |