US9342903B2 - Method for generating image for PET attenuation correction from MR image and computer program - Google Patents
Method for generating image for PET attenuation correction from MR image and computer programDownload PDFInfo
- Publication number
- US9342903B2 US9342903B2US14/385,683US201314385683AUS9342903B2US 9342903 B2US9342903 B2US 9342903B2US 201314385683 AUS201314385683 AUS 201314385683AUS 9342903 B2US9342903 B2US 9342903B2
- Authority
- US
- United States
- Prior art keywords
- image
- standard
- attenuation correction
- pet
- radiation attenuation
- Prior art date
- Legal status (The legal status is an assumption and is not a legal conclusion. Google has not performed a legal analysis and makes no representation as to the accuracy of the status listed.)
- Expired - Fee Related
Links
- 0CC*1(C)CCCCC1Chemical compoundCC*1(C)CCCCC10.000description2
Images


Classifications
- G—PHYSICS
- G06—COMPUTING OR CALCULATING; COUNTING
- G06T—IMAGE DATA PROCESSING OR GENERATION, IN GENERAL
- G06T11/00—2D [Two Dimensional] image generation
- G06T11/003—Reconstruction from projections, e.g. tomography
- G06T11/005—Specific pre-processing for tomographic reconstruction, e.g. calibration, source positioning, rebinning, scatter correction, retrospective gating
- A—HUMAN NECESSITIES
- A61—MEDICAL OR VETERINARY SCIENCE; HYGIENE
- A61B—DIAGNOSIS; SURGERY; IDENTIFICATION
- A61B5/00—Measuring for diagnostic purposes; Identification of persons
- A61B5/0033—Features or image-related aspects of imaging apparatus, e.g. for MRI, optical tomography or impedance tomography apparatus; Arrangements of imaging apparatus in a room
- A61B5/0035—Features or image-related aspects of imaging apparatus, e.g. for MRI, optical tomography or impedance tomography apparatus; Arrangements of imaging apparatus in a room adapted for acquisition of images from more than one imaging mode, e.g. combining MRI and optical tomography
- A—HUMAN NECESSITIES
- A61—MEDICAL OR VETERINARY SCIENCE; HYGIENE
- A61B—DIAGNOSIS; SURGERY; IDENTIFICATION
- A61B5/00—Measuring for diagnostic purposes; Identification of persons
- A61B5/05—Detecting, measuring or recording for diagnosis by means of electric currents or magnetic fields; Measuring using microwaves or radio waves
- A61B5/055—Detecting, measuring or recording for diagnosis by means of electric currents or magnetic fields; Measuring using microwaves or radio waves involving electronic [EMR] or nuclear [NMR] magnetic resonance, e.g. magnetic resonance imaging
- A—HUMAN NECESSITIES
- A61—MEDICAL OR VETERINARY SCIENCE; HYGIENE
- A61B—DIAGNOSIS; SURGERY; IDENTIFICATION
- A61B6/00—Apparatus or devices for radiation diagnosis; Apparatus or devices for radiation diagnosis combined with radiation therapy equipment
- A61B6/02—Arrangements for diagnosis sequentially in different planes; Stereoscopic radiation diagnosis
- A61B6/03—Computed tomography [CT]
- A61B6/037—Emission tomography
- G—PHYSICS
- G01—MEASURING; TESTING
- G01R—MEASURING ELECTRIC VARIABLES; MEASURING MAGNETIC VARIABLES
- G01R33/00—Arrangements or instruments for measuring magnetic variables
- G01R33/20—Arrangements or instruments for measuring magnetic variables involving magnetic resonance
- G01R33/44—Arrangements or instruments for measuring magnetic variables involving magnetic resonance using nuclear magnetic resonance [NMR]
- G01R33/48—NMR imaging systems
- G01R33/4808—Multimodal MR, e.g. MR combined with positron emission tomography [PET], MR combined with ultrasound or MR combined with computed tomography [CT]
- G01R33/481—MR combined with positron emission tomography [PET] or single photon emission computed tomography [SPECT]
- G—PHYSICS
- G01—MEASURING; TESTING
- G01T—MEASUREMENT OF NUCLEAR OR X-RADIATION
- G01T1/00—Measuring X-radiation, gamma radiation, corpuscular radiation, or cosmic radiation
- G01T1/16—Measuring radiation intensity
- G01T1/1603—Measuring radiation intensity with a combination of at least two different types of detector
- G06T7/0081—
- G—PHYSICS
- G06—COMPUTING OR CALCULATING; COUNTING
- G06T—IMAGE DATA PROCESSING OR GENERATION, IN GENERAL
- G06T7/00—Image analysis
- G06T7/10—Segmentation; Edge detection
- G06T7/11—Region-based segmentation
- A—HUMAN NECESSITIES
- A61—MEDICAL OR VETERINARY SCIENCE; HYGIENE
- A61B—DIAGNOSIS; SURGERY; IDENTIFICATION
- A61B2576/00—Medical imaging apparatus involving image processing or analysis
- A61B2576/02—Medical imaging apparatus involving image processing or analysis specially adapted for a particular organ or body part
- A61B2576/026—Medical imaging apparatus involving image processing or analysis specially adapted for a particular organ or body part for the brain
- G—PHYSICS
- G06—COMPUTING OR CALCULATING; COUNTING
- G06T—IMAGE DATA PROCESSING OR GENERATION, IN GENERAL
- G06T2207/00—Indexing scheme for image analysis or image enhancement
- G06T2207/10—Image acquisition modality
- G06T2207/10072—Tomographic images
- G06T2207/10088—Magnetic resonance imaging [MRI]
- G—PHYSICS
- G06—COMPUTING OR CALCULATING; COUNTING
- G06T—IMAGE DATA PROCESSING OR GENERATION, IN GENERAL
- G06T2207/00—Indexing scheme for image analysis or image enhancement
- G06T2207/10—Image acquisition modality
- G06T2207/10072—Tomographic images
- G06T2207/10104—Positron emission tomography [PET]
- G—PHYSICS
- G06—COMPUTING OR CALCULATING; COUNTING
- G06T—IMAGE DATA PROCESSING OR GENERATION, IN GENERAL
- G06T2207/00—Indexing scheme for image analysis or image enhancement
- G06T2207/30—Subject of image; Context of image processing
- G06T2207/30004—Biomedical image processing
- G—PHYSICS
- G06—COMPUTING OR CALCULATING; COUNTING
- G06T—IMAGE DATA PROCESSING OR GENERATION, IN GENERAL
- G06T2211/00—Image generation
- G06T2211/40—Computed tomography
- G06T2211/464—Dual or multimodal imaging, i.e. combining two or more imaging modalities
- G—PHYSICS
- G16—INFORMATION AND COMMUNICATION TECHNOLOGY [ICT] SPECIALLY ADAPTED FOR SPECIFIC APPLICATION FIELDS
- G16H—HEALTHCARE INFORMATICS, i.e. INFORMATION AND COMMUNICATION TECHNOLOGY [ICT] SPECIALLY ADAPTED FOR THE HANDLING OR PROCESSING OF MEDICAL OR HEALTHCARE DATA
- G16H30/00—ICT specially adapted for the handling or processing of medical images
- G16H30/40—ICT specially adapted for the handling or processing of medical images for processing medical images, e.g. editing
Definitions
- the present inventionrelates to a method for generating an image for PET attenuation correction from an MR image and a computer program, and more particularly to a method for generating an image for PET attenuation correction from an MR image by which a high-precision image for PET attenuation correction can be generated when generating an image for PET attenuation correction from an MR image, and a computer program for executing this method.
- Inspection devicescapable of observing inside the human body in a minimally invasive manner, such as X-ray CT (computed tomography) and MRI (magnetic resonance imaging), have become widely available in recent years and been contributing significantly to medical diagnosis.
- Such apparatusesmainly provide a morphological image obtained by visualizing a tissue structure of the living subject as a tomographic image or volume data.
- nuclear medical imagingtypified by PET (positron emission tomography) and SPECT (single photon emission CT) is a device for providing a functional image obtained by quantitatively visualizing physiological information such as glucose consumption, local blood flow, oxygen consumption, and the distribution of neurotransmitter receptors.
- PETpositron emission tomography
- SPECTsingle photon emission CT
- PET/CT simultaneously capable of PET and X-ray CT imaginghas recently been developed and become widespread in the clinical field. This has made possible diagnosis in light of both biological functions and body tissue. For example, in the diagnosis of cancer by PET, only the tumor portion is output with a high intensity. It may therefore be difficult to determine in which organ the tumor is. The superposition with X-ray CT, which provides excellent viewability of the form of the organs, is thus useful.
- PET/MRIto carry out diagnosis in combination with MRI has recently attracted attention.
- MRInot only can visualize the inside of living body with high spatial resolution, but also has the characteristics that the contrast of soft tissue is better than with X-ray CT, and that a functional image such as hemodynamic imaging and metabolic product concentration measurement by MR spectroscopy can be acquired.
- PET/MRIalso has a lot of advantages, including that it is possible to avoid radiation exposure which is a problem with PET/CT. Its implementation is thus much expected (see Non-Patent Literature 1).
- a PET deviceobtains information from annihilation radiations emitted from a radioactive drug reaching detectors.
- PET image reconstructionuses the detection data of annihilation radiations emitted in 180° directions.
- the annihilation radiationsundergo attenuation while passing through various tissues of the body to reach the detectors.
- quantitative performanceis greatly disturbed in deep portions of the subject.
- a spatial distribution of radiation attenuation coefficient (p-map) needed for attenuation correction in the conventional PET image reconstructionis created on the basis of transmission measurement (referred to as transmission scan) separate from the data acquisition of the PET.
- the transmission scanis performed by rotating a radiation source 12 around the subject 10 and performing detection with a detector 14 as illustrated in FIG. 1 (see Patent Literatures 1 to 3).
- attenuation correctionis usually performed by converting the X-ray CT image into a ⁇ -map without the foregoing transmission scan.
- MRIcollects intensities obtained from protons (hydrogen nuclei) in tissues, and therefore cannot directly obtain the radiation attenuation rate of the respective tissues. Since the current design concept of PET/MRI does not include a transmission source similar to that of X-ray CT, a method for generating a ⁇ -map as an alternative to the transmission scan is needed.
- Non-Patent Literatures 2, 3, and 4As a method for generating a ⁇ -map by using an MR image, a segmentation method (see Non-Patent Literatures 2, 3, and 4) and a standard image reference method (see Non-Patent Literatures 5 and 6) have been proposed so far.
- the segmentation methodas illustrated in FIG. 2 , an MR image m is segmented into regions such as a high intensity region (soft tissue), a medium intensity region (water), and a low intensity region (air and bone) tissue by tissue, and ⁇ values inherent to the tissues are substituted to generate a ⁇ -map.
- the standard image reference methodas illustrated in FIG. 3 , a standard image (standard MR image m s or standard ⁇ -map ⁇ s ) is deformed to the MR image m of the patient by using affine transformation or the like.
- Patent Literature 1Japanese Patent Application Laid-Open No. 2005-283421
- Patent Literature 2Japanese Patent Application Laid-Open No. 2006-284346
- Patent Literature 3Japanese Patent Application Laid-Open No. 2008-22930
- Non-Patent Literature 1Bernd Pichler, Bernhard Scholkopf and Thomas Beyer Schweizer Hofmann, “Towards quantitative PET/MRI: a review of MR-based attenuation correction techniques,” EUROPEAN JOURNAL OF NUCLEAR MEDICINE AND MOLECULAR IMAGING, vol. 36 (Supplement 1), pp. 93-104, March 2009.
- Non-Patent Literature 2E. Rota Kops, P. Qin, M. Mueller-Veggian, and H. Herzog, “Attenuation Correction of PET Scanning Based on MRT-Images,” Nucl. Sci. Symp. & Med. Imag. Conference, 241 2006.
- Non-Patent Literature 3E. Rota Kops and H. Herzog, “Towards an MRI based attenuation correction for brain MR-PET,”2007 BrainPET Conference, May 2007.
- Non-Patent Literature 4H. Zaidi, M.-L. Montandon, and D. O. Slosman, “Magnetic resonance imaging-guided attenuation and scatter corrections in three dimensional brain positron emission tomography,” Med. Phys., vol. 30, pp. 937-948, 2003.
- Non-Patent Literature 5Marie-Louise Montandon and Habib Zaidi, “Atlas-guided non-uniform attenuation correction in cerebral 3D PET imaging,” Neuroimage, vol. 25, no. 1, pp. 278-286, March 2005.
- Non-Patent Literature 6Marie-Louise Montandon and Habib Zaidi, “Quantitative analysis of template-based attenuation compensation in 3D brain PET,” Computerized Medical Imaging and Graphics, vol. 31, pp. 28-38, January 2007.
- the former segmentation methodhas the problem that tissues having very different ⁇ values (in the case of the example, bone and air) are both low intensities in the MR image and are therefore indistinguishable. Blood, which has a ⁇ value equivalent to that of soft tissue, may also be indistinguishable from air and bone.
- the latter standard image reference methodhas, as illustrated in FIG. 3 , the problem of being unable to accommodate individual differences or an affected area such as a space occupying lesion (a cancer, abscess, etc.) and an organic defect.
- the present inventionhas been achieved in order to solve the foregoing conventional problems. It is an object of the present invention to generate an image for PET attenuation correction in which tissues having very different ⁇ values can be distinguished and that can accommodate individual differences and an affected area such as a space occupying lesion (a cancer, abscess, etc.) and an organic defect.
- the present inventionsolves the foregoing problems by, when generating an image for PET attenuation correction from an MR image, segmenting an MR image captured by MRI into regions according to pixel values, determining a radiation attenuation correction value in a region in which a radiation attenuation coefficient is considered to be uniform by referring to an existing radiation attenuation correction value table, and determining a radiation attenuation correction value in a region including multiple tissues having different radiation attenuation coefficients by referring to a standard image.
- the standard imagemay be deformed to an MR image of a subject when the standard image is referred to.
- the standard imagemay be referred to by using an image of whole body tissue or an image of some tissues of the body tissue.
- the standard imagemay be an image for PET attenuation correction, a CT image, or a UTE image.
- a UTE imagerefers to an image that can be generated on the basis of an MRI image captured with an ultrashort echo time (Ultra short TE) and in which bone shows a high intensity value.
- Ultra short TEultrashort echo time
- the MR image and the standard imagemay be adjusted to each other in resolution.
- At least either one of the radiation attenuation correction value table and the standard imagemay be modified according to personal information about the subject (DNA, age, sex, height, weight, place of birth, place of residence, and/or medical history).
- the subject's own radiation attenuation correction values or the image for PET attenuation correction, or the CT image or the UTE imagemay be repeatedly used as at least either one of the radiation attenuation correction value table and the standard image.
- the present inventionalso provides a computer program for making a computer execute any of the methods described above.
- ⁇ values inherent to the tissuesare substituted by the segmentation method.
- ⁇ valuesare determined by referring to the standard image by the standard image reference method. Accurate ⁇ values can thus be assigned to the region in which a distinction cannot be made by using the pixel values of the MR image, while individual differences and an affected area such as a brain defect portion can be accommodated.
- FIG. 1is a diagram showing an outline of a conventional transmission method.
- FIG. 2is a diagram showing a conventional segmentation method.
- FIG. 3is a diagram showing a conventional standard image reference method.
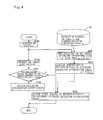
- FIG. 4is a flowchart showing a processing procedure according to a first embodiment of the present invention.
- FIG. 5is a diagram showing examples of images of the first embodiment.
- FIG. 6is a flowchart showing a processing procedure according to a second embodiment of the present invention.
- FIG. 7is a flowchart showing a processing procedure according to a third embodiment of the present invention.
- FIG. 8is a flowchart showing a processing procedure according to a fourth embodiment of the present invention.
- FIG. 9is a flowchart showing a processing procedure according to a fifth embodiment of the present invention.
- FIG. 10is a flowchart showing a processing procedure according to a sixth embodiment of the present invention.
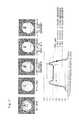
- FIG. 11is a diagram showing examples of ⁇ -maps where a difference in resolution is taken into account by the fourth to sixth embodiments in a comparative manner.
- FIG. 12is a flowchart showing a processing procedure according to a seventh embodiment of the present invention.
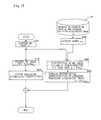
- FIG. 13is a flowchart showing a processing procedure according to an eighth embodiment of the present invention.
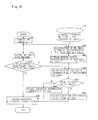
- FIG. 14is a flowchart showing a processing procedure according to a ninth embodiment of the present invention.
- FIG. 15is a flowchart showing a processing procedure according to a tenth embodiment of the present invention.
- FIG. 16is a diagram showing how to classify regions into bone and air regions according to the tenth embodiment.
- FIG. 17is a flowchart showing a processing procedure according to an eleventh embodiment of the present invention.
- FIG. 18is a diagram showing processing results of pseudo sinusitis by the conventional methods and the method of the present invention.
- FIG. 19is a flowchart showing a processing procedure according to a twelfth embodiment of the present invention.
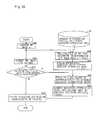
- FIG. 20is a flowchart showing a processing procedure according to a thirteenth embodiment of the present invention.
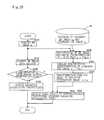
- FIG. 21is a flowchart showing a processing procedure according to a fourteenth embodiment of the present invention.
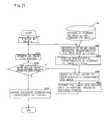
- FIG. 22is a flowchart showing a processing procedure according to a fifteenth embodiment of the present invention.
- FIG. 23is a flowchart showing a processing procedure according to a sixteenth embodiment of the present invention.
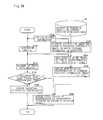
- FIG. 24is a flowchart showing a processing procedure according to a seventeenth embodiment of the present invention.
- a first embodiment of the present inventionis implemented by a procedure shown in FIG. 4 .
- step S 100an MR image m is initially acquired as with the conventional segmentation method.
- step S 110the MR image is divided into, for example, high intensity regions corresponding to soft tissue, medium intensity regions corresponding to water, and low intensity regions corresponding to air and bone on the basis of the pixel values of the MR image.
- step S 120If the determination result of step S 120 is positive and the intensity region is determined to be a region including multiple tissues having different radiation attenuation coefficients, for example, a low intensity region in which air is indistinguishable from bone, the processing proceeds to step S 300 .
- the pixel values of the standard radiation attenuation image ⁇ s morphologically transformed in step S 210are assigned to the low intensity region, whereby different radiation attenuation coefficients are assigned to air and bone.
- FIG. 6shows a second embodiment in which such a problem is solved.
- the MR image having high resolutionis blurred to have resolution equivalent to that of the radiation attenuation image in step S 140 .
- the blurring of step S 140can be used immediately after step S 130 and before the final application of the ⁇ values of the standard image.
- the result (radiation attenuation image) of step S 130 and the standard image (MR image)are equalized in resolution, so that an accurate image can be displayed.
- the application of strong blurringmay lower the radiation attenuation coefficients near bone regions as shown in the schematic diagram of FIG. 6 .
- blurringmay be applied in step S 150 immediately before the end.
- the resolutioncan be adjusted to that of the PET detector, whereby the measurement can be brought close to actual radiation attenuation coefficients.
- the blurringcan be omitted to reduce man-hours and lower the calculation cost.
- FIG. 8shows a fourth embodiment of the present invention in which a difference in resolution is absorbed by a different method.
- step S 120if the determination result of step S 120 is positive, the low intensity region is expanded in step S 290 . Then, in step S 300 , the pixel values of the morphologically transformed standard radiation attenuation image are assigned.
- a drop in the radiation attenuation coefficients near bone regionscan be suppressed to connect the radiation attenuation image and the MR image more smoothly.
- blurringmay be applied immediately before the end.
- FIG. 9shows a fifth embodiment of the present invention in which a difference in resolution is absorbed by yet another method.
- the pixel values of the morphologically transformed standard radiation attenuation imageare assigned in steps S 280 and S 300 before and after the blurring of step S 140 .
- a drop in the radiation attenuation coefficient near bone regionsmay be able to be further suppressed while maintaining the radiation attenuation coefficient (the height H of the image) of bone.
- the effect of the methods according to the second to fifth embodimentsdepends on the degree of the difference in resolution between the original MR image and the radiation attenuation image.
- the amount of blurring in step S 140 and the amount of morphological dilation in S 290 of the fourth embodimenttherefore need to be adjusted.
- FIG. 10shows a sixth embodiment of the present invention in which a difference in resolution is absorbed by yet another method.
- the same morphological dilation S 290 as that of the fourth embodiment shown in FIG. 8is performed at the time of assignment after the blurring processing S 140 .
- the method of the sixth embodimentcan stably correct the difference in resolution between the MR image and the radiation attenuation image.
- FIG. 11shows an MRI image, a true ⁇ -map, and the processing results of the fourth to sixth embodiments in a comparative manner.
- the morphological transformation of the radiation attenuation imageis performed after the registration of the MR images and the standard radiation attenuation image.
- FIG. 12shows a seventh embodiment of the present invention in which bones are extracted first, and morphological transformation is performed on such portions.
- step S 400bone portions ⁇ sb are initially extracted from the database 20 of the standard MR image m s and the standard radiation attenuation image ⁇ s .
- step S 420the morphology of the radiation attenuation image is transformed with respect to the bone portions extracted in step S 400 , and is combined with the radiation attenuation coefficients determined in step S 130 .
- bone portionsare extracted first, and the morphological transformation is performed only on the bone portions. This eliminates the need for the determination of step S 120 , and results in high precision.
- the database 20 of the standard radiation attenuation image ⁇ sis used.
- a database 30 of a standard CT image c smay be used instead.
- step S 530transformation from the CT image c s to the radiation attenuation image ⁇ is determined.
- step S 120determines whether the pixel values of the morphologically transformed standard radiation attenuation image are assigned to, for example, a low intensity region in step S 300 .
- the radiation attenuation coefficientscan be assigned by using the CT image which has a smaller difference in resolution from the MR image.
- the standard imageis subject to a drop in resolution due to averaging processing.
- the processing for absorbing a difference in resolution like the third to sixth embodimentsis thus effective.
- FIG. 14shows a ninth embodiment of the present invention which similarly uses a CT image.
- the pixel values of the morphologically transformed CT imageare referred to in step S 540 with respect to the regions determined to include multiple tissues having different radiation attenuation coefficients in step S 120 .
- the CT imageis segmented into regions only in the portions including the multiple tissues. Then, in step S 130 , the radiation attenuation coefficients of the tissues for radiation are assigned.
- step S 540the processing proceeds to step S 560 to determine whether the region is a high intensity in the CT image. If the determination result is positive and the region is determined to be a bone region, the processing proceeds to step S 570 to assign the radiation attenuation coefficient of bone.
- step S 560determines whether the region is determined to be an air region. If the determination result of step S 560 is negative and the region is determined to be an air region, the processing proceeds to step S 580 to assign the radiation attenuation coefficient of air.
- bone and airare distinguished by using the CT image. This enables highly accurate assignment.
- FIG. 17shows an eleventh embodiment of the present invention which similarly uses a CT image to extract bones.
- the present embodimentincludes processing similar to that of the seventh embodiment shown in FIG. 12 .
- bones c sbare extracted from the database 30 of the standard MR image m s and the standard CT image cs.
- the radiation attenuation coefficient ⁇ sb of boneis assigned.
- the MR imageis registered.
- the morphological transformation of the standard radiation attenuation imageis performed.
- correction processingmay be performed by morphological dilation and erosion and/or nearest neighbor interpolation according to need.
- FIG. 18shows the processing results of an image of a subject with pseudo sinusitis by the conventional methods and the method of the present invention in a comparative manner.
- FIG. 19shows a twelfth embodiment in which the standard radiation attenuation image is used instead of the standard CT image in the ninth embodiment shown in FIG. 14 .
- Differences from the ninth embodimentconsist in that a database 30 of the standard MR image and the standard radiation attenuation image is used as the database, and that in steps S 522 , S 542 , and S 552 , the standard radiation attenuation image is used instead of the standard CT image.
- the present embodimentis the same as the ninth embodiment. A description thereof is thus omitted.
- FIG. 20shows a thirteenth embodiment in which the standard UTE image is used instead of the standard CT image in the eighth embodiment shown in FIG. 13 .
- Differences from the eighth embodimentconsist in that a database 40 of the standard MR image and the standard UTE image is used as the database, and that in steps S 524 and S 534 , the standard UTE image is used instead of the standard CT image.
- the present embodimentis the same as the eighth embodiment. A description thereof is thus omitted.
- FIG. 21shows a fourteenth embodiment in which the standard UTE image is used instead of the standard CT image in the ninth embodiment shown in FIG. 14 .
- Differences from the ninth embodimentconsist in that the database 40 of the standard MR image and the standard UTE image is used as the database, and that in steps S 524 , S 544 , and S 554 , the standard UTE image is used instead of the standard CT image.
- the present embodimentis the same as the ninth embodiment. A description thereof is thus omitted.
- FIG. 22shows a fifteenth embodiment in which the standard UTE image is used instead of the standard CT image in the eleventh embodiment shown in FIG. 17 .
- a difference from the eleventh embodimentconsists in that the database 40 of the standard MR image and the standard UTE image is used as the database.
- the present embodimentis the same as the eleventh embodiment. A description thereof is thus omitted.
- the standard image and/or the radiation attenuation coefficientscan be customized on the basis of personal information about the subject (DNA, age, sex, height, weight, place of birth, place of residence, medical history, and the like) with a further improvement in accuracy.
- S 700represents a step of acquiring personal information.
- S 710represents a step of generating radiation attenuation coefficients on which the personal information is reflected.
- S 729represents a step of generating a standard MR image and a standard radiation attenuation image on which the personal information is reflected.
- the embodimentsare the same as the first embodiment shown in FIG. 4 . A description thereof is thus omitted.
- the standard image to be used with the standard MR imageis not limited to the radiation attenuation image. Other embodiments are also applicable by the following translation according to the database.
- S 210may be replaced with S 520 and S 530 of FIG. 13 .
- S 210may be replaced with S 524 and S 534 of FIG. 20 .
- the subject's own radiation attenuation correction values or the radiation attenuation image, or the CT image or the UTE imagemay be repeatedly used as at least either one of the radiation attenuation correction value table and the standard image.
- the present inventionis applied to brain images.
- the applications of the present inventionare not limited thereto.
- the number of segmented regionsis not limited to three, either, including a high intensity region, a medium intensity region, and a low intensity region.
- the present inventionis applicable to PET/MRI which combines PET with MRI.
Landscapes
- Health & Medical Sciences (AREA)
- Physics & Mathematics (AREA)
- Life Sciences & Earth Sciences (AREA)
- Engineering & Computer Science (AREA)
- Nuclear Medicine, Radiotherapy & Molecular Imaging (AREA)
- General Health & Medical Sciences (AREA)
- Radiology & Medical Imaging (AREA)
- Theoretical Computer Science (AREA)
- General Physics & Mathematics (AREA)
- Molecular Biology (AREA)
- Medical Informatics (AREA)
- High Energy & Nuclear Physics (AREA)
- Biomedical Technology (AREA)
- Veterinary Medicine (AREA)
- Biophysics (AREA)
- Heart & Thoracic Surgery (AREA)
- Pathology (AREA)
- Surgery (AREA)
- Animal Behavior & Ethology (AREA)
- Public Health (AREA)
- Pulmonology (AREA)
- Condensed Matter Physics & Semiconductors (AREA)
- Optics & Photonics (AREA)
- Spectroscopy & Molecular Physics (AREA)
- Computer Vision & Pattern Recognition (AREA)
- Apparatus For Radiation Diagnosis (AREA)
- Magnetic Resonance Imaging Apparatus (AREA)
- Nuclear Medicine (AREA)
Abstract
Description
Claims (8)
Applications Claiming Priority (3)
| Application Number | Priority Date | Filing Date | Title |
|---|---|---|---|
| JP2012074906 | 2012-03-28 | ||
| JP2012-074906 | 2012-03-28 | ||
| PCT/JP2013/059235WO2013147013A1 (en) | 2012-03-28 | 2013-03-28 | Method for generating pet absorption-corrected image from mr image and computer program |
Publications (2)
| Publication Number | Publication Date |
|---|---|
| US20150117736A1 US20150117736A1 (en) | 2015-04-30 |
| US9342903B2true US9342903B2 (en) | 2016-05-17 |
Family
ID=49260261
Family Applications (1)
| Application Number | Title | Priority Date | Filing Date |
|---|---|---|---|
| US14/385,683Expired - Fee RelatedUS9342903B2 (en) | 2012-03-28 | 2013-03-28 | Method for generating image for PET attenuation correction from MR image and computer program |
Country Status (6)
| Country | Link |
|---|---|
| US (1) | US9342903B2 (en) |
| EP (1) | EP2833163B1 (en) |
| JP (1) | JP5741980B2 (en) |
| CN (1) | CN104220898B (en) |
| ES (1) | ES2692163T3 (en) |
| WO (1) | WO2013147013A1 (en) |
Cited By (1)
| Publication number | Priority date | Publication date | Assignee | Title |
|---|---|---|---|---|
| US10223794B2 (en) | 2014-03-28 | 2019-03-05 | Koninklijke Philips N.V. | Method and device for generating one or more computer tomography images based on magnetic resonance images with the help of tissue class separation |
Families Citing this family (8)
| Publication number | Priority date | Publication date | Assignee | Title |
|---|---|---|---|---|
| CN105263407B (en)* | 2013-04-02 | 2018-09-14 | 皇家飞利浦有限公司 | Detection of Bone Tissue Using Magnetic Resonance Imaging |
| KR101796392B1 (en)* | 2016-07-28 | 2017-11-10 | 가톨릭대학교 산학협력단 | Dose Estimation Method of MRI-based Synthetic Image Using a Look-Up Table |
| CN108074270B (en)* | 2016-11-11 | 2021-11-30 | 上海东软医疗科技有限公司 | PET attenuation correction method and device |
| US20200085397A1 (en)* | 2017-05-29 | 2020-03-19 | Shimadzu Corporation | Attenuation coefficient image estimation method, attenuation coefficient image estimation program, and positron ct apparatus equipped with the same |
| CN115702365A (en)* | 2020-06-26 | 2023-02-14 | 株式会社岛津制作所 | Absorption coefficient image generation method, nuclear medicine diagnosis device, and method for creating learned model |
| CN113670958B (en)* | 2021-09-02 | 2022-12-06 | 西安交通大学 | Gas turbine blade defect identification method based on X-ray attenuation coefficient difference |
| EP4402694A4 (en)* | 2021-09-13 | 2025-06-25 | Board of Regents, The University of Texas System | OBJECT IDENTIFICATION IN MAGNETIC RESONANCE IMAGES |
| CN117372431B (en)* | 2023-12-07 | 2024-02-20 | 青岛天仁微纳科技有限责任公司 | Image detection method of nano-imprint mold |
Citations (18)
| Publication number | Priority date | Publication date | Assignee | Title |
|---|---|---|---|---|
| JPS63241487A (en) | 1987-03-30 | 1988-10-06 | Shimadzu Corp | Numerical phantom creation device |
| JP2002542915A (en) | 1999-04-29 | 2002-12-17 | ジーイー・メディカル・システムズ・エス アー | Method and system for fusion of two digital radiographic images |
| JP2005283421A (en) | 2004-03-30 | 2005-10-13 | Shimadzu Corp | Diagnostic system |
| JP2006177799A (en) | 2004-12-22 | 2006-07-06 | Hamamatsu Photonics Kk | Positron ct system |
| JP2006284346A (en) | 2005-03-31 | 2006-10-19 | Shimadzu Corp | Radiation tomography equipment |
| JP2008022930A (en) | 2006-07-19 | 2008-02-07 | Shimadzu Corp | Diagnostic system |
| WO2009118843A1 (en) | 2008-03-26 | 2009-10-01 | 株式会社島津製作所 | Tomographic equipment, photographic system equipped with the same, and method for acquiring photographic data |
| JP2010008164A (en) | 2008-06-25 | 2010-01-14 | Fujita Gakuen | Apparatus, method and program for creating attenuation coefficient map |
| WO2010032168A2 (en) | 2008-09-19 | 2010-03-25 | Koninklijke Philips Electronics N.V. | Method for generation of attenuation map in pet-mr |
| JP2010085147A (en) | 2008-09-30 | 2010-04-15 | Hitachi Ltd | Radiation imaging device and image information generation method |
| US20100135559A1 (en) | 2007-05-04 | 2010-06-03 | Koninklijke Philips Electronics N.V. | Hybrid mr/pet with correction for radiation absorption by mr coil |
| DE102009027448A1 (en) | 2009-07-03 | 2011-01-05 | Forschungszentrum Jülich GmbH | Knowledge-based segmentation of weakening regions of the head |
| US20110123083A1 (en)* | 2008-08-15 | 2011-05-26 | Koninklijke Philips Electronics N.V. | Attenuation correction for pet or spect nuclear imaging systems using magnetic resonance spectroscopic image data |
| US7983390B2 (en)* | 2008-06-25 | 2011-07-19 | Fujifilm Corporation | Energy subtraction processing apparatus, method, and radiation image diagnosis system |
| US20110309251A1 (en)* | 2010-06-17 | 2011-12-22 | Siemens Aktiengesellschaft | Method For Determining Radiation Attenuation In A Positron Emission Tomography Scanner |
| US20130101193A1 (en)* | 2011-10-20 | 2013-04-25 | Jong Beom Ra | Positron Emission Tomography and Method for Correcting Attenuation of PET Image Using Magnetic Resonance Image |
| US20130266198A1 (en)* | 2012-04-04 | 2013-10-10 | Siemens Corporation | Method for creating attenuation correction maps for pet image reconstruction |
| US20150065854A1 (en)* | 2012-10-31 | 2015-03-05 | General Electric Company | Joint estimation of attenuation and activity information using emission data |
Family Cites Families (3)
| Publication number | Priority date | Publication date | Assignee | Title |
|---|---|---|---|---|
| US8787648B2 (en)* | 2008-03-07 | 2014-07-22 | Koninklijke Philips N.V. | CT surrogate by auto-segmentation of magnetic resonance images |
| WO2010097714A2 (en)* | 2009-02-25 | 2010-09-02 | Koninklijke Philips Electronics, N.V. | Attenuation correction of mr coils in a hybrid pet/mr system |
| CN102324089B (en)* | 2011-07-13 | 2013-04-03 | 南方医科大学 | Maximum posteriori reconstruction method of PET (positron emission tomography) image based on generalized entropy and MR (magnetic resonance) prior |
- 2013
- 2013-03-28WOPCT/JP2013/059235patent/WO2013147013A1/enactiveApplication Filing
- 2013-03-28CNCN201380017570.5Apatent/CN104220898B/enactiveActive
- 2013-03-28EPEP13767524.5Apatent/EP2833163B1/ennot_activeNot-in-force
- 2013-03-28JPJP2014508025Apatent/JP5741980B2/enactiveActive
- 2013-03-28ESES13767524.5Tpatent/ES2692163T3/enactiveActive
- 2013-03-28USUS14/385,683patent/US9342903B2/ennot_activeExpired - Fee Related
Patent Citations (22)
| Publication number | Priority date | Publication date | Assignee | Title |
|---|---|---|---|---|
| JPS63241487A (en) | 1987-03-30 | 1988-10-06 | Shimadzu Corp | Numerical phantom creation device |
| JP2002542915A (en) | 1999-04-29 | 2002-12-17 | ジーイー・メディカル・システムズ・エス アー | Method and system for fusion of two digital radiographic images |
| US7010149B1 (en) | 1999-04-29 | 2006-03-07 | Ge Medical Systems Sa | Method and system of fusion of two digital radiographic images |
| JP2005283421A (en) | 2004-03-30 | 2005-10-13 | Shimadzu Corp | Diagnostic system |
| JP2006177799A (en) | 2004-12-22 | 2006-07-06 | Hamamatsu Photonics Kk | Positron ct system |
| JP2006284346A (en) | 2005-03-31 | 2006-10-19 | Shimadzu Corp | Radiation tomography equipment |
| JP2008022930A (en) | 2006-07-19 | 2008-02-07 | Shimadzu Corp | Diagnostic system |
| US20100135559A1 (en) | 2007-05-04 | 2010-06-03 | Koninklijke Philips Electronics N.V. | Hybrid mr/pet with correction for radiation absorption by mr coil |
| JP2010525857A (en) | 2007-05-04 | 2010-07-29 | コーニンクレッカ フィリップス エレクトロニクス エヌ ヴィ | Hybrid MR / PET with correction of MR coil absorption |
| WO2009118843A1 (en) | 2008-03-26 | 2009-10-01 | 株式会社島津製作所 | Tomographic equipment, photographic system equipped with the same, and method for acquiring photographic data |
| US20110019895A1 (en) | 2008-03-26 | 2011-01-27 | Tetsuro Mizuta | Tomographic equipment, imaging system provided therewith, and imaging data acquisition method |
| JP2010008164A (en) | 2008-06-25 | 2010-01-14 | Fujita Gakuen | Apparatus, method and program for creating attenuation coefficient map |
| US7983390B2 (en)* | 2008-06-25 | 2011-07-19 | Fujifilm Corporation | Energy subtraction processing apparatus, method, and radiation image diagnosis system |
| US20110123083A1 (en)* | 2008-08-15 | 2011-05-26 | Koninklijke Philips Electronics N.V. | Attenuation correction for pet or spect nuclear imaging systems using magnetic resonance spectroscopic image data |
| WO2010032168A2 (en) | 2008-09-19 | 2010-03-25 | Koninklijke Philips Electronics N.V. | Method for generation of attenuation map in pet-mr |
| JP2010085147A (en) | 2008-09-30 | 2010-04-15 | Hitachi Ltd | Radiation imaging device and image information generation method |
| DE102009027448A1 (en) | 2009-07-03 | 2011-01-05 | Forschungszentrum Jülich GmbH | Knowledge-based segmentation of weakening regions of the head |
| US20120155733A1 (en) | 2009-07-03 | 2012-06-21 | Forschungszentrum Julich Gmbh | Knowledge-based segmentation of attenuation-relevant regions of the head |
| US20110309251A1 (en)* | 2010-06-17 | 2011-12-22 | Siemens Aktiengesellschaft | Method For Determining Radiation Attenuation In A Positron Emission Tomography Scanner |
| US20130101193A1 (en)* | 2011-10-20 | 2013-04-25 | Jong Beom Ra | Positron Emission Tomography and Method for Correcting Attenuation of PET Image Using Magnetic Resonance Image |
| US20130266198A1 (en)* | 2012-04-04 | 2013-10-10 | Siemens Corporation | Method for creating attenuation correction maps for pet image reconstruction |
| US20150065854A1 (en)* | 2012-10-31 | 2015-03-05 | General Electric Company | Joint estimation of attenuation and activity information using emission data |
Non-Patent Citations (12)
| Title |
|---|
| A. Tanigawa et al.; "Hybrid segmentation-atlas method for PET-MRI attenuation correction;" 2012 IEEE Nuclear Science Symposium and Medical Imaging Conference Record (NSS/MIC); Nov. 3, 2012; pp. 2727-2729. |
| Atlas-Based Attenuation Correctino for PET/MRI. John Christian Patrick. Mar. 2013.* |
| Hofmann et al., "Towards quantitative PET/MRI: a review of MR-based attenuation correction techniques," European Journal of Nuclear Medicine and Molecular Imaging, 2009, pp. S93-S104, vol. 36. |
| Jul. 9, 2013 International Search Report issued in International Application No. PCT/JP2013/059235. |
| Kops et al., "Attenuation Correction of PET Scanning Based on MRT-Images," Nucl. Sci. Symp. & Med. Image. Conference, 2006, pp. 241. |
| Kops et al., "Towards an MRI Based Attenuation Correction for Brain MR-PET," BrainPET Conference, 2007. |
| M. Hofmann et al.; "MRI-Based Attenuation Correction for Whole-Body PET/MRI: Quantitative Evaluation of Segmentation- and Atlas-Based Methods;" The Journal of Nuclear Medicine; vol. 52, No. 9; Sep. 2011; pp. 1392-1399. |
| Montandon et al., "Atlas-guided non-uniform attenuation correction in cerebral 3D PET imaging," NeuroImage, pp. 278-286, 2005, vol. 25. |
| Montandon et al., "Quantitative analysis of template-based attenuation compensation in 3D brain PET," Computerized Medical Imaging and Graphics, 2007, pp. 28-38, vol. 31. |
| Oct. 27, 2015 Search Report issued in European Patent Application No. 13767524.5. |
| PET and MRI: The Odd Couple or a Match Made in Heaven? Ciprian Catana, Alexander R. Guimaraes, and Bruce R. Rosen. May 2013.* |
| Zaidi et al., "Magnetic resonance imaging-guided attenuation and scatter corrections in three-dimensional brain positron emission tomography," Med. Phys., May 2003, pp. 937-948, vol. 5. |
Cited By (1)
| Publication number | Priority date | Publication date | Assignee | Title |
|---|---|---|---|---|
| US10223794B2 (en) | 2014-03-28 | 2019-03-05 | Koninklijke Philips N.V. | Method and device for generating one or more computer tomography images based on magnetic resonance images with the help of tissue class separation |
Also Published As
| Publication number | Publication date |
|---|---|
| EP2833163B1 (en) | 2018-07-25 |
| EP2833163A4 (en) | 2015-11-25 |
| CN104220898B (en) | 2017-05-17 |
| CN104220898A (en) | 2014-12-17 |
| EP2833163A1 (en) | 2015-02-04 |
| WO2013147013A1 (en) | 2013-10-03 |
| ES2692163T3 (en) | 2018-11-30 |
| US20150117736A1 (en) | 2015-04-30 |
| JPWO2013147013A1 (en) | 2015-12-14 |
| JP5741980B2 (en) | 2015-07-01 |
Similar Documents
| Publication | Publication Date | Title |
|---|---|---|
| US9342903B2 (en) | Method for generating image for PET attenuation correction from MR image and computer program | |
| Shi et al. | Deep learning-based attenuation map generation for myocardial perfusion SPECT | |
| Dong et al. | Deep learning-based attenuation correction in the absence of structural information for whole-body positron emission tomography imaging | |
| Arabi et al. | Novel adversarial semantic structure deep learning for MRI-guided attenuation correction in brain PET/MRI | |
| Juttukonda et al. | MR-based attenuation correction for PET/MRI neurological studies with continuous-valued attenuation coefficients for bone through a conversion from R2* to CT-Hounsfield units | |
| Catana et al. | Toward implementing an MRI-based PET attenuation-correction method for neurologic studies on the MR-PET brain prototype | |
| EP2398390B1 (en) | Model-based extension of field-of-view in nuclear imaging | |
| US11020077B2 (en) | Simultaneous CT-MRI image reconstruction | |
| Hofmann et al. | Towards quantitative PET/MRI: a review of MR-based attenuation correction techniques | |
| Wagenknecht et al. | MRI for attenuation correction in PET: methods and challenges | |
| CN105263407B (en) | Detection of Bone Tissue Using Magnetic Resonance Imaging | |
| Catana | Attenuation correction for human PET/MRI studies | |
| Mehranian et al. | Quantitative analysis of MRI-guided attenuation correction techniques in time-of-flight brain PET/MRI | |
| CN101953693B (en) | Model based estimation of a complete or partial positron emission tomography attenuation map using maximum likelihood expectation maximization | |
| Mostafapour et al. | Feasibility of deep learning-guided attenuation and scatter correction of whole-body 68Ga-PSMA PET studies in the image domain | |
| Aasheim et al. | PET/MR brain imaging: evaluation of clinical UTE-based attenuation correction | |
| Khalifé et al. | Subject-specific bone attenuation correction for brain PET/MR: can ZTE-MRI substitute CT scan accurately? | |
| Oehmigen et al. | Impact of improved attenuation correction featuring a bone atlas and truncation correction on PET quantification in whole-body PET/MR | |
| Bini et al. | Preclinical evaluation of MR attenuation correction versus CT attenuation correction on a sequential whole-body MR/PET scanner | |
| US20100284598A1 (en) | Image registration alignment metric | |
| Sgard et al. | ZTE MR-based attenuation correction in brain FDG-PET/MR: performance in patients with cognitive impairment | |
| Sanaat et al. | A cycle-consistent adversarial network for brain PET partial volume correction without prior anatomical information | |
| Seith et al. | Comparison of positron emission tomography quantification using magnetic resonance–and computed tomography–based attenuation correction in physiological tissues and lesions: a whole-body positron emission tomography/magnetic resonance study in 66 patients | |
| EP2711738A1 (en) | A method and a device to generate virtual X-ray computed tomographic image data | |
| Cobo et al. | Physical foundations for trustworthy medical imaging: a review for artificial intelligence researchers |
Legal Events
| Date | Code | Title | Description |
|---|---|---|---|
| AS | Assignment | Owner name:NATIONAL INSTITUTE OF RADIOLOGICAL SCIENCES, JAPAN Free format text:ASSIGNMENT OF ASSIGNORS INTEREST;ASSIGNORS:YAMAYA, TAIGA;OBATA, TAKAYUKI;SUGA, MIKIO;AND OTHERS;SIGNING DATES FROM 20140619 TO 20140718;REEL/FRAME:033751/0231 Owner name:SHIMADZU CORPORATION, JAPAN Free format text:ASSIGNMENT OF ASSIGNORS INTEREST;ASSIGNORS:YAMAYA, TAIGA;OBATA, TAKAYUKI;SUGA, MIKIO;AND OTHERS;SIGNING DATES FROM 20140619 TO 20140718;REEL/FRAME:033751/0231 | |
| AS | Assignment | Owner name:NATIONAL INSTITUTE OF RADIOLOGICAL SCIENCES, JAPAN Free format text:CORRECTIVE ASSIGNMENT TO CORRECT THE SECOND ASSIGNEE'S ADDRESS PREVIOUSLY RECORDED ON REEL 033751 FRAME 0231. ASSIGNOR(S) HEREBY CONFIRMS THE ASSIGNMENT;ASSIGNORS:YAMAYA, TAIGA;OBATA, TAKAYUKI;SUGA, MIKIO;AND OTHERS;SIGNING DATES FROM 20140619 TO 20140718;REEL/FRAME:034014/0551 Owner name:SHIMADZU CORPORATION, JAPAN Free format text:CORRECTIVE ASSIGNMENT TO CORRECT THE SECOND ASSIGNEE'S ADDRESS PREVIOUSLY RECORDED ON REEL 033751 FRAME 0231. ASSIGNOR(S) HEREBY CONFIRMS THE ASSIGNMENT;ASSIGNORS:YAMAYA, TAIGA;OBATA, TAKAYUKI;SUGA, MIKIO;AND OTHERS;SIGNING DATES FROM 20140619 TO 20140718;REEL/FRAME:034014/0551 | |
| ZAAA | Notice of allowance and fees due | Free format text:ORIGINAL CODE: NOA | |
| ZAAB | Notice of allowance mailed | Free format text:ORIGINAL CODE: MN/=. | |
| STCF | Information on status: patent grant | Free format text:PATENTED CASE | |
| AS | Assignment | Owner name:NATIONAL INSTITUTES FOR QUANTUM AND RADIOLOGICAL S Free format text:CHANGE OF NAME;ASSIGNOR:NATIONAL INSTITUTE OF RADIOLOGICAL SCIENCES;REEL/FRAME:039634/0067 Effective date:20160502 | |
| CC | Certificate of correction | ||
| CC | Certificate of correction | ||
| MAFP | Maintenance fee payment | Free format text:PAYMENT OF MAINTENANCE FEE, 4TH YEAR, LARGE ENTITY (ORIGINAL EVENT CODE: M1551); ENTITY STATUS OF PATENT OWNER: LARGE ENTITY Year of fee payment:4 | |
| AS | Assignment | Owner name:SHIMADZU CORPORATION, JAPAN Free format text:NUNC PRO TUNC ASSIGNMENT;ASSIGNOR:NATIONAL INSTITUTES FOR QUANTUM AND RADIOLOGICAL SCIENCE AND TECHNOLOGY;REEL/FRAME:057160/0778 Effective date:20210715 | |
| FEPP | Fee payment procedure | Free format text:MAINTENANCE FEE REMINDER MAILED (ORIGINAL EVENT CODE: REM.); ENTITY STATUS OF PATENT OWNER: LARGE ENTITY | |
| LAPS | Lapse for failure to pay maintenance fees | Free format text:PATENT EXPIRED FOR FAILURE TO PAY MAINTENANCE FEES (ORIGINAL EVENT CODE: EXP.); ENTITY STATUS OF PATENT OWNER: LARGE ENTITY | |
| STCH | Information on status: patent discontinuation | Free format text:PATENT EXPIRED DUE TO NONPAYMENT OF MAINTENANCE FEES UNDER 37 CFR 1.362 | |
| FP | Lapsed due to failure to pay maintenance fee | Effective date:20240517 |