US9031824B2 - Real-time predictive systems for intelligent energy monitoring and management of electrical power networks - Google Patents
Real-time predictive systems for intelligent energy monitoring and management of electrical power networksDownload PDFInfo
- Publication number
- US9031824B2 US9031824B2US14/532,559US201414532559AUS9031824B2US 9031824 B2US9031824 B2US 9031824B2US 201414532559 AUS201414532559 AUS 201414532559AUS 9031824 B2US9031824 B2US 9031824B2
- Authority
- US
- United States
- Prior art keywords
- real
- time
- electrical
- data
- power
- Prior art date
- Legal status (The legal status is an assumption and is not a legal conclusion. Google has not performed a legal analysis and makes no representation as to the accuracy of the status listed.)
- Expired - Fee Related
Links
Images


Classifications
- G—PHYSICS
- G06—COMPUTING OR CALCULATING; COUNTING
- G06N—COMPUTING ARRANGEMENTS BASED ON SPECIFIC COMPUTATIONAL MODELS
- G06N20/00—Machine learning
- G—PHYSICS
- G05—CONTROLLING; REGULATING
- G05B—CONTROL OR REGULATING SYSTEMS IN GENERAL; FUNCTIONAL ELEMENTS OF SUCH SYSTEMS; MONITORING OR TESTING ARRANGEMENTS FOR SUCH SYSTEMS OR ELEMENTS
- G05B13/00—Adaptive control systems, i.e. systems automatically adjusting themselves to have a performance which is optimum according to some preassigned criterion
- G05B13/02—Adaptive control systems, i.e. systems automatically adjusting themselves to have a performance which is optimum according to some preassigned criterion electric
- G05B13/04—Adaptive control systems, i.e. systems automatically adjusting themselves to have a performance which is optimum according to some preassigned criterion electric involving the use of models or simulators
- G05B13/048—Adaptive control systems, i.e. systems automatically adjusting themselves to have a performance which is optimum according to some preassigned criterion electric involving the use of models or simulators using a predictor
- G—PHYSICS
- G06—COMPUTING OR CALCULATING; COUNTING
- G06N—COMPUTING ARRANGEMENTS BASED ON SPECIFIC COMPUTATIONAL MODELS
- G06N5/00—Computing arrangements using knowledge-based models
- G06N5/04—Inference or reasoning models
- G06N99/005—
- G—PHYSICS
- G06—COMPUTING OR CALCULATING; COUNTING
- G06Q—INFORMATION AND COMMUNICATION TECHNOLOGY [ICT] SPECIALLY ADAPTED FOR ADMINISTRATIVE, COMMERCIAL, FINANCIAL, MANAGERIAL OR SUPERVISORY PURPOSES; SYSTEMS OR METHODS SPECIALLY ADAPTED FOR ADMINISTRATIVE, COMMERCIAL, FINANCIAL, MANAGERIAL OR SUPERVISORY PURPOSES, NOT OTHERWISE PROVIDED FOR
- G06Q10/00—Administration; Management
- G06Q10/04—Forecasting or optimisation specially adapted for administrative or management purposes, e.g. linear programming or "cutting stock problem"
- G—PHYSICS
- G06—COMPUTING OR CALCULATING; COUNTING
- G06Q—INFORMATION AND COMMUNICATION TECHNOLOGY [ICT] SPECIALLY ADAPTED FOR ADMINISTRATIVE, COMMERCIAL, FINANCIAL, MANAGERIAL OR SUPERVISORY PURPOSES; SYSTEMS OR METHODS SPECIALLY ADAPTED FOR ADMINISTRATIVE, COMMERCIAL, FINANCIAL, MANAGERIAL OR SUPERVISORY PURPOSES, NOT OTHERWISE PROVIDED FOR
- G06Q30/00—Commerce
- G06Q30/02—Marketing; Price estimation or determination; Fundraising
- G06Q30/0201—Market modelling; Market analysis; Collecting market data
- G06Q30/0206—Price or cost determination based on market factors
- G—PHYSICS
- G06—COMPUTING OR CALCULATING; COUNTING
- G06Q—INFORMATION AND COMMUNICATION TECHNOLOGY [ICT] SPECIALLY ADAPTED FOR ADMINISTRATIVE, COMMERCIAL, FINANCIAL, MANAGERIAL OR SUPERVISORY PURPOSES; SYSTEMS OR METHODS SPECIALLY ADAPTED FOR ADMINISTRATIVE, COMMERCIAL, FINANCIAL, MANAGERIAL OR SUPERVISORY PURPOSES, NOT OTHERWISE PROVIDED FOR
- G06Q30/00—Commerce
- G06Q30/02—Marketing; Price estimation or determination; Fundraising
- G06Q30/0283—Price estimation or determination
- G—PHYSICS
- G06—COMPUTING OR CALCULATING; COUNTING
- G06Q—INFORMATION AND COMMUNICATION TECHNOLOGY [ICT] SPECIALLY ADAPTED FOR ADMINISTRATIVE, COMMERCIAL, FINANCIAL, MANAGERIAL OR SUPERVISORY PURPOSES; SYSTEMS OR METHODS SPECIALLY ADAPTED FOR ADMINISTRATIVE, COMMERCIAL, FINANCIAL, MANAGERIAL OR SUPERVISORY PURPOSES, NOT OTHERWISE PROVIDED FOR
- G06Q50/00—Information and communication technology [ICT] specially adapted for implementation of business processes of specific business sectors, e.g. utilities or tourism
- G06Q50/06—Energy or water supply
- Y—GENERAL TAGGING OF NEW TECHNOLOGICAL DEVELOPMENTS; GENERAL TAGGING OF CROSS-SECTIONAL TECHNOLOGIES SPANNING OVER SEVERAL SECTIONS OF THE IPC; TECHNICAL SUBJECTS COVERED BY FORMER USPC CROSS-REFERENCE ART COLLECTIONS [XRACs] AND DIGESTS
- Y02—TECHNOLOGIES OR APPLICATIONS FOR MITIGATION OR ADAPTATION AGAINST CLIMATE CHANGE
- Y02P—CLIMATE CHANGE MITIGATION TECHNOLOGIES IN THE PRODUCTION OR PROCESSING OF GOODS
- Y02P80/00—Climate change mitigation technologies for sector-wide applications
- Y02P80/10—Efficient use of energy, e.g. using compressed air or pressurized fluid as energy carrier
- Y02P80/14—District level solutions, i.e. local energy networks
- Y—GENERAL TAGGING OF NEW TECHNOLOGICAL DEVELOPMENTS; GENERAL TAGGING OF CROSS-SECTIONAL TECHNOLOGIES SPANNING OVER SEVERAL SECTIONS OF THE IPC; TECHNICAL SUBJECTS COVERED BY FORMER USPC CROSS-REFERENCE ART COLLECTIONS [XRACs] AND DIGESTS
- Y04—INFORMATION OR COMMUNICATION TECHNOLOGIES HAVING AN IMPACT ON OTHER TECHNOLOGY AREAS
- Y04S—SYSTEMS INTEGRATING TECHNOLOGIES RELATED TO POWER NETWORK OPERATION, COMMUNICATION OR INFORMATION TECHNOLOGIES FOR IMPROVING THE ELECTRICAL POWER GENERATION, TRANSMISSION, DISTRIBUTION, MANAGEMENT OR USAGE, i.e. SMART GRIDS
- Y04S10/00—Systems supporting electrical power generation, transmission or distribution
- Y04S10/50—Systems or methods supporting the power network operation or management, involving a certain degree of interaction with the load-side end user applications
- Y04S10/60—
- Y—GENERAL TAGGING OF NEW TECHNOLOGICAL DEVELOPMENTS; GENERAL TAGGING OF CROSS-SECTIONAL TECHNOLOGIES SPANNING OVER SEVERAL SECTIONS OF THE IPC; TECHNICAL SUBJECTS COVERED BY FORMER USPC CROSS-REFERENCE ART COLLECTIONS [XRACs] AND DIGESTS
- Y04—INFORMATION OR COMMUNICATION TECHNOLOGIES HAVING AN IMPACT ON OTHER TECHNOLOGY AREAS
- Y04S—SYSTEMS INTEGRATING TECHNOLOGIES RELATED TO POWER NETWORK OPERATION, COMMUNICATION OR INFORMATION TECHNOLOGIES FOR IMPROVING THE ELECTRICAL POWER GENERATION, TRANSMISSION, DISTRIBUTION, MANAGEMENT OR USAGE, i.e. SMART GRIDS
- Y04S50/00—Market activities related to the operation of systems integrating technologies related to power network operation or related to communication or information technologies
- Y04S50/14—Marketing, i.e. market research and analysis, surveying, promotions, advertising, buyer profiling, customer management or rewards
Definitions
- the present inventionrelates generally to computer modeling and management of systems and, more particularly, to an energy management systems for monitoring and managing the cost, quality and reliability of an electrical power system.
- Computer models of complex systemsenable improved system design, development, and implementation through techniques for off-line simulation of system operation. That is, system models can be created on computers and then “operated” in a virtual environment to assist in the determination of system design parameters. All manner of systems can be modeled, designed, and operated in this way, including machinery, factories, electrical power and distribution systems, processing plants, devices, chemical processes, biological systems, and the like. Such simulation techniques have resulted in reduced development costs and superior operation.
- Design and production processeshave benefited greatly from such computer simulation techniques, and such techniques are relatively well developed, but they have not been applied in real-time, e.g., for real-time operational monitoring and management.
- predictive failure analysis techniquesdo not generally use real-time data that reflect actual system operation. Greater efforts at real-time operational monitoring and management would provide more accurate and timely suggestions for operational decisions, and such techniques applied to failure analysis would provide improved predictions of system problems before they occur.
- an electrical network model that can age and synchronize itself in real-time with the actual facility's operating conditionsis critical to obtaining predictions that are reflective of the system's reliability, availability, health and performance in relation to the life cycle of the system.
- Static systemssimply cannot adjust to the many daily changes to the electrical system that occur at a facility (e.g., motors and pumps switching on or off, changes to on-site generation status, changes to utility electrical feed . . . etc.) nor can they age with the facility to accurately predict the required indices.
- reliability indices and predictionsare of little value as they are not reflective of the actual operational status of the facility and may lead to false conclusions. With such improved techniques, operational costs and risks can be greatly reduced.
- mission critical electrical systemse.g., for data centers or nuclear power facilities
- the systemsmust be as failure proof as possible, and many layers of redundancy must be designed in to ensure that there is always a backup in case of a failure.
- Computer design and modeling programsallow for the design of such systems by allowing a designer to model the system and simulate its operation. Thus, the designer can ensure that the system will operate as intended before the facility is constructed.
- the systemcan include a data acquisition component, a power analytics server and a client terminal.
- the data acquisition componentcan be communicatively connected to a sensor configured to acquire real-time data output from the electrical system.
- the power analytics servercan be communicatively connected to the data acquisition component and can be comprised of a real-time energy pricing engine, a virtual system modeling engine, an analytics engine, and a machine learning engine.
- the real-time energy pricing enginecan be configured to generate real-time utility pricing data.
- the virtual system modeling enginecan be configured to generate predicted data output for the electrical system utilizing a virtual system model of the electrical system and the real-time utility power pricing data.
- the analytics enginecan be configured to monitor the real-time data output and the predicted data output of the electrical system initiating a calibration and synchronization operation to update the virtual system model when a difference between the real-time data output and the predicted data output exceeds a threshold.
- the machine learning enginecan be configured to store and process patterns observed from the real-time data output and the predicted data output then forecast an aspect of the electrical system.
- the client terminalcan be communicatively connected to the power analytics server and configured to display the schematic user interface.
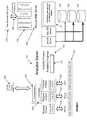
- FIG. 1is an illustration of a system for utilizing real-time data for predictive analysis of the performance of a monitored system, in accordance with one embodiment.
- FIG. 2is a diagram illustrating a detailed view of an analytics server included in the system of FIG. 1 , in accordance with one embodiment.
- FIG. 3is a diagram illustrating how the system of FIG. 1 operates to synchronize the operating parameters between a physical facility and a virtual system model of the facility, in accordance with one embodiment.
- FIG. 4is an illustration of the scalability of a system for utilizing real-time data for predictive analysis of the performance of a monitored system, in accordance with one embodiment.
- FIG. 5is a block diagram that shows the configuration details of the system illustrated in FIG. 1 , in accordance with one embodiment.
- FIG. 6is an illustration of a flowchart describing a method for real-time monitoring and predictive analysis of a monitored system, in accordance with one embodiment.
- FIG. 7is an illustration of a flowchart describing a method for managing real-time updates to a virtual system model of a monitored system, in accordance with one embodiment.
- FIG. 8is an illustration of a flowchart describing a method for synchronizing real-time system data with a virtual system model of a monitored system, in accordance with one embodiment.
- FIG. 9is a flow chart illustrating an example method for updating the virtual model, in accordance with one embodiment.
- FIG. 10is a diagram illustrating an example process for monitoring the status of protective devices in a monitored system and updating a virtual model based on monitored data, in accordance with one embodiment.
- FIG. 11is a flowchart illustrating an example process for determining the protective capabilities of the protective devices being monitored, in accordance with one embodiment.
- FIG. 12is a diagram illustrating an example process for determining the protective capabilities of a High Voltage Circuit Breaker (HVCB), in accordance with one embodiment.
- HVCBHigh Voltage Circuit Breaker
- FIG. 13is a flowchart illustrating an example process for determining the protective capabilities of the protective devices being monitored, in accordance with another embodiment.
- FIG. 14is a diagram illustrating a process for evaluating the withstand capabilities of a MVCB, in accordance with one embodiment
- FIG. 15is a flow chart illustrating an example process for analyzing the reliability of an electrical power distribution and transmission system, in accordance with one embodiment.
- FIG. 16is a flow chart illustrating an example process for analyzing the reliability of an electrical power distribution and transmission system that takes weather information into account, in accordance with one embodiment.
- FIG. 17is a diagram illustrating an example process for predicting in real-time various parameters associated with an alternating current (AC) arc flash incident, in accordance with one embodiment.
- ACalternating current
- FIG. 18is a flow chart illustrating an example process for real-time analysis of the operational stability of an electrical power distribution and transmission system, in accordance with one embodiment.
- FIG. 19is a flow chart illustrating an example process for conducting a real-time power capacity assessment of an electrical power distribution and transmission system, in accordance with one embodiment.
- FIG. 20is a flow chart illustrating an example process for performing real-time harmonics analysis of an electrical power distribution and transmission system, in accordance with one embodiment.
- FIG. 21is a diagram illustrating how the HTM Pattern Recognition and Machine Learning Engine works in conjunction with the other elements of the analytics system to make predictions about the operational aspects of a monitored system, in accordance with one embodiment.
- FIG. 22is an illustration of the various cognitive layers that comprise the neocortical catalyst process used by the HTM Pattern Recognition and Machine Learning Engine to analyze and make predictions about the operational aspects of a monitored system, in accordance with one embodiment.
- FIG. 23is an example process for real-time three-dimensional (3D) visualization of the health, reliability, and performance of an electrical system, in accordance with one embodiment.
- FIG. 24is a diagram illustrating how the 3D Visualization Engine works in conjunction with the other elements of the analytics system to provide 3D visualization of the health, reliability, and performance of an electrical system, in accordance with one embodiment.
- FIG. 25provides a client terminal screenshot of some 2D and 3D model views that are generated by the power analytics server, in accordance with one embodiment.
- FIG. 26is a diagram illustrating how the Schematic Interface Creator Engine works in conjunction with the other elements of the analytics system to automatically generate a schematic user interface for visualizing the health, reliability, and performance of an electrical system, in accordance with one embodiment.
- FIG. 27is an example process for automatically generating a schematic user interface for visualizing the health, reliability, and performance of an electrical system, in accordance with one embodiment.
- FIG. 28is a diagram illustrating how the Energy Management System Engine works in conjunction with the other elements of the analytics system to intelligently monitor and manage the cost, quality and reliability of energy generated and/or utilized by an electrical system, in accordance with one embodiment.
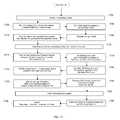
- FIG. 29is a logic flow diagram depicting how the various elements of the Energy Management System can interact to provide intelligent energy monitoring and management of an electrical system, in accordance with one embodiment.
- a systemdenotes a set of components, real or abstract, comprising a whole where each component interacts with or is related to at least one other component within the whole.
- systemsinclude machinery, factories, electrical systems, processing plants, devices, chemical processes, biological systems, data centers, aircraft carriers, and the like.
- An electrical systemcan designate a power generation and/or distribution system that is widely dispersed (i.e., power generation, transformers, and/or electrical distribution components distributed geographically throughout a large region) or bounded within a particular location (e.g., a power plant within a production facility, a bounded geographic area, on board a ship, a factory, a data center, etc.).
- a network applicationis any application that is stored on an application server connected to a network (e.g., local area network, wide area network, etc.) in accordance with any contemporary client/server architecture model and can be accessed via the network.
- the network application programming interfaceresides on the application server separate from the client machine.
- the client interfacewould typically be a web browser (e.g. INTERNET EXPLORERTM, FIREFOXTM, NETSCAPETM, etc) that is in communication with the network application server via a network connection (e.g., HTTP, HTTPS, RSS, etc.).
- FIG. 1is an illustration of a system for utilizing real-time data for predictive analysis of the performance of a monitored system, in accordance with one embodiment.
- the system 100includes a series of sensors (i.e., Sensor A 104 , Sensor B 106 , Sensor C 108 ) interfaced with the various components of a monitored system 102 , a data acquisition hub 112 , an analytics server 116 , and a thin-client device 128 .
- the monitored system 102is an electrical power generation plant.
- the monitored system 102is an electrical power transmission infrastructure.
- the monitored system 102is an electrical power distribution system.
- the monitored system 102includes a combination of one or more electrical power generation plant(s), power transmission infrastructure(s), and/or an electrical power distribution system. It should be understood that the monitored system 102 can be any combination of components whose operations can be monitored with conventional sensors and where each component interacts with or is related to at least one other component within the combination. For a monitored system 102 that is an electrical power generation, transmission, or distribution system, the sensors can provide data such as voltage, frequency, current, power, power factor, and the like.
- the sensorsare configured to provide output values for system parameters that indicate the operational status and/or “health” of the monitored system 102 .
- the current output or voltage readings for the various components that comprise the power generation systemis indicative of the overall health and/or operational condition of the system.
- the sensorsare configured to also measure additional data that can affect system operation.
- the sensor outputcan include environmental information, e.g., temperature, humidity, etc., which can impact electrical power demand and can also affect the operation and efficiency of the power distribution system itself
- the sensorsare configured to output data in an analog format.
- electrical power sensor measurementse.g., voltage, current, etc.
- the sensorsare configured to output data in a digital format.
- the same electrical power sensor measurementsmay be taken in discrete time increments that are not continuous in time or amplitude.
- the sensorsare configured to output data in either an analog or digital format depending on the sampling requirements of the monitored system 102 .
- the sensorscan be configured to capture output data at split-second intervals to effectuate “real time” data capture.
- the sensorscan be configured to generate hundreds of thousands of data readings per second. It should be appreciated, however, that the number of data output readings taken by a sensor may be set to any value as long as the operational limits of the sensor and the data processing capabilities of the data acquisition hub 112 are not exceeded.
- each sensoris communicatively connected to the data acquisition hub 112 via an analog or digital data connection 110 .
- the data acquisition hub 112may be a standalone unit or integrated within the analytics server 116 and can be embodied as a piece of hardware, software, or some combination thereof.
- the data connection 110is a “hard wired” physical data connection (e.g., serial, network, etc.). For example, a serial or parallel cable connection between the sensor and the hub 112 .
- the data connection 110is a wireless data connection. For example, a radio frequency (RF), BLUETOOTHTM, infrared or equivalent connection between the sensor and the hub 112 .
- RFradio frequency
- BLUETOOTHTMinfrared or equivalent connection between the sensor and the hub 112 .
- the data acquisition hub 112is configured to communicate “real-time” data from the monitored system 102 to the analytics server 116 using a network connection 114 .
- the network connection 114is a “hardwired” physical connection.
- the data acquisition hub 112may be communicatively connected (via Category 5 (CAT5), fiber optic or equivalent cabling) to a data server (not shown) that is communicatively connected (via CAT5, fiber optic or equivalent cabling) through the Internet and to the analytics server 116 server.
- the analytics server 116being also communicatively connected with the Internet (via CAT5, fiber optic, or equivalent cabling).
- the network connection 114is a wireless network connection (e.g., Wi-Fi, WLAN, etc.). For example, utilizing an 802.11b/g or equivalent transmission format. In practice, the network connection utilized is dependent upon the particular requirements of the monitored system 102 .
- Data acquisition hub 112can also be configured to supply warning and alarms signals as well as control signals to monitored system 102 and/or sensors 104 , 106 , and 108 as described in more detail below.
- the analytics server 116hosts an analytics engine 118 , virtual system modeling engine 124 and several databases 126 , 130 , and 132 .
- the virtual system modeling enginecan, e.g., be a computer modeling system, such as described above. In this context, however, the modeling engine can be used to precisely model and mirror the actual electrical system.
- Analytics engine 118can be configured to generate predicted data for the monitored system and analyze difference between the predicted data and the real-time data received from hub 112 .
- FIG. 2is a diagram illustrating a more detailed view of analytic server 116 .
- analytic server 116is interfaced with a monitored facility 102 via sensors 202 , e.g., sensors 104 , 106 , and 108 .
- Sensors 202are configured to supply real-time data from within monitored facility 102 .
- the real-time datais communicated to analytic server 116 via a hub 204 .
- Hub 204can be configure to provide real-time data to server 116 as well as alarming, sensing and control featured for facility 102 .
- the real-time data from hub 204can be passed to a comparison engine 210 , which can form part of analytics engine 118 .
- Comparison engine 210can be configured to continuously compare the real-time data with predicted values generated by simulation engine 208 . Based on the comparison, comparison engine 210 can be further configured to determine whether deviations between the real-time and the expected values exists, and if so to classify the deviation, e.g., high, marginal, low, etc. The deviation level can then be communicated to decision engine 212 , which can also comprise part of analytics engine 118 .
- Decision engine 212can be configured to look for significant deviations between the predicted values and real-time values as received from the comparison engine 210 . If significant deviations are detected, decision engine 212 can also be configured to determine whether an alarm condition exists, activate the alarm and communicate the alarm to Human-Machine Interface (HMI) 214 for display in real-time via, e.g., thin client 128 . Decision engine 212 can also be configured to perform root cause analysis for significant deviations in order to determine the interdependencies and identify the parent-child failure relationships that may be occurring. In this manner, parent alarm conditions are not drowned out by multiple children alarm conditions, allowing the user/operator to focus on the main problem, at least at first.
- HMIHuman-Machine Interface
- and alarm condition for the parentcan be displayed via HMI 214 along with an indication that processes and equipment dependent on the parent process or equipment are also in alarm condition.
- server 116can maintain a parent-child logical relationship between processes and equipment comprising facility 102 .
- the processescan be classified as critical, essential, non-essential, etc.
- Decision engine 212can also be configured to determine health and performance levels and indicate these levels for the various processes and equipment via HMI 214 . All of which, when combined with the analytic capabilities of analytics engine 118 allows the operator to minimize the risk of catastrophic equipment failure by predicting future failures and providing prompt, informative information concerning potential/predicted failures before they occur. Avoiding catastrophic failures reduces risk and cost, and maximizes facility performance and up time.
- Simulation engine 208operates on complex logical models 206 of facility 102 . These models are continuously and automatically synchronized with the actual facility status based on the real-time data provided by hub 204 . In other words, the models are updated based on current switch status, breaker status, e.g., open-closed, equipment on/off status, etc. Thus, the models are automatically updated based on such status, which allows simulation engine to produce predicted data based on the current facility status. This in turn, allows accurate and meaningful comparisons of the real-time data to the predicted data.
- Example models 206 that can be maintained and used by server 116include power flow models used to calculate expected kW, kVAR, power factor values, etc., short circuit models used to calculate maximum and minimum available fault currents, protection models used to determine proper protection schemes and ensure selective coordination of protective devices, power quality models used to determine voltage and current distortions at any point in the network, to name just a few. It will be understood that different models can be used depending on the system being modeled.
- hub 204is configured to supply equipment identification associated with the real-time data. This identification can be cross referenced with identifications provided in the models.
- comparison engine 210determines whether the differential between the real-time sensor output value and the expected value exceeds a Defined Difference Tolerance (DDT) value (i.e., the “real-time” output values of the sensor output do not indicate an alarm condition) but below an alarm condition (i.e., alarm threshold value).
- DDTDefined Difference Tolerance
- a calibration requestis generated by the analytics engine 118 . If the differential exceeds, the alarm condition, an alarm or notification message is generated by the analytics engine 118 . If the differential is below the DTT value, the analytics engine does nothing and continues to monitor the real-time data and expected data.
- the alarm or notification messageis sent directly to the client (i.e., user) 128 , e.g., via HMI 214 , for display in real-time on a web browser, pop-up message box, e-mail, or equivalent on the client 128 display panel.
- the alarm or notification messageis sent to a wireless mobile device (e.g., BLACKBERRYTM, laptop, pager, etc.) to be displayed for the user by way of a wireless router or equivalent device interfaced with the analytics server 116 .
- the alarm or notification messageis sent to both the client 128 display and the wireless mobile device.
- the alarmcan be indicative of a need for a repair event or maintenance to be done on the monitored system. It should be noted, however, that calibration requests should not be allowed if an alarm condition exists to prevent the models form being calibrated to an abnormal state.
- model(s) 206can be updated or adjusted to reflect the actual facility configuration. This can include, but is not limited to, modifying the predicted data output from the simulation engine 208 , adjusting the logic/processing parameters utilized by the model(s) 206 , adding/subtracting functional elements from model(s) 206 , etc. It should be understood, that any operational parameter of models 206 can be modified as long as the resulting modifications can be processed and registered by simulation engine 208 .
- models 206can be stored in the virtual system model database 126 .
- the virtual system modelcan include components for modeling reliability, voltage stability, and power flow.
- models 206can include dynamic control logic that permits a user to configure the models 206 by specifying control algorithms and logic blocks in addition to combinations and interconnections of generators, governors, relays, breakers, transmission line, and the like.
- the voltage stability parameterscan indicate capacity in terms of size, supply, and distribution, and can indicate availability in terms of remaining capacity of the presently configured system.
- the power flow modelcan specify voltage, frequency, and power factor, thus representing the “health” of the system.
- virtual system model databasecan be configured to store the virtual system model.
- a duplicate, but synchronized copy of the virtual system modelcan be stored in a virtual simulation model database 130 .
- This duplicate modelcan be used for what-if simulations. In other words, this model can be used to allow a system designer to make hypothetical changes to the facility and test the resulting effect, without taking down the facility or costly and time consuming analysis. Such hypothetical can be used to learn failure patterns and signatures as well as to test proposed modifications, upgrades, additions, etc., for the facility.
- the real-time data, as well as trending produced by analytics engine 118can be stored in a real-time data acquisition database 132 .
- the virtual system modelis periodically calibrated and synchronized with “real-time” sensor data outputs so that the virtual system model provides data output values that are consistent with the actual “real-time” values received from the sensor output signals.
- the virtual system models described hereinare updated and calibrated with the real-time system operational data to provide better predictive output values. A divergence between the real-time sensor output values and the predicted output values generate either an alarm condition for the values in question and/or a calibration request that is sent to the calibration engine 134 .
- the analytics engine 118can be configured to implement pattern/sequence recognition into a real-time decision loop that, e.g., is enabled by a new type of machine learning called associative memory, or hierarchical temporal memory (HTM), which is a biological approach to learning and pattern recognition.
- Associative memoryallows storage, discovery, and retrieval of learned associations between extremely large numbers of attributes in real time.
- an associative memorystores information about how attributes and their respective features occur together. The predictive power of the associative memory technology comes from its ability to interpret and analyze these co-occurrences and to produce various metrics.
- Associative memoryis built through “experiential” learning in which each newly observed state is accumulated in the associative memory as a basis for interpreting future events.
- the associative memoryis able to learn normal patterns as a basis for identifying non-normal behavior and appropriate responses, and to associate patterns with particular outcomes, contexts or responses.
- the analytics engine 118is also better able to understand component mean time to failure rates through observation and system availability characteristics. This technology in combination with the virtual system model can be characterized as a “neocortical” model of the system under management.
- This approachalso presents a novel way to digest and comprehend alarms in a manageable and coherent way.
- the neocortical modelcould assist in uncovering the patterns and sequencing of alarms to help pinpoint the location of the (impending) failure, its context, and even the cause.
- responding to the alarmsis done manually by experts who have gained familiarity with the system through years of experience. However, at times, the amount of information is so great that an individual cannot respond fast enough or does not have the necessary expertise.
- An “intelligent” systemlike the neocortical system that observes and recommends possible responses could improve the alarm management process by either supporting the existing operator, or even managing the system autonomously.
- the virtual system model database 126can be configured to store one or more virtual system models, virtual simulation models, and real-time data values, each customized to a particular system being monitored by the analytics server 118 .
- the analytics server 118can be utilized to monitor more than one system at a time.
- the databases 126 , 130 , and 132can be hosted on the analytics server 116 and communicatively interfaced with the analytics engine 118 .
- databases 126 , 130 , and 132can be hosted on a separate database server (not shown) that is communicatively connected to the analytics server 116 in a manner that allows the virtual system modeling engine 124 and analytics engine 118 to access the databases as needed.
- the client 128can modify the virtual system model stored on the virtual system model database 126 by using a virtual system model development interface using well-known modeling tools that are separate from the other network interfaces. For example, dedicated software applications that run in conjunction with the network interface to allow a client 128 to create or modify the virtual system models.
- the client 128may utilize a variety of network interfaces (e.g., web browser, CITRIXTM, WINDOWS TERMINAL SERVICESTM, telnet, or other equivalent thin-client terminal applications, etc.) to access, configure, and modify the sensors (e.g., configuration files, etc.), analytics engine 118 (e.g., configuration files, analytics logic, etc.), calibration parameters (e.g., configuration files, calibration parameters, etc.), virtual system modeling engine 124 (e.g., configuration files, simulation parameters, etc.) and virtual system model of the system under management (e.g., virtual system model operating parameters and configuration files).
- data from those various components of the monitored system 102can be displayed on a client 128 display panel for viewing by a system administrator or equivalent.
- server 116is configured to synchronize the physical world with the virtual and report, e.g., via visual, real-time display, deviations between the two as well as system health, alarm conditions, predicted failures, etc.
- FIG. 3the synchronization of the physical world (left side) and virtual world (right side) is illustrated.
- sensors 202produce real-time data 302 for the processes 312 and equipment 314 that make up facility 102 .
- simulations 304 of the virtual system model 206provide predicted values 306 , which are correlated and synchronized with the real-time data 302 .
- the real-time datacan then be compared to the predicted values so that differences 308 can be detected.
- the significance of these differencescan be determined to determine the health status 310 of the system.
- the health statscan then be communicated to the processes 312 and equipment 314 , e.g., via alarms and indicators, as well as to thin client 128 , e.g., via web pages 316 .
- FIG. 4is an illustration of the scalability of a system for utilizing real-time data for predictive analysis of the performance of a monitored system, in accordance with one embodiment.
- an analytics central server 422is communicatively connected with analytics server A 414 , analytics server B 416 , and analytics server n 418 (i.e., one or more other analytics servers) by way of one or more network connections 114 .
- Each of the analytics serversis communicatively connected with a respective data acquisition hub (i.e., Hub A 408 , Hub B 410 , Hub n 412 ) that communicates with one or more sensors that are interfaced with a system (i.e., Monitored System A 402 , Monitored System B 404 , Monitored System n 406 ) that the respective analytical server monitors.
- a respective data acquisition hubi.e., Hub A 408 , Hub B 410 , Hub n 412
- analytics server A 414is communicative connected with data acquisition hub A 408 , which communicates with one or more sensors interfaced with monitored system A 402 .
- Each analytics server(i.e., analytics server A 414 , analytics server B 416 , analytics server n 418 ) is configured to monitor the sensor output data of its corresponding monitored system and feed that data to the central analytics server 422 . Additionally, each of the analytics servers can function as a proxy agent of the central analytics server 422 during the modifying and/or adjusting of the operating parameters of the system sensors they monitor. For example, analytics server B 416 is configured to be utilized as a proxy to modify the operating parameters of the sensors interfaced with monitored system B 404 .
- the central analytics server 422which is communicatively connected to one or more analytics server(s) can be used to enhance the scalability.
- a central analytics server 422can be used to monitor multiple electrical power generation facilities (i.e., monitored system A 402 can be a power generation facility located in city A while monitored system B 404 is a power generation facility located in city B) on an electrical power grid.
- monitored system A 402can be a power generation facility located in city A while monitored system B 404 is a power generation facility located in city B) on an electrical power grid.
- the number of electrical power generation facilities that can be monitored by central analytics server 422is limited only by the data processing capacity of the central analytics server 422 .
- the central analytics server 422can be configured to enable a client 128 to modify and adjust the operational parameters of any the analytics servers communicatively connected to the central analytics server 422 .
- each of the analytics serversare configured to serve as proxies for the central analytics server 422 to enable a client 128 to modify and/or adjust the operating parameters of the sensors interfaced with the systems that they respectively monitor.
- the client 128can use the central analytics server 422 , and vice versa, to modify and/or adjust the operating parameters of analytics server A 414 and utilize the same to modify and/or adjust the operating parameters of the sensors interfaced with monitored system A 402 .
- each of the analytics serverscan be configured to allow a client 128 to modify the virtual system model through a virtual system model development interface using well-known modeling tools.
- the central analytics server 422can function to monitor and control a monitored system when its corresponding analytics server is out of operation.
- central analytics server 422can take over the functionality of analytics server B 416 when the server 416 is out of operation. That is, the central analytics server 422 can monitor the data output from monitored system B 404 and modify and/or adjust the operating parameters of the sensors that are interfaced with the system 404 .
- the network connection 114is established through a wide area network (WAN) such as the Internet. In another embodiment, the network connection is established through a local area network (LAN) such as the company intranet. In a separate embodiment, the network connection 114 is a “hardwired” physical connection.
- the data acquisition hub 112may be communicatively connected (via Category 5 (CAT5), fiber optic or equivalent cabling) to a data server that is communicatively connected (via CAT5, fiber optic or equivalent cabling) through the Internet and to the analytics server 116 server hosting the analytics engine 118 .
- the network connection 114is a wireless network connection (e.g., Wi-Fi, WLAN, etc.). For example, utilizing an 802.11b/g or equivalent transmission format.
- regional analytics serverscan be placed between local analytics servers 414 , 416 , . . . , 418 and central analytics server 422 . Further, in certain embodiments a disaster recovery site can be included at the central analytics server 422 level.
- FIG. 5is a block diagram that shows the configuration details of analytics server 116 illustrated in FIG. 1 in more detail. It should be understood that the configuration details in FIG. 5 are merely one embodiment of the items described for FIG. 1 , and it should be understood that alternate configurations and arrangements of components could also provide the functionality described herein.
- the analytics server 116includes a variety of components.
- the analytics server 116is implemented in a Web-based configuration, so that the analytics server 116 includes (or communicates with) a secure web server 530 for communication with the sensor systems 519 (e.g., data acquisition units, metering devices, sensors, etc.) and external communication entities 534 (e.g., web browser, “thin client” applications, etc.).
- a variety of user views and functions 532are available to the client 128 such as: alarm reports, Active X controls, equipment views, view editor tool, custom user interface page, and XML parser.
- the analytics server 116also includes an alarm engine 506 and messaging engine 504 , for the aforementioned external communications.
- the alarm engine 506is configured to work in conjunction with the messaging engine 504 to generate alarm or notification messages 502 (in the form of text messages, e-mails, paging, etc.) in response to the alarm conditions previously described.
- the analytics server 116determines alarm conditions based on output data it receives from the various sensor systems 519 through a communications connection (e.g., wireless 516 , TCP/IP 518 , Serial 520 , etc) and simulated output data from a virtual system model 512 , of the monitored system, processed by the analytics engines 118 .
- a communications connectione.g., wireless 516 , TCP/IP 518 , Serial 520 , etc
- the virtual system model 512is created by a user through interacting with an external communication entity 534 by specifying the components that comprise the monitored system and by specifying relationships between the components of the monitored system.
- the virtual system model 512is automatically generated by the analytics engines 118 as components of the monitored system are brought online and interfaced with the analytics server 508 .
- a virtual system model database 526is communicatively connected with the analytics server 116 and is configured to store one or more virtual system models 512 , each of which represents a particular monitored system.
- the analytics server 116can conceivably monitor multiple electrical power generation systems (e.g., system A, system B, system C, etc.) spread across a wide geographic area (e.g., City A, City B, City C, etc.). Therefore, the analytics server 116 will utilize a different virtual system model 512 for each of the electrical power generation systems that it monitors.
- Virtual simulation model database 538can be configured to store a synchronized, duplicate copy of the virtual system model 512
- real-time data acquisition database 540can store the real-time and trending data for the system(s) being monitored.
- analytics server 116can receive real-time data for various sensors, i.e., components, through data acquisition system 202 .
- analytics server 116can comprise various drivers configured to interface with the various types of sensors, etc., comprising data acquisition system 202 .
- This datarepresents the real-time operational data for the various components.
- the datamay indicate that a certain component is operating at a certain voltage level and drawing certain amount of current.
- This informationcan then be fed to a modeling engine to generate a virtual system model 612 that is based on the actual real-time operational data.
- Analytics engine 118can be configured to compare predicted data based on the virtual system model 512 with real-time data received from data acquisition system 202 and to identify any differences. In some instances, analytics engine can be configured to identify these differences and then update, i.e., calibrate, the virtual system model 512 for use in future comparisons. In this manner, more accurate comparisons and warnings can be generated.
- Analytics engine 118can detect such changes and issue warnings that can allow the changes to be detected before a failure occurs.
- the analytic engine 118can be configured to generate warnings that can be communicated via interface 532 .
- a usercan access information from server 116 using thin client 534 .
- reportscan be generate and served to thin client 534 via server 540 .
- These reportscan, for example, comprise schematic or symbolic illustrations of the system being monitored.
- Status information for each componentcan be illustrated or communicated for each component. This information can be numerical, i.e., the voltage or current level. Or it can be symbolic, i.e., green for normal, red for failure or warning.
- intermediate levels of failurecan also be communicated, i.e., yellow can be used to indicate operational conditions that project the potential for future failure. It should be noted that this information can be accessed in real-time.
- the informationcan be accessed from anywhere and anytime.
- the Analytics Engine 118is communicatively interfaced with a HTM Pattern Recognition and Machine Learning Engine 551 .
- the HTM Engine 551is configured to work in conjunction with the Analytics Engine 118 and a virtual system model of the monitored system to make real-time predictions (i.e., forecasts) about various operational aspects of the monitored system.
- the HTM Engine 551works by processing and storing patterns observed during the normal operation of the monitored system over time. These observations are provided in the form of real-time data captured using a multitude of sensors that are imbedded within the monitored system.
- the virtual system modelis also updated with the real-time data such that the virtual system model “ages” along with the monitored system.
- Examples of a monitored systemincludes machinery, factories, electrical systems, processing plants, devices, chemical processes, biological systems, data centers, aircraft carriers, and the like. It should be understood that the monitored system can be any combination of components whose operations can be monitored with conventional sensors and where each component interacts with or is related to at least one other component within the combination.
- FIG. 6is an illustration of a flowchart describing a method for real-time monitoring and predictive analysis of a monitored system, in accordance with one embodiment.
- Method 600begins with operation 602 where real-time data indicative of the monitored system status is processed to enable a virtual model of the monitored system under management to be calibrated and synchronized with the real-time data.
- the monitored system 102is a mission critical electrical power system.
- the monitored system 102can include an electrical power transmission infrastructure.
- the monitored system 102includes a combination of thereof. It should be understood that the monitored system 102 can be any combination of components whose operations can be monitored with conventional sensors and where each component interacts with or is related to at least one other component within the combination.
- Method 600moves on to operation 604 where the virtual system model of the monitored system under management is updated in response to the real-time data.
- Thismay include, but is not limited to, modifying the simulated data output from the virtual system model, adjusting the logic/processing parameters utilized by the virtual system modeling engine to simulate the operation of the monitored system, adding/subtracting functional elements of the virtual system model, etc.
- any operational parameter of the virtual system modeling engine and/or the virtual system modelmay be modified by the calibration engine as long as the resulting modifications can be processed and registered by the virtual system modeling engine.
- Method 600proceeds on to operation 606 where the simulated real-time data indicative of the monitored system status is compared with a corresponding virtual system model created at the design stage.
- the design stage modelswhich may be calibrated and updated based on real-time monitored data, are used as a basis for the predicted performance of the system.
- the real-time monitored datacan then provide the actual performance over time.
- differencecan be identified a tracked by, e.g., the analytics engine 118 .
- Analytics engines 118can then track trends, determine alarm states, etc., and generate a real-time report of the system status in response to the comparison.
- the analyticscan be used to analyze the comparison and real-time data and determine if there is a problem that should be reported and what level the problem may be, e.g., low priority, high priority, critical, etc.
- the analyticscan also be used to predict future failures and time to failure, etc.
- reportscan be displayed on a conventional web browser (e.g. INTERNET EXPLORERTM, FIREFOXTM, NETSCAPETM, etc) that is rendered on a standard personal computing (PC) device.
- the “real-time” reportcan be rendered on a “thin-client” computing device (e.g., CITRIXTM, WINDOWS TERMINAL SERVICESTM, telnet, or other equivalent thin-client terminal application).
- the reportcan be displayed on a wireless mobile device (e.g., BLACKBERRYTM, laptop, pager, etc.).
- a wireless mobile devicee.g., BLACKBERRYTM, laptop, pager, etc.
- the “real-time” reportcan include such information as the differential in a particular power parameter (i.e., current, voltage, etc.) between the real-time measurements and the virtual output data.
- FIG. 7is an illustration of a flowchart describing a method for managing real-time updates to a virtual system model of a monitored system, in accordance with one embodiment.
- Method 700begins with operation 702 where real-time data output from a sensor interfaced with the monitored system is received.
- the sensoris configured to capture output data at split-second intervals to effectuate “real time” data capture.
- the sensoris configured to generate hundreds of thousands of data readings per second. It should be appreciated, however, that the number of data output readings taken by the sensor may be set to any value as long as the operational limits of the sensor and the data processing capabilities of the data acquisition hub are not exceeded.
- Method 700moves to operation 704 where the real-time data is processed into a defined format.
- the datais converted from an analog signal to a digital signal.
- the datais converted from a digital signal to an analog signal. It should be understood, however, that the real-time data may be processed into any defined format as long as the analytics engine can utilize the resulting data in a comparison with simulated output data from a virtual system model of the monitored system.
- Method 700continues on to operation 706 where the predicted (i.e., simulated) data for the monitored system is generated using a virtual system model of the monitored system.
- a virtual system modeling engineutilizes dynamic control logic stored in the virtual system model to generate the predicted output data.
- the predicted datais supposed to be representative of data that should actually be generated and output from the monitored system.
- Method 700proceeds to operation 708 where a determination is made as to whether the difference between the real-time data output and the predicted system data falls between a set value and an alarm condition value, where if the difference falls between the set value and the alarm condition value a virtual system model calibration and a response can be generated. That is, if the comparison indicates that the differential between the “real-time” sensor output value and the corresponding “virtual” model data output value exceeds a Defined Difference Tolerance (DDT) value (i.e., the “real-time” output values of the sensor output do not indicate an alarm condition) but below an alarm condition (i.e., alarm threshold value), a response can be generated by the analytics engine.
- DDTDefined Difference Tolerance
- the analytics engine 118if the differential exceeds, the alarm condition, an alarm or notification message is generated by the analytics engine 118 . In another embodiment, if the differential is below the DTT value, the analytics engine does nothing and continues to monitor the “real-time” data and “virtual” data. Generally speaking, the comparison of the set value and alarm condition is indicative of the functionality of one or more components of the monitored system.
- FIG. 8is an illustration of a flowchart describing a method for synchronizing real-time system data with a virtual system model of a monitored system, in accordance with one embodiment.
- Method 800begins with operation 802 where a virtual system model calibration request is received.
- a virtual model calibration requestcan be generated by an analytics engine whenever the difference between the real-time data output and the predicted system data falls between a set value and an alarm condition value.
- Method 800proceeds to operation 804 where the predicted system output value for the virtual system model is updated with a real-time output value for the monitored system. For example, if sensors interfaced with the monitored system outputs a real-time current value of A, then the predicted system output value for the virtual system model is adjusted to reflect a predicted current value of A.
- Method 800moves on to operation 806 where a difference between the real-time sensor value measurement from a sensor integrated with the monitored system and a predicted sensor value for the sensor is determined.
- the analytics engineis configured to receive “real-time” data from sensors interfaced with the monitored system via the data acquisition hub (or, alternatively directly from the sensors) and “virtual” data from the virtual system modeling engine simulating the data output from a virtual system model of the monitored system.
- the valuesare in units of electrical power output (i.e., current or voltage) from an electrical power generation or transmission system. It should be appreciated, however, that the values can essentially be any unit type as long as the sensors can be configured to output data in those units or the analytics engine can convert the output data received from the sensors into the desired unit type before performing the comparison.
- Method 800continues on to operation 808 where the operating parameters of the virtual system model are adjusted to minimize the difference.
- the logic parameters of the virtual system model that a virtual system modeling engine uses to simulate the data output from actual sensors interfaced with the monitored systemare adjusted so that the difference between the real-time data output and the simulated data output is minimized.
- this operationwill update and adjust any virtual system model output parameters that are functions of the virtual system model sensor values. For example, in a power distribution environment, output parameters of power load or demand factor might be a function of multiple sensor data values.
- the operating parameters of the virtual system model that mimic the operation of the sensorwill be adjusted to reflect the real-time data received from those sensors.
- authorization from a system administratoris requested prior to the operating parameters of the virtual system model being adjusted. This is to ensure that the system administrator is aware of the changes that are being made to the virtual system model.
- a reportis generated to provide a summary of all the adjustments that have been made to the virtual system model.
- virtual system modeling engine 124can be configured to model various aspects of the system to produce predicted values for the operation of various components within monitored system 102 . These predicted values can be compared to actual values being received via data acquisition hub 112 . If the differences are greater than a certain threshold, e.g., the DTT, but not in an alarm condition, then a calibration instruction can be generated. The calibration instruction can cause a calibration engine 134 to update the virtual model being used by system modeling engine 124 to reflect the new operating information.
- a certain thresholde.g., the DTT
- monitored system 102ages, or more specifically the components comprising monitored system 102 age, then the operating parameters, e.g., currents and voltages associated with those components will also change.
- the process of calibrating the virtual model based on the actual operating informationprovides a mechanism by which the virtual model can be aged along with the monitored system 102 so that the comparisons being generated by analytics engine 118 are more meaningful.
- step 902data is collected from, e.g., sensors 104 , 106 , and 108 .
- the sensorscan be configured to monitor protective devices within an electrical distribution system to determine and monitor the ability of the protective devices to withstand faults, which is describe in more detail below.
- step 904the data from the various sensors can be processed by analytics engine 118 in order to evaluate various parameters related to monitored system 102 .
- simulation engine 124can be configured to generate predicted values for monitored system 102 using a virtual model of the system that can be compared to the parameters generated by analytics engine 118 in step 904 . If there are differences between the actual values and the predicted values, then the virtual model can be updated to ensure that the virtual model ages with the actual system 102 .
- the monitored system 102ages, various components can be repaired, replaced, or upgraded, which can also create differences between the simulated and actual data that is not an alarm condition. Such activity can also lead to calibrations of the virtual model to ensure that the virtual model produces relevant predicted values. Thus, not only can the virtual model be updated to reflect aging of monitored system 102 , but it can also be updated to reflect retrofits, repairs, etc.
- a logical model of a facilities electrical system, a data acquisition system (data acquisition hub 112 ), and power system simulation engines (modeling engine 124 )can be integrated with a logic and methods based approach to the adjustment of key database parameters within a virtual model of the electrical system to evaluate the ability of protective devices within the electrical distribution system to withstand faults and also effectively “age” the virtual system with the actual system.
- FIGS. 10-12are flow charts presenting logical flows for determining the ability of protective devices within an electrical distribution system to withstand faults and also effectively “age” the virtual system with the actual system in accordance with one embodiment.
- FIG. 10is a diagram illustrating an example process for monitoring the status of protective devices in a monitored system 102 and updating a virtual model based on monitored data.
- the status of the protective devicescan be monitored in real time.
- protective devicescan include fuses, switches, relays, and circuit breakers. Accordingly, the status of the fuses/switches, relays, and/or circuit breakers, e.g., the open/close status, source and load status, and on or off status, can be monitored in step 1002 .
- step 1004It can be determined, in step 1004 , if there is any change in the status of the monitored devices. If there is a change, then in step 1006 , the virtual model can be updated to reflect the status change, i.e., the corresponding virtual components data can be updated to reflect the actual status of the various protective devices.
- step 1008predicted values for the various components of monitored system 102 can be generated. But it should be noted that these values are based on the current, real-time status of the monitored system.
- Real time sensor datacan be received in step 1012 . This real time data can be used to monitor the status in step 1002 and it can also be compared with the predicted values in step 1014 . As noted above, the difference between the predicted values and the real time data can also be determined in step 1014 .
- meaningful predicted values based on the actual condition of monitored system 102can be generated in steps 1004 to 1010 . These predicted values can then be used to determine if further action should be taken based on the comparison of step 1014 . For example, if it is determined in step 1016 that the difference between the predicted values and the real time sensor data is less than or equal to a certain threshold, e.g., DTT, then no action can be taken e.g., an instruction not to perform calibration can be issued in step 1018 . Alternatively, if it is determined in step 1020 that the real time data is actually indicative of an alarm situation, e.g., is above an alarm threshold, then a do not calibrate instruction can be generated in step 1018 and an alarm can be generated as described above. If the real time sensor data is not indicative of an alarm condition, and the difference between the real time sensor data and the predicted values is greater than the threshold, as determined in step 1022 , then an initiate calibration command can be generated in step 1024 .
- a certain thresholde.g.,
- step 1024a function call to calibration engine 134 can be generated in step 1026 .
- the function callwill cause calibration engine 134 to update the virtual model in step 1028 based on the real time sensor data.
- a comparison between the real time data and predicted datacan then be generated in step 1030 and the differences between the two computed.
- step 1032a user can be prompted as to whether or not the virtual model should in fact be updated. In other embodiments, the update can be automatic, and step 1032 can be skipped.
- step 1034the virtual model could be updated. For example, the virtual model loads, buses, demand factor, and/or percent running information can be updated based on the information obtained in step 1030 .
- An initiate simulation instructioncan then be generated in step 1036 , which can cause new predicted values to be generated based on the update of virtual model.
- the predicted values generated in step 1008are not only updated to reflect the actual operational status of monitored system 102 , but they are also updated to reflect natural changes in monitored system 102 such as aging. Accordingly, realistic predicted values can be generated in step 1008 .
- FIG. 11is a flowchart illustrating an example process for determining the protective capabilities of the protective devices being monitored in step 1002 .
- the protective devicescan be evaluated in terms of the International Electrotechnical Commission (IEC) standards or in accordance with the United States or American National Standards Institute (ANSI) standards. It will be understood, that the process described in relation to FIG. 11 is not dependent on a particular standard being used.
- IECInternational Electrotechnical Commission
- ANSIAmerican National Standards Institute
- a short circuit analysiscan be performed for the protective device.
- the protective devicecan be any one of a variety of protective device types.
- the protective devicecan be a fuse or a switch, or some type of circuit breaker.
- circuit breakersincluding Low Voltage Circuit Breakers (LVCBs), High Voltage Circuit Breakers (HVCBs), Mid Voltage Circuit Breakers (MVCBs), Miniature Circuit Breakers (MCBs), Molded Case Circuit Breakers (MCCBs), Vacuum Circuit Breakers, and Air Circuit Breakers, to name just a few. Any one of these various types of protective devices can be monitored and evaluated using the processes illustrated with respect to FIGS. 10-12 .
- the short circuit current, symmetric (I sym ) or asymmetric (I asym ), and/or the peak current (I peak )can be determined in step 1102 .
- the short circuit current at a delayed timeI symdelay
- a first cycle short circuit current (I sym ) and/or I peakcan be determined in step 1102 .
- the short circuit current, symmetric or asymmetriccan be determined in step 1102 .
- the short circuit current interrupting timecan be calculated.
- the fuse ratingcan first be determined in step 1104 .
- the fuse ratingcan be the current rating for the fuse.
- the X/Rcan be calculated in step 1105 and the asymmetric short circuit current (I asym ) for the fuse can be determined in step 1106 using equation 1.
- I ASYMI SYM ⁇ square root over (1+2 e ⁇ 2p/(X/R) ) ⁇ Eqn 1
- the inductants/reactants (X/R) ratiocan be calculated in step 1108 and compared to a fuse test X/R to determine if the calculated X/R is greater than the fuse test X/R.
- the calculated X/Rcan be determined using the predicted values provided in step 1008 .
- Various standard tests X/R valuescan be used for the fuse test X/R values in step 1108 .
- standard test X/R values for a LVCBcan be as follows:
- equation 12can be used to calculate an adjusted symmetrical short circuit current (I adisym ).
- I ADJSYMI SYM ⁇ ⁇ 1 + 2 ⁇ e - 2 ⁇ pf ⁇ ( CALC ⁇ ⁇ X / R ) 1 + 2 ⁇ e - 2 ⁇ pf ⁇ ( TEST ⁇ ⁇ X / R ) ⁇ Eq ⁇ ⁇ 12
- Iadjsymcan be set equal to I sym in step 1110 .
- step 1114it can then be determined if the fuse rating (step 1104 ) is greater than or equal to I adisym or I asym . If it is then it can determine in step 1118 that the protected device has passed and the percent rating can be calculated in step 1120 as follows:
- step 1114If it is determined in step 1114 that the device rating is not greater than or equal to I adjsym , then it can be determined that the device as failed in step 1116 . The percent rating can still be calculating in step 1120 .
- LVCBsit can first be determined whether they are fused in step 1122 . If it is determined that the LVCB is not fused, then in step 1124 can be determined if the LVCB is an instantaneous trip LVCB. If it is determined that the LVCB is an instantaneous trip LVCB, then in step 1130 the first cycle fault X/R can be calculated and compared to a circuit breaker test X/R (see example values above) to determine if the fault. X/R is greater than the circuit breaker test X/R. If the fault X/R is not greater than the circuit breaker test X/R, then in step 1132 it can be determined if the LVCB is peak rated.
- I peakcan be used in step 1146 below. If it is determined that the LVCB is not peak rated in step 1132 , then I adjsym can be set equal to I sym in step 1140 . In step 1146 , it can be determined if the device rating is greater or equal to I adjsym , or to I peak as appropriate, for the LVCB.
- step 1148If it is determined that the device rating is greater than or equal to I adjsym , then it can be determined that the LVCB has passed in step 1148 . The percent rating can then be determined using the equations for I adjsym defined above (step 1120 ) in step 1152 . If it is determined that the device rating is not greater than or equal to I adjsym , then it can be determined that the device has failed in step 1150 . The percent rating can still be calculated in step 1152 .
- the device ratingis greater than or equal to I adjsym or I peak as appropriate.
- the pass/fail determinationscan then be made in steps 1148 and 1150 respectively, and the percent rating can be calculated in step 1152 .
- a time delay calculationcan be performed at step 1128 followed by calculation of the fault X/R and a determination of whether the fault X/R is greater than the circuit breaker test X/R. If it is not, then Iadjsym can be set equal to Isym in step 1136 . If the calculated fault at X/R is greater than the circuit breaker test X/R, then Iadjsymdelay can be calculated in step 1138 using the following equation with, e.g., a 0.5 second maximum delay:
- I ADJSYM DELAYI SYM DELAY ⁇ ⁇ 1 + 2 ⁇ e - 60 ⁇ pf ⁇ ( CALC ⁇ ⁇ X / R ) 1 + 2 ⁇ e - 60 ⁇ pf ⁇ ( TEST ⁇ ⁇ X / R ) ⁇ Eq ⁇ ⁇ 14
- the device ratingis greater than or equal to I adjsym or I adjsymdelay .
- the pass/fail determinationscan then be made in steps 1148 and 1150 , respectively and the percent rating can be calculated in step 1152 . If it is determined that the LVCB is fused in step 1122 , then the fault X/R can be calculated in step 1126 and compared to the circuit breaker test X/R in order to determine if the calculated fault X/R is greater than the circuit breaker test X/R. If it is greater, then Il adjsym can be calculated in step 1154 using the following equation:
- I ADJSYMI SYM ⁇ ⁇ 1.02 + 0.98 ⁇ ⁇ e - 3 / ( CALC ⁇ ⁇ X / R ) 1.02 + 0.98 ⁇ ⁇ e - 3 / ( TEST ⁇ ⁇ X / R ) ⁇ Eq ⁇ ⁇ 13
- I adjsymcan be set equal to I sym in step 1156 . It can then be determined if the device rating is greater than or equal to I adjsym in step 1146 . The pass/fail determinations can then be carried out in steps 1148 and 1150 respectively, and the percent rating can be determined in step 1152 .
- FIG. 12is a diagram illustrating an example process for determining the protective capabilities of a HVCB.
- X/Rcan be calculated in step 1157 and a peak current (I peak ) can be determined using equation 11 in step 1158 .
- I peakpeak current
- step 1162it can be determined whether the HVCB's rating is greater than or equal to I peak as determined in step 1158 . If the device rating is greater than or equal to I peak , then the device has passed in step 1164 . Otherwise, the device fails in step 1166 . In either case, the percent rating can be determined in step 1168 using the following:
- an interrupting time calculationcan be made in step 1170 .
- a fault X/Rcan be calculated and then can be determined if the fault X/R is greater than or equal to a circuit breaker test X/R in step 1172 .
- the following circuit breaker test X/Rcan be used;
- I adjintsymcan be set equal to I sym in step 1174 , if the calculated fault X/R is greater than the circuit breaker test X/R, then contact parting time for the circuit breaker can be determined in step 1176 and equation 15 can then be used to determine I adjintsym in step 1178 .
- I ADJINT SYMI INT SYM ⁇ ⁇ 1 + 2 ⁇ ⁇ e - 4 ⁇ ⁇ pf * t / ( CALCX / R ) 1 + 2 ⁇ ⁇ e - 4 ⁇ ⁇ pf * t / ( TEST ⁇ ⁇ X / R ) ⁇ Eq ⁇ ⁇ 15
- step 1180it can be determined whether the device rating is greater than or equal to I adjintsym .
- the pass/fail determinationscan then be made in steps 1182 and 1184 respectively and the percent rating can be calculated in step 1186 using the following:
- FIG. 13is a flowchart illustrating an example process for determining the protective capabilities of the protective devices being monitored in step 1002 in accordance with another embodiment.
- the processcan start with a short circuit analysis in step 1302 .
- a selectioncan be made, as appropriate, between use of the symmetrical rating or asymmetrical rating for the device.
- the Multiplying Factor (MF) for the devicecan then be calculated in step 1304 .
- the MFcan then be used to determine I adjasym or I adjsym .
- the deviceFor LVCBs, it can first be determined whether the device is fused in step 1314 . If the device is not fused, then in step 1315 it can be determined whether the X/R is known for the device, if it is known, then the LVF can be calculated for the device in step 1320 . It should be noted that the LVF can vary depending on whether the LVCB is an instantaneous trip device or not. If the X/R is not known, then it can be determined in step 1317 , e.g., using the following:
- step 1316it can again be determined whether the X/R is known. If it is known, then the LVF can be calculated in step 1319 . If it is not known, then the X/R can be set equal to, e.g., 4.9.
- step 1321it can be determined if the LVF is less than 1 and if it is, then the LVF can be set equal to 1.
- intadjcan be determined using the following:
- step 1323it can be determined whether the device's symmetrical rating is greater than or equal to I intadj , and it can be determined based on this evaluation whether the device passed or failed in steps 1324 and 1325 respectively.
- FIG. 14is a diagram illustrating a process for evaluating the withstand capabilities of a MVCB in accordance with one embodiment.
- a determinationcan be made as to whether the following calculations will be based on all remote inputs, all local inputs or on a No AC Decay (NACD) ratio. For certain implementations, a calculation can then be made of the total remote contribution, total local contribution, total contribution (I intrmssym ), and NACD. If the calculated NACD is equal to zero, then it can be determined that all contributions are local. If NACD is equal to 1, then it can be determined that all contributions are remote.
- NACDNo AC Decay
- I intMF 1* I intrmssym
- step 1338the 3-phase device duty cycle can be calculated and then it can be determined in step 1340 , whether the device rating is greater than or equal to I int . Whether the device passed or failed can then be determined in steps 1342 and 1344 , respectively.
- MFmMFm*I symrms
- the above methodsprovide a mean to determine the withstand capability of various protective devices, under various conditions and using various standards, using an aged, up to date virtual model of the system being monitored.
- FIG. 15is a flow chart illustrating an example process for analyzing the reliability of an electrical power distribution and transmission system in accordance with one embodiment.
- the inputs used in step 1502can comprise power flow data, e,g., network connectivity, loads, generations, cables/transformer impedances, etc., which can be obtained from the predicted values generated in step 1008 , reliability data associated with each power system component, lists of contingencies to be considered, which can vary by implementation including by region, site, etc., customer damage (load interruptions) costs, which can also vary by implementation, and load duration curve information.
- Other inputscan include failure rates, repair rates, and required availability of the system and of the various components.
- a list of possible outage conditions and contingenciescan be evaluated including loss of utility power supply, generators, UPS, and/or distribution lines and infrastructure.
- a power flow analysis for monitored system 102 under the various contingenciescan be performed. This analysis can include the resulting failure rates, repair rates, cost of interruption or downtime versus the required system availability, etc.
- step 1512After the evaluation of step 1512 , or if it is determined that the system is not in a deficient state in step 1510 , then it can be determined if further contingencies need to be evaluated. If so, then the process can revert to step 1506 and further contingencies can be evaluated. If no more contingencies are to be evaluated, then a report can be generated in step 1514 .
- the reportcan include a system summary, total and detailed reliability indices, system availability, etc. The report can also identify system bottlenecks are potential problem areas.
- the reliability indicescan be based on the results of credible system contingencies involving both generation and transmission outages.
- the reliability indicescan include load point reliability indices, branch reliability indices, and system reliability indices.
- load/bus reliability indicescan be determined such as probability and frequency of failure, expected load curtailed, expected energy not supplied, frequency of voltage violations, reactive power required, and expected customer outage cost.
- the load point indicescan be evaluated for the major load buses in the system and can be used in system design for comparing alternate system configurations and modifications.
- Overall system reliability indicescan include power interruption index, power supply average MW curtailment, power supply disturbance index, power energy curtailment index, severity index, and system availability.
- the individual load point indicescan be aggregated to produce a set of system indices. These indices are indicators of the overall adequacy of the composite system to meet the total system load demand and energy requirements and can be extremely useful for the system planner and management, allowing more informed decisions to be made both in planning and in managing the system.
- the various analysis and techniquescan be broadly classified as being either Monte Carlo simulation or Contingency Enumeration.
- the processcan also use AC, DC and fast linear network power flow solutions techniques and can support multiple contingency modeling, multiple load levels, automatic or user-selected contingency enumeration, use a variety of remedial actions, and provides sophisticated report generation.
- the analysis of step 1506can include adequacy analysis of the power system being monitored based on a prescribed set of criteria by which the system must be judged as being in the success or failed state.
- the systemis considered to be in the failed state if the service at load buses is interrupted or its quality becomes unacceptable, i.e., if there are capacity deficiency, overloads, and/or under/over voltages
- load modelscan be used in the process of FIG. 15 including multi-step load duration curve, curtailable and Firm, and Customer Outage Cost models. Additionally, various remedial actions can be proscribed or even initiated including MW and MVAR generation control, generator bus voltage control, phase shifter adjustment, MW generation rescheduling, and load curtailment (interruptible and firm).
- FIG. 16is a flow chart illustrating an example process for analyzing the rel iability of an electrical power distribution and transmission system that takes weather information into account in accordance with one embodiment.
- real-time weather datacan be received, e.g., via a data feed such as an XML feed from National Oceanic and Atmosphere Administration (NOAA).
- NOAANational Oceanic and Atmosphere Administration
- this datacan be converted into reliability data that can be used in step 1502 .
- a logical model of a facility electrical systemcan be integrated into a real-time environment, with a robust AC Arc Flash simulation engine system modeling engine 124 ), a data acquisition system (data acquisition hub 112 ), and an automatic feedback system (calibration engine 134 ) that continuously synchronizes and calibrates the logical model to the actual operational conditions of the electrical system.
- the ability to re-align the simulation model in real-time so that it minors the real facility operating conditions, coupled with the ability to calibrate and age the model as the real facility ages, as described above,provides a desirable approach to predicting PPE levels, and safe working conditions at the exact time the repairs are intended to be performed. Accordingly, facility management can provide real-time compliance with, e.g., NFPA 70E and IEEE 1584 standards and requirements.
- FIG. 17is a diagram illustrating an example process for predicting in real-time various parameters associated with an alternating current (AC) arc flash incident. These parameters can include for example, the arc flash incident energy, arc flash protection boundary, and required Personal Protective Equipment (PPE) levels, e.g., in order to comply with NFPA-70E and IEEE-1584.
- updated virtual model datacan be obtained for the system being model, e.g., the updated data of step 1006 , and the operating modes for the system can be determined.
- an AC 3-phase short circuit analysiscan be performed in order to obtain bolted fault current values for the system.
- step 1706e.g., IEEE 1584 equations can be applied to the bolted fault values and any corresponding arcing currents can be calculated in step 1708 .
- the ratio of arc current to bolted currentcan then be used, in step 1710 , to determine the arcing current in a specific protective device, such as a circuit breaker or fuse.
- a coordinated time-current curve analysiscan be performed for the protective device in step 1712 .
- the arcing current in the protective device and the time current analysiscan be used to determine an associated fault clearing time, and in step 1716 a corresponding arc energy can be determined based on, e.g., IEEE 1584 equations applied to the fault clearing time and arcing current.
- the 100% arcing currentcan be calculated and for systems operating at less than 1 kV the 85% arcing current can also be calculated.
- the fault clearing time in the protective devicecan be determined at the 85% arcing current level.
- IEEE 1584 equationscan be applied to the fault clearing time (determined in step 1720 ) and the arcing current to determine the 85% arc energy level, and in step 1724 the 100% arcing current can be compared with the 85% arcing current, with the higher of the two being selected.
- IEEE 1584 equationsfor example, can then be applied to the selected arcing current in step 1726 and the PPE level and boundary distance can be determined in step 1728 .
- these valuescan be output, e.g., in the form of a display or report.
- the following evaluationscan be made in real-time and based on an accurat, e.g., aged, model of the system:
- FIG. 18is a flow chart illustrating an example process for real-time analysis of the operational stability of an electrical power distribution and transmission system in accordance with one embodiment.
- This analysisdetermines the real-time ability of the power system to: 1. sustain power demand and maintain sufficient active and reactive power reserve to cope with ongoing changes in demand and system disturbances due to contingencies, 2. operate safely with minimum operating cost while maintaining an adequate level of reliability, and 3. provide an acceptably high level of power quality (maintaining voltage and frequency within tolerable limits) when operating under contingency conditions.
- the dynamic time domain model datacan be updated to re-align the virtual system model in real-time so that it mirrors the real operating conditions of the facility.
- the updates to the domain model datacoupled with the ability to calibrate and age the virtual system model of the facility as it ages (i.e., real-time condition of the facility), as described above, provides a desirable approach to predicting the operational stability of the electrical power system operating under contingency situations. That is, these updates account for the natural aging effects of hardware that comprise the total electrical power system by continuously synchronizing and calibrating both the control logic used in the simulation and the actual operating conditions of the electrical system.
- the domain model dataincludes data that is reflective of both the static and non-static (rotating) components of the system.
- Static componentsare those components that are assumed to display no changes during the time in which the transient contingency event takes place. Typical time frames for disturbance in these types of elements range from a few cycles of the operating frequency of the system up to a few seconds.
- static components in an electrical systeminclude but are not limited to transformers, cables, overhead lines, reactors, static capacitors, etc.
- Non-static (rotating) componentsencompass synchronous machines including their associated controls (exciters, governors, etc.), induction machines, compensators, motor operated valves (MOV), turbines, static var compensators, fault isolation units (FfU), static automatic bus transfer (SABT) units, etc. These various types of non-static components can be simulated using various techniques. For example:
- the time domain model dataincludes “built-in” dynamic model data for exciters, governors, transformers, relays, breakers, motors, and power system stabilizers (PSS) offered by a variety of manufactures.
- dynamic model data for the electrical power systemmay be OEM manufacturer supplied control logic for electrical equipment such as automatic voltage regulators (AVR), governors, under load tap changing transformers relays, breakers motors, etc.
- AVRautomatic voltage regulators
- the time domain model dataincludes “user-defined” dynamic modeling data that is created by an authorized system administrator in accordance with user-defined control logic models.
- the user-defined modelsinteracts with the virtual system model of the electrical power system through “Interface Variables” 1816 that are created out of the user-defined control logic models.
- the controlsFor example, to build a user-defined excitation model, the controls requires that generator terminal voltage to be measured and compared with a reference quantity (voltage set point). Based on the specific control logic of the excitation and AVR, the model would then compute the predicted generator field voltage and return that value back to the application.
- the user-defined modelingsupports a large number of pre-defined control blocks (functions) that are used to assemble the required control systems and put them into action in a real-time environment for assessing the strength and security of the power system.
- the time domain model dataincludes both built-in dynamic model data and user-defined model data.
- a contingency eventcan be chosen out of a diverse list of contingency events to be evaluated. That is, the operational stability of the electrical power system can be assessed under a number of different contingency event scenarios including but not limited to a singular event contingency or multiple event contingencies (that are simultaneous or sequenced in time).
- the contingency events assessedare manually chosen by a system administrator in accordance with user requirements.
- the contingency events assessedare automatically chosen in accordance with control logic that is dynamically adaptive to past observations of the electrical power system. That is the control logic “learns” which contingency events to simulate based on past observations of the electrical power system operating under various conditions.
- contingency eventsinclude but are not limited to: Application/removal of three-phase fault.
- a transient stability analysis of the electrical power system operating under the various chosen contingenciescan be performed.
- This analysiscan include identification of system weaknesses and insecure contingency conditions. That is, the analysis can predict (forecast) the systems ability to sustain power demand, maintain sufficient active and reactive power reserve, operate safely with minimum operating cost while maintaining an adequate level of reliability, and provide an acceptably high level of power quality while being subjected to various contingency events.
- the results of the analysiscan be stored by an associative memory engine 1818 during step 1814 to support incremental learning about the operational characteristics of the system.
- the results of the predictions, analysis, and real-time datamay be fed, as needed, into the associative memory engine 1818 for pattern and sequence recognition in order to learn about the logical realities of the power system.
- engine 1818can also act as a pattern recognition engine or a Hierarchical Temporal Memory (HTM) engine.
- HTMHierarchical Temporal Memory
- concurrent inputs of various electrical, environmental, mechanical, and other sensory datacan be used to learn about and determine normality and abnormality of business and plant operations to provide a means of understanding failure modes and give recommendations.
- step 1810it can be determined if the system is operating in a deficient state when confronted with a specific contingency. If it is, then in step 1812 , a report is generated providing a summary of the operational stability of the system.
- the summarymay include general predictions about the total security and stability of the system and/or detailed predictions about each component that makes up the system.
- step 1808can determine if further contingencies needs to be evaluated. If so, then the process can revert to step 1806 and further contingencies can be evaluated.
- the results of real-time simulations performed in accordance with FIG. 18can be communicated in step 1812 via a report, such as a print out or display of the status.
- the informationcan be reported via a graphical user interface (thick or thin client) that illustrated the various components of the system in graphical format.
- the reportcan simply comprise a graphical indication of the security or insecurity of a component, subsystem, or system, including the whole facility.
- the resultscan also be forwarded to associative memory engine 1818 , where they can be stored and made available for predictions, pattern/sequence recognition and ability to imagine, e.g., via memory agents or other techniques, some of which are describe below, in step 1820 .
- the process of FIG. 18can be applied to a number of needs including but not limited to predicting system stability due to: Motor starting and motor sequencing, an example is the assessment of adequacy of a power system in emergency start up of auxiliaries; evaluation of the protections such as under frequency and under-voltage load shedding schemes, example of this is allocation of required load shedding for a potential loss of a power generation source; determination of critical clearing time of circuit breakers to maintain stability; and determination of the sequence of protective device operations and interactions.
- FIG. 19is a flow chart illustrating an example process for conducting a real-time power capacity assessment of an electrical power distribution and transmission system, in accordance with one embodiment.
- the stability of an electrical power systemcan be classified into two broad categories: transient (angular) stability and voltage stability (i.e., power capacity).
- Voltage stabilityrefers to the electrical system's ability to maintain acceptable voltage profiles under different system topologies and load changes (i.e., contingency events). That is, voltage stability analyses determine bus voltage profiles and power flows in the electrical system before, during, and immediately after a major disturbance.
- voltage instabilitystems from the attempt of load dynamics to restore power consumption beyond the capability of the combined transmission and generation system.
- One factor that conies into playis that unlike active power, reactive power cannot be transported over long distances. As such, a power system rich in reactive power resources is less likely to experience voltage stability problems. Overall, the voltage stability of a power system is of paramount importance in the planning and daily operation of an electrical system.
- transient stabilityhas been the main focus of power system professionals.
- the occurrences of voltage instabilityhas become increasingly frequent and therefore has gained increased attention from power system planners and power system facility operators.
- the ability to learn, understand and make predictions about available power system capacity and system susceptibility to voltage instability, in real-timewould be beneficial in generating power trends for forecasting purposes.
- the voltage stability modeling data for the components comprising the electrical systemcan be updated to re-align the virtual system model in “real-time” so that it minors the real operating conditions of the facility.
- These updates to the voltage stability modeling datacoupled with the ability to calibrate and age the virtual system model of the facility as it ages real-time condition of the facility), as described above, provides a desirable approach to predicting occurrences of voltage instability (or power capacity) in the electrical power system when operating under contingency situations. That is, these updates account for the natural aging effects of hardware that comprise the total electrical power system by continuously synchronizing and calibrating both the control logic used in the simulation and the actual operating conditions of the electrical system.
- the voltage stability modeling dataincludes system data that has direct influence on the electrical system's ability to maintain acceptable voltage profiles when the system is subjected to various contingencies, such as when system topology changes or when the system encounters power load changes.
- Some examples of voltage stability modeling dataare load scaling data, generation scaling data, load growth factor data, load growth increment data, etc.
- the voltage stability modeling dataincludes “built-in” data supplied by an OEM manufacturer of the components that comprise the electrical equipment.
- the voltage stability datain order to cope with recent advances power system controls, includes “user-defined” data that is created by an authorized system administrator in accordance with user-defined control logic models. The user-defined models interact with the virtual system model of the electrical power system through “Interface Variables” 1916 that are created out of the user-defined control logic models.
- the voltage stability modeling dataincludes a combination of both built-in model data and user-defined model data.
- a contingency eventcan be chosen out of a diverse list of contingency events to be evaluated. That is, the voltage stability of the electrical power system can be assessed under a number of different contingency event scenarios including but not limited to a singular event contingency or multiple event contingencies (that are simultaneous or sequenced in time).
- the contingency events assessedare manually chosen by a system administrator in accordance with user requirements.
- the contingency events assessedare automatically chosen in accordance with control logic that is dynamically adaptive to past observations of the electrical power system. That is the control logic “learns” which contingency events to simulate based on past observations of the electrical power system operating under various conditions.
- Some examples of contingency eventsinclude but are not limited to: loss of utility supply to the electrical system, loss of available power generation sources, system load changes/fluctuations, loss of distribution infrastructure associated with the electrical system, etc.
- a voltage stability analysis of the electrical power system operating under the various chosen contingenciescan be performed.
- This analysiscan include a prediction (forecast) of the total system power capacity, available system power capacity and utilized system power capacity of the electrical system of the electrical system under various contingencies. That is, the analysis can predict (forecast) the electrical system's ability to maintain acceptable voltage profiles during load changes and when the overall system topology undergoes changes.
- the results of the analysiscan be stored by an associative memory engine 1918 during step 1914 to support incremental learning about the power capacity characteristics of the system. That is, the results of the predictions, analysis, and real-time data may be fed, as needed, into the associative memory engine 1918 for pattern and sequence recognition in order to learn about the voltage stability of the electrical system in step 1920 .
- concurrent inputs of various electrical, environmental, mechanical, and other sensory datacan be used to learn about and determine normality and abnormality of business and plant operations to provide a means of understanding failure modes and give recommendations.
- step 1910it can be determined if there is voltage instability in the system when confronted with a specific contingency. If it is, then in step 1912 , a report is generated providing a summary of the specifics and source of the voltage instability.
- the summarymay include general predictions about the voltage stability of the overall system and/or detailed predictions about each component that makes up the system.
- step 1908can determine if further contingencies needs to be evaluated. If so, then the process can revert to step 1906 and further contingencies can be evaluated.
- the results of real-time simulations performed in accordance with FIG. 19can be communicated in step 1912 via a report, such as a print out or display of the status.
- the informationcan be reported via a graphical user interface (thick or thin client) that illustrated the various components of the system in graphical format.
- the reportcan simply comprise a graphical indication of the capacity of a subsystem or system, including the whole facility.
- the resultscan also be forwarded to associative memory engine 1918 , where they can be stored and made available for predictions, pattern/sequence recognition and ability to imagine, e.g., via memory agents or other techniques, some of which are describe below, in step 1920 .
- the systems and methods described abovecan also be used to provide reports (step 1912 ) on, e.g., total system electrical capacity, total system capacity remaining, total capacity at all busbars and/or processes, total capacity remaining at all busbars and/or processes, total system loading, loading at each busbar and/or process, etc.
- the process of FIG. 19can receive input data related to power flow, e.g., network connectivity, loads, generations, cables/transformers, impedances power security, contingencies, and capacity assessment model data and can produce as outputs data related to the predicted and designed total system capacity, available capacity, and present capacity. This information can be used to make more informed decisions with respect to management of the facility.
- input data related to power flowe.g., network connectivity, loads, generations, cables/transformers, impedances power security, contingencies, and capacity assessment model data
- This informationcan be used to make more informed decisions with respect to management of the facility.
- FIG. 20is a flow chart illustrating an example process for performing real-time harmonics analysis of an electrical power distribution and transmission system, in accordance with one embodiment.
- ACalternating current
- DCdirect current
- harmonic distortion analysisAs part of traditional power analysis.
- Metering and sensor packagesare currently available to monitor harmonic distortions within an electrical system. However, it is not feasible to fully sensor out an electrical system at all possible locations due to cost and the physical accessibility limitations in certain parts of the system. Therefore, there is a need for techniques that predict, through real-time simulation, the sources of harmonic distortions within an electrical system, the impacts that harmonic distortions have or may have, and what steps (i.e., harmonics filtering) may be taken to minimize or eliminate harmonics from the system.
- the processprovides a harmonics analysis solution that uses a real-time snap shot captured by a data acquisition system to perform a real-time system power quality evaluation at all locations regardless of power quality metering density.
- This processintegrates, in real-time, a logical simulation model (i.e., virtual system model) of the electrical system, a data acquisition system, and power system simulation engines with a logic based approach to synchronize the logical simulation model with conditions at the real electrical system to effectively “age” the simulation model along with the actual electrical system.
- predictions about harmonic distortions in an electrical systemmay be accurately calculated in real-time. Condensed, this process works by simulating harmonic distortions in an electrical system through subjecting a real-time updated virtual system model of the system to one or more simulated contingency situations.
- the harmonic frequency modeling data for the components comprising the electrical systemcan be updated to re-align the virtual system model in “real-time” so that it mirrors the real operating conditions of the facility.
- These updates to the harmonic frequency modeling datacoupled with the ability to calibrate and age the virtual system model of the facility as it ages (i.e., real-time condition of the facility), as described above, provides a desirable approach to predicting occurrences of harmonic distortions within the electrical power system when operating under contingency situations. That is, these updates account for the natural aging effects of hardware that comprise the total electrical power system by continuously synchronizing and calibrating both the control logic used in the simulation and the actual operating conditions of the electrical system.
- Harmonic frequency modeling datahas direct influence over how harmonic distortions are simulated during a harmonics analysis.
- Examples of data that is included with the harmonic frequency modeling datainclude: IEEE 519 and/or Mil 1399 compliant system simulation data, generator/cable/motor skin effect data, transformer phase shifting data, generator impedance data, induction motor impedance data, etc.
- a contingency eventcan be chosen out of a diverse list of contingency events to be evaluated. That is, the electrical system can be assessed for harmonic distortions under a number of different contingency event scenarios including but not limited to a singular event contingency or multiple event contingencies (that are simultaneous or sequenced in time).
- the contingency events assessedare manually chosen by a system administrator in accordance with user requirements.
- the contingency events assessedare automatically chosen in accordance with control logic that is dynamically adaptive to past observations of the electrical power system. That is the control logic “learns” which contingency events to simulate based on past observations of the electrical power system operating under various conditions.
- contingency eventsinclude but are not limited to additions (bringing online) and changes of equipment that effectuate a non-linear load on an electrical power system (e.g., as rectifiers, arc furnaces, AC/DC drives, variable frequency drives, diode-capacitor input power supplies, uninterruptible power supplies, etc.) or other equipment that draws power in short intermittent pulses from the electrical power system.
- an electrical power systeme.g., as rectifiers, arc furnaces, AC/DC drives, variable frequency drives, diode-capacitor input power supplies, uninterruptible power supplies, etc.
- a harmonic distortion analysis of the electrical power system operating under the various chosen contingenciescan be performed.
- This analysiscan include predictions (forecasts) of different types of harmonic distortion data at various points within the system.
- Harmonic distortion datamay include but are not limited to:
- the harmonica analysiscan predict (forecast) various indicators (harmonics data) of harmonic distortions occurring within the electrical system as it is being subjected to various contingency situations.
- the results of the analysiscan be stored by an associative memory engine 2016 during step 2014 to support incremental learning about the harmonic distortion characteristics of the system. That is, the results of the predictions, analysis, and real-time data may be fed, as needed, into the associative memory engine 2016 for pattern and sequence recognition in order to learn about the harmonic distortion profile of the electrical system in step 2018 .
- concurrent inputs of various electrical, environmental, mechanical, and other sensory datacan be used to learn about and determine normality and abnormality of business and plant operations to provide a means of understanding failure modes and give recommendations.
- step 2010it can be determined if there are harmonic distortions within the system when confronted with a specific contingency. If it is, then in step 2012 , a report is generated providing a summary of specifics regarding the characteristics and sources of the harmonic distortions.
- the summarymay include forecasts about the different types of harmonic distortion data (e.g., Wave-shape Distortions/Oscillations data, Parallel and Series Resonant Condition data, etc.) generated at various points throughout the system.
- the associative memory engine 2016can make predictions about the natural oscillation response(s) of the facility and compare those predictions with the harmonic components of the non-linear loads that are fed or will be fed from the system as indicated form the data acquisition system and power quality meters. This will give an indication of what harmonic frequencies that the potential resonant conditions lie at and provide facility operators with the ability to effectively employ a variety of harmonic mitigation techniques (e.g., addition of harmonic filter banks, etc.).
- step 2008can determine if further contingencies needs to be evaluated. If so, then the process can revert to step 2006 and further contingencies can be evaluated.
- the results of real-time simulations performed in accordance with FIG. 20can be communicated in step 2012 via a report, such as a print out or display of the status.
- the informationcan be reported via a graphical user interface (thick or thin client) that illustrated the various components of the system in graphical format.
- the reportcan simply comprise a graphical indication of the harmonic status of subsystem or system, including the whole facility.
- the resultscan also be forwarded to associative memory engine 2016 , where they can be stored and made available for predictions, pattern/sequence recognition and ability to imagine, e.g., via memory agents or other techniques, some of which are describe below, in step 2018 .
- the process of FIG. 20can receive input data related to power flow, e.g., network connectivity, loads, generations, cables/transformers, impedances, etc., power security, contingencies, and can produce as outputs data related to Point Specific Power Quality Indices, Branch Total Current Harmonic Distortion Indices, Bus and Node Total Voltage Harmonic Distortion Indices, Frequency Scan Indices for Positive Negative and Zero Sequences, Filter(s) Frequency Angle Response, Filter(s) Frequency Impedance Response, and Voltage and Current values over each filter elements (r, xl, xc).
- input data related to power flowe.g., network connectivity, loads, generations, cables/transformers, impedances, etc., power security, contingencies
- input data related to power flowe.g., network connectivity, loads, generations, cables/transformers, impedances, etc., power security, contingencies
- input data related to power flowe.g., network connectivity, loads,
- FIG. 21is a diagram illustrating how the HTM Pattern Recognition and Machine Learning Engine works in conjunction with the other elements of the analytics system to make predictions about the operational aspects of a monitored system, in accordance with one embodiment.
- the HIM Pattern Recognition and Machine Learning Engine 551is housed within an analytics server 116 and communicatively connected via a network connection 114 with a data acquisition hub 112 , a client terminal 128 and a virtual system model database 526 .
- the virtual system model database 526is configured to store the virtual system model of the monitored system.
- the virtual system modelis constantly updated with real-time data from the data acquisition hub 112 to effectively account for the natural aging effects of the hardware that comprise the total monitored system, thus, mirroring the real operating conditions of the system. This provides a desirable approach to predicting the operational aspects of the monitored power system operating under contingency situations.
- the HTM Machine Learning Engine 551is configured to store and process patterns observed from real-time data fed from the hub 112 and predicted data output from a real-time virtual system model of the monitored system. These patterns can later be used by the HTM Engine 551 to make real-time predictions (forecasts) about the various operational aspects of the system.
- the data acquisition hub 112is communicatively connected via data connections 110 to a plurality of sensors that are embedded throughout a monitored system 102 .
- the data acquisition hub 112may be a standalone unit or integrated within the analytics server 116 and can be embodied as a piece of hardware, software, or some combination thereof.
- the data connections 110are “hard wired” physical data connections (e.g., serial, network, etc.). For example, a serial or parallel cable connection between the sensors and the hub 112 .
- the data connections 110are wireless data connections. For example, a radio frequency (RF), BLUETOOTHTM, infrared or equivalent connection between the sensor and the hub 112 .
- RFradio frequency
- BLUETOOTHTMinfrared or equivalent connection between the sensor and the hub 112 .
- Examples of a monitored systemincludes machinery, factories, electrical systems, processing plants, devices, chemical processes, biological systems, data centers, aircraft carriers, and the like. It should be understood that the monitored system can be any combination of components whose operations can be monitored with conventional sensors and where each component interacts with or is related to at least one other component within the combination.
- the client 128is typically a conventional “thin-client” or “thick client” computing device that may utilize a variety of network interfaces (e.g., web browser, CITRIXTM, WINDOWS TERMINAL SERVICESTM, telnet, or other equivalent thin-client terminal applications, etc.) to access, configure, and modify the sensors (e.g., configuration files, etc.), power analytics engine (e.g., configuration files, analytics logic, etc.), calibration parameters (e.g., configuration files, calibration parameters, etc.), virtual system modeling engine (e.g., configuration files, simulation parameters, etc.) and virtual system model of the system under management (e.g., virtual system model operating parameters and configuration files).
- network interfacese.g., web browser, CITRIXTM, WINDOWS TERMINAL SERVICESTM, telnet, or other equivalent thin-client terminal applications, etc.
- the sensorse.g., configuration files, etc.
- power analytics enginee.g., configuration files, analytics logic, etc.
- the data from the various components of the monitored system and the real-time predictions (forecasts) about the various operational aspects of the systemcan be displayed on a client 128 display panel for viewing by a system administrator or equivalent.
- the datamay be summarized in a hard copy report 2102 .
- the HTM Machine Learning Engine 551is configured to work in conjunction with a real-time updated virtual system model of the monitored system to make predictions (forecasts) about certain operational aspects of the monitored system when it is subjected to a contingency event.
- the HTM Machine Learning Engine 551can be used to make predictions about the operational reliability of an electrical power system in response to contingency events such as a loss of power to the system, loss of distribution lines, damage to system infrastructure, changes in weather conditions, etc.
- indicators of operational reliabilityinclude but are not limited to failure rates, repair rates, and required availability of the power system and of the various components that make up the system.
- the operational aspectsrelate to an arc flash discharge contingency event that occurs during the operation of the power system.
- arc flash related operational aspectsinclude but are not limited to quantity of energy released by the arc flash event, required personal protective equipment (PPE) for personnel operating within the confines of the system during the arc flash event, and measurements of the arc flash safety boundary area around components comprising the power system.
- PPEpersonal protective equipment
- the operational aspectrelates to the operational stability of the system during a contingency event. That is, the system's ability to sustain power demand, maintain sufficient active and reactive power reserve, operate safely with minimum operating cost while maintaining an adequate level of reliability, and provide an acceptably high level of power quality while being subjected to a contingency event.
- the operational aspectrelates to the voltage stability of the electrical system immediately after being subjected to a major disturbance (i.e., contingency event).
- a major disturbancei.e., contingency event
- voltage instabilitystems from the attempt of load dynamics to restore power consumption, after the disturbance, in a manner that is beyond the capability of the combined transmission and generation system.
- Examples of predicted operational aspects that are indicative of the voltage stability of an electrical system subjected to a disturbanceinclude the total system power capacity, available system power capacity and utilized system power capacity of the electrical system under being subjected to various contingencies.
- voltage stabilityis the ability of the system to maintain acceptable voltage profiles while under the influence of disturbances.
- the operational aspectrelates to harmonic distortions in the electrical system subjected to a major disturbance.
- Harmonic distortionsare characterized by non-sinusoidal (non-linear) voltage and current waveforms. Most harmonic distortions result from the generation of harmonic currents caused by nonlinear load signatures.
- a nonlinear loadis characteristic in products such as computers, printers, lighting and motor controllers, and much of today's solid-state equipment. With the advent of power semiconductors and the use of switching power supplies, the harmonics distortion problem has become more severe.
- Examples of operational aspects that are indicative of harmonic distortionsinclude but are not limited to: wave-shape distortions/oscillations, parallel and series resonance, total harmonic distortion level, transformer K-Factor levels, true RMS loading of lines/transformers/capacitors, indicators of negative sequence harmonics being absorbed by alternating current (AC) motors, positive/negative/zero angle frequency response, etc.
- FIG. 22is an illustration of the various cognitive layers that comprise the neocortical catalyst process used by the HTM Pattern Recognition and Machine Learning Engine to analyze and make predictions about the operational aspects of a monitored system, in accordance with one embodiment.
- the neocortical catalyst processis executed by a neocortical model 2202 that is encapsulated by a real-time sensory system layer 2204 , which is itself encapsulated by an associative memory model layer 2206 .
- Each layeris essential to the operation of the neocortical catalyst process but the key component is still the neocortical model 2202 .
- the neocortical model 2202represents the “ideal” state and performance of the monitored system and it is continually updated in real-time by the sensor layer 2204 .
- the sensory layer 2204is essentially a data acquisition system comprised of a plurality of sensors imbedded within the electrical system and configured to provide real-time data feedback to the neocortical model 2202 .
- the associative memory layerobserves the interactions between the neocortical model 2202 and the real-time sensory inputs from the sensory layer 2204 to learn and understand complex relationships inherent within the monitored system. As the neocortical model 2202 matures over time, the neocortical catalyst process becomes increasingly accurate in making predictions about the operational aspects of the monitored system. This combination of the neocortical model 2202 , sensory layer 2204 and associative memory model layer 2206 works together to refine, suggest and predict similarly to how the human neocortex operates.
- FIG. 23is an example process for real-time three-dimensional (3D) visualization of the health, reliability, and performance of an electrical system, in accordance with one embodiment.
- 3D visualization viewssuch as 3D Plant Lifecycle Models
- the power analytics servercan determine which operating mode(s) that the electrical system is being simulated under. That is, the virtual system model of the electrical system can be modified by the user to simulate the system operating under multiple different operating scenarios (conditions) and system contingencies.
- the power analytics serveris configured to utilize the operating mode settings while simulating the operation of the electrical system to make predictions about the system's health, performance, availability and reliability.
- the operating mode(s)relate to the multiple contingency events that the electrical system may be subjected to during regular operations.
- the contingency eventscan be chosen out of a diverse list of contingency events to be evaluated.
- the operational health, performance, availability and reliability of the electrical power systemcan be assessed under a number of different contingency event scenarios including but not limited to a singular event contingency or multiple event contingencies that are simultaneous or sequenced in time). That is, in one embodiment, the contingency events assessed are manually chosen by a user in accordance with the his/her requirements.
- the contingency events assessedare automatically chosen in accordance with control logic that is dynamically adaptive o past observations of the electrical power system. That is the control logic “learns” which contingency events to simulate based on past observations of the electrical power system operating under various conditions.
- contingency eventsinclude but are not limited to:
- the operating mode(s)can relate to the multiple load levels that the electrical system operates under. That is, the virtual system model of the electrical system can be simulated under various power system load configurations or capacity conditions.
- the systemis simulated as operating under a base load power configuration. That is, the electrical system can be simulated as operating continuously at its maximum rated power output. Under this configuration, power systems only shut down to perform maintenance or if something breaks. Accordingly, the ability to test under such conditions cannot be achieved in conventional systems.
- the electrical systemcan be simulated as operating under a load following power configuration. That is, the electrical system is simulated as operating in a fluctuating manner by adjusting its power output as demand for electricity fluctuates throughout the day.
- the electrical systemis simulated as operating at various different power load capacity levels. For example, the electrical system may be simulated as operating at 10%, 25%, 50%, 75%, or 100% of its rated power generation capacity.
- the operating mode(s)can relate to different system and load point reliability indices assigned to the components that make up the electrical system.
- changescan be made to the reliability indices of individual components.
- changescan be made to all the components that make up the system.
- the operating mode(s)relate to the different remedial measures or actions that are implemented on the electrical system to respond to the various contingency situations that the system may be subjected to.
- remedial measurescan relate to: the various types of uninterruptible power supply (UPS) systems operating on the electrical system, various protective devices that are integrated to the system, various operating limits and conditions that are placed on the system, etc.
- UPSuninterruptible power supply
- the power analytics serveris configured to utilize the operating mode settings, determined in step 2302 , and the updated virtual system model of the electrical system to simulate and predict aspects relating to the real-time health, performance, reliability and availability of the electrical system.
- the power analytics servercan simulate and predict aspects relating to:
- the predictionsmay also relate to the real-time ability of the electrical system to: 1. sustain power demand and maintain sufficient active and reactive power reserve to cope with ongoing changes in demand and system disturbances due to contingencies, 2. operate safely with minimum operating cost while maintaining an adequate level of reliability, and 3. provide an acceptably high level of power quality (maintaining voltage and frequency within tolerable limits) when operating under contingency conditions.
- the power analytics serveris configured to output the predictions in the form of a print out or display of text, graphics, charts, labels, and model views that readily communicates the health and predicted performance of the electrical system in an elegant and efficient fashion.
- the informationcan be reported via a graphical user interface (“thick” or “thin” client) that illustrates the various components of the system in graphical format.
- the reportcan simply comprise a graphical indication of the capacity of a subsystem or system, including the whole facility.
- resultscan also be forwarded to associative memory engine 2308 , where they can be stored and made available for predictions, pattern/sequence recognition and ability to imagine, e.g., via memory agents or other techniques, some of which are describe below, in step 2308 .
- the model viewsare 3D (i.e., 3D Plant Lifecycle Model) model views of the various components, equipment and sub-systems that comprise the electrical system. Examples of some 3D model views 2502 are depicted in a client interface screenshot in FIG. 25 .
- the 3D model views 2502can be generated by an integrated 3D visualization engine that is an integrated part of the power analytics server.
- the model viewsare 2D model views of the various components, equipment and sub-systems making up the electrical system. An example of a 2D model view 2504 is also depicted in FIG. 25 .
- the results of the simulation and predictive analysiscan be stored by an associative memory engine to support incremental learning about the power capacity characteristics of the system. That is, the results of the predictions, analysis, and real-time data may be fed, as needed, into a machine learning engine for pattern and sequence recognition in order to learn about the health, performance, reliability and availability of the electrical system. Additionally, concurrent inputs of various electrical, environmental, mechanical, and other sensory data can be used to learn about and determine normality and abnormality of business and plant operations to provide a means of understanding failure modes and generate recommendations.
- FIG. 24is a diagram illustrating how the 3D Visualization Engine works in conjunction with the other elements of the analytics system to provide 3D visualization of the health, reliability, and performance of an electrical system, in accordance with one embodiment.
- the 3D Visualization Engine 2402is integrated within a power analytics server 116 that is communicatively connected via a network connection 114 with a data acquisition hub 112 , a client terminal 128 and a virtual system model database 526 .
- the virtual system model database 526is configured to store the virtual system model of the electrical system.
- the virtual system modelis constantly updated with real-time data from the data acquisition hub 112 to effectively account for the natural aging effects of the hardware that comprise the total electrical power system, thus, mirroring the real operating conditions of the system. This provides a desirable approach to predicting the operational aspects of the monitored power system and for communicating the predicted aspects through 3D visualization models of the facility.
- the 3D visualization engine 2402is interfaced with the predictive elements of the power analytics server and communicatively connected to the data acquisition hub 112 and the client 128 .
- the data acquisition hub 112is communicatively connected via data connections 110 to a plurality of sensors that are embedded throughout the electrical system 102 .
- the data acquisition hub 112may be a standalone unit or integrated within the analytics server 116 and can be embodied as a piece of hardware, software, or some combination thereof.
- the data connections 110are “hard wired” physical data connections (e.g., serial, network, etc.). For example, a serial or parallel cable connection between the sensors and the hub 112 .
- the data connections 110are wireless data connections.
- Real-time system data readingscan be fed continuously to the data acquisition hub 112 from the various sensors that are embedded within the electrical system 102 .
- the client 128is typically a conventional thin-client or thick-client computing device that may utilize a variety of network interfaces (e.g., web browser, CITRIXTM, WINDOWS TERMINAL SERVICESTM, telnet, or other equivalent thin-client terminal applications, etc.) to access, configure, and modify the sensors (e.g., configuration files, etc.), analytics engine e.g., configuration analytics logic, etc.), calibration parameters (e.g., configuration files, calibration parameters, etc.), virtual system modeling engine (e.g., configuration files, simulation parameters, choice of contingency event to simulate, etc.), 3D visualization engine (e.g., configuration files, 3D visualization parameters, etc.) and virtual system model of the system under management (e.g., virtual system model operating parameters and configuration files).
- network interfacese.g., web browser, CITRIXTM, WINDOWS TERMINAL SERVICESTM, telnet, or other equivalent thin-client terminal applications, etc.
- the sensorse.g., configuration files
- the data from the various components of the electrical system and the real-time predictions (forecasts) about the health, performance, reliability and availability of the electrical systemcan be displayed on a client 128 display panel for viewing by a system administrator or equivalent.
- the datamay be summarized in a hard copy report 2404 .
- FIG. 26is a diagram illustrating how the Schematic User Interface Creator Engine works in conjunction with the other elements of the analytics system to automatically generate a schematic user interface for visualizing the health, reliability, and performance of an electrical system, in accordance with one embodiment.
- Conventional electrical power system monitoring technologiestypically rely on custom graphical design and user-interface development efforts in order to create a system schematic user interface (displayable on a client terminal) that can be linked to real-time sensory data output by the various components that comprise an electrical power system.
- custom development effortstend to be cumbersome and often require an extraordinarily amount of time to implement.
- the toolscan be configured to automatically read electrical system configuration data from a database containing a virtual system representation (i.e., virtual system model) of the electrical system, generate a schematic user interface view of the electrical system, and intelligently link the various components included in the user interface to the predicted, monitored and/or derived output/values of those various components.
- a virtual system representationi.e., virtual system model
- the Schematic User Interface Creator Engine 2602can be integrated within a power analytics server 116 that can be communicatively connected via a network connection 114 with a data acquisition hub 112 , a client terminal 128 and a virtual system model database 526 .
- the virtual system model database 526can be configured to store the virtual system model of the electrical system.
- the virtual system modelcan be constantly updated with real-time data from the data acquisition hub 112 to effectively account for the natural aging effects of the hardware that comprise the total electrical power system, thus, mirroring the real operating conditions of the system.
- the Schematic User interface Creator Engine 2602can be configured to automatically create a schematic user interface that is representative of the electrical system and link that interface to the sensors monitoring the components (i.e., electrical equipment) that comprise the electrical system to enable real-time monitoring of the derived output/values from those components.
- the user interfacecan include a visual representation of each piece of electrical equipment (associated/tagged with a unique identifier) that comprises the electrical system.
- the schematic user interfaceis based on a one-line diagram construct.
- the schematic user interfaceis based on a technical system schematic diagram construct.
- the user interfacecan be based on any engineering diagram construct as long as the resulting interface can be displayed on a client terminal 128 to allow by an operator/administrator.
- the Schematic User Interface Creator Engine 2602can also be interfaced with the predictive elements of the power analytics server.
- the predictive elements of the power analytics servermay relate to the real-time health, performance, reliability and availability of the electrical system.
- the predictionscan be indicative of the real-time ability of the electrical system to: 1. sustain power demand and maintain sufficient active and reactive power reserve to cope with ongoing changes in demand and system disturbances due to contingencies, 2. operate safely with minimum operating cost while maintaining an adequate level of reliability, and 3. provide an acceptably high level of power quality (maintaining voltage and frequency within tolerable limits) when operating under contingency conditions.
- the data acquisition hub 112can be communicatively connected via data connections 110 to a plurality of sensors that can be embedded throughout the electrical system 102 .
- the data acquisition hub 112can be a standalone unit or integrated within the analytics server 116 and can be embodied as apiece of hardware, software, or some combination thereof.
- the data connections 110are “hard wired” physical data connections e.g., serial, network, etc.). For example, a serial or parallel cable connection between the sensors and the hub 112 .
- the data connections 110are wireless data connections. For example, a radio frequency (RF), BLUETOOTHTM, infrared or equivalent connection between the sensor and the hub 112 . Real-time system data readings can be fed continuously to the data acquisition hub 112 from the various sensors that are embedded within the electrical system 102 .
- RFradio frequency
- the client 128can be a conventional thin-client or thick-client computing device that can utilize a variety of network interfaces (e.g., web browser, CITRIXTM, WINDOWS TERMINAL SERVICESTM, telnet, or other equivalent thin-client terminal applications, etc.) to access, configure, and modify the sensors (e.g., configuration files, etc.), power analytics engine e.g., configuration files, analytics logic, etc.), calibration parameters (e.g., configuration files, calibration parameters, etc.), virtual system modeling engine (e.g., configuration files, simulation parameters, choice of contingency event to simulate, etc.), Schematic User Interface Creator Engine 2602 (e.g., configuration files, schematic interface algorithms, etc.) and virtual system model of the electrical system under management (e.g., virtual system model operating parameters and configuration files).
- network interfacese.g., web browser, CITRIXTM, WINDOWS TERMINAL SERVICESTM, telnet, or other equivalent thin-client terminal applications, etc.
- the sensors
- the real-time data from the various monitored components of the electrical system and the real-time predictions (forecasts) about the health, performance, reliability and availability of the electrical systemcan be simultaneously visualized on the schematic user interface that is displayed on a client terminal 128 for viewing by a system administrator or equivalent.
- This schematic user interfacecan provide a desirable approach to communicating the monitored and predicted operational aspects of an electrical system to an operator/administrator.
- the schematic user interfaceis rendered in a 2-dimensional (2D) graphical image format.
- the schematic user interfaceis rendered in a 3-dimensional (3D) graphical image format.
- FIG. 27is an example process for automatically generating a schematic user interface for visualizing the health, reliability, and performance of an electrical system, in accordance with one embodiment.
- the operational steps that comprise the processare implemented through a schematic user interface creator engine (application/software tool) that runs on the power analytics server.
- the operational steps that comprise the processare implemented through a schematic interface creator engine that runs on a separate (network application) server that is communicatively connected to the power analytics server.
- the operational steps that comprise the processare implemented through a plurality of discrete applications that are distributed amongst one or more (network application) servers that are communicatively connected with the power analytics server. It should be understood, however, that the application(s) can be distributed in any configuration as long as the application(s) can communicatively access the power analytics server to implement the process.
- system configuration datacan be extracted from a virtual system model of the electrical system.
- the virtual system modelcan be stored in one or more virtual system model database(s) that are communicatively connected to the power analytics server.
- the configuration datacan be stored in the memory of the power analytics server (or a network application server) and can include the unique identifiers (i.e., node IDs) of each of the components (i.e., piece of electrical equipment) that comprise the virtual system model, connectivity information (i.e., the electrical connectivity between the various virtual system model components and/or the data connectivity with the sensors monitoring those components) and/or equipment specific information such as bus or branch specific equipment type (e.g., generator, circuit breaker, transformer, motor, fuse, static load, etc.).
- unique identifiersi.e., node IDs
- connectivity informationi.e., the electrical connectivity between the various virtual system model components and/or the data connectivity with the sensors monitoring those components
- equipment specific informationsuch as bus or branch specific equipment type (e.g.,
- a logical construct of the virtual system modelcan be constructed from the system configuration data.
- the logical constructcan be created in an Extensible Markup Language (XML) format.
- the logical constructcan be created in an Extensible HyperText Markup Language (XHTML) format. It should be appreciated that the logical construct can be created using any mark-up language as long as it can be utilized to convey system configuration information about the components (i.e., electrical equipment) that make up the virtual system model.
- one or more graphical objectscan be generated to represent one or more pieces of electrical equipment included in the logical construct. This can be accomplished through the schematic user interface creator engine or equivalent application(s) parsing the system configuration data stored in the logical construct and generating appropriate symbol block(s) and/or graphical object(s) for each piece of electrical equipment that comprise the electrical system. The symbol block(s) or graphical object(s) that are generated can then be individually organized as buses and/or branches.
- the one or more graphical objectscan Be organized to generate a schematic user interface layout of the electrical system.
- a self-executing algorithmcan be either an integrated component of the schematic user interface creator engine or a separate discrete application that is configured to work in conjunction with the schematic user interface creator engine.
- the self-executing algorithmis a. .NET based application.
- the self-executing algorithmis an ACTIVE X based application.
- the self-executing algorithmis a JAVA based application. It should be understood, however, that the self-executing algorithm can be created using any type of programming language as long as the resulting algorithm can function either as a component of the schematic user interface creator engine or in conjunction with the same.
- the self-executing algorithmis in a force directed layout format. In another embodiment, the self-executing algorithm is in a tree layout format. In still another embodiment, the self-executing algorithm is in a layered diagraph layout format. It should be appreciated that the self-executing algorithm can follow any format as long as each of the one or more graphical objects/symbol blocks in the resulting schematic user interface layout can later be linked to a corresponding piece of electrical equipment that comprise the electrical system.
- the schematic user interface layout of the electrical systemAfter the schematic user interface layout of the electrical system is generated, it can be further optimized using the schematic interface creator engine (or equivalent application) to scan the schematic user interface layout and re-align the graphical object(s) based on one or more user selected optimization criteria.
- the schematic interface creator engineor equivalent application
- each of the one or more graphical objects in the schematic user interface layoutcan be communicatively linked to sensors configured to monitor the real-time operational status of the one or more pieces of electrical equipment represented by the one or more graphical objects.
- Thiscan be accomplished by intelligently linking the unique identifiers (e.g., equipment IDs) associated with each of the graphical objects/symbol blocks to their corresponding database files and creating a tag or communication channel with the same unique identifier to allow the files to be populated with data from the electrical equipment associated with each unique identifier.
- a Graphical Object A with a unique identifier of “001”can be linked to the database file “A” which is associated with the “001” identifier.
- a communication channel “001”can then be opened to allow data, acquired from a piece of electrical equipment associated with the “001” identifier, to populate database file “A.”
- the communication linkage between the graphical objects in the schematic user interface layout and the database(s) that store real-time data acquired from the operation of the electrical equipmentallow the schematic user interface to dynamically represent fluctuations in the real-time health, performance, reliability and availability of the electrical system.
- the buses and branches in the schematic user interface layoutcan be configured so that they change colors and/or become animated in response to the monitored real-tune data of and/or predicted values for the electrical system during operation.
- FIG. 28is a diagram illustrating how the Energy Management System Engine works in conjunction with the other elements of the analytics system to intelligently monitor and manage the cost, quality and reliability of energy generated and/or utilized by an electrical system, in accordance with one embodiment.
- Conventional approaches to energy managementtypically rely on real-time data readings supplied directly from power quality meters and sensors that are interfaced with the components (that comprise an electrical system) to provide a simple live metrics (e.g., voltage, current, frequency, etc.) of how the electrical system is operating.
- conventional energy management systemsmay also permit basic historical trending and rudimentary statistical methods to be performed to generate a historical energy profile of how the electrical system has previously operated.
- a conventional energy management systemonly presents a user (i.e., electrical system owner, administrator, and/or operator) with a view of how the electrical system is currently operating and/or has operated in the past without having the ability to make predictions about how the electrical system will operate in the future or allow the running of simulations based on user programmed “what-if” scenarios.
- a useri.e., electrical system owner, administrator, and/or operator
- the ability to predict the active power demand, system losses, reactive power demand and other energy parameters via a model (i.e., virtual system model) of the electrical system that can age and synchronize itself in real-time with the electrical system's actual operating conditionsis critical in obtaining accurate predictions of the system's energy efficiency (i.e., cost of losses that are inherent to the electrical system and those due to the inefficient operation of the electrical system), energy costs, reliability, availability, health and performance. Without operational conditions synchronization or an aging ability, these predictions are of little value as they are not reflective of the actual facility status and may lead the user to make false conclusions.
- Such a systemcan be configured to make predictions regarding the expected energy efficiency, energy costs, cost of inherent system losses and cost due to running the electrical system at poor power factors along with calculating and comparing the availability and reliability of the electrical system in real-time. These predictions and calculations can then be used to arrive at actionable, reliability centered maintenance and energy management strategies for mission critical or business critical operations which may lead to the re-alignment of the electrical system for optimized performance, maintenance or security.
- the Energy Management System Engine 2802can be integrated within a power analytics server 116 that can be communicatively connected via a network connection 114 with a data acquisition hub 112 , a client terminal 128 and a virtual system model database 526 .
- the virtual system model database 526can be configured to store the virtual system model of the electrical system 102 .
- the virtual system modelcan be constantly updated with real-time data from the data acquisition hub 112 to effectively account for the natural aging effects of the hardware that comprise the total electrical power system, thus, mirroring the real operating conditions of the system.
- the Energy Management System Engine 2802can also be interfaced with the predictive elements of the power analytics server.
- the predictive elements of the power analytics server 116may relate to the real-time health, performance, efficiency, reliability and availability of the electrical system 102 .
- the predictionscan be indicative of the real-time ability of the electrical system 102 to: 1. sustain power demand and maintain sufficient active and reactive power reserve to cope with ongoing changes in demand and system disturbances due to contingencies, 2. operate safely with minimum opera cost while maintaining an adequate level of reliability, and 3. provide an acceptably high level of power quality (maintaining voltage and frequency within tolerable limits) when operating under contingency conditions.
- the Energy Management System Engine 2802can be configured to process the real-time data output, the predicted data output, historical data output and forecasted aspects about the operation of the electrical system 102 to generate a user interface that can convey an operational state of the electrical system 102 to a user (i.e., electrical system 102 owner/system administrator/operator).
- the operational statecan be the real-time operational performance of the electrical system 102 .
- the operational statecan be the predicted operational performance of the electrical system 102 .
- the operational statecan be a historical data trending display of the historical operational performance of the electrical system 102 .
- the Energy Management System Engine 2802can be configured to generate a text-based or a graphics-based user interface that conveys real-time, predicted and/or historical operational performance of the electrical system 102 that can include real-time, predicted or historical information regarding the electrical system's 102 energy efficiency (i.e., the cost of energy utilized by the electrical system 102 , the cost of intrinsic power losses within the electrical system 102 , the cost of power losses due to the electrical system 102 running at poor power factors), reliability (i.e., the predicted ability of the electrical system 102 to withstand a contingency event that results in stress to the electrical system 102 ), availability (e.g., the predicted ability of the electrical system 102 to maintain availability of total power capacity), health and performance.
- energy efficiencyi.e., the cost of energy utilized by the electrical system 102 , the cost of intrinsic power losses within the electrical system 102 , the cost of power losses due to the electrical system 102 running at poor power factors
- reliabilityi.e., the predicted ability of the electrical system 102
- the user interfacecan also include a visual representation of each piece of electrical equipment(associated/tagged with a unique identifier) that comprises the electrical system 102 .
- the user interfaceis based on a one-line diagram construct.
- the user interfaceis based on a technical system schematic diagram construct.
- the user interfacecan be based on any engineering diagram construct as long as the resulting interface can be displayed on a client terminal 128 to allow viewing by an operator/administrator.
- the data acquisition hub 112can be communicatively connected via data connections 110 to a plurality of sensors that can be embedded throughout the electrical system 102 .
- the data acquisition hub 112can be a standalone unit or integrated within the analytics server 116 and can be embodied as a piece of hardware, software, or some combination thereof.
- the data connections 110are “hard wired” physical data connections (e.g., serial, network, etc.). For example, a serial or parallel cable connection between the sensors and the hub 112 .
- the data connections 110are wireless data connections. For example, a radio frequency (RF), BLUETOOTHTM, infrared or equivalent connection between the sensor and the hub 112 . Real-time system data readings can be fed continuously to the data acquisition hub 112 from the various sensors that are embedded within the electrical system 102 .
- RFradio frequency
- the client 128can be a conventional thin-client or thick-client computing device that can utilize a variety of network interfaces (e.g., web browser, CITRIXTM, WINDOWS TERMINAL SERVICESTM, telnet, or other equivalent thin-client terminal applications, etc.) to access, configure, and modify the sensors (e.g., configuration files, etc.), power analytics engine (e.g., configuration files, analytics logic, etc.), calibration parameters (e.g., configuration files, calibration parameters, etc.), virtual system modeling engine (e.g., configuration files, simulation parameters, choice of contingency event to simulate, etc.), Energy Management System Engine 2802 (e.g., configuration files, etc.) and virtual system model of the electrical system 102 under management (e.g., virtual system model operating parameters and configuration files).
- network interfacese.g., web browser, CITRIXTM, WINDOWS TERMINAL SERVICESTM, telnet, or other equivalent thin-client terminal applications, etc.
- the sensorse.g.
- the real-time data from the various monitored components of the electrical system 102 and the real-time predictions (forecasts) about the health, performance, reliability and availability of the electrical system 102can be simultaneously visualized on the user interface that is displayed on a client 128 terminal for viewing by a system administrator or equivalent.
- This user interfacecan provide a desirable approach to communicating the monitored and predicted operational aspects of an electrical system 102 to an operator/administrator.
- the user interfaceis rendered in a 2-dimensional (2D) graphical image format.
- the user interfaceis rendered in a 3-dimensional (3D) graphical image format.
- FIG. 29is a logic flow diagram depicting how the various elements of the Energy Management System can interact to provide intelligent energy monitoring and management of an electrical system, in accordance with one embodiment.
- the Energy Management Systemcan include a power analytics server 116 that can be communicatively connected to a real-time historical data trending database 2902 , a virtual system model database 526 , a data acquisition component 112 and a conventional web browser 2904 .
- the data acquisition component 112can be configured to communicate “real-time” sensor data readings 2906 from the various sensors interfaced throughout the electrical system to the analytics server 116 .
- the connectionis a “hardwire” physical connection.
- the power analytics server 116can be communicatively connected (via Category 5 (CAT5), fiber optic or equivalent cabling) to the data acquisition component 112 .
- the connectionis a wireless connection (e.g., Wi-Fi, BLUETOOTH, etc.).
- a wireless connectionutilizing an 802.11b/g or equivalent transmission format.
- the connectioncan be a combination of “hardwire” and “wireless” connection elements that are linked together based on the particular requirements of the Energy Management System.
- the power analytics server 116can be configured to host one or more analytic engines that allow the Energy Management System to perform its various functions.
- the power analytics server 116can host a machine learning engine 2908 , a virtual system modeling engine 2922 and/or a utility power pricing engine 2914 .
- the machine learning engine 2908can be configured to work in conjunction with the virtual system modeling engine 2922 and a virtual system model of the electrical system to make real-time predictions (i.e., forecasts) about the various operational aspects of the electrical system.
- the machine learning engine 2908work by processing and storing patterns observed during the normal operation of the electrical system over time. These observations are provided in the form of real-time data captured using a multitude of sensors that are imbedded within the electrical system.
- the utility pricing engine 2914can be configured to access a utility power pricing data source 2916 (that includes energy cost tables and other power billing data) to generate real-time energy cost and usage data 2910 that is reflective of the operational efficiency and performance of the electrical system.
- a utility power pricing data source 2916that includes energy cost tables and other power billing data
- real-time energy cost and usage data 2910can include, but are not limited to: 1. the real-time cost of energy utilized by the electrical system (energy cost), 2. the real-time cost of intrinsic power losses within the electrical system (cost of losses), and/or 3. the real-time cost of power losses due to the electrical system running at poor power factors (cost due to poor power factor).
- the utility power pricing data source 2916is populated with static utility power pricing data 2918 . That is, utility power pricing data that is either directly supplied by a user of the Energy Management System or data that is extracted from utility data pricing data sheets/tables that are downloaded from the utility power provider supplying electrical power to the electrical system.
- the utility power pricing data source 2916is populated with real-time dynamic power pricing data 2920 directly from the utility power provider supplying the electrical power to the electrical system.
- the real-time dynamic power pricing data 2920can be power spot pricing that is set by a utility power provider based on a variety of different real-time power grid operational factors (e.g., power grid load, cost of power generation, etc.).
- the virtual system model database 526can be configured to store a virtual system model of the electrical system.
- the virtual system modelcan be constantly updated with real-time data from the data acquisition hub 112 to effectively account for the natural ageing effects of the hardware that comprise the total electrical power system, thus, mirroring the real operating conditions of the system.
- the virtual system model stored in the virtual system model database 526can be accessed by the power analytic engines (i.e., machine learning engine 2908 and virtual system modeling engine 2922 ) that are part of the Energy Management System to make various types of power analytics forecasts/predictions including, but not limited to: power system reliability predictions 2928 , power system operations forecasts 2926 , power system state estimations 2924 and/or power system operational cost predictions (i.e., cost of energy, cost of losses and cost associated with running the electrical system inefficiently).
- the power analytic enginesi.e., machine learning engine 2908 and virtual system modeling engine 2922
- power system operational cost predictionsi.e., cost of energy, cost of losses and cost associated with running the electrical system inefficiently.
- the real-time historical data trending database 2902can be configured to store the real-time data output, the predicted data output and the forecasted aspects output from the power analytics server 116 and apply a historical trending algorithm to generate a historical data trending display that is indicative of the historical performance of the electrical system.
- the historical data trending displaycan present many different categories of data relating to the historical operation of the electrical system, including but not limited to:
- the network connection 114is a “hardwired” physical connection.
- the data acquisition hub 112may be communicatively connected (via Category 5 (CAT5), fiber optic or equivalent cabling) to a data server (not shown) that is communicatively connected (via CAT5, fiber optic or equivalent cabling) through the Internet and to the analytics server 116 server.
- the analytics server 116being also communicatively connected with the Internet (via CAT5, fiber optic, or equivalent cabling).
- the network connection 114is a wireless network connection (e.g., Wi-Fi, WLAN, etc.). For example, utilizing an 802.11b/g or equivalent transmission format. In practice, the network connection utilized is dependent upon the particular requirements of the monitored system 102 .
- the energy management system enginehosted by the power analytics server 116 , can be configured to collect and process the real-time data output, the predicted data output and the forecasted aspects output from the various analytic engines (i.e., a machine learning engine 2908 , a virtual system modeling engine 2922 and/or a utility power pricing engine 2914 ) that comprise the Energy Management System and generate a text or graphical user interface that conveys an operational state of the electrical system.
- various analytic enginesi.e., a machine learning engine 2908 , a virtual system modeling engine 2922 and/or a utility power pricing engine 2914 .
- the embodiments described hereincan be practiced with other computer system configurations including hand-held devices, microprocessor systems, microprocessor-based or programmable consumer electronics, minicomputers, mainframe computers and the like.
- the embodimentscan also be practiced in distributing computing environments where tasks are performed by remote processing devices that are linked through a network.
- the inventionalso relates to a device or an apparatus for performing these operations.
- the systems and methods described hereincan be specially constructed for the required purposes, such as the carrier network discussed above, or it may be a general purpose computer selectively activated or configured by a computer program stored in the computer.
- various general purpose machinesmay be used with computer programs written in accordance with the teachings herein, or it may be more convenient to construct a more specialized apparatus to perform the required operations.
- Certain embodimentscan also be embodied as computer readable code on a computer readable medium.
- the computer readable mediumis any data storage device that can store data, which can thereafter be read by a computer system. Examples of the computer readable medium include hard drives, network attached storage (NAS), read-only memory, random-access memory, CD-ROMs, CD-Rs, CD-RWs, magnetic tapes, and other optical and non-optical data storage devices.
- the computer readable mediumcan also be distributed over a network coupled computer systems so that the computer readable code is stored and executed in a distributed fashion.
Landscapes
- Engineering & Computer Science (AREA)
- Business, Economics & Management (AREA)
- Strategic Management (AREA)
- Theoretical Computer Science (AREA)
- Development Economics (AREA)
- General Physics & Mathematics (AREA)
- Physics & Mathematics (AREA)
- Economics (AREA)
- Finance (AREA)
- Accounting & Taxation (AREA)
- Marketing (AREA)
- General Business, Economics & Management (AREA)
- Entrepreneurship & Innovation (AREA)
- Human Resources & Organizations (AREA)
- Software Systems (AREA)
- Health & Medical Sciences (AREA)
- Game Theory and Decision Science (AREA)
- Data Mining & Analysis (AREA)
- Evolutionary Computation (AREA)
- Artificial Intelligence (AREA)
- Tourism & Hospitality (AREA)
- Computer Vision & Pattern Recognition (AREA)
- Medical Informatics (AREA)
- Computing Systems (AREA)
- General Engineering & Computer Science (AREA)
- Mathematical Physics (AREA)
- General Health & Medical Sciences (AREA)
- Primary Health Care (AREA)
- Water Supply & Treatment (AREA)
- Public Health (AREA)
- Operations Research (AREA)
- Quality & Reliability (AREA)
- Automation & Control Theory (AREA)
- Computational Linguistics (AREA)
- Testing And Monitoring For Control Systems (AREA)
- Remote Monitoring And Control Of Power-Distribution Networks (AREA)
Abstract
Description
IASYM=ISYM√{square root over (1+2e−2p/(X/R))}
- PCB, ICCB=6.59
- MCCB, ICCB rated<=10,000A=1.73
- MCCB, ICCB rated 10,001−20,000A=3.18
- MCCB, ICCB rated>20,000A=4.9
IPEAK=√{square root over (2)}ISYM{1.02+0.98e−3/(X/R)}
- 50 Hz Test X/R=13.7
- 60 Hz Test X/R=16.7
- (DC Time Constant=0.45 ms)
(X/R)mod=(X/R)*60H/(system Hz).
% rating=Iadjasym*100/device rating; or
% rating=Iadjsym*100/device rating.
- PCB, ICCB=6.59
- MCCB, ICCB rated<=10,000A=1.73
- MCCB, ICCB rated 10,001−20,000A=3.18
- MCCB, ICCB rated>20,000A=4.9
- MCCB/ICCB/PCB With Instantaneous:
- Iint, adj=LVF*Isym, rms
- PCB Without Instantaneous:
- Iint, adj=LVFp*Isym, rms(½, Cyc)
- int, adj=LVFasym*Isym,rms(3-8Cyc)
% rating=Iintadj*100/device rating,
Iint=MFr*Iintrmssym
Iint=MF1*Iintrmssym
Iint=AMF1*Iinonssym/S
% rating=Iint*100/3pdevice rating.
Imompeak=MFp*Isymrms
% rating=Imompeak*100/device peak (crest) rating.
Imomsym=MFm*Isymrms
% rating=Imomsym*100/deviceC&L, rms rating.
- Arc Flash Exposure based on
IEEE 1584; - Arc Flash Exposure based on NFPA 70E;
- Network-Based Arc Flash Exposure on AC Systems/Single Branch Case;
- Network-Based Arc Flash Exposure on AC Systems/Multiple Branch Cases;
- Network Arc Flash Exposure on DC Networks;
- Exposure Simulation at Switchgear Box, MCC Box, Open Area and Cable Grounded and Ungrounded;
- Calculate and Select Controlling Branch(s) for Simulation of Arc Flash;
- Test Selected Clothing;
- Calculate Clothing Required;
- Calculate Safe Zone with Regard to User Defined Clothing Category;
- Simulated Art Heat Exposure at User Selected locations;
- User Defined Fault Cycle for 3-Phase and Controlling Branches;
- User Defined Distance for Subject;
- 100% and 85% Arcing Current;
- 100% and 85% Protective Device Time;
- Protective Device Setting Impact on Arc Exposure Energy;
- User Defined Label Sizes;
- Attach Labels to One-Line Diagram for User Review;
- Plot Energy for Each Bus;
- Write Results into Excel;
- View and Print Graphic Label for User Selected Bus(s); and
- Work permit.
- Arc Flash Exposure based on
- For Synchronous Machines: thermal (round rotor) and hydraulic (salient pole) units can be both simulated either by using a simple model or by the most complete two-axis including damper winding representation.
- For Induction Machines: a complete two-axis model can be used. Also it is possible to model them by just providing the testing curves current, power factor, and torque as a function of speed).
- For Motor Operated Valves (MOVs): Two modes of MOV operation are of interest, namely, opening and closing operating modes. Each mode of operation consists of five distinct stages, a) start, b) full speed, c) unseating, d) travel, and e) stall. The system supports user-defined model types for each of the stages. That is, “start” may be modeled as a constant current while “full speed” may be modeled by constant power. This same flexibility exists for all five distinct stages of the closing mode.
- For AVR and Excitation Systems: There are a number of models ranging form rotating (DC and AC) and analogue to static and digital controls. Additionally, the system offers a user-defined modeling capability, which can be used to define a new excitation model.
- For Governors and Turbines: The system is designed to address current and future technologies including but not limited to hydraulic, diesel, gas, and combined cycles with mechanical and/or digital governors.
- For Static Var Compensators (SVCs): The system is designed to address current and future technologies including a number of solid-state (thyristor) controlled SVC's or even the saturable reactor types.
- For Fault Isolation Units (FIUs): The system is designed to address current and future technologies of FIUs also known as Current Limiting Devices, are devices installed between the power source and loads to limit the magnitude of fault currents that occur within loads connected to the power distribution networks.
- For Static Automatic Bus Transfers (SABT): The system is designed to address current and future technologies of SABT (i.e., solid-state three phase, dual position, three-pole switch, etc.)
- Application/removal of phase-to-ground fault
- Application/removal of phase-phase-ground fault.
- Application/removal of phase-phase fault.
- Branch Addition.
- Branch Tripping.
- Starting Induction Motor.
- Stopping Induction Motor.
- Shunt Tripping.
- Shunt Addition (Capacitor and/or induction).
- Generator Tripping.
- SVC Tripping.
- Impact Loading (Load Changing Mechanical Torque on Induction Machine. With this option it is actually possible to turn an induction motor to an induction generator).
- Loss of Utility Power Supply/Generators/UPS/Distribution Lines/System Infrastructure.
- Load Shedding.
- Wave-shape Distortions/Oscillations data
- Parallel and Series Resonant Condition data
- Total Harmonic Distortion Level data (both Voltage and Current type)
- Data on the true RMS system loading of lines, transformers, capacitors, etc.
- Data on the Negative Sequence Harmonics being absorbed by the AC motors
- Transformer K-Factor Level data
- Frequency scan at positive, negative, and zero angle response throughout the entire scanned spectrum in the electrical system.
- Application/removal of three-phase fault
- Application/removal of phase-to-ground fault
- Application/removal of phase-phase-ground fault
- Application/removal of phase-phase fault
- Branch Addition
- Branch Tripping
- Starting Induction Motor
- Stopping Induction Motor
- Shunt Tripping
- Shunt Addition (Capacitor and/or Induction)
- Generator Tripping
- SVC Tripping
- Impact Loading (Load Changing Mechanical Torque on Induction Machine. With this option it is actually possible to turn an induction motor to an induction generator)
- Loss of Utility Power Supply/Generators/UPS/Distribution Lines/System Infrastructure
- Load Shedding
- Variations or deviations of electrical system performance from the power system design parameters. That is, the ability of the electrical system to resist system output variations or deviations from defined tolerance limits of the electrical system
- Incorporation of performance and behavioral specifications for all the equipment and components that comprise the electrical system into a real-time management environment
- As a function of different system, process and load point reliability indices
- Implementation of different technological solutions to achieve reliability centered maintenance targets and goals
- As-designed total power capacity of the power system.
- How much of the total power capacity remains or is available (ability of the electrical system to maintain availability of its total power capacity)
- Present utilized power capacity.
- Dynamic stability predictions across all contingency events
- Determination of protection system stress and withstand status
- Active Power (kW)
- Reactive Power (kVAR)
- Power Factor (%)
- Humidity (%)
- Temperature (° F.)
- Total Cost of Energy ($)
- Total Penalty Cost Due to Poor Power Factor ($)
- Frequency (Hz)
- Voltage (p.u.)
- Cost of Losses ($)
Claims (25)
Priority Applications (1)
| Application Number | Priority Date | Filing Date | Title |
|---|---|---|---|
| US14/532,559US9031824B2 (en) | 2006-07-19 | 2014-11-04 | Real-time predictive systems for intelligent energy monitoring and management of electrical power networks |
Applications Claiming Priority (6)
| Application Number | Priority Date | Filing Date | Title |
|---|---|---|---|
| US80779506P | 2006-07-19 | 2006-07-19 | |
| US11/734,709US8036872B2 (en) | 2006-03-10 | 2007-04-12 | Systems and methods for performing automatic real-time harmonics analyses for use in real-time power analytics of an electrical power distribution system |
| US93832407P | 2007-05-16 | 2007-05-16 | |
| US11/777,121US8170856B2 (en) | 2006-04-12 | 2007-07-12 | Systems and methods for real-time advanced visualization for predicting the health, reliability and performance of an electrical power system |
| US12/121,552US9557723B2 (en) | 2006-07-19 | 2008-05-15 | Real-time predictive systems for intelligent energy monitoring and management of electrical power networks |
| US14/532,559US9031824B2 (en) | 2006-07-19 | 2014-11-04 | Real-time predictive systems for intelligent energy monitoring and management of electrical power networks |
Related Parent Applications (1)
| Application Number | Title | Priority Date | Filing Date |
|---|---|---|---|
| US12/121,552ContinuationUS9557723B2 (en) | 2006-02-14 | 2008-05-15 | Real-time predictive systems for intelligent energy monitoring and management of electrical power networks |
Publications (2)
| Publication Number | Publication Date |
|---|---|
| US20150057821A1 US20150057821A1 (en) | 2015-02-26 |
| US9031824B2true US9031824B2 (en) | 2015-05-12 |
Family
ID=39873131
Family Applications (3)
| Application Number | Title | Priority Date | Filing Date |
|---|---|---|---|
| US12/121,552Expired - Fee RelatedUS9557723B2 (en) | 2006-02-14 | 2008-05-15 | Real-time predictive systems for intelligent energy monitoring and management of electrical power networks |
| US14/532,559Expired - Fee RelatedUS9031824B2 (en) | 2006-07-19 | 2014-11-04 | Real-time predictive systems for intelligent energy monitoring and management of electrical power networks |
| US15/418,943AbandonedUS20170192398A1 (en) | 2006-02-14 | 2017-01-30 | Real-time predictive systems for intelligent energy monitoring and management of electrical power networks |
Family Applications Before (1)
| Application Number | Title | Priority Date | Filing Date |
|---|---|---|---|
| US12/121,552Expired - Fee RelatedUS9557723B2 (en) | 2006-02-14 | 2008-05-15 | Real-time predictive systems for intelligent energy monitoring and management of electrical power networks |
Family Applications After (1)
| Application Number | Title | Priority Date | Filing Date |
|---|---|---|---|
| US15/418,943AbandonedUS20170192398A1 (en) | 2006-02-14 | 2017-01-30 | Real-time predictive systems for intelligent energy monitoring and management of electrical power networks |
Country Status (1)
| Country | Link |
|---|---|
| US (3) | US9557723B2 (en) |
Cited By (26)
| Publication number | Priority date | Publication date | Assignee | Title |
|---|---|---|---|---|
| US9652723B2 (en) | 2015-06-05 | 2017-05-16 | Sas Institute Inc. | Electrical transformer failure prediction |
| US9705329B2 (en) | 2012-06-29 | 2017-07-11 | Operation Technology, Inc. | Proactive intelligent load shedding |
| US9848280B2 (en) | 2015-09-03 | 2017-12-19 | Civionics, Inc. | Wireless sensor module |
| US9864820B2 (en) | 2012-10-03 | 2018-01-09 | Operation Technology, Inc. | Generator dynamic model parameter estimation and tuning using online data and subspace state space model |
| US9875324B2 (en) | 2013-08-16 | 2018-01-23 | Operation Technology, Inc. | Traction power simulation |
| CN108564254A (en)* | 2018-03-15 | 2018-09-21 | 国网四川省电力公司绵阳供电公司 | Controller switching equipment status visualization platform based on big data |
| US10136280B2 (en) | 2016-08-29 | 2018-11-20 | International Business Machines Corporation | Parallel user interaction with physical and modeled system |
| US10187707B2 (en) | 2014-11-17 | 2019-01-22 | Curb, Inc. | Home intelligence system |
| US10318895B1 (en) | 2013-08-27 | 2019-06-11 | Curb, Inc. | System for promoting efficient use of resources |
| US10389172B2 (en) | 2017-06-22 | 2019-08-20 | Microsoft Technology Licensing, Llc | Externally exposing connections to internal electrical components inside electrical system equipment |
| US10685155B2 (en)* | 2018-06-06 | 2020-06-16 | Prescient Devices, Inc. | Method and system for designing a distributed heterogeneous computing and control system |
| US10867087B2 (en) | 2006-02-14 | 2020-12-15 | Wavetech Global, Inc. | Systems and methods for real-time DC microgrid power analytics for mission-critical power systems |
| US10871754B2 (en) | 2017-06-22 | 2020-12-22 | Microsoft Technology Licensing, Llc | Automated time-synchronized electrical system commissioning |
| US10962999B2 (en) | 2009-10-01 | 2021-03-30 | Wavetech Global Inc. | Microgrid model based automated real time simulation for market based electric power system optimization |
| US10996210B2 (en) | 2018-01-02 | 2021-05-04 | Transportation Ip Holdings, Llc | Vehicle system with sensor probe assembly for monitoring oil health |
| US11003850B2 (en) | 2018-06-06 | 2021-05-11 | Prescient Devices, Inc. | Method and system for designing distributed dashboards |
| US11016450B2 (en)* | 2006-02-14 | 2021-05-25 | Power Analytics Corporation | Real-time predictive systems for intelligent energy monitoring and management of electrical power networks |
| US11016475B2 (en) | 2017-03-22 | 2021-05-25 | Microsoft Technology Licensing, Llc | Automated electrical system commissioning |
| US11042132B2 (en)* | 2019-06-07 | 2021-06-22 | Battelle Memorial Institute | Transformative remedial action scheme tool (TRAST) |
| US11113434B2 (en)* | 2006-02-14 | 2021-09-07 | Power Analytics Corporation | Method for predicting arc flash energy and PPE category within a real-time monitoring system |
| US11112778B2 (en)* | 2018-09-10 | 2021-09-07 | Aveva Software, Llc | Cloud and digital operations system and method |
| US20210397768A1 (en)* | 2006-02-14 | 2021-12-23 | Power Analytics Corporation | Method For Predicting Arc Flash Energy And PPE Category Within A Real-Time Monitoring System |
| TWI781453B (en)* | 2020-09-30 | 2022-10-21 | 財團法人資訊工業策進會 | Energy dispatch system, apparatus, and method |
| US11870259B2 (en) | 2019-06-28 | 2024-01-09 | Taner-Jay CAIRNS | Electrical load balancing device |
| US12227202B2 (en) | 2021-06-10 | 2025-02-18 | Honda Motor Co., Ltd. | Adaptive trust calibration |
| US12359589B2 (en) | 2023-10-06 | 2025-07-15 | Doosan Enerbility Co., Ltd. | Apparatus using root cause analysis for predicting blade damage and method therefor |
Families Citing this family (189)
| Publication number | Priority date | Publication date | Assignee | Title |
|---|---|---|---|---|
| US9092593B2 (en) | 2007-09-25 | 2015-07-28 | Power Analytics Corporation | Systems and methods for intuitive modeling of complex networks in a digital environment |
| US9557723B2 (en) | 2006-07-19 | 2017-01-31 | Power Analytics Corporation | Real-time predictive systems for intelligent energy monitoring and management of electrical power networks |
| US7693608B2 (en)* | 2006-04-12 | 2010-04-06 | Edsa Micro Corporation | Systems and methods for alarm filtering and management within a real-time data acquisition and monitoring environment |
| US8155943B2 (en)* | 2007-10-12 | 2012-04-10 | Power Analytics Corporation | Systems and methods for automatically converting CAD drawing files into intelligent objects with database connectivity for the design, analysis, and simulation of electrical power systems |
| EP2159496A1 (en)* | 2008-08-29 | 2010-03-03 | Vito NV | Controller for energy supply systems |
| CA2742762C (en)* | 2008-11-07 | 2017-08-01 | Abb Technology Ag | Switchgear data system |
| EP2389714B1 (en)* | 2009-01-26 | 2019-07-24 | Geneva Cleantech Inc. | Methods and apparatus for power factor correction and reduction of distortion in and noise in a power supply delivery network |
| US8674544B2 (en)* | 2009-01-26 | 2014-03-18 | Geneva Cleantech, Inc. | Methods and apparatus for power factor correction and reduction of distortion in and noise in a power supply delivery network |
| US9020769B2 (en)* | 2009-01-26 | 2015-04-28 | Geneva Cleantech Inc. | Automatic detection of appliances |
| US20100217550A1 (en)* | 2009-02-26 | 2010-08-26 | Jason Crabtree | System and method for electric grid utilization and optimization |
| US20110040666A1 (en)* | 2009-08-17 | 2011-02-17 | Jason Crabtree | Dynamic pricing system and method for complex energy securities |
| CA2758287A1 (en) | 2009-04-09 | 2010-10-14 | E3 Greentech Enterprises, Inc. | System and method for energy consumption management |
| US20100138348A1 (en)* | 2009-06-12 | 2010-06-03 | Microsoft Corporation | Providing resource-related information using a standardized format |
| US20100318376A1 (en)* | 2009-06-12 | 2010-12-16 | Microsoft Corporation | Message-passing protocol between entities having dissimilar capabilities |
| US8509954B2 (en) | 2009-08-21 | 2013-08-13 | Allure Energy, Inc. | Energy management system and method |
| US9838255B2 (en)* | 2009-08-21 | 2017-12-05 | Samsung Electronics Co., Ltd. | Mobile demand response energy management system with proximity control |
| US9209652B2 (en) | 2009-08-21 | 2015-12-08 | Allure Energy, Inc. | Mobile device with scalable map interface for zone based energy management |
| US8498749B2 (en)* | 2009-08-21 | 2013-07-30 | Allure Energy, Inc. | Method for zone based energy management system with scalable map interface |
| US8321194B2 (en)* | 2009-10-01 | 2012-11-27 | Power Analytics Corporation | Real time microgrid power analytics portal for mission critical power systems |
| US20110106654A1 (en)* | 2009-10-27 | 2011-05-05 | Leesa Lee | Method and apparatus for distributed generator planning |
| US8401709B2 (en)* | 2009-11-03 | 2013-03-19 | Spirae, Inc. | Dynamic distributed power grid control system |
| KR101075958B1 (en)* | 2009-11-16 | 2011-10-21 | 일진전기 주식회사 | Power exchange system of distributed generation and its method |
| US8645150B2 (en) | 2010-04-12 | 2014-02-04 | International Business Machines Corporation | Source aware data center power profiles |
| CN101872185B (en)* | 2010-06-14 | 2013-05-22 | 香港应用科技研究院有限公司 | Intelligent matrix power control system |
| EP2599183B1 (en) | 2010-07-29 | 2016-11-30 | Spirae Inc. | Dynamic distributed power grid control system |
| US20120072140A1 (en)* | 2010-09-21 | 2012-03-22 | Schneider Electric USA, Inc. | Systems, methods, and devices for analyzing utility usage with load duration curves |
| US9734228B2 (en)* | 2010-10-26 | 2017-08-15 | Accenture Global Services Limited | Digital analytics system |
| US8589198B2 (en)* | 2010-11-18 | 2013-11-19 | General Electric Company | Methods and systems involving power system grid management |
| US20120158451A1 (en)* | 2010-12-16 | 2012-06-21 | International Business Machines Corporation | Dispatching Tasks in a Business Process Management System |
| US8344529B2 (en)* | 2011-01-18 | 2013-01-01 | Energy Intelligence, LLC | Method and system for energy harvesting |
| WO2012099345A1 (en)* | 2011-01-21 | 2012-07-26 | Lg Electronics Inc. | Chain management system, remote management method thereof and user screen displaying method therefor |
| EP2479630A1 (en) | 2011-01-25 | 2012-07-25 | Siemens Aktiengesellschaft | Method for collision-free switching of an assembly from off mode to operational mode |
| US8278779B2 (en) | 2011-02-07 | 2012-10-02 | General Electric Company | System and method for providing redundant power to a device |
| JP5851105B2 (en)* | 2011-03-15 | 2016-02-03 | 株式会社東芝 | Energy demand forecasting apparatus and program |
| US9633320B2 (en) | 2011-03-15 | 2017-04-25 | Kabushiki Kaisha Toshiba | Energy demand prediction apparatus and method |
| EP2751955B1 (en) | 2011-08-30 | 2019-11-13 | Samsung Electronics Co., Ltd. | Resource manager and method for communicating resource management information for smart energy and media resources |
| US8751036B2 (en) | 2011-09-28 | 2014-06-10 | Causam Energy, Inc. | Systems and methods for microgrid power generation management with selective disconnect |
| US8862279B2 (en) | 2011-09-28 | 2014-10-14 | Causam Energy, Inc. | Systems and methods for optimizing microgrid power generation and management with predictive modeling |
| US9225173B2 (en) | 2011-09-28 | 2015-12-29 | Causam Energy, Inc. | Systems and methods for microgrid power generation and management |
| JP5742635B2 (en)* | 2011-09-29 | 2015-07-01 | 東京エレクトロン株式会社 | Substrate processing apparatus, alarm management method for substrate processing apparatus, and storage medium |
| ITBG20110041A1 (en)* | 2011-09-30 | 2013-03-31 | Etc S R L | REMOTE MONITORING SYSTEM FOR ELECTRIC NETWORKS |
| KR20130083016A (en)* | 2011-12-27 | 2013-07-22 | 한국전자통신연구원 | Method and apparatus for calculating energy revenues of electric power devices based on real time pricing |
| CL2013000281A1 (en) | 2012-01-30 | 2014-08-18 | Harnischfeger Tech Inc | Monitoring methods of a mining machine that includes determining if the machine is operating in a first state, detecting a transition from the first state to a second operating state, generating messages that indicate parameters of machine operation in both states; mining machine monitor for the control of mining machines; a procedure for monitoring a mining drill; mining machine monitor for the monitoring of a mine drilling drill |
| KR101210729B1 (en)* | 2012-03-06 | 2012-12-11 | 한국가스안전공사 | Predicting method and system of real-time risk sign for energy plants using intelligent risk sign pattern model |
| US9817376B1 (en) | 2012-05-19 | 2017-11-14 | Growing Energy Labs, Inc. | Adaptive energy storage operating system for multiple economic services |
| US20190317463A1 (en) | 2012-05-19 | 2019-10-17 | Growing Energy Labs, Inc. | Adaptive energy storage operating system for multiple economic services |
| US20130331963A1 (en)* | 2012-06-06 | 2013-12-12 | Rockwell Automation Technologies, Inc. | Systems, methods, and software to identify and present reliability information for industrial automation devices |
| JP5778087B2 (en)* | 2012-06-19 | 2015-09-16 | 横河電機株式会社 | Process monitoring system and method |
| CN102760192B (en)* | 2012-07-13 | 2015-07-22 | 中国电力科学研究院 | Real-time digital simulator-based power system closed loop verifying platform and method |
| US9563215B2 (en) | 2012-07-14 | 2017-02-07 | Causam Energy, Inc. | Method and apparatus for actively managing electric power supply for an electric power grid |
| US9477239B2 (en) | 2012-07-26 | 2016-10-25 | Honeywell International Inc. | HVAC controller with wireless network based occupancy detection and control |
| US9594384B2 (en) | 2012-07-26 | 2017-03-14 | Honeywell International Inc. | Method of associating an HVAC controller with an external web service |
| US9247378B2 (en) | 2012-08-07 | 2016-01-26 | Honeywell International Inc. | Method for controlling an HVAC system using a proximity aware mobile device |
| CN102801165B (en)* | 2012-08-13 | 2014-07-16 | 清华大学 | Automatic voltage control method considering static security |
| US10782721B2 (en)* | 2012-08-27 | 2020-09-22 | Stem, Inc. | Method and apparatus for balancing power on a per phase basis in multi-phase electrical load facilities using an energy storage system |
| US11454999B2 (en)* | 2012-08-29 | 2022-09-27 | Stem, Inc. | Method and apparatus for automatically reconfiguring multi-phased networked energy storage devices at a site |
| US9052351B2 (en)* | 2012-09-19 | 2015-06-09 | Sensus Usa Inc. | Method and apparatus for preventing electricity meter failure |
| US9053020B2 (en) | 2012-10-11 | 2015-06-09 | Abb Research Ltd. | Online protection coordination for distribution management system |
| EP2907059B1 (en)* | 2012-10-12 | 2019-04-03 | Technische Universität Dortmund | Computer implemented method for hybrid simulation of power distribution network and associated communication network for real time applications |
| US9716530B2 (en) | 2013-01-07 | 2017-07-25 | Samsung Electronics Co., Ltd. | Home automation using near field communication |
| US10063499B2 (en) | 2013-03-07 | 2018-08-28 | Samsung Electronics Co., Ltd. | Non-cloud based communication platform for an environment control system |
| US11025521B1 (en)* | 2013-03-15 | 2021-06-01 | CSC Holdings, LLC | Dynamic sample selection based on geospatial area and selection predicates |
| US9454173B2 (en)* | 2013-05-22 | 2016-09-27 | Utility Programs And Metering Ii, Inc. | Predictive alert system for building energy management |
| US9450409B2 (en)* | 2013-06-20 | 2016-09-20 | Abb Research Ltd. | Converter station power set point analysis system and method |
| WO2014203376A1 (en)* | 2013-06-20 | 2014-12-24 | 株式会社日立製作所 | Power system supervisory control apparatus and power system supervisory control method |
| CN103500237A (en)* | 2013-07-03 | 2014-01-08 | 国家电网公司 | Automatic image forming method for power distribution network based on logic layout |
| US9646114B2 (en)* | 2013-07-10 | 2017-05-09 | The Boeing Company | Electrical power system stability |
| US20150032586A1 (en)* | 2013-07-26 | 2015-01-29 | Bank Of America Corporation | Use of e-receipts for consumption tracking |
| CN103617026B (en)* | 2013-08-30 | 2016-12-28 | 国家电网公司 | Operation states of electric power system is at, offline evaluation mixed scheduling task recognition system |
| CN103577685B (en)* | 2013-08-30 | 2016-06-29 | 国家电网公司 | Operation states of electric power system is online and offline evaluation mixed scheduling system |
| CN103593724B (en)* | 2013-08-30 | 2016-10-26 | 国家电网公司 | Operation states of electric power system is in, offline evaluation mixed scheduling task ranking system |
| CA2920924A1 (en)* | 2013-09-06 | 2015-03-12 | Opus One Solutions Energy Corp. | Systems and methods for grid operating systems in electric power systems |
| WO2015047404A1 (en)* | 2013-09-30 | 2015-04-02 | Hewlett-Packard Development Company, L.P. | Server downtime metering |
| US10437203B2 (en)* | 2013-10-08 | 2019-10-08 | General Electric Company | Methods and systems for dynamic workflow prioritization and tasking |
| US10747289B2 (en) | 2013-10-28 | 2020-08-18 | Virtual Power Systems, Inc. | Data center power manipulation |
| US11126242B2 (en) | 2013-10-28 | 2021-09-21 | Virtual Power Systems, Inc. | Time varying power management within datacenters |
| US20150163945A1 (en) | 2013-12-11 | 2015-06-11 | Honeywell International Inc. | Hvac controller with thermistor biased against an outer housing |
| CL2013003810A1 (en)* | 2013-12-31 | 2015-01-09 | Univ Talca | System and method of monitoring and management for energy efficiency in buildings where the system comprises means for measuring and acquiring data online from sensors, means of transmission, reception and transfer of data, processing means, storage and user interface, where it includes an alarm module, a monitoring module and an investment options module. |
| SG11201605494QA (en) | 2014-01-06 | 2016-08-30 | Allure Energy Inc | System, device, and apparatus for coordinating environments using network devices and remote sensory information |
| CN106464551A (en) | 2014-01-06 | 2017-02-22 | 魅力能源公司 | System, device, and apparatus for coordinating environments using network devices and remote sensory information |
| US10268973B2 (en)* | 2014-02-25 | 2019-04-23 | Siemens Industry, Inc. | Systems, methods and apparatus for a stakeholder market simulator for energy delivery systems |
| KR101587341B1 (en)* | 2014-03-20 | 2016-02-03 | 엘에스산전 주식회사 | Apparatus for data processing of Energy Management System |
| KR102194974B1 (en)* | 2014-04-29 | 2020-12-28 | 엘에스일렉트릭(주) | System for monitoring and controling electric power system for process verification |
| CN106537356B (en)* | 2014-07-17 | 2020-03-10 | 3M创新有限公司 | System and method for signal injection in a utility grid |
| CN106796672A (en)* | 2014-07-31 | 2017-05-31 | 发展能源实验室公司 | Using self adaptation Automated condtrol software prediction and optimization energy stores life cycle performance |
| CN104331837B (en)* | 2014-08-13 | 2017-11-03 | 国网电力科学研究院 | The optimal method for simplifying for cutting the search of machine control strategy of electric power system transient stability |
| US10281507B2 (en)* | 2014-11-21 | 2019-05-07 | Kohler Co. | Generator sizing |
| US9967107B2 (en) | 2014-12-24 | 2018-05-08 | Optimum Energy Llc | Intelligent equipment sequencing |
| US20160241031A1 (en)* | 2015-02-18 | 2016-08-18 | Nec Laboratories America, Inc. | Dynamic probability-based power outage management system |
| US11042128B2 (en)* | 2015-03-18 | 2021-06-22 | Accenture Global Services Limited | Method and system for predicting equipment failure |
| CN104865842B (en)* | 2015-03-25 | 2019-01-04 | 南方电网科学研究院有限责任公司 | Hybrid simulation system and hybrid simulation method suitable for stable control device interface |
| US20160283844A1 (en)* | 2015-03-27 | 2016-09-29 | Optimum Energy Llc | Load predictor for a cooling system |
| US10802459B2 (en) | 2015-04-27 | 2020-10-13 | Ademco Inc. | Geo-fencing with advanced intelligent recovery |
| US11593817B2 (en)* | 2015-06-30 | 2023-02-28 | Panasonic Intellectual Property Corporation Of America | Demand prediction method, demand prediction apparatus, and non-transitory computer-readable recording medium |
| US10511485B2 (en)* | 2015-08-11 | 2019-12-17 | At&T Intellectual Property I, L.P. | Dynamic virtual network topology discovery engine |
| US9742411B1 (en)* | 2015-08-24 | 2017-08-22 | University Of South Florida | Simultaneous economic dispatch and frequency regulation of power systems |
| US10749339B2 (en)* | 2015-09-11 | 2020-08-18 | Paul Joseph Meier | Modeling system for energy systems |
| US10282687B2 (en)* | 2015-10-07 | 2019-05-07 | University Of Utah Research Foundation | Systems and methods for managing power generation resources |
| US10509374B2 (en) | 2015-10-07 | 2019-12-17 | University Of Utah Research Foundation | Systems and methods for managing power generation and storage resources |
| US10296030B2 (en)* | 2015-10-07 | 2019-05-21 | University Of Utah Research Foundation | Systems and methods for power system management |
| US10197984B2 (en)* | 2015-10-12 | 2019-02-05 | International Business Machines Corporation | Automated energy load forecaster |
| US9628951B1 (en) | 2015-11-11 | 2017-04-18 | Honeywell International Inc. | Methods and systems for performing geofencing with reduced power consumption |
| US10516965B2 (en) | 2015-11-11 | 2019-12-24 | Ademco Inc. | HVAC control using geofencing |
| USD810104S1 (en) | 2015-11-16 | 2018-02-13 | Kohler, Co. | Display screen with graphical user interface |
| USD811423S1 (en) | 2015-11-16 | 2018-02-27 | Kohler, Co. | Display screen with graphical user interface |
| JP6613853B2 (en) | 2015-12-01 | 2019-12-04 | オムロン株式会社 | Management system and management program |
| GB2546120B (en) | 2016-02-09 | 2018-02-14 | Spatialbuzz Ltd | Fault monitoring in a utility supply network |
| GB2546118B (en) | 2016-02-09 | 2018-11-14 | Spatialbuzz Ltd | Fault monitoring by assessing spatial distribution of queries in a utility supply network |
| US10605472B2 (en) | 2016-02-19 | 2020-03-31 | Ademco Inc. | Multiple adaptive geo-fences for a building |
| KR101758558B1 (en)* | 2016-03-29 | 2017-07-26 | 엘에스산전 주식회사 | Energy managemnet server and energy managemnet system having thereof |
| US9866063B2 (en)* | 2016-04-05 | 2018-01-09 | Nuscale Power, Llc | Fault-tolerant power distribution systems for a modular power plant |
| US10488062B2 (en) | 2016-07-22 | 2019-11-26 | Ademco Inc. | Geofence plus schedule for a building controller |
| US11107016B2 (en)* | 2016-08-18 | 2021-08-31 | Virtual Power Systems, Inc. | Augmented power control within a datacenter using predictive modeling |
| US11461513B2 (en) | 2016-08-18 | 2022-10-04 | Cato | Data center power scenario simulation |
| US10585468B2 (en) | 2016-08-18 | 2020-03-10 | Virtual Power Systems, Inc. | Datacenter power management using dynamic redundancy |
| CN107797465A (en)* | 2016-09-06 | 2018-03-13 | 北京百度网讯科技有限公司 | Monitoring method and device |
| CN106253487B (en) | 2016-09-29 | 2019-02-05 | 北京东土科技股份有限公司 | Intelligent power server applied to intelligent substation protection control system |
| US10191506B2 (en)* | 2016-09-29 | 2019-01-29 | Enel X North America, Inc. | Demand response dispatch prediction system including automated validation, estimation, and editing rules configuration engine |
| CN106357000B (en) | 2016-09-29 | 2019-07-23 | 北京东土科技股份有限公司 | Intelligent substation Protection control system based on industry internet framework |
| US12288988B2 (en) | 2016-09-30 | 2025-04-29 | Enphase Energy, Inc. | Method and apparatus for controlling power grid member behavior |
| CN110192196B (en)* | 2017-01-25 | 2023-06-13 | 三菱电机株式会社 | Attack/abnormal detection device, attack/abnormal detection method and storage medium |
| CN106679635A (en)* | 2017-03-10 | 2017-05-17 | 江苏濠汉信息技术有限公司 | Relaying plate switching state detection system |
| US10452041B2 (en)* | 2017-03-31 | 2019-10-22 | General Electric Company | Gas turbine dispatch optimizer real-time command and operations |
| US10317102B2 (en) | 2017-04-18 | 2019-06-11 | Ademco Inc. | Geofencing for thermostatic control |
| CN107239874B (en)* | 2017-04-26 | 2023-05-16 | 广西电网有限责任公司电力科学研究院 | Rail transit-oriented electric energy quality and energy-saving analysis system |
| US10969846B2 (en) | 2017-05-25 | 2021-04-06 | Virtual Power Systems, Inc. | Secure communication initiation and execution for datacenter power control |
| CN107465185B (en)* | 2017-07-31 | 2020-09-01 | 中国南方电网有限责任公司 | Transformer substation intelligent operation and maintenance system based on secondary system operation mode |
| CN107577856B (en)* | 2017-08-25 | 2021-02-02 | 重庆大学 | PSASP-based transient stability job processing optimization method |
| CN107730025B (en)* | 2017-09-01 | 2021-04-09 | 国网浙江省电力公司绍兴供电公司 | A cash flow forecasting model for power supply enterprises based on changes in electricity |
| CN107544401A (en)* | 2017-10-17 | 2018-01-05 | 国网江苏省电力公司南通供电公司 | A kind of monitoring system of anti-tampering power transmission and transforming equipment |
| CN107885142A (en)* | 2017-10-27 | 2018-04-06 | 国网江苏省电力公司南通供电公司 | A kind of monitoring system of noiseless power transmission and transforming equipment |
| US11816540B2 (en)* | 2017-11-06 | 2023-11-14 | Xendee Corporation | Artificial intelligence microgrid and distributed energy resources planning platform |
| US10887778B2 (en)* | 2017-12-22 | 2021-01-05 | At&T Intellectual Property I, L.P. | Proactively adjusting network infrastructure in response to reporting of real-time network performance |
| WO2019132919A1 (en)* | 2017-12-28 | 2019-07-04 | Total Solar International | A multi-agent shared machine learning approach for real-time battery operation mode prediction and control |
| CN109299843A (en)* | 2018-01-12 | 2019-02-01 | 上海麟益信息科技有限公司 | A kind of Risk Pre-control analysis intelligent management |
| CN108288855B (en)* | 2018-01-23 | 2020-11-24 | 国电南京自动化股份有限公司 | Dynamic strategy simulation and optimization method based on micro-grid |
| CN108280590A (en)* | 2018-02-09 | 2018-07-13 | 青海电研科技有限责任公司 | Photovoltaic plant online evaluation early warning system and method |
| US11216059B2 (en) | 2018-03-05 | 2022-01-04 | Virtual Power Systems, Inc. | Dynamic tiering of datacenter power for workloads |
| CN108629483B (en)* | 2018-04-02 | 2021-03-16 | 广东电网有限责任公司广州供电局 | Power equipment condition assessment method and system, computer storage medium and equipment |
| US10417565B1 (en)* | 2018-06-30 | 2019-09-17 | Carbon Lighthouse, Inc. | System, method, and computer program for modeling and predicting energy consumption in a building |
| CN112368652A (en)* | 2018-07-05 | 2021-02-12 | Abb电网瑞士股份公司 | Technique for optimizing an electrical grid by decentralized prediction |
| CN109086940B (en)* | 2018-08-15 | 2021-09-07 | 西南交通大学 | A prediction method of catenary trip times based on time-based meteorological correlation model |
| US11321624B2 (en) | 2018-09-19 | 2022-05-03 | Wipro Limited | Method and system for analyzing internet of things (IoT) data in real-time and providing predictions |
| DE102018129810A1 (en) | 2018-11-26 | 2020-05-28 | Technische Universität Darmstadt | Method and device for controlling a number of energy-feeding and / or energy-consuming units |
| JP7110963B2 (en)* | 2018-12-11 | 2022-08-02 | トヨタ自動車株式会社 | Wind power generation system using a hovering kite-shaped structure |
| CN109683652A (en)* | 2018-12-21 | 2019-04-26 | 惠州Tcl移动通信有限公司 | WIFI voltage control method, device, mobile terminal and storage medium |
| US11239652B2 (en) | 2018-12-26 | 2022-02-01 | Eaton Intelligent Power Limited | Compliant, hazardous environment circuit protection devices, systems and methods |
| US11615925B2 (en) | 2018-12-26 | 2023-03-28 | Eaton Intelligent Power Limited | Hazardous location compliant circuit protection devices having enhanced safety intelligence, systems and methods |
| US11270854B2 (en) | 2018-12-26 | 2022-03-08 | Eaton Intelligent Power Limited | Circuit protection devices, systems and methods for explosive environment compliance |
| US11303111B2 (en) | 2018-12-26 | 2022-04-12 | Eaton Intelligent Power Limited | Configurable modular hazardous location compliant circuit protection devices, systems and methods |
| CN111461915A (en)* | 2019-01-18 | 2020-07-28 | 中国电力科学研究院有限公司 | Photovoltaic power plant operation real-time information management system and management method |
| US20200327435A1 (en) | 2019-04-12 | 2020-10-15 | General Electric Company | Systems and methods for sequential power system model parameter estimation |
| US11636557B2 (en) | 2019-05-29 | 2023-04-25 | General Electric Company | Systems and methods for enhanced power system model validation |
| US20210044139A1 (en)* | 2019-08-09 | 2021-02-11 | Oladayo Luke | Power management system |
| US20210124854A1 (en)* | 2019-10-28 | 2021-04-29 | General Electric Company | Systems and methods for enhanced power system model parameter estimation |
| CN110912915B (en)* | 2019-11-29 | 2021-09-21 | 合肥开元埃尔软件有限公司 | Communication safety early warning system based on data acquisition |
| CN111324358B (en)* | 2020-02-14 | 2020-10-16 | 南栖仙策(南京)科技有限公司 | Training method for automatic operation and maintenance strategy of information system |
| CN113298278B (en)* | 2020-02-19 | 2023-12-05 | 硕天科技股份有限公司 | Power equipment with self-health state prediction function, self-health state prediction method and cloud server |
| US11966989B2 (en)* | 2020-03-23 | 2024-04-23 | Xendee Corporation | Robust and fast design of microgrids, der systems, and other energy systems using staged hybrid investment planning |
| US11906575B2 (en) | 2020-04-21 | 2024-02-20 | International Business Machines Corporation | Electrical power analyzer for large and small scale devices for environmental and ecological optimization |
| CN115516724A (en)* | 2020-05-14 | 2022-12-23 | Abb瑞士股份有限公司 | Data Analytics for Smart Electrical Protection Systems |
| CN111835019A (en)* | 2020-07-30 | 2020-10-27 | 长沙理工大学 | Energy efficiency evaluation method of dynamic reactive power compensation device in distribution network station area |
| CN112215454B (en)* | 2020-08-24 | 2023-08-08 | 广东电网有限责任公司广州供电局 | An Intelligent Decision-making System for Power Grid Enterprise Management |
| CN112288126B (en)* | 2020-09-09 | 2022-06-17 | 广东石油化工学院 | An online monitoring and diagnosis method for abnormal changes of sampling data |
| CN112147718B (en)* | 2020-09-23 | 2022-04-19 | 广东电网有限责任公司 | Lightning stroke prediction method and device for overhead transmission line and storage medium |
| CN112200433B (en)* | 2020-09-25 | 2021-05-18 | 华电福新广州能源有限公司 | Power plant thermal performance analysis and optimization system |
| NO346958B1 (en)* | 2020-10-16 | 2023-03-20 | Dimeq As | An Alarm Detection System |
| US20220130526A1 (en)* | 2020-10-27 | 2022-04-28 | Robert Shaun Slattery | ANNA (All Now Network Access) |
| EP3996224A3 (en)* | 2020-11-04 | 2022-08-17 | Abb Schweiz Ag | Nuisance trip decision management using data analytics in electrical protection system |
| CN112700032A (en)* | 2020-12-15 | 2021-04-23 | 国网上海能源互联网研究院有限公司 | Fault prediction system and method for low-voltage direct-current power distribution and utilization system |
| CN112287504B (en)* | 2020-12-25 | 2021-04-20 | 中国电力科学研究院有限公司 | Offline/online integrated simulation system and method for distribution network |
| CN113505046A (en)* | 2021-05-31 | 2021-10-15 | 云聚数据科技(上海)有限公司 | Three-dimensional visual data center monitoring management system and method |
| CN113158499B (en)* | 2021-06-28 | 2021-09-03 | 湖北东湖实验室 | Energy management strategy and system of pure battery power ship comprehensive power system |
| CN113765217B (en)* | 2021-08-03 | 2023-07-28 | 国网浙江省电力有限公司湖州供电公司 | A smart monitoring system for multi-energy residential electricity consumption with demand response |
| US20230113260A1 (en)* | 2021-10-08 | 2023-04-13 | International Business Machines Corporation | Analyzing electrical usage in an electrical grid for facilitating management of electrical transmission |
| US20230119984A1 (en)* | 2021-10-16 | 2023-04-20 | Nana Wilberforce | System and Method for Development of an AI Computational Intelligence Platform for Energy Resilience in Buildings |
| CN114090556B (en)* | 2021-10-27 | 2022-12-13 | 中能浦慧(上海)能源技术有限公司 | Electric power marketing data acquisition method and system |
| CN114021345B (en)* | 2021-11-04 | 2025-03-07 | 海宸大智(南京)信息科技有限责任公司 | Protective facility health monitoring method, device, medium and electronic equipment |
| US20230402848A1 (en)* | 2022-06-10 | 2023-12-14 | The Energy Authority, Inc. | Energy storage optimization system |
| IL295876B2 (en)* | 2022-08-23 | 2023-10-01 | Salvador Tech Ltd | System and method for backup protection |
| CN115330244B (en)* | 2022-08-26 | 2024-08-02 | 天津大学 | Rapid correction method considering power grid branch fault probability change toughness index |
| CN116191572B (en)* | 2023-04-24 | 2023-07-14 | 深圳戴普森新能源技术有限公司 | Intelligent control method and system for photovoltaic inverter |
| CN116523077B (en)* | 2023-06-27 | 2023-09-15 | 国网汇通金财(北京)信息科技有限公司 | Early warning method, device, equipment and storage medium based on container technology |
| CN116822888B (en)* | 2023-07-04 | 2024-03-15 | 上海宏灿信息科技股份有限公司 | Intelligent dispatching command platform based on big data technology |
| CN117196421B (en)* | 2023-09-15 | 2024-05-10 | 大庆市庆翔热电有限公司 | Visual system based on power plant energy scheduling and calibration method |
| WO2025065615A1 (en)* | 2023-09-28 | 2025-04-03 | Siemens Aktiengesellschaft | Method, apparatus, device, and medium for visualizing energy efficiency of digital drive train |
| US12206243B1 (en)* | 2024-02-22 | 2025-01-21 | Greenlight AI LLC | Bi-directional electrical microgrid of networked processing-on-demand systems |
| US12199425B1 (en)* | 2024-02-22 | 2025-01-14 | Greenlight AI LLC | Bi-directional electrical microgrid of networked GPU-on-demand systems |
| CN119051047B (en)* | 2024-09-03 | 2025-03-07 | 武汉华源电力设计院有限公司 | An automatic voltage control method based on active power trend determination |
Citations (152)
| Publication number | Priority date | Publication date | Assignee | Title |
|---|---|---|---|---|
| US548463A (en) | 1895-10-22 | Can-heading machine | ||
| US2309934A (en) | 1941-07-22 | 1943-02-02 | Roby J Clay | Electrical measuring device |
| US3789201A (en)* | 1972-05-18 | 1974-01-29 | Pacific Technology Inc | Simulated load forecast and control apparatus |
| US4419619A (en) | 1981-09-18 | 1983-12-06 | Mcgraw-Edison Company | Microprocessor controlled voltage regulating transformer |
| US4972290A (en) | 1989-09-29 | 1990-11-20 | Abb Power T & D Company Inc. | Electric power system with remote monitoring and control of protective relays |
| US5396416A (en) | 1992-08-19 | 1995-03-07 | Continental Controls, Inc. | Multivariable process control method and apparatus |
| US5502339A (en) | 1989-09-07 | 1996-03-26 | The Trustees Of Boston University | Subscriber electric power load control system |
| US5519622A (en) | 1993-10-18 | 1996-05-21 | Chasek; Norman E. | Real time, economic-impact display system for consumers of commoditized electric power |
| US5539638A (en) | 1993-08-05 | 1996-07-23 | Pavilion Technologies, Inc. | Virtual emissions monitor for automobile |
| US5576700A (en) | 1992-08-26 | 1996-11-19 | Scientific-Atlanta | Apparatus and method for controlling an electrical load and monitoring control operations and the electrical load |
| US5578931A (en) | 1993-10-15 | 1996-11-26 | The Texas A & M University System | ARC spectral analysis system |
| US5598076A (en) | 1991-12-09 | 1997-01-28 | Siemens Aktiengesellschaft | Process for optimizing control parameters for a system having an actual behavior depending on the control parameters |
| US5687139A (en) | 1987-03-23 | 1997-11-11 | Budney; Stanley M. | Electrical load optimization device |
| US5708414A (en) | 1993-08-19 | 1998-01-13 | Sentrol, Inc. | Sensitivity fault indication technique implemented in smoke detector system with self-diagnostic capabilities |
| US5761083A (en) | 1992-03-25 | 1998-06-02 | Brown, Jr.; Robert J. | Energy management and home automation system |
| US5963457A (en)* | 1994-03-18 | 1999-10-05 | Hitachi, Ltd. | Electrical power distribution monitoring system and method |
| US6002260A (en) | 1997-09-23 | 1999-12-14 | Pacific Gas & Electric Company | Fault sensor suitable for use in heterogenous power distribution systems |
| US6008971A (en) | 1998-03-23 | 1999-12-28 | Electric Boat Corporation | Fault protection arrangement for electric power distribution systems |
| US6029092A (en) | 1996-11-21 | 2000-02-22 | Intellinet, Inc. | System and method for providing modular control and for managing energy consumption |
| US6128540A (en) | 1998-02-20 | 2000-10-03 | Hagen Method Pty. Ltd. | Method and computer system for controlling an industrial process using financial analysis |
| US6272449B1 (en) | 1998-06-22 | 2001-08-07 | Torrent Systems, Inc. | Computer system and process for explaining behavior of a model that maps input data to output data |
| US6311144B1 (en) | 1998-05-13 | 2001-10-30 | Nabil A. Abu El Ata | Method and apparatus for designing and analyzing information systems using multi-layer mathematical models |
| US20010036414A1 (en) | 2000-03-31 | 2001-11-01 | Matsushita Electric Industrial Co., Ltd. | Compressor and electric motor |
| US20010036541A1 (en) | 2000-01-26 | 2001-11-01 | Yusuke Makino | Ceramic member for bonding, process for producing the same, vacuum switch, and vacuum vessel |
| US6313752B1 (en) | 1998-05-21 | 2001-11-06 | Steven P. Corrigan | System for displaying dynamic on-line operating conditions of an interconnected power transmission network |
| US6321187B1 (en) | 1998-12-22 | 2001-11-20 | Hamilton Sundstrand Corporation | System reliability assessment tool |
| US20010043450A1 (en) | 1997-06-26 | 2001-11-22 | Venture Scientifics, Llc | System and method for servo control of nonlinear electromagnetic actuators |
| US20010052766A1 (en) | 2000-01-15 | 2001-12-20 | Joerg Drescher | Apparatus for simulating electrical components |
| US6332961B1 (en) | 1997-09-17 | 2001-12-25 | Tokyo Electron Limited | Device and method for detecting and preventing arcing in RF plasma systems |
| US20020035015A1 (en) | 2000-08-30 | 2002-03-21 | Luk Lamellen Und Kupplungsbau Beteiligungs Kg | Method and apparatus for diagnosing a malfunction of a clutch actuator |
| US6408953B1 (en) | 1996-03-25 | 2002-06-25 | Halliburton Energy Services, Inc. | Method and system for predicting performance of a drilling system for a given formation |
| EP1261096A1 (en) | 2001-05-21 | 2002-11-27 | Abb Research Ltd. | Stability prediction for an electric power network |
| US6496342B1 (en) | 1999-02-12 | 2002-12-17 | Bitronics Inc. | Distributed monitoring and protection system for a distributed power network |
| US20020193978A1 (en) | 2001-06-14 | 2002-12-19 | Christophe Soudier | Electrical power system performance simulation |
| US20020198629A1 (en) | 2001-04-27 | 2002-12-26 | Enerwise Global Technologies, Inc. | Computerized utility cost estimation method and system |
| US20030004660A1 (en) | 2001-06-28 | 2003-01-02 | Hunter Robert R. | Method and apparatus for reading and controlling electric power consumption |
| US20030040897A1 (en) | 1996-04-03 | 2003-02-27 | Murphy Thomas Andrew | Man machine interface for power management control systems |
| US20030065486A1 (en) | 2000-05-26 | 2003-04-03 | Shizuo Sumida | Method and apparatus for identifying characteristic value |
| US6549867B1 (en) | 2000-05-26 | 2003-04-15 | Intel Corporation | Power supply feed-forward compensation technique |
| US6553418B1 (en) | 1999-01-02 | 2003-04-22 | Daniel J. Collins | Energy information and control system |
| US20030088511A1 (en) | 2001-07-05 | 2003-05-08 | Karboulonis Peter Panagiotis | Method and system for access and usage management of a server/client application by a wireless communications appliance |
| US20030093390A1 (en) | 2000-04-12 | 2003-05-15 | Takashi Onoda | System and method for estimating power consumption of electric apparatus, and abnormality alarm system utilizing the same |
| US6597999B1 (en) | 1999-12-20 | 2003-07-22 | General Electric Company | Method and system for real-time prediction of zero crossings of fault currents |
| US20030165137A1 (en) | 2001-09-25 | 2003-09-04 | Soloway Stuart R. | Trunking inter-switch links |
| US20030174070A1 (en) | 2002-03-13 | 2003-09-18 | Garrod J. Kelly | Wireless supervisory control and data acquisition |
| US20030193405A1 (en) | 2002-04-15 | 2003-10-16 | Hunt Power, L.P. | User-installable power consumption monitoring system |
| US6636977B1 (en) | 1999-03-10 | 2003-10-21 | Shin Jiuh Corp. | Control device for use in a power supplying apparatus including multiple processors adapted to perform separate functions associated with status monitoring and load balancing |
| US20030200010A1 (en) | 2002-04-22 | 2003-10-23 | Hsiao-Dong Chiang | Method and system for on-line dynamical screening of electric power system |
| US20030200075A1 (en) | 2002-04-19 | 2003-10-23 | Computer Associates Think, Inc. | Automatic model maintenance through local nets |
| US20030234218A1 (en) | 2002-06-21 | 2003-12-25 | H2L Co., Ltd. | System and method for AI controlling waste-water treatment by neural network and back-propagation algorithm |
| US20040005020A1 (en) | 1999-01-25 | 2004-01-08 | Dent Paul W. | Multi-stage CDMA synchronization with parallel execution |
| US6681154B2 (en) | 2000-06-22 | 2004-01-20 | Stonewater Control Systems, Inc. | System and method for monitoring and controlling energy distribution |
| US20040012901A1 (en) | 2002-07-12 | 2004-01-22 | Kojovic Ljubomir A. | Electrical arc furnace protection system |
| US6691065B2 (en) | 2001-02-27 | 2004-02-10 | Hitachi, Ltd. | System foraiding the preparation of operation and maintenance plans for a power generation installation |
| US20040061380A1 (en) | 2002-09-26 | 2004-04-01 | Hann Raymond E. | Power management system for variable load applications |
| US20040073415A1 (en) | 2001-02-23 | 2004-04-15 | Farhat Nabil H | Dynamical brain model for use in data processing applications |
| US20040095237A1 (en) | 1999-01-09 | 2004-05-20 | Chen Kimball C. | Electronic message delivery system utilizable in the monitoring and control of remote equipment and method of same |
| US20040123600A1 (en) | 2002-11-13 | 2004-07-01 | Brunell Brent Jerome | Adaptive model-based control systems and methods for controlling a gas turbine |
| US20040148940A1 (en) | 2003-01-30 | 2004-08-05 | General Electric Company | Method and apparatus for monitoring the performance of a gas turbine system |
| US20040158417A1 (en) | 2002-11-06 | 2004-08-12 | Bonet Antonio Trias | System and method for monitoring and managing electrical power transmission and distribution networks |
| US6785592B1 (en) | 1999-07-16 | 2004-08-31 | Perot Systems Corporation | System and method for energy management |
| US20040176991A1 (en) | 2003-03-05 | 2004-09-09 | Mckennan Carol | System, method and apparatus using biometrics to communicate dissatisfaction via stress level |
| US6806446B1 (en) | 2002-10-04 | 2004-10-19 | Stephen D. Neale | Power management controls for electric appliances |
| US6807494B2 (en) | 2001-03-09 | 2004-10-19 | Ads Corporation | Sewer flow monitoring method and system |
| US6816810B2 (en) | 2000-03-23 | 2004-11-09 | Invensys Systems, Inc. | Process monitoring and control using self-validating sensors |
| US20040225648A1 (en) | 2003-02-07 | 2004-11-11 | Ransom Douglas Stephen | Human machine interface for an energy analytics system |
| US20040236188A1 (en) | 2003-05-19 | 2004-11-25 | Ge Medical Systems Information | Method and apparatus for monitoring using a mathematical model |
| US20040236547A1 (en) | 2003-01-22 | 2004-11-25 | Rappaport Theodore S. | System and method for automated placement or configuration of equipment for obtaining desired network performance objectives and for security, RF tags, and bandwidth provisioning |
| US20040249775A1 (en) | 2003-05-13 | 2004-12-09 | Dingguo Chen | Very short term load prediction in an energy management system |
| US20040260489A1 (en) | 2003-05-13 | 2004-12-23 | Ashmin Mansingh | Energy management system in a power and distribution system |
| US20050007249A1 (en) | 1999-02-22 | 2005-01-13 | Evren Eryurek | Integrated alert generation in a process plant |
| US20050023996A1 (en) | 2003-07-30 | 2005-02-03 | Adamson Hugh P. | Control systems and methods |
| US20050033709A1 (en) | 2003-05-23 | 2005-02-10 | Zhuo Meng | Adaptive learning enhancement to automated model maintenance |
| US20050033481A1 (en)* | 2003-08-08 | 2005-02-10 | Budhraja Vikram S. | Real-time performance monitoring and management system |
| EP1508952A1 (en) | 2003-08-21 | 2005-02-23 | Distribution Control Systems, Inc. | Graphical display of information of an eletrical distribution network |
| US20050057265A1 (en) | 2003-09-15 | 2005-03-17 | Harley Ronald Gordon | System and method for determining harmonic contributions from non-linear loads |
| US20050116814A1 (en) | 2003-10-24 | 2005-06-02 | Rodgers Barry N. | Intelligent power management control system |
| US20050134440A1 (en) | 1997-10-22 | 2005-06-23 | Intelligent Technolgies Int'l, Inc. | Method and system for detecting objects external to a vehicle |
| US20050210337A1 (en) | 2004-03-04 | 2005-09-22 | Falconeer Technologies Llc | Method and system of monitoring, sensor validation and predictive fault analysis |
| US20050236449A1 (en) | 2004-04-27 | 2005-10-27 | Ben Bird | Electrical safety backpack |
| US20050240586A1 (en) | 2004-04-21 | 2005-10-27 | Shimadzu Corporation | Data processing system for instrumental analysis, server and data processing method |
| US20050251296A1 (en) | 2002-10-25 | 2005-11-10 | Tracy Nelson William C | Method and apparatus for control of an electric power distribution system in response to circuit abnormalities |
| WO2005109122A1 (en) | 2004-05-04 | 2005-11-17 | Fisher-Rosemount Systems, Inc. | Graphic element with multiple visualizations in a process environment |
| US20050264563A1 (en) | 2004-03-05 | 2005-12-01 | Macura Matthew J | Method of analysis of comfort for virtual prototyping system |
| US20050281456A1 (en) | 2004-06-18 | 2005-12-22 | Csi Technology, Inc. | Method of automating a thermographic inspection process |
| US6999291B2 (en) | 2002-02-25 | 2006-02-14 | General Electric Company | Method and apparatus for node electronics unit architecture |
| US20060034104A1 (en) | 2004-08-13 | 2006-02-16 | Semyon Royak | Method and apparatus for rejecting the second harmonic current in an active converter with an unbalanced AC line voltage source |
| US7010363B2 (en) | 2003-06-13 | 2006-03-07 | Battelle Memorial Institute | Electrical appliance energy consumption control methods and electrical energy consumption systems |
| US20060064291A1 (en) | 2004-04-21 | 2006-03-23 | Pattipatti Krishna R | Intelligent model-based diagnostics for system monitoring, diagnosis and maintenance |
| US7021974B2 (en) | 2003-02-20 | 2006-04-04 | Rockwell Automation Technologies, Inc. | Modular electrical device |
| US7024649B2 (en) | 2003-02-14 | 2006-04-04 | Iwatt | Multi-output power supply design system |
| US20060074598A1 (en) | 2004-09-10 | 2006-04-06 | Emigholz Kenneth F | Application of abnormal event detection technology to hydrocracking units |
| US20060074501A1 (en) | 1996-05-06 | 2006-04-06 | Pavilion Technologies, Inc. | Method and apparatus for training a system model with gain constraints |
| WO2006037231A1 (en) | 2004-10-01 | 2006-04-13 | Patel Sureshchandra B | System and method of parallel loadflow computation for electrical power system |
| US7031895B1 (en) | 1999-07-26 | 2006-04-18 | Fujitsu Limited | Apparatus and method of generating network simulation model, and storage medium storing program for realizing the method |
| US7039532B2 (en) | 2001-06-28 | 2006-05-02 | Hunter Robert R | Method and apparatus for reading and controlling utility consumption |
| US7043411B1 (en) | 1997-05-22 | 2006-05-09 | British Nuclear Fuels Plc | Monitoring and analysis |
| US20060100837A1 (en) | 2004-11-10 | 2006-05-11 | Symington William A | Method for calibrating a model of in-situ formation stress distribution |
| US20060111816A1 (en) | 2004-11-09 | 2006-05-25 | Truveon Corp. | Methods, systems and computer program products for controlling a climate in a building |
| US20060126608A1 (en) | 2004-11-05 | 2006-06-15 | Honeywell International Inc. | Method and apparatus for system monitoring and maintenance |
| US7081823B2 (en) | 2003-10-31 | 2006-07-25 | International Business Machines Corporation | System and method of predicting future behavior of a battery of end-to-end probes to anticipate and prevent computer network performance degradation |
| US20060178782A1 (en) | 2005-02-10 | 2006-08-10 | General Electric Company | Methods and apparatus for optimizing combined cycle/combined process facilities |
| US20060184462A1 (en) | 2004-12-10 | 2006-08-17 | Hawkins Jeffrey C | Methods, architecture, and apparatus for implementing machine intelligence and hierarchical memory systems |
| US7127327B1 (en) | 2003-09-11 | 2006-10-24 | Dte Energy Technologies, Inc. | System and method for managing energy generation equipment |
| US7136725B1 (en) | 2001-06-21 | 2006-11-14 | Paciorek Ronald R | Load shed notification method, product, and apparatus |
| US7135956B2 (en) | 2000-07-13 | 2006-11-14 | Nxegen, Inc. | System and method for monitoring and controlling energy usage |
| US7143021B1 (en) | 2000-10-03 | 2006-11-28 | Cadence Design Systems, Inc. | Systems and methods for efficiently simulating analog behavior of designs having hierarchical structure |
| US20070005311A1 (en) | 2005-04-25 | 2007-01-04 | Smartsignal Corporation | Automated model configuration and deployment system for equipment health monitoring |
| US20070005199A1 (en) | 2005-06-29 | 2007-01-04 | Honeywell International Inc. | System and method for enhancing computer-generated images of terrain on aircraft displays |
| US7172132B2 (en) | 2004-08-05 | 2007-02-06 | Carrier Corporation | Balanced utility load management |
| US20070055392A1 (en) | 2005-09-06 | 2007-03-08 | D Amato Fernando J | Method and system for model predictive control of a power plant |
| US7200502B2 (en) | 2005-03-30 | 2007-04-03 | Rockwell Automation Technologies, Inc. | Dual connection power line parameter analysis method and system |
| US20070112694A1 (en) | 2005-11-14 | 2007-05-17 | Sempa Power Systems Ltd. | Facility energy management system |
| US20070135971A1 (en) | 2002-02-25 | 2007-06-14 | General Electric Company | Integrated protection, monitoring, and control system |
| US20070156363A1 (en) | 2005-12-29 | 2007-07-05 | Stewart Gregory E | Calibration of engine control systems |
| US20070174528A1 (en) | 2006-01-20 | 2007-07-26 | Uriya Mantver | Management of a network supplying power over data lines |
| US20070181548A1 (en) | 2003-06-13 | 2007-08-09 | Abb Ab | Welding process |
| US20070192078A1 (en) | 2006-02-14 | 2007-08-16 | Edsa Micro Corporation | Systems and methods for real-time system monitoring and predictive analysis |
| US20070213956A1 (en) | 2006-03-10 | 2007-09-13 | Edsa Micro Corporation | Systems and methods for real-time protective device evaluation in an electrical power distribution system |
| US20070239373A1 (en) | 2006-03-10 | 2007-10-11 | Edsa Micro Corporation | Systems and methods for automatic real-time capacity assessment for use in real-time power analytics of an electrical power distribution system |
| US20070265713A1 (en) | 2006-02-03 | 2007-11-15 | Michel Veillette | Intelligent Monitoring System and Method for Building Predictive Models and Detecting Anomalies |
| US20070265811A1 (en) | 2006-05-12 | 2007-11-15 | International Business Machines Corporation | Using stochastic models to diagnose and predict complex system problems |
| US20070286089A1 (en) | 2006-03-10 | 2007-12-13 | Edsa Micro Corporation | Systems and methods for predictive monitoring including real-time strength and security analysis in an electrical power distribution system |
| US20070285079A1 (en) | 2006-03-10 | 2007-12-13 | Edsa Micro Corporation | Systems and methods for performing automatic real-time harmonics analyses for use in real-time power analytics of an electrical power distribution system |
| US7310590B1 (en) | 2006-11-15 | 2007-12-18 | Computer Associates Think, Inc. | Time series anomaly detection using multiple statistical models |
| US20080040296A1 (en) | 2006-08-10 | 2008-02-14 | V2 Green Inc. | Electric Resource Power Meter in a Power Aggregation System for Distributed Electric Resources |
| US20080046387A1 (en) | 2006-07-23 | 2008-02-21 | Rajeev Gopal | System and method for policy based control of local electrical energy generation and use |
| US7373283B2 (en) | 2001-02-22 | 2008-05-13 | Smartsignal Corporation | Monitoring and fault detection system and method using improved empirical model for range extrema |
| US7398168B2 (en) | 2005-09-08 | 2008-07-08 | Genscape Intangible Holding, Inc. | Method and system for monitoring power flow through an electric power transmission line |
| US7415368B2 (en) | 2001-02-23 | 2008-08-19 | Power Measurement Ltd. | Intelligent electronic device having network access |
| US20080238699A1 (en) | 2007-03-29 | 2008-10-02 | International Business Machines Corporation | Real time alarm classification and method of use |
| US20080262820A1 (en) | 2006-07-19 | 2008-10-23 | Edsa Micro Corporation | Real-time predictive systems for intelligent energy monitoring and management of electrical power networks |
| US20080289875A1 (en) | 2004-09-03 | 2008-11-27 | The Robert Gordon University | Method and System for the Design of an Oil Well |
| US20090018746A1 (en) | 2004-05-06 | 2009-01-15 | Ricardo Uk Limited | Method and Apparatus For Measuring and Correcting an In-Cylinder Pressure Measurement |
| US7489990B2 (en) | 2006-07-17 | 2009-02-10 | Fehr Stephen L | Systems and methods for calculating and predicting near term production cost, incremental heat rate, capacity and emissions of electric generation power plants based on current operating and, optionally, atmospheric conditions |
| US20090076749A1 (en) | 2007-05-16 | 2009-03-19 | Edsa Micro Corporation | Electrical power system modeling, design, analysis, and reporting via a client-server application framework |
| US7528503B2 (en) | 2005-07-22 | 2009-05-05 | Cannon Technologies, Inc. | Load shedding control for cycled or variable load appliances |
| US7571028B2 (en) | 2005-04-19 | 2009-08-04 | Genscape Intangible Holding, Inc. | Method and system for AC power grid monitoring |
| US20090319415A1 (en) | 2004-08-23 | 2009-12-24 | Georgi Dimov Stoilov | Momentary Power Market |
| US20090326884A1 (en) | 2008-06-26 | 2009-12-31 | International Business Machines Corporation | Techniques to Predict Three-Dimensional Thermal Distributions in Real-Time |
| US20100049494A1 (en) | 2008-08-15 | 2010-02-25 | Edsa Corporation | Method for predicting power usage effectiveness and data center infrastructure efficiency within a real-time monitoring system |
| US7689323B2 (en) | 2003-05-13 | 2010-03-30 | Siemens Aktiengesellschaft | Automatic generation control of a power distribution system |
| US7693608B2 (en) | 2006-04-12 | 2010-04-06 | Edsa Micro Corporation | Systems and methods for alarm filtering and management within a real-time data acquisition and monitoring environment |
| US7729808B2 (en) | 2006-03-10 | 2010-06-01 | Edsa Micro Corporation | System for comparing real-time data and modeling engine data to predict arc flash events |
| US7739096B2 (en) | 2000-03-09 | 2010-06-15 | Smartsignal Corporation | System for extraction of representative data for training of adaptive process monitoring equipment |
| US7840396B2 (en) | 2006-03-10 | 2010-11-23 | Edsa Micro Corporation | Systems and methods for determining protective device clearing times used for providing real-time predictions about arc flash events |
| US8068938B2 (en) | 2009-05-15 | 2011-11-29 | General Electric Company | Method and system for managing a load demand on an electrical grid |
| US20120191439A1 (en) | 2011-01-25 | 2012-07-26 | Power Analytics Corporation | Systems and methods for automated model-based real-time simulation of a microgrid for market-based electric power system optimization |
| US8239170B2 (en) | 2000-03-09 | 2012-08-07 | Smartsignal Corporation | Complex signal decomposition and modeling |
| US20120265350A1 (en) | 2011-04-14 | 2012-10-18 | Ian Ashdown | Predictive daylight harvesting system |
| US8321194B2 (en) | 2009-10-01 | 2012-11-27 | Power Analytics Corporation | Real time microgrid power analytics portal for mission critical power systems |
| US20120323382A1 (en) | 2011-06-15 | 2012-12-20 | Expanergy, Llc | Systems and methods to assess and optimize energy usage for a facility |
Family Cites Families (36)
| Publication number | Priority date | Publication date | Assignee | Title |
|---|---|---|---|---|
| US5251268A (en) | 1991-08-09 | 1993-10-05 | Electric Power Research Institute, Inc. | Integrated method and apparatus for character and symbol recognition |
| EP0534446B1 (en) | 1991-09-26 | 2001-07-11 | Mitsubishi Denki Kabushiki Kaisha | System with approximation means for recognizing graphical elements in a drawing |
| US6314194B1 (en) | 1995-07-26 | 2001-11-06 | The United States Of America As Represented By The Secretary Of The Army | Method for generating computer aided design programming circuit designs from scanned images of the design |
| DE69731060T2 (en) | 1996-11-29 | 2005-11-17 | Woodward Governor Co., Loveland | Method and apparatus for calculating and controlling non-linear disturbances in a feedback control system |
| WO1999026330A2 (en) | 1997-11-17 | 1999-05-27 | Lifestyle Technologies | Universal power supply |
| AU2624700A (en) | 1999-01-27 | 2000-08-18 | Washington University | Method and apparatus for processing images with curves |
| US6917186B2 (en) | 2000-04-24 | 2005-07-12 | S & C Electric Co. | Monitoring and control for power electronic system |
| US7020595B1 (en) | 1999-11-26 | 2006-03-28 | General Electric Company | Methods and apparatus for model based diagnostics |
| US6530065B1 (en) | 2000-03-14 | 2003-03-04 | Transim Technology Corporation | Client-server simulator, such as an electrical circuit simulator provided by a web server over the internet |
| JP2002259508A (en) | 2001-03-05 | 2002-09-13 | Hitachi Ltd | Energy monitoring system |
| US6892361B2 (en) | 2001-07-06 | 2005-05-10 | International Business Machines Corporation | Task composition method for computer applications |
| US6733384B2 (en) | 2001-09-06 | 2004-05-11 | Intel Corporation | Creating a cutting template for a virtual jigsaw puzzle using guide points and a spline-fitting algorithm |
| GB0127552D0 (en) | 2001-11-16 | 2002-01-09 | Abb Ab | Analysing events |
| US7171344B2 (en) | 2001-12-21 | 2007-01-30 | Caterpillar Inc | Method and system for providing end-user visualization |
| US7363099B2 (en) | 2002-06-07 | 2008-04-22 | Cadence Design Systems, Inc. | Integrated circuit metrology |
| US7458028B2 (en) | 2003-07-18 | 2008-11-25 | Avinash Chidambaram | Graphical interface for configuring a power supply controller |
| US20050156715A1 (en) | 2004-01-16 | 2005-07-21 | Jie Zou | Method and system for interfacing with mobile telemetry devices |
| US7286960B2 (en) | 2004-09-30 | 2007-10-23 | General Electric Company | Systems and methods for monitoring fouling and slagging in heat transfer devices in coal fired power plants |
| US7467049B2 (en) | 2005-05-27 | 2008-12-16 | American Electric Power Company, Inc. | System and method for detecting impaired electric power equipment |
| EP1913506A4 (en) | 2005-07-11 | 2008-08-13 | Brooks Automation Inc | Intelligent condition monitoring and fault diagnostic system for predictive maintenance |
| JP4911487B2 (en) | 2005-07-12 | 2012-04-04 | 独立行政法人産業技術総合研究所 | Method and apparatus for measuring precise flow rate and calorific value of mixed gas |
| US7714735B2 (en) | 2005-09-13 | 2010-05-11 | Daniel Rockwell | Monitoring electrical assets for fault and efficiency correction |
| AU2007206046A1 (en) | 2006-01-19 | 2007-07-26 | Safelite Group, Inc. | Method and device for providing location based content delivery |
| US8131401B2 (en) | 2006-07-19 | 2012-03-06 | Power Analytics Corporation | Real-time stability indexing for intelligent energy monitoring and management of electrical power network system |
| US8165723B2 (en) | 2006-03-10 | 2012-04-24 | Power Analytics Corporation | Real-time system for verification and monitoring of protective device settings within an electrical power distribution network and automatic correction of deviances found |
| US7716535B2 (en) | 2006-06-08 | 2010-05-11 | Oracle America, Inc. | Kalman filtering for grid computing telemetry and workload management |
| CA2657330C (en) | 2006-07-20 | 2016-07-05 | Edsa Micro Corporation | Systems and methods for alarm filtering and management within a real-time data acquisition and monitoring environment |
| US20090066287A1 (en) | 2006-08-10 | 2009-03-12 | V2Green, Inc. | Business Methods in a Power Aggregation System for Distributed Electric Resources |
| US8103463B2 (en) | 2006-09-21 | 2012-01-24 | Impact Technologies, Llc | Systems and methods for predicting failure of electronic systems and assessing level of degradation and remaining useful life |
| US7991512B2 (en) | 2007-08-28 | 2011-08-02 | General Electric Company | Hybrid robust predictive optimization method of power system dispatch |
| AU2008356120A1 (en) | 2007-11-07 | 2009-11-12 | Edsa Micro Corporation | Systems and methods for real-time forecasting and predicting of electrical peaks and managing the energy, health, reliability, and performance of electrical power systems based on an artificial adaptive neural network |
| US8000913B2 (en) | 2008-01-21 | 2011-08-16 | Current Communications Services, Llc | System and method for providing power distribution system information |
| US7930070B2 (en) | 2008-09-25 | 2011-04-19 | Kingston Consulting, Inc. | System, method, and module capable of curtailing energy production within congestive grid operating environments |
| US20100217550A1 (en) | 2009-02-26 | 2010-08-26 | Jason Crabtree | System and method for electric grid utilization and optimization |
| US20100250590A1 (en) | 2009-03-30 | 2010-09-30 | Galvin Brian R | System and method for managing energy |
| US8401709B2 (en) | 2009-11-03 | 2013-03-19 | Spirae, Inc. | Dynamic distributed power grid control system |
- 2008
- 2008-05-15USUS12/121,552patent/US9557723B2/ennot_activeExpired - Fee Related
- 2014
- 2014-11-04USUS14/532,559patent/US9031824B2/ennot_activeExpired - Fee Related
- 2017
- 2017-01-30USUS15/418,943patent/US20170192398A1/ennot_activeAbandoned
Patent Citations (163)
| Publication number | Priority date | Publication date | Assignee | Title |
|---|---|---|---|---|
| US548463A (en) | 1895-10-22 | Can-heading machine | ||
| US2309934A (en) | 1941-07-22 | 1943-02-02 | Roby J Clay | Electrical measuring device |
| US3789201A (en)* | 1972-05-18 | 1974-01-29 | Pacific Technology Inc | Simulated load forecast and control apparatus |
| US4419619A (en) | 1981-09-18 | 1983-12-06 | Mcgraw-Edison Company | Microprocessor controlled voltage regulating transformer |
| US5687139A (en) | 1987-03-23 | 1997-11-11 | Budney; Stanley M. | Electrical load optimization device |
| US5502339A (en) | 1989-09-07 | 1996-03-26 | The Trustees Of Boston University | Subscriber electric power load control system |
| US4972290A (en) | 1989-09-29 | 1990-11-20 | Abb Power T & D Company Inc. | Electric power system with remote monitoring and control of protective relays |
| US5598076A (en) | 1991-12-09 | 1997-01-28 | Siemens Aktiengesellschaft | Process for optimizing control parameters for a system having an actual behavior depending on the control parameters |
| US5761083A (en) | 1992-03-25 | 1998-06-02 | Brown, Jr.; Robert J. | Energy management and home automation system |
| US5396416A (en) | 1992-08-19 | 1995-03-07 | Continental Controls, Inc. | Multivariable process control method and apparatus |
| US5576700A (en) | 1992-08-26 | 1996-11-19 | Scientific-Atlanta | Apparatus and method for controlling an electrical load and monitoring control operations and the electrical load |
| US5539638A (en) | 1993-08-05 | 1996-07-23 | Pavilion Technologies, Inc. | Virtual emissions monitor for automobile |
| US5682317A (en) | 1993-08-05 | 1997-10-28 | Pavilion Technologies, Inc. | Virtual emissions monitor for automobile and associated control system |
| US5708414A (en) | 1993-08-19 | 1998-01-13 | Sentrol, Inc. | Sensitivity fault indication technique implemented in smoke detector system with self-diagnostic capabilities |
| US5821866A (en) | 1993-08-19 | 1998-10-13 | Slc Technologies, Inc. | Self-diagnosing smoke detector assembly |
| US5578931A (en) | 1993-10-15 | 1996-11-26 | The Texas A & M University System | ARC spectral analysis system |
| US5519622A (en) | 1993-10-18 | 1996-05-21 | Chasek; Norman E. | Real time, economic-impact display system for consumers of commoditized electric power |
| US5963457A (en)* | 1994-03-18 | 1999-10-05 | Hitachi, Ltd. | Electrical power distribution monitoring system and method |
| US6408953B1 (en) | 1996-03-25 | 2002-06-25 | Halliburton Energy Services, Inc. | Method and system for predicting performance of a drilling system for a given formation |
| US20030040897A1 (en) | 1996-04-03 | 2003-02-27 | Murphy Thomas Andrew | Man machine interface for power management control systems |
| US20060074501A1 (en) | 1996-05-06 | 2006-04-06 | Pavilion Technologies, Inc. | Method and apparatus for training a system model with gain constraints |
| US6029092A (en) | 1996-11-21 | 2000-02-22 | Intellinet, Inc. | System and method for providing modular control and for managing energy consumption |
| US7043411B1 (en) | 1997-05-22 | 2006-05-09 | British Nuclear Fuels Plc | Monitoring and analysis |
| US20010043450A1 (en) | 1997-06-26 | 2001-11-22 | Venture Scientifics, Llc | System and method for servo control of nonlinear electromagnetic actuators |
| US6332961B1 (en) | 1997-09-17 | 2001-12-25 | Tokyo Electron Limited | Device and method for detecting and preventing arcing in RF plasma systems |
| US6002260A (en) | 1997-09-23 | 1999-12-14 | Pacific Gas & Electric Company | Fault sensor suitable for use in heterogenous power distribution systems |
| US20050134440A1 (en) | 1997-10-22 | 2005-06-23 | Intelligent Technolgies Int'l, Inc. | Method and system for detecting objects external to a vehicle |
| US6128540A (en) | 1998-02-20 | 2000-10-03 | Hagen Method Pty. Ltd. | Method and computer system for controlling an industrial process using financial analysis |
| US6008971A (en) | 1998-03-23 | 1999-12-28 | Electric Boat Corporation | Fault protection arrangement for electric power distribution systems |
| US6311144B1 (en) | 1998-05-13 | 2001-10-30 | Nabil A. Abu El Ata | Method and apparatus for designing and analyzing information systems using multi-layer mathematical models |
| US6313752B1 (en) | 1998-05-21 | 2001-11-06 | Steven P. Corrigan | System for displaying dynamic on-line operating conditions of an interconnected power transmission network |
| US6272449B1 (en) | 1998-06-22 | 2001-08-07 | Torrent Systems, Inc. | Computer system and process for explaining behavior of a model that maps input data to output data |
| US6321187B1 (en) | 1998-12-22 | 2001-11-20 | Hamilton Sundstrand Corporation | System reliability assessment tool |
| US6553418B1 (en) | 1999-01-02 | 2003-04-22 | Daniel J. Collins | Energy information and control system |
| US20040095237A1 (en) | 1999-01-09 | 2004-05-20 | Chen Kimball C. | Electronic message delivery system utilizable in the monitoring and control of remote equipment and method of same |
| US20040005020A1 (en) | 1999-01-25 | 2004-01-08 | Dent Paul W. | Multi-stage CDMA synchronization with parallel execution |
| US6496342B1 (en) | 1999-02-12 | 2002-12-17 | Bitronics Inc. | Distributed monitoring and protection system for a distributed power network |
| US6654216B2 (en) | 1999-02-12 | 2003-11-25 | Bitronics, Inc. | Distributed monitoring and protection system for a distributed power network |
| US20050007249A1 (en) | 1999-02-22 | 2005-01-13 | Evren Eryurek | Integrated alert generation in a process plant |
| US6636977B1 (en) | 1999-03-10 | 2003-10-21 | Shin Jiuh Corp. | Control device for use in a power supplying apparatus including multiple processors adapted to perform separate functions associated with status monitoring and load balancing |
| US6785592B1 (en) | 1999-07-16 | 2004-08-31 | Perot Systems Corporation | System and method for energy management |
| US7031895B1 (en) | 1999-07-26 | 2006-04-18 | Fujitsu Limited | Apparatus and method of generating network simulation model, and storage medium storing program for realizing the method |
| US6597999B1 (en) | 1999-12-20 | 2003-07-22 | General Electric Company | Method and system for real-time prediction of zero crossings of fault currents |
| US20010052766A1 (en) | 2000-01-15 | 2001-12-20 | Joerg Drescher | Apparatus for simulating electrical components |
| US20010036541A1 (en) | 2000-01-26 | 2001-11-01 | Yusuke Makino | Ceramic member for bonding, process for producing the same, vacuum switch, and vacuum vessel |
| US7739096B2 (en) | 2000-03-09 | 2010-06-15 | Smartsignal Corporation | System for extraction of representative data for training of adaptive process monitoring equipment |
| US8239170B2 (en) | 2000-03-09 | 2012-08-07 | Smartsignal Corporation | Complex signal decomposition and modeling |
| US6816810B2 (en) | 2000-03-23 | 2004-11-09 | Invensys Systems, Inc. | Process monitoring and control using self-validating sensors |
| US20010036414A1 (en) | 2000-03-31 | 2001-11-01 | Matsushita Electric Industrial Co., Ltd. | Compressor and electric motor |
| US20030093390A1 (en) | 2000-04-12 | 2003-05-15 | Takashi Onoda | System and method for estimating power consumption of electric apparatus, and abnormality alarm system utilizing the same |
| US20030065486A1 (en) | 2000-05-26 | 2003-04-03 | Shizuo Sumida | Method and apparatus for identifying characteristic value |
| US6549867B1 (en) | 2000-05-26 | 2003-04-15 | Intel Corporation | Power supply feed-forward compensation technique |
| US6681154B2 (en) | 2000-06-22 | 2004-01-20 | Stonewater Control Systems, Inc. | System and method for monitoring and controlling energy distribution |
| US7135956B2 (en) | 2000-07-13 | 2006-11-14 | Nxegen, Inc. | System and method for monitoring and controlling energy usage |
| US20020035015A1 (en) | 2000-08-30 | 2002-03-21 | Luk Lamellen Und Kupplungsbau Beteiligungs Kg | Method and apparatus for diagnosing a malfunction of a clutch actuator |
| US7143021B1 (en) | 2000-10-03 | 2006-11-28 | Cadence Design Systems, Inc. | Systems and methods for efficiently simulating analog behavior of designs having hierarchical structure |
| US7373283B2 (en) | 2001-02-22 | 2008-05-13 | Smartsignal Corporation | Monitoring and fault detection system and method using improved empirical model for range extrema |
| US20040073415A1 (en) | 2001-02-23 | 2004-04-15 | Farhat Nabil H | Dynamical brain model for use in data processing applications |
| US7415368B2 (en) | 2001-02-23 | 2008-08-19 | Power Measurement Ltd. | Intelligent electronic device having network access |
| US20040181369A1 (en) | 2001-02-27 | 2004-09-16 | Hitachi, Ltd. | System for aiding the preparation of operation and maintenance plans for a power-generation installation |
| US6691065B2 (en) | 2001-02-27 | 2004-02-10 | Hitachi, Ltd. | System foraiding the preparation of operation and maintenance plans for a power generation installation |
| US6807494B2 (en) | 2001-03-09 | 2004-10-19 | Ads Corporation | Sewer flow monitoring method and system |
| US20020198629A1 (en) | 2001-04-27 | 2002-12-26 | Enerwise Global Technologies, Inc. | Computerized utility cost estimation method and system |
| EP1261096A1 (en) | 2001-05-21 | 2002-11-27 | Abb Research Ltd. | Stability prediction for an electric power network |
| US20020193978A1 (en) | 2001-06-14 | 2002-12-19 | Christophe Soudier | Electrical power system performance simulation |
| US7136725B1 (en) | 2001-06-21 | 2006-11-14 | Paciorek Ronald R | Load shed notification method, product, and apparatus |
| US20030004660A1 (en) | 2001-06-28 | 2003-01-02 | Hunter Robert R. | Method and apparatus for reading and controlling electric power consumption |
| US7039532B2 (en) | 2001-06-28 | 2006-05-02 | Hunter Robert R | Method and apparatus for reading and controlling utility consumption |
| US20030088511A1 (en) | 2001-07-05 | 2003-05-08 | Karboulonis Peter Panagiotis | Method and system for access and usage management of a server/client application by a wireless communications appliance |
| US20030165137A1 (en) | 2001-09-25 | 2003-09-04 | Soloway Stuart R. | Trunking inter-switch links |
| US6999291B2 (en) | 2002-02-25 | 2006-02-14 | General Electric Company | Method and apparatus for node electronics unit architecture |
| US7151329B2 (en) | 2002-02-25 | 2006-12-19 | General Electric Company | Integrated protection, monitoring, and control system |
| US20070135971A1 (en) | 2002-02-25 | 2007-06-14 | General Electric Company | Integrated protection, monitoring, and control system |
| US7043340B2 (en) | 2002-02-25 | 2006-05-09 | General Electric Company | Protection system for power distribution systems |
| US20030174070A1 (en) | 2002-03-13 | 2003-09-18 | Garrod J. Kelly | Wireless supervisory control and data acquisition |
| US20030193405A1 (en) | 2002-04-15 | 2003-10-16 | Hunt Power, L.P. | User-installable power consumption monitoring system |
| US20030200075A1 (en) | 2002-04-19 | 2003-10-23 | Computer Associates Think, Inc. | Automatic model maintenance through local nets |
| US20030200010A1 (en) | 2002-04-22 | 2003-10-23 | Hsiao-Dong Chiang | Method and system for on-line dynamical screening of electric power system |
| US20030234218A1 (en) | 2002-06-21 | 2003-12-25 | H2L Co., Ltd. | System and method for AI controlling waste-water treatment by neural network and back-propagation algorithm |
| US20040012901A1 (en) | 2002-07-12 | 2004-01-22 | Kojovic Ljubomir A. | Electrical arc furnace protection system |
| US20040061380A1 (en) | 2002-09-26 | 2004-04-01 | Hann Raymond E. | Power management system for variable load applications |
| US6806446B1 (en) | 2002-10-04 | 2004-10-19 | Stephen D. Neale | Power management controls for electric appliances |
| US20050251296A1 (en) | 2002-10-25 | 2005-11-10 | Tracy Nelson William C | Method and apparatus for control of an electric power distribution system in response to circuit abnormalities |
| US20040158417A1 (en) | 2002-11-06 | 2004-08-12 | Bonet Antonio Trias | System and method for monitoring and managing electrical power transmission and distribution networks |
| US20040123600A1 (en) | 2002-11-13 | 2004-07-01 | Brunell Brent Jerome | Adaptive model-based control systems and methods for controlling a gas turbine |
| US20040236547A1 (en) | 2003-01-22 | 2004-11-25 | Rappaport Theodore S. | System and method for automated placement or configuration of equipment for obtaining desired network performance objectives and for security, RF tags, and bandwidth provisioning |
| US20040148940A1 (en) | 2003-01-30 | 2004-08-05 | General Electric Company | Method and apparatus for monitoring the performance of a gas turbine system |
| US20040225648A1 (en) | 2003-02-07 | 2004-11-11 | Ransom Douglas Stephen | Human machine interface for an energy analytics system |
| US7024649B2 (en) | 2003-02-14 | 2006-04-04 | Iwatt | Multi-output power supply design system |
| US7021974B2 (en) | 2003-02-20 | 2006-04-04 | Rockwell Automation Technologies, Inc. | Modular electrical device |
| US20040176991A1 (en) | 2003-03-05 | 2004-09-09 | Mckennan Carol | System, method and apparatus using biometrics to communicate dissatisfaction via stress level |
| US20040260489A1 (en) | 2003-05-13 | 2004-12-23 | Ashmin Mansingh | Energy management system in a power and distribution system |
| US7689323B2 (en) | 2003-05-13 | 2010-03-30 | Siemens Aktiengesellschaft | Automatic generation control of a power distribution system |
| US20040249775A1 (en) | 2003-05-13 | 2004-12-09 | Dingguo Chen | Very short term load prediction in an energy management system |
| US20040236188A1 (en) | 2003-05-19 | 2004-11-25 | Ge Medical Systems Information | Method and apparatus for monitoring using a mathematical model |
| US7092922B2 (en) | 2003-05-23 | 2006-08-15 | Computer Associates Think, Inc. | Adaptive learning enhancement to automated model maintenance |
| US20050033709A1 (en) | 2003-05-23 | 2005-02-10 | Zhuo Meng | Adaptive learning enhancement to automated model maintenance |
| US7010363B2 (en) | 2003-06-13 | 2006-03-07 | Battelle Memorial Institute | Electrical appliance energy consumption control methods and electrical energy consumption systems |
| US20070181548A1 (en) | 2003-06-13 | 2007-08-09 | Abb Ab | Welding process |
| US20050023996A1 (en) | 2003-07-30 | 2005-02-03 | Adamson Hugh P. | Control systems and methods |
| US20050033481A1 (en)* | 2003-08-08 | 2005-02-10 | Budhraja Vikram S. | Real-time performance monitoring and management system |
| EP1508952A1 (en) | 2003-08-21 | 2005-02-23 | Distribution Control Systems, Inc. | Graphical display of information of an eletrical distribution network |
| US7127327B1 (en) | 2003-09-11 | 2006-10-24 | Dte Energy Technologies, Inc. | System and method for managing energy generation equipment |
| US20050057265A1 (en) | 2003-09-15 | 2005-03-17 | Harley Ronald Gordon | System and method for determining harmonic contributions from non-linear loads |
| US20050116814A1 (en) | 2003-10-24 | 2005-06-02 | Rodgers Barry N. | Intelligent power management control system |
| US7081823B2 (en) | 2003-10-31 | 2006-07-25 | International Business Machines Corporation | System and method of predicting future behavior of a battery of end-to-end probes to anticipate and prevent computer network performance degradation |
| US20050210337A1 (en) | 2004-03-04 | 2005-09-22 | Falconeer Technologies Llc | Method and system of monitoring, sensor validation and predictive fault analysis |
| US20050264563A1 (en) | 2004-03-05 | 2005-12-01 | Macura Matthew J | Method of analysis of comfort for virtual prototyping system |
| US20050240586A1 (en) | 2004-04-21 | 2005-10-27 | Shimadzu Corporation | Data processing system for instrumental analysis, server and data processing method |
| US20060064291A1 (en) | 2004-04-21 | 2006-03-23 | Pattipatti Krishna R | Intelligent model-based diagnostics for system monitoring, diagnosis and maintenance |
| US20050236449A1 (en) | 2004-04-27 | 2005-10-27 | Ben Bird | Electrical safety backpack |
| WO2005109122A1 (en) | 2004-05-04 | 2005-11-17 | Fisher-Rosemount Systems, Inc. | Graphic element with multiple visualizations in a process environment |
| US20090018746A1 (en) | 2004-05-06 | 2009-01-15 | Ricardo Uk Limited | Method and Apparatus For Measuring and Correcting an In-Cylinder Pressure Measurement |
| US20050281456A1 (en) | 2004-06-18 | 2005-12-22 | Csi Technology, Inc. | Method of automating a thermographic inspection process |
| US7172132B2 (en) | 2004-08-05 | 2007-02-06 | Carrier Corporation | Balanced utility load management |
| US20060034104A1 (en) | 2004-08-13 | 2006-02-16 | Semyon Royak | Method and apparatus for rejecting the second harmonic current in an active converter with an unbalanced AC line voltage source |
| US20090319415A1 (en) | 2004-08-23 | 2009-12-24 | Georgi Dimov Stoilov | Momentary Power Market |
| US20080289875A1 (en) | 2004-09-03 | 2008-11-27 | The Robert Gordon University | Method and System for the Design of an Oil Well |
| US20060074598A1 (en) | 2004-09-10 | 2006-04-06 | Emigholz Kenneth F | Application of abnormal event detection technology to hydrocracking units |
| WO2006037231A1 (en) | 2004-10-01 | 2006-04-13 | Patel Sureshchandra B | System and method of parallel loadflow computation for electrical power system |
| US20060126608A1 (en) | 2004-11-05 | 2006-06-15 | Honeywell International Inc. | Method and apparatus for system monitoring and maintenance |
| US20060111816A1 (en) | 2004-11-09 | 2006-05-25 | Truveon Corp. | Methods, systems and computer program products for controlling a climate in a building |
| US20060100837A1 (en) | 2004-11-10 | 2006-05-11 | Symington William A | Method for calibrating a model of in-situ formation stress distribution |
| US20060184462A1 (en) | 2004-12-10 | 2006-08-17 | Hawkins Jeffrey C | Methods, architecture, and apparatus for implementing machine intelligence and hierarchical memory systems |
| US20060178782A1 (en) | 2005-02-10 | 2006-08-10 | General Electric Company | Methods and apparatus for optimizing combined cycle/combined process facilities |
| US7200502B2 (en) | 2005-03-30 | 2007-04-03 | Rockwell Automation Technologies, Inc. | Dual connection power line parameter analysis method and system |
| US7571028B2 (en) | 2005-04-19 | 2009-08-04 | Genscape Intangible Holding, Inc. | Method and system for AC power grid monitoring |
| US20070005311A1 (en) | 2005-04-25 | 2007-01-04 | Smartsignal Corporation | Automated model configuration and deployment system for equipment health monitoring |
| US20070005199A1 (en) | 2005-06-29 | 2007-01-04 | Honeywell International Inc. | System and method for enhancing computer-generated images of terrain on aircraft displays |
| US7528503B2 (en) | 2005-07-22 | 2009-05-05 | Cannon Technologies, Inc. | Load shedding control for cycled or variable load appliances |
| US20070055392A1 (en) | 2005-09-06 | 2007-03-08 | D Amato Fernando J | Method and system for model predictive control of a power plant |
| US7398168B2 (en) | 2005-09-08 | 2008-07-08 | Genscape Intangible Holding, Inc. | Method and system for monitoring power flow through an electric power transmission line |
| US20070112694A1 (en) | 2005-11-14 | 2007-05-17 | Sempa Power Systems Ltd. | Facility energy management system |
| US20070156363A1 (en) | 2005-12-29 | 2007-07-05 | Stewart Gregory E | Calibration of engine control systems |
| US20070174528A1 (en) | 2006-01-20 | 2007-07-26 | Uriya Mantver | Management of a network supplying power over data lines |
| US20070265713A1 (en) | 2006-02-03 | 2007-11-15 | Michel Veillette | Intelligent Monitoring System and Method for Building Predictive Models and Detecting Anomalies |
| US20070192078A1 (en) | 2006-02-14 | 2007-08-16 | Edsa Micro Corporation | Systems and methods for real-time system monitoring and predictive analysis |
| US20100262411A1 (en) | 2006-02-14 | 2010-10-14 | Edsa Micro Corporation | Systems and methods for real-time system monitoring and predictive analysis |
| US20070239373A1 (en) | 2006-03-10 | 2007-10-11 | Edsa Micro Corporation | Systems and methods for automatic real-time capacity assessment for use in real-time power analytics of an electrical power distribution system |
| US7840396B2 (en) | 2006-03-10 | 2010-11-23 | Edsa Micro Corporation | Systems and methods for determining protective device clearing times used for providing real-time predictions about arc flash events |
| US7840395B2 (en) | 2006-03-10 | 2010-11-23 | Edsa Micro Corporation | Systems and methods for predictive monitoring including real-time strength and security analysis in an electrical power distribution system |
| US20070285079A1 (en) | 2006-03-10 | 2007-12-13 | Edsa Micro Corporation | Systems and methods for performing automatic real-time harmonics analyses for use in real-time power analytics of an electrical power distribution system |
| US20070286089A1 (en) | 2006-03-10 | 2007-12-13 | Edsa Micro Corporation | Systems and methods for predictive monitoring including real-time strength and security analysis in an electrical power distribution system |
| US20100268396A1 (en) | 2006-03-10 | 2010-10-21 | Edsa Micro Corporation | System for comparing real-time data and modeling engine data to predict arc flash events |
| US20070213956A1 (en) | 2006-03-10 | 2007-09-13 | Edsa Micro Corporation | Systems and methods for real-time protective device evaluation in an electrical power distribution system |
| US7729808B2 (en) | 2006-03-10 | 2010-06-01 | Edsa Micro Corporation | System for comparing real-time data and modeling engine data to predict arc flash events |
| US7693608B2 (en) | 2006-04-12 | 2010-04-06 | Edsa Micro Corporation | Systems and methods for alarm filtering and management within a real-time data acquisition and monitoring environment |
| US20070265811A1 (en) | 2006-05-12 | 2007-11-15 | International Business Machines Corporation | Using stochastic models to diagnose and predict complex system problems |
| US7489990B2 (en) | 2006-07-17 | 2009-02-10 | Fehr Stephen L | Systems and methods for calculating and predicting near term production cost, incremental heat rate, capacity and emissions of electric generation power plants based on current operating and, optionally, atmospheric conditions |
| US20080262820A1 (en) | 2006-07-19 | 2008-10-23 | Edsa Micro Corporation | Real-time predictive systems for intelligent energy monitoring and management of electrical power networks |
| US20080046387A1 (en) | 2006-07-23 | 2008-02-21 | Rajeev Gopal | System and method for policy based control of local electrical energy generation and use |
| US20080040296A1 (en) | 2006-08-10 | 2008-02-14 | V2 Green Inc. | Electric Resource Power Meter in a Power Aggregation System for Distributed Electric Resources |
| US7310590B1 (en) | 2006-11-15 | 2007-12-18 | Computer Associates Think, Inc. | Time series anomaly detection using multiple statistical models |
| US20080238699A1 (en) | 2007-03-29 | 2008-10-02 | International Business Machines Corporation | Real time alarm classification and method of use |
| US20090076749A1 (en) | 2007-05-16 | 2009-03-19 | Edsa Micro Corporation | Electrical power system modeling, design, analysis, and reporting via a client-server application framework |
| US8229722B2 (en) | 2007-05-16 | 2012-07-24 | Power Analytics Corporation | Electrical power system modeling, design, analysis, and reporting via a client-server application framework |
| US20090326884A1 (en) | 2008-06-26 | 2009-12-31 | International Business Machines Corporation | Techniques to Predict Three-Dimensional Thermal Distributions in Real-Time |
| US20100049494A1 (en) | 2008-08-15 | 2010-02-25 | Edsa Corporation | Method for predicting power usage effectiveness and data center infrastructure efficiency within a real-time monitoring system |
| US8068938B2 (en) | 2009-05-15 | 2011-11-29 | General Electric Company | Method and system for managing a load demand on an electrical grid |
| US8321194B2 (en) | 2009-10-01 | 2012-11-27 | Power Analytics Corporation | Real time microgrid power analytics portal for mission critical power systems |
| US20120191439A1 (en) | 2011-01-25 | 2012-07-26 | Power Analytics Corporation | Systems and methods for automated model-based real-time simulation of a microgrid for market-based electric power system optimization |
| US20120265350A1 (en) | 2011-04-14 | 2012-10-18 | Ian Ashdown | Predictive daylight harvesting system |
| US20120323382A1 (en) | 2011-06-15 | 2012-12-20 | Expanergy, Llc | Systems and methods to assess and optimize energy usage for a facility |
Non-Patent Citations (96)
| Title |
|---|
| "A System View of the Modern Grid-Advanced Control Methods," Conducted by the National Energy Technology Laboratory for the U.S. Department of Energy, Mar. 2007. |
| "A System View of the Modern Grid—Advanced Control Methods," Conducted by the National Energy Technology Laboratory for the U.S. Department of Energy, Mar. 2007. |
| 3D modeling and visualization, Pinnacle Infotech Inc., Feb. 5, 2005, 1 page. |
| Albert Marroquin, Evaluating the Hazards of Low-Voltage Arcs, Electrical Products & Solutions, Jun. 2007, 4 pages. |
| Albert W.L. Yao et al., Development a PC-based automated monitoring and control platform for electric power systems, electric Power Systems Research 64, 2003, 8 pages. |
| Alex D. Papalexopoulos et al., An Implementation of a Neural Network Based Load Forecasting Model for the EMS, IEEE Transactions on Power Systems, vol. 9, No. 4, Nov. 1994, 7 pages. |
| Anjan Bose et al., Automated Operating Procedures for Transfer Limits, PSERC Publication 01-05, May 2001, 54 pages. |
| Arcad, Arc Flash Studies, IEEE 1584 Based Arc Flash Calculator. |
| Arc-Resistant Motor Control Equipment Increases Safety and Reduces PPE Requirements, Rockwell Automation, 4 pages. |
| Boris Bizjak et al., Increasing Power Quality in Systems with Limited Power Sources, 47th International Symposium ELMAR-2005, Jun. 8-10, 2005, Zadar, Croatia, 4 pages. |
| Bruce F. Wollenberg, A Brief Review of Electric Power Energy Management Systems, 13 pages. |
| Catcher13, ArcFlashForum.com, Jul. 2007, 1 page. |
| Christopher Inshaw et al., Arc Flash Hazard Analysis and Mitigation, Western Protective Relay Conference, Spokane, WA, Oct. 20, 2004, 20 pages. |
| D.P. Popovic et al., A Unified Application Software for Steady-State Security and Automatic Cross-Border Transmission Capacity Assessments, IEEE Xplore, 1 page. |
| Daniel Dvorak et al., Process monitoring and diagnosis: a model-based approach, IEEE Expert 6(3): 67-74, Jun. 1991, 24 pages. |
| Don O. Koval et al., Evaluation the Reliability Cost of Computer System Interruptions due to Power system Disturbances, IEEE Transactions on Industry Applications, vol. 25, No. 2, Mar./Apr. 1989, 9 pages. |
| Edoe Mensah et al., Models for Optimal Dynamic Reconfiguration and Simulation of Ship Power systems in Simulink with Stateflow, IEEE 2007, 6 pages. |
| EDSA Professional Power System Design and Simulation for CATIA V5, EDSA Micro Corporation, 8 pages. |
| Emerson Giovani Carati, et al., A Robust High Performance Three-Phase Uninterruptible Power Supply, Proceedings of the 2000 IEEE International Conference on Control Applications, Anchorage, Alaska, Sep. 24-27, 2000, 6 pages. |
| Engineering Specifications, Sensaphone 1400, 4 pages. |
| Entellisys Low-Voltage Switchgear, GE Consumer & Industrial Electrical Distribution, 2005, 17 pages. |
| ETAP, Benefits of ETAP Intelligent Load Shedding, Operation Technology, Inc., 3 pages. |
| ETAP, What is the comparison of NFPA 70E-2000 an IEEE 1584-2002 standards for Arc Flash Analysis?, ETAP FAQ #15, Jun. 11, 2003, 7 pages. |
| European Search Report, European Patent Application No. 07760596.2, Feb. 2, 2011, 6 pages. |
| European Search Report, European Patent Application No. 07812859.2, Jun. 7, 2010, 10 pages. |
| European Search Report, European Patent Application No. 07813158.8, Jun. 4, 2010, 11 pages. |
| European Search Report, European Patent Application No. 07868555.9, Mar. 25, 2011, 7 pages. |
| European Search Report, European Patent Application No. 08836989.7, Sep. 6, 2012, 7 pages. |
| Extended Search Report issued by the European Patent Office in related European Application No. 07799422.6 dated Oct. 19, 2010 (6 pages). |
| F. Shokooh, B. Wooton, J. Qiu, "Real-Time Simulation and Supervisory Control; The Next Logical Step After System Monitoring," PCIC-96-32 (1996). |
| F. Shokooh, J.J. Dai, S. Shokooh, J. Taster, H. Castro, T. Khandelwal, G. Donner, "An Intelligent Load Shedding {ILS} System Application in a Large Industrial Facility," Industry Applications Conference, Fortieth IAS Annual Meeting, vol. 1, Issue, Oct. 2-6, 2005, pp. 417-425. |
| Fidalgo, et al. "Load Forecasting Performance Enhancement When Facing Anomalous Events", Feb 2005, IEEE Trans on Power Systems, vol. 20, No. 1, pp. 408-415. |
| G. Giannuzzi et al., Advanced Load-Shedding Methodology and Architecture for Normal and Emergency Operation of the Italian Power System, IEEE 2005, 7 pages. |
| George Gross et al., Consortium for Reliability Technology solutions Grid of the Future White Paper on Real Time Security Monitoring and Control of Power Systems, Dec. 1999, 48 pages. |
| Google, Google Guide making searching even easier, 5 pages, . |
| Google, Google Guide making searching even easier, 5 pages, <http://www.googleguide.com/google—works.html>. |
| Google, Search results options and tools, 4 pages. |
| Integrated Topology Processing: a Breakthrough in Power System Software Unification, PowerWorld Corporation, 2 pages. |
| International Search Report and Written Opinion, PCT International Application No. PCT/US07/06195, completed Oct. 27, 2007, 9 pages. |
| International Search Report and Written Opinion, PCT International Application No. PCT/US07/62153, Completed Sep. 30, 2007, 11 pages. |
| International Search Report and Written Opinion, PCT International Application No. PCT/US07/66567, Completed Jan. 5, 2008, 12 pages. |
| International Search Report and Written Opinion, PCT International Application No. PCT/US07/72344, Completed May 30, 2008, 7 pages. |
| International Search Report and Written Opinion, PCT International Application No. PCT/US07/72539, Completed Jun. 1, 2008, 6 pages. |
| International Search Report and Written Opinion, PCT International Application No. PCT/US07/73083, Completed Jun. 11, 2008, 10 pages. |
| International Search Report and Written Opinion, PCT International Application No. PCT/US07/73375, Completed May 22, 2008, 7 pages. |
| International Search Report and Written Opinion, PCT International Application No. PCT/US07/73979, Completed May 22, 2008, 7 pages. |
| International Search Report and Written Opinion, PCT International Application No. PCT/US07/82361, Completed Jun. 2, 2008, 8 pages. |
| International Search Report and Written Opinion, PCT International Application No. PCT/US2008/062927, Completed Jun. 25, 2008, 11 pages. |
| International Search Report for PCT/US2008/63756 mailed Sep. 22, 2008. |
| International Search Report of PCT/US2008/77684. |
| International Search Report of PCT/US2008/79215. |
| International Search Report, PCT International Application No. PCT/IB2008/003921, Completed Nov. 18, 2009, 2 pages. |
| International Search Report, PCT International Application No. PCT/US07/72972, Completed Sep. 17, 2008, 8 pages. |
| International Search Report, PCT International Application No. PCT/US2008/079601, Completed Dec. 2, 2008, 1 page. |
| J. Eto et al., Grid Reliability Management Tools, IEEE Power Engineering Society Winter Meeting, Jan. 28-31, 2001, 5 pages. |
| Jason Stamp et al., Reference Model for Control and Automation Systems in Electrical Power, Oct. 12, 2004, 17 pages. |
| Jin-Woo Jung et al., Modeling and Control of Fuel Based Distributed Generation Systems in a Standalone AC Power Supply, Journal of Iranian Association of Electrical and Electronics Engineers, vol. 2, No. 1, 2005, 14 pages. |
| John Van Gorp, Using Key Performance Indicators to Manage Power System Reliability, Schneider Electric 2006, 8 pages. |
| Julio Cesar Stacchini De Souza et al., Alarm processing in Electrical Power Systems Through a Neuro-Fuzzy Approach, IEEE Transactions on Power Delivery, vol. 19, No. 2, Apr. 2004, 8 pages. |
| Khalid Mohamed nor et al., Digital Dimulation of Uninterruptible Power supply (UPS) and Dynamic Voltage Restorer (DVR) for Voltage SAG Mitigation, 6 pages. |
| Leon M. Tolbert et al., Survey of Harmonics Measurements in Electrical Distribution Sytems, IEEE IAS Annual meeting, Oct. 6-10, 1996, San Diego, CA, 7 pages. |
| M. Akhrarov, P. Millett, "A Novel Approach to Predictive Condition Monitoring and Knowledge Management in Power Systems," POWID Symposium, Jun. 2007. |
| M. Roitman et al., Real time Digital Simulation: Trends on Technology and T&D Applications, 2004 Power systems Conference & Exposition, 22 pages. |
| M. Tarafdar Haque et al., Application of Neural Networks in Power Systems; A Review, World Academy of Science, Engineering and Technology 6 2005, 5 pages. |
| Manoj Embrandiri et al., Real-Time Monitoring & Analysis of Harmonics in Single-Phase Systems, Nationallnstruments, 6 pages. |
| Martin Geidl, Protection of Power Systems with Distributed Generation: State of the Art, Swiss Federal Institute of Technology (ETH) Zurich, Jul. 20, 2005, 35 pages. |
| Mladen Kezunovic, Monitoring of Power System Topology in Real-Time, IEEE 2005, 10 pages. |
| Notice of Allowance for U.S. Appl. No. 11/734,706 dated Jul. 19, 2010 (37 pages). |
| Notice of Allowance for U.S. Appl. No. 11/771,681 dated Mar. 12, 2010 (94 pages). |
| Notice of Allowance for U.S. Appl. No. 11/775,146 dated Jul. 22, 2010 (23 pages). |
| Notice of Allowance for U.S. Appl. No. 11/780,764 dated Jan. 13, 2010 (86 pages). |
| Operational Technology, Inc., ETAP product materials, http://www.etap.com. |
| Optimal Technologies, Operations Review of Jun. 14, 2000 PG&E Bay Area Systems Events Using AempfastSoftware, Oct. 3, 2001, 32 pages. |
| P.K. Dash et al., A new approach to monitoring electric power quality, 10 pages. |
| PowerWorld Simulator-Available Transfer Capability (ATC), PowerWorld Corporation, 2 pages. |
| PowerWorld Simulator—Available Transfer Capability (ATC), PowerWorld Corporation, 2 pages. |
| R. Parikh et al., Modeling, Simulation and Analysis of an Uninterruptible Power Supply, IEEE 1994, 6 pages. |
| Ray Klump et al., An Advanced Visualization Platform for Real-Time Power System Operations, 8 pages. |
| Ray Klump et al., Visualizing Real-Time Security Threats Using Hybrid SCADA / PMU Measurement Displays, 38th Hawaii International Conference on System Sciences, 2005, IEEE, 9 pages. |
| Raymond D. Valentine, A Perspective of Low-Voltage Circuit Breaker Interrupting Rating, IEEE, 1998, 5 pages. |
| Rene Avila-Rosales et al., Wide-Area Monitoring and Control for Power System Grid Security, 15th PSCC, Liege, Aug. 22-26, 2005, 7 pages. |
| S. Tnani et al., Comparison between difference real-time harmonic analysis methods for control of electrical machines, IEEE Xplore, 1 page. |
| S.J. Ranade et al., An Overview of Harmonics Modeling and Simulation, 7 pages. |
| T.W. Cease et al., Real-Time Monitoring of the TVA Power System, 8310 IEEE Computer Applications in Power 7 Jul. 1994, No. 3, New York, US, 6 pages. |
| Tarek Abdallah et al., Control Dynamics of Adaptive and Scalable Power and Energy Systems for Military MicroGrids, US Army Corps of Engineers, Dec. 2006, 55 pages. |
| Thomas J. Laffey et al., Real-Time Knowledge-Based Systems, AI Magazine, vol. 9, No. 1, 1988, 19 pages. |
| Walter C. Huening, Jr., Calculating Short-Circuit Currents with Contributions from Induction Motors, IEEE Transactions on Industry Applications, vol. 1A-18, No. 2, Mar./Apr. 1982, 8 pages. |
| Wearing Arc Flash Clothing Can Save Your Life, Office of Health Safety and Security, Operating Experience Summary, Issue No. 2006-14, Article 1, Dec. 8, 2006, 3 pages. |
| Weidong Zhu et al., A Model-in-the-Loop Interface to Emulate Source Dynamics in a Zonal DC Distribution System, IEEE Transactions on Power Electronics, vol. 20, No. 2, Mar. 2005, 8 pages. |
| Wei-Jen Lee et al., Development of a Real Time Power System Dynamic Performance Monitoring System, IEEE 1996, 6 pages. |
| Wenxiao Ma et al., Real Time Power Distribution Network Simulation with RT-LAB, Planet-RT, 3 pages. |
| Wenxiao Ma et al., Real Time Power Distribution Network Simulation with RT-LAB, Planet—RT, 3 pages. |
| Western Power Selects Transpara's Visual KPI for Enterprise-Wide Deployment, Transpara, Nov. 27, 2007, 2 pages. |
| WM Bruce Bowman, Welcome to Electrical Safety Presentation, Alliance, 60 pages. |
| Yoshio Ebata et al., Development of the Intranet0Based SCADA (Supervisory Control and Data Acquisition System) for Power System, IEEE 2000, 6 pages. |
| Zoran Mihailovic et al., Modeling and Control Design of VSI-Fed PMSM Drive Systems with Active Load, 1 page. |
Cited By (31)
| Publication number | Priority date | Publication date | Assignee | Title |
|---|---|---|---|---|
| US10867087B2 (en) | 2006-02-14 | 2020-12-15 | Wavetech Global, Inc. | Systems and methods for real-time DC microgrid power analytics for mission-critical power systems |
| US20210397768A1 (en)* | 2006-02-14 | 2021-12-23 | Power Analytics Corporation | Method For Predicting Arc Flash Energy And PPE Category Within A Real-Time Monitoring System |
| US11113434B2 (en)* | 2006-02-14 | 2021-09-07 | Power Analytics Corporation | Method for predicting arc flash energy and PPE category within a real-time monitoring system |
| US11016450B2 (en)* | 2006-02-14 | 2021-05-25 | Power Analytics Corporation | Real-time predictive systems for intelligent energy monitoring and management of electrical power networks |
| US10962999B2 (en) | 2009-10-01 | 2021-03-30 | Wavetech Global Inc. | Microgrid model based automated real time simulation for market based electric power system optimization |
| US9705329B2 (en) | 2012-06-29 | 2017-07-11 | Operation Technology, Inc. | Proactive intelligent load shedding |
| US9864820B2 (en) | 2012-10-03 | 2018-01-09 | Operation Technology, Inc. | Generator dynamic model parameter estimation and tuning using online data and subspace state space model |
| US9875324B2 (en) | 2013-08-16 | 2018-01-23 | Operation Technology, Inc. | Traction power simulation |
| US10846628B1 (en) | 2013-08-27 | 2020-11-24 | Curb, Inc. | System for promoting efficient use of resources |
| US10318895B1 (en) | 2013-08-27 | 2019-06-11 | Curb, Inc. | System for promoting efficient use of resources |
| US10187707B2 (en) | 2014-11-17 | 2019-01-22 | Curb, Inc. | Home intelligence system |
| US9652723B2 (en) | 2015-06-05 | 2017-05-16 | Sas Institute Inc. | Electrical transformer failure prediction |
| US9848280B2 (en) | 2015-09-03 | 2017-12-19 | Civionics, Inc. | Wireless sensor module |
| US10136280B2 (en) | 2016-08-29 | 2018-11-20 | International Business Machines Corporation | Parallel user interaction with physical and modeled system |
| US11016475B2 (en) | 2017-03-22 | 2021-05-25 | Microsoft Technology Licensing, Llc | Automated electrical system commissioning |
| US10871754B2 (en) | 2017-06-22 | 2020-12-22 | Microsoft Technology Licensing, Llc | Automated time-synchronized electrical system commissioning |
| US10389172B2 (en) | 2017-06-22 | 2019-08-20 | Microsoft Technology Licensing, Llc | Externally exposing connections to internal electrical components inside electrical system equipment |
| US10996210B2 (en) | 2018-01-02 | 2021-05-04 | Transportation Ip Holdings, Llc | Vehicle system with sensor probe assembly for monitoring oil health |
| CN108564254A (en)* | 2018-03-15 | 2018-09-21 | 国网四川省电力公司绵阳供电公司 | Controller switching equipment status visualization platform based on big data |
| CN108564254B (en)* | 2018-03-15 | 2021-04-09 | 国网四川省电力公司绵阳供电公司 | Big data-based power distribution equipment status visualization platform |
| US10685155B2 (en)* | 2018-06-06 | 2020-06-16 | Prescient Devices, Inc. | Method and system for designing a distributed heterogeneous computing and control system |
| US11003850B2 (en) | 2018-06-06 | 2021-05-11 | Prescient Devices, Inc. | Method and system for designing distributed dashboards |
| US11809821B2 (en) | 2018-06-06 | 2023-11-07 | Prescient Devices, Inc. | Method and system for designing distributed dashboards |
| US11112778B2 (en)* | 2018-09-10 | 2021-09-07 | Aveva Software, Llc | Cloud and digital operations system and method |
| US11835939B2 (en) | 2018-09-10 | 2023-12-05 | Aveva Software, Llc | Cloud and digital operations system and method |
| US11042132B2 (en)* | 2019-06-07 | 2021-06-22 | Battelle Memorial Institute | Transformative remedial action scheme tool (TRAST) |
| US11870259B2 (en) | 2019-06-28 | 2024-01-09 | Taner-Jay CAIRNS | Electrical load balancing device |
| TWI781453B (en)* | 2020-09-30 | 2022-10-21 | 財團法人資訊工業策進會 | Energy dispatch system, apparatus, and method |
| US11641111B2 (en) | 2020-09-30 | 2023-05-02 | Institute For Information Industry | Energy dispatch system, apparatus, and method |
| US12227202B2 (en) | 2021-06-10 | 2025-02-18 | Honda Motor Co., Ltd. | Adaptive trust calibration |
| US12359589B2 (en) | 2023-10-06 | 2025-07-15 | Doosan Enerbility Co., Ltd. | Apparatus using root cause analysis for predicting blade damage and method therefor |
Also Published As
| Publication number | Publication date |
|---|---|
| US20170192398A1 (en) | 2017-07-06 |
| US20150057821A1 (en) | 2015-02-26 |
| US9557723B2 (en) | 2017-01-31 |
| US20080262820A1 (en) | 2008-10-23 |
Similar Documents
| Publication | Publication Date | Title |
|---|---|---|
| US11016450B2 (en) | Real-time predictive systems for intelligent energy monitoring and management of electrical power networks | |
| US9031824B2 (en) | Real-time predictive systems for intelligent energy monitoring and management of electrical power networks | |
| US8131401B2 (en) | Real-time stability indexing for intelligent energy monitoring and management of electrical power network system | |
| US9846752B2 (en) | System and methods for intuitive modeling of complex networks in a digital environment | |
| US8775934B2 (en) | Systems and methods for creation of a schematic user interface for monitoring and predicting the real-time health, reliability and performance of an electrical power system | |
| US8155943B2 (en) | Systems and methods for automatically converting CAD drawing files into intelligent objects with database connectivity for the design, analysis, and simulation of electrical power systems | |
| US8229722B2 (en) | Electrical power system modeling, design, analysis, and reporting via a client-server application framework | |
| US8170856B2 (en) | Systems and methods for real-time advanced visualization for predicting the health, reliability and performance of an electrical power system | |
| US20180373824A1 (en) | Systems and Methods for Automated Model-Based Real-Time Simulation of a Microgrid for Market-Based Electric Power System Optimization | |
| US9092593B2 (en) | Systems and methods for intuitive modeling of complex networks in a digital environment | |
| US8577661B2 (en) | Systems and methods for alarm filtering and management within a real-time data acquisition and monitoring environment | |
| AU2008284225B2 (en) | Real-time predictive systems for intelligent energy monitoring and management of electrical power networks | |
| CA2882796A1 (en) | Real-time predictive systems for intelligent energy monitoring and management of electrical power networks | |
| AU2008304566A1 (en) | Real-time stability indexing for intelligent energy monitoring and management of electrical power network system | |
| EP2201489A1 (en) | Electrical power system modeling, design, analysis, and reporting via a client-server application framework | |
| AU2008310901B2 (en) | Converting CAD drawing files into intelligent objects for the design, analysis of electrical power systems | |
| AU2008251610B2 (en) | Systems and methods for creation of a schematic user interface for monitoring and predicting the real- time health, reliability and performace of an electrical power system |
Legal Events
| Date | Code | Title | Description |
|---|---|---|---|
| AS | Assignment | Owner name:EDSA MICRO CORPORATION, CALIFORNIA Free format text:ASSIGNMENT OF ASSIGNORS INTEREST;ASSIGNOR:NASLE, ADIB;REEL/FRAME:034950/0298 Effective date:20080617 Owner name:POWER ANALYTICS CORPORATION, NORTH CAROLINA Free format text:ASSIGNMENT OF ASSIGNORS INTEREST;ASSIGNOR:EDSA MICRO CORPORATION;REEL/FRAME:034950/0418 Effective date:20110218 | |
| STCF | Information on status: patent grant | Free format text:PATENTED CASE | |
| AS | Assignment | Owner name:PACIFIC WESTERN BANK, NORTH CAROLINA Free format text:SECURITY INTEREST;ASSIGNOR:POWER ANALYTICS CORPORATION;REEL/FRAME:039820/0257 Effective date:20160727 | |
| AS | Assignment | Owner name:POWER ANALYTICS CORPORATION, NORTH CAROLINA Free format text:RELEASE BY SECURED PARTY;ASSIGNOR:PACIFIC WESTERN BANK;REEL/FRAME:043133/0976 Effective date:20170725 | |
| MAFP | Maintenance fee payment | Free format text:PAYMENT OF MAINTENANCE FEE, 4TH YR, SMALL ENTITY (ORIGINAL EVENT CODE: M2551); ENTITY STATUS OF PATENT OWNER: SMALL ENTITY Year of fee payment:4 | |
| FEPP | Fee payment procedure | Free format text:MAINTENANCE FEE REMINDER MAILED (ORIGINAL EVENT CODE: REM.); ENTITY STATUS OF PATENT OWNER: SMALL ENTITY | |
| LAPS | Lapse for failure to pay maintenance fees | Free format text:PATENT EXPIRED FOR FAILURE TO PAY MAINTENANCE FEES (ORIGINAL EVENT CODE: EXP.); ENTITY STATUS OF PATENT OWNER: SMALL ENTITY | |
| STCH | Information on status: patent discontinuation | Free format text:PATENT EXPIRED DUE TO NONPAYMENT OF MAINTENANCE FEES UNDER 37 CFR 1.362 | |
| FP | Lapsed due to failure to pay maintenance fee | Effective date:20230512 |