US8904389B2 - Determining performance states of components in a virtual machine environment based on performance states of related subcomponents - Google Patents
Determining performance states of components in a virtual machine environment based on performance states of related subcomponentsDownload PDFInfo
- Publication number
- US8904389B2 US8904389B2US13/874,423US201313874423AUS8904389B2US 8904389 B2US8904389 B2US 8904389B2US 201313874423 AUS201313874423 AUS 201313874423AUS 8904389 B2US8904389 B2US 8904389B2
- Authority
- US
- United States
- Prior art keywords
- component
- subcomponent
- state
- subcomponents
- performance
- Prior art date
- Legal status (The legal status is an assumption and is not a legal conclusion. Google has not performed a legal analysis and makes no representation as to the accuracy of the status listed.)
- Active
Links
Images


Classifications
- G—PHYSICS
- G06—COMPUTING OR CALCULATING; COUNTING
- G06F—ELECTRIC DIGITAL DATA PROCESSING
- G06F9/00—Arrangements for program control, e.g. control units
- G06F9/06—Arrangements for program control, e.g. control units using stored programs, i.e. using an internal store of processing equipment to receive or retain programs
- G06F9/44—Arrangements for executing specific programs
- G06F9/455—Emulation; Interpretation; Software simulation, e.g. virtualisation or emulation of application or operating system execution engines
- G06F9/45533—Hypervisors; Virtual machine monitors
- G—PHYSICS
- G06—COMPUTING OR CALCULATING; COUNTING
- G06F—ELECTRIC DIGITAL DATA PROCESSING
- G06F11/00—Error detection; Error correction; Monitoring
- G06F11/30—Monitoring
- G06F11/32—Monitoring with visual or acoustical indication of the functioning of the machine
- G06F11/323—Visualisation of programs or trace data
- G—PHYSICS
- G06—COMPUTING OR CALCULATING; COUNTING
- G06F—ELECTRIC DIGITAL DATA PROCESSING
- G06F11/00—Error detection; Error correction; Monitoring
- G06F11/30—Monitoring
- G06F11/32—Monitoring with visual or acoustical indication of the functioning of the machine
- G06F11/324—Display of status information
- G06F11/328—Computer systems status display
- G—PHYSICS
- G06—COMPUTING OR CALCULATING; COUNTING
- G06F—ELECTRIC DIGITAL DATA PROCESSING
- G06F11/00—Error detection; Error correction; Monitoring
- G06F11/30—Monitoring
- G06F11/34—Recording or statistical evaluation of computer activity, e.g. of down time, of input/output operation ; Recording or statistical evaluation of user activity, e.g. usability assessment
- G06F11/3409—Recording or statistical evaluation of computer activity, e.g. of down time, of input/output operation ; Recording or statistical evaluation of user activity, e.g. usability assessment for performance assessment
- G—PHYSICS
- G06—COMPUTING OR CALCULATING; COUNTING
- G06F—ELECTRIC DIGITAL DATA PROCESSING
- G06F9/00—Arrangements for program control, e.g. control units
- G06F9/06—Arrangements for program control, e.g. control units using stored programs, i.e. using an internal store of processing equipment to receive or retain programs
- G06F9/44—Arrangements for executing specific programs
- G06F9/455—Emulation; Interpretation; Software simulation, e.g. virtualisation or emulation of application or operating system execution engines
- G06F9/45533—Hypervisors; Virtual machine monitors
- G06F9/45558—Hypervisor-specific management and integration aspects
- G06F2009/45591—Monitoring or debugging support
- G—PHYSICS
- G06—COMPUTING OR CALCULATING; COUNTING
- G06F—ELECTRIC DIGITAL DATA PROCESSING
- G06F2201/00—Indexing scheme relating to error detection, to error correction, and to monitoring
- G06F2201/815—Virtual
Definitions
- the present disclosurerelates generally to computer-implemented systems and methods for automatically characterizing a performance of a hypervisor system.
- a hypervisor systemcan coordinate operations of a set of virtual machines (VM) and/or hosts. Characterizing the overall operation of the system and/or operation of various system components can be complicated by the coordinated operation of the system components and the potential architecture flexibility of the system.
- VMvirtual machines
- an architecture of a hypervisor structureis represented to a reviewer, along with indications characterizing how well individual components of the system are performing.
- the architecture(which may be defined by an architecture provider and flexible in its structure) is represented as a tree with individual nodes corresponding to system components.
- a performance numberis calculated based on task completions and/or resource utilization of the VM, and a performance state is assigned to the component based on the number and state criteria.
- a performance stateis assigned to the higher-level components using different state criteria and the respective performance number.
- a revieweris presented with a performance indicator (which can include a performance statistic or state) of one or more high-level components. At this point, lower level architecture and/or corresponding performance indicators are hidden from the reviewer. The reviewer can then select a component and “drill down” into performance metrics of underlying components. That is, upon detecting a reviewer's selection of a component, low-level architecture beneath the selected component is presented along with corresponding performance indicators.
- a performance indicatorwhich can include a performance statistic or state
- Techniques disclosed hereinprovide for the capability to characterize an operation of a hypervisor system at a variety of levels. By presenting the performance in a top-down manner, a reviewer can identify a level at which a system is experiencing problems and how an architecture may be modified to alleviate the problems. Further, by classifying different types of performance metrics (for various levels in the hierarchy) into one of a same set of states, a reviewer can easily understand how each portion of the system is performing.
- FIG. 1shows a block diagram of an embodiment of a virtual-machine interaction system
- FIG. 2shows a block diagram of an embodiment of task assigner
- FIG. 3shows a block diagram of an embodiment of a VM monitoring system
- FIG. 4illustrates an example of a representation of an architecture for a Hypervisor
- FIGS. 5A-5Billustrate an example of sequential presentations conveying an architecture and system performance that can be presented to a reviewer
- FIGS. 6A-6Cillustrate example detailed information that can be presented to characterize performance of a hypervisor system, a host and a VM, respectively;
- FIGS. 7A-7Cfurther illustrate example detailed information that can be presented to characterize performance of a hypervisor system, a host and a VM, respectively;
- FIG. 8illustrates a flowchart of an embodiment of a process for using a VM machine to complete user tasks
- FIG. 9illustrates a flowchart of an embodiment of a process for characterizing VM-system components' performance
- FIG. 10illustrates a flowchart of an embodiment of a process for assigning a performance state to a tow-level component in a Hypervisor
- FIG. 11illustrates a flowchart of an embodiment of a process for assigning a performance state to a high-level component in a Hypervisor
- FIG. 12illustrates a flowchart of an embodiment of a process for using a VM machine to complete user tasks
- FIG. 13illustrates a flowchart of an embodiment of a process for analyzing performance of a Hypervisor using historical data.
- FIG. 1a block diagram of an embodiment of a virtual-machine interaction system 100 is shown.
- An architecture provider 105 , user 115 and/or performance reviewer 125can interact with a task scheduler 140 and/or virtual-machine (VM) monitoring system 155 via respective devices 110 , 120 and/or 130 and a network 140 , such as the Internet, a wide area network (WAN), local area network (LAN) or other backbone.
- nexus publishing system 150is made available to one or more of architecture provider 105 , user 115 and/or performance reviewer 125 via an app (that can be downloaded to and executed on a portable electronic device) or a website.
- system 100can include multiple architecture providers 105 , users 115 and/or performance reviewers 125 .
- Architecture-provider device 110 , user device 120 and/or reviewer device 130can each he a single electronic device, such as a hand-held electronic device (e.g., a smartphone). It will be understood that architecture-provider device 110 , user device 120 and/or reviewer device 130 can also include a system that includes multiple devices and/or components.
- the device(s) 110 , 120 and/or 130can comprise a computer, such as the desktop computer, a laptop computer or a tablet.
- a party 105 , 115 and/or 125uses different devices at different times to interact with task scheduler 140 and/or VM monitoring system 155 .
- An architecture provider 105can communicate with VM monitoring system 155 to provide input defining at least part of an architecture that sets forth a structure of a Hypervisor.
- the inputcan include identification of components of the Hypervisor, such as VMs, hosts or host clusters.
- the inputcan also include identification of relationships between system components, which can include parent-child relationships. For example, a host can be identified as being a parent of five specific VMs. In some instances, identifying the relationships includes defining a hierarchy.
- Architecture provider 105can identify characteristics of particular hypervisor components, such as a CPU count, CPU type, memory size, operating system, name, an address, an identifier, a physical location and/or available software. The architecture can also identify restrictions and/or rules applicable to VM-system components. For example, select resources may be reserved such that they can only be assigned high-priority tasks or tasks from particular users. As another example, architecture provider 105 can identify that particular resources are only to be assigned tasks of a particular type or that all tasks of a particular type are to be assigned to a particular resource.
- the inputcan include text entered into a field, an uploaded file, arrangement and/or selection of visual icons, etc.
- Defining the architecturecan include defining a new structure or modifying an existing structure.
- a task scheduler 140can utilize a set of hosts 145 and/or VMs 150 to complete computational tasks.
- task scheduler 140assigns tasks to a host 145 and/or VM 150 (e.g., the host providing computing resources that support the VM operation and the VM being an independent instance of an OA and software).
- the VMcan then, e.g., store data, perform processing and/or generate data.
- Task scheduler 140can monitor loads on various system components and adjust assignments accordingly. Further, the assignments can be identified to be in accordance with applicable rules and/or restrictions.
- a VM monitoring system 155can monitor applicable architecture, task assignments, task-performance characteristics and resource states. For example, VM monitoring system 155 can monitor: task completion time, a percentage of assigned tasks that were completed, a resource power state, a CPU usage, a memory usage and/or network usage. VM monitoring system 155 can use the monitored performance metrics to determine performance indicators (as described further below) to present to a reviewer 125 . Reviewer 125 can interact with an interface provided by VM monitoring system 155 to control which performance indicators are presented. For example, reviewer 125 can specify a type of performance indicator (e.g., by defining a set of performance states) or can specify specific components, component types or levels for which the indicators are presented
- Task assigner 140can be, in part or in its entirety, in a cloud.
- Task assigner 140includes a user account engine 205 that authenticates a user 115 attempting to access a Hypervisor.
- User account engine 205can collect information about user 115 and store the information in an account in a user-account database 210 .
- the accountcan identify, e.g., a user's name, position, employer, subscription level, phone number, email, access level to the Hypervisor and/or login information (e.g., a username and password).
- Informationcan be automatically detected, provided by user 115 , provided by an architecture provider 105 (e.g., to specify which users can have access to a system defined by a provided architecture) and/or provided by a reviewer 125 (e.g., who may be identifying employees within a company or organization who are to be allowed to access the Hypervisor).
- an architecture provider 105e.g., to specify which users can have access to a system defined by a provided architecture
- a reviewer 125e.g., who may be identifying employees within a company or organization who are to be allowed to access the Hypervisor.
- user account engine 205determines whether a user 105 is authorized to access the system by requesting login information (e.g., a username and password) from user 115 and attempting to match entered login information to that of an account stored in user-account database 210 . In some instances, user account engine 205 determines whether user 115 is authorized by comparing automatically detected properties (e.g., an IP address and/or a characteristic of user device 120 ) to comparable properties stored in an account. User account engine 205 can further, in some instances, determine which Hypervisors and/or which hypervisor components user 115 is authorized to use e.g., based on a user-provided code or stored information identifying access permissions).
- login informatione.g., a username and password
- user account engine 205determines whether user 115 is authorized by comparing automatically detected properties (e.g., an IP address and/or a characteristic of user device 120 ) to comparable properties stored in an account.
- User account engine 205can further, in some instances, determine which
- Authorized userscan then be granted access to a task intake 215 , which receives a task definition from user 115 .
- User 115can define a task by, e.g., uploading a program code, entering a program code, defining task properties (e.g., a processing to he done, a location of data to be processed, and/or a destination for processed data), or defining task restrictions or preferences (e.g., requirements of resources to be used or task-completion deadlines).
- defining a taskincludes uploading data to be processed.
- a taskis defined by executing a code provided by user 115 and defining portions of the codes (e.g., during specific iterations) as distinct tasks.
- Task intake 215can verify that the task definition is acceptable (e.g., being of an appropriate format, having restrictions that can be met and being estimated to occupy an acceptable amount of resources). This verification can include fixed assessments and/or assessments that are specific to user 115 or a user group.
- task intake 215Upon determining that the task definition is acceptable, task intake 215 generates a queue entry.
- the queue entrycan include an identifier of the task, a characteristic of the task (e.g., required resource capabilities, estimated processing time, and/or estimated memory use), an identification of user 115 , a characteristic of user 115 (e.g., an employer, a position, a level-of-service, or resources which can be used) and/or when the task was received.
- the queue entryincludes the task definition, while in other instances, the queue entry references a location (e.g., of and/or in another database) of the task definition.
- a prioritizer 225can prioritize the task based on, e.g., a characteristic of the task, a characteristic of user 115 and/or when the task was received (e.g., where either new or old tasks are prioritized, depending on the embodiment).
- Prioritizer 225can also or alternatively prioritize the task based on global, company-specific or user-specific usage of part or all of Hypervisor. For example, if many queue items require that a processing VM be running Operating System (OS) # 1 (and/or if few resources run the OS), prioritizer 225 may prioritize queue items permissive of or requiring a different OS being run. Similarly, prioritizations can depend on a current load on part or all of a Hypervisor.
- OSOperating System
- a load monitor 230can communicate with prioritizer 225 to identify a load (e.g., a processing and/or memory load) on specific resources and/or specific types of resources.
- a loade.g., a processing and/or memory load
- Prioritizing a taskcan include assigning a score (e.g., a numeric or categorical score) to the task, which may include identifying some tasks which are “high” priority. Prioritizing a task can include ranking the task relative to tasks.
- the prioritization of a taskcan be performed once or it can be repeatedly performed (e.g., at regular intervals or upon having received a specific number of new tasks). The prioritization can be performed before, while or after a queue item identifying the task is added to the queue. The queue item can then be generated or modified to reflect the prioritization.
- An assigner 235can select a queue entry (defining a task) from queue 220 and assign it to one or more resources (e.g., a host cluster, a host and/or a VM). The selection can be based on a prioritization of queue entries in queue 220 (e.g., such that a highest priority task is selected). The selection can also or alternatively depend on real-time system loads. For example, load monitor 230 can identify to assigner 235 that a particular VM recently completed a task or had low CPU usage. Assigner 235 can then select a queue entry identifying a task that can be performed by the particular VM. The assignment can include a pseudo-random element, depend on task requirements or preferences and/or depend on loads of various system components.
- assigner 235can determine that five VMs have a CPU usage below a threshold, can determine that three of the five have capabilities aligned with a given task, and can then assign the task to one of the three VMs based on a pseudo-random selection between the three. The assignment can further and/or alternatively reflect which Hypervisors and/or system components a user from whom a task originated is allowed to access. Assigner 235 can update queue 220 to reflect the fact that a task is/was assigned an to identify the assigned resource(s).
- a task monitor 240can then monitor performance of the tasks and operation states (e.g., processing usage, CPU usage, etc.) of assigned resources.
- Task monitor 240can update queue 220 reflect performance and/or resource-operation states. In some instances, if a performance state and/or resource-operation state is unsatisfactory (e.g., is not sufficiently progressing), assigner 235 can reassign the task.
- VM monitoring system 155can be, in part or in its entirety, in a cloud.
- VM monitoring system 155includes a reviewer account engine 305 , which authenticates a reviewer attempting to access information characterizing performance of a Hypervisor.
- Reviewer account engine 305can operate similarly to user account engine 205 .
- reviewer account engine 305can generate reviewer accounts stored in a reviewer-account database 310 where the account includes information such as the reviewer's name, employer, level-of-service, which Hypervisors/components can be reviewed, a level of permissible detail for reviews, and/or login information.
- Reviewer account engine 305can then determine whether detected or reviewer-entered information (e.g., login information) matches corresponding information in an account.
- VM monitoring system 155also includes an activity monitor 315 , which monitors activity of hypervisor components.
- the activitycan include, for example, when tasks were assigned, whether tasks were completed, when tasks were completed, what tasks were assigned (e.g., required processing), users that requested the task performance, whether the task was a new task or transferred from another component (in which case a source component and/or transfer time can be included in the activity), CPU usage, memory usage, characteristics of any memory swapping or ballooning (e.g., whether it occurred, when it occurred, an amount of memory, and the other component(s) involved), and/or any errors.
- the activitycan include, for example, when tasks were assigned, whether tasks were completed, when tasks were completed, what tasks were assigned (e.g., required processing), users that requested the task performance, whether the task was a new task or transferred from another component (in which case a source component and/or transfer time can be included in the activity), CPU usage, memory usage, characteristics of any memory swapping or ballooning (e.g., whether it occurred,
- Activity monitor 315can store the monitored activity (e.g., as or in an activity record) in an activity database 320 .
- one, more or each VM componentis associated with a record.
- Performance metrics of the componente.g., CPU usage and/or memory usage
- the recordcan then include an entry with a time stamp and performance metrics.
- Task assignmentsincluding, e.g., a time of assignment, a source user, whether the task was transferred from another component, a type of task, requirements of the task, whether the task was completed, and/or a time of completion
- Task assignmentscan also be added to the record.
- performance metricsare detected (and a corresponding record entry is generated and stored) upon detecting a task action (e.g., assignment, transfer, or completion) pertaining to the VM component.
- activity database 320can maintain an indexed or organized set of metrics characterizing historical and/or current performance of hypervisor components.
- An aggregator 325can collect performance metrics from select activity records.
- the performance metricscan include, e.g., CPU usage, memory usage, tasks assignments and/or task completions.
- the performance metricscan also include that from entries with time stamps within a particular time period. In some instances, performance metrics are collected from one or more entries having a most recent time stamp (e.g., a most recent entry or all entries within a most-recent 24-hour period).
- the activity recordscan be selected based on an architecture stored in an architecture database 330 , the architecture defining a structure (e.g., components and component relationships) of a Hypervisor.
- Architecturescan also specify which specific users or types of users can use some or all of the Hypervisor and/or which specific reviewer or types of reviewers can access (some or all available) performance indicators.
- the architecturecan be one provided by an architecture provider 105 .
- architecture provider 105can interact with an architecture manager 335 to define resources in a Hypervisor and relationships between the system. These definitions can be provided, e.g., by entering text, manipulating graphics or uploading a file.
- VM monitoring system 155can further include an architecture-provider account engine and architecture-provider account database that can be used to authenticate an architecture provider.
- Architecture-provider accountscan include information similar to that in user accounts and/or reviewer accounts, and the architecture-provider account engine can authenticate an architecture provider in a manner similar to a user or reviewer authentication technique as described herein.
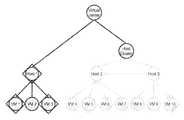
- FIG. 4illustrates an example of a representation of an architecture for a Hypervisor.
- the depicted architectureis hierarchical and includes a plurality of nodes arranged in a plurality of levels. Each node corresponds to a component in the Hypervisor.
- the hierarchydefines a plurality of familial relationships.
- VM 6is a child of Host 2 and a grandchild of the Host Cluster.
- the top levelis the virtual center where tasks are assigned.
- the second levelis a host-cluster level, which indicates which underlying hosts have task-transferring arrangements with each other (the same-level interaction being represented by the dashed line).
- the third levelis a host level that provides computing resources that support VM operation.
- the fourth levelis a VM level.
- an assignment to VM 7would also entail an assignment to Host 2 and to the Host Cluster; an assignment to VM 3 would also entail an assignment to Host 1
- aggregator 325can aggregate performance metrics from records pertaining to a particular component in the architecture.
- performance indicatorsdetermined based on performance metrics
- VM monitoring system 155can, in some instances, also sequentially determine performance indicators (determining lower level indicators following a presentation of higher level indicators and/or to reviewer selection of a component).
- VM monitoring system 155can first determine performance indicators for higher-level components and subsequently for each of a subset or all of lower-level components.
- aggregator 325can first aggregate performance metrics in activity records for each of one or more higher-level components and later aggregate performance metrics in activity records for each of one or more lower-level components. It will be appreciated that other sequences can be utilized (e.g., repeatedly cycling through components in a sequence).
- a statistics generator 340can access the collection of performance metrics and generate one performance statistics based on the metrics.
- the statisticcan pertain to any of the various types of performance metrics, such as a CPU usage, a memory usage, assigned tasks, a task-completion duration, etc.
- the statisticcan include, e.g., an average, a median, a mode, a variance, a distribution characteristic e.g., skew), a probability (which may be a percentage), a conditional probability (e.g., conditioned on recent assignment of a task), a skew, and/or an outlier presence.
- the statisticcan include one or more numbers (e.g., an error and a standard deviation). In some instances, the statistics includes a series of numbers, such as histogram values.
- Statistics generator 340can store the statistic (in association with an identifier of a respective component and time period) in a statistics database 345 .
- Statistics generator 340can identify which component and/or time period are to be associated with the statistic based on what aggregation was performed.
- a state engine 350can access one or more state criteria from state-criteria database 355 and use the state criteria and the generated statistic to assign a state (e.g., to a component and/or time period). The state can then be stored (e.g., in association with a respective component and/or time period) in a state database 360 . State engine 350 can identify which component and/or time period are to be associated with the state based on what aggregation was performed.
- the state criteriacan include one or more thresholds, a function and/or an if-statement.
- two thresholdsare set to define three states: if a statistic is below the first threshold, then a first state (e.g., a “normal” state) is assigned; if a statistic is between the thresholds, then a second state (e.g., a “warning” state) is assigned; if a statistic is above the second threshold, then a third state (e.g., a “critical state”) is assigned.
- the state criteriacan pertain to multiple statistics (e.g., having a function where a warning state is assigned if any of three statistics are below a respective threshold or if a score generated based on multiple statistics is below a threshold).
- the state criteriacan include a time-sensitive criteria, such as a threshold based on a past statistic (e.g., indicating that a warning state should be assigned if the statistic has increased by 10-20% since a previous comparable statistic and a warning state should be assigned if it has increased by 20+%), a derivative (calculated based on a current and one or more past statistics) and/or an extrapolation (calculated based on a current and one or more past statistics).
- a time-sensitive criteriasuch as a threshold based on a past statistic (e.g., indicating that a warning state should be assigned if the statistic has increased by 10-20% since a previous comparable statistic and a warning state should be assigned if it has increased by 20+%), a derivative (calculated based on a current and one or more past statistics) and/or an extrapolation (calculated based on a current and one or more past statistics).
- multiple statesare defined. For example, an overall state can be assigned to the component, and other specific states pertaining to more specific performance qualities (e.g., memory usage, processor usage and/or processing speed) can also be assigned.
- the state criteriacan be fixed or definable (e.g., by an architecture provider 105 or reviewer 125 ).
- the state criteriacan be the same across all components and/or time periods or they can vary. For example, criteria applicable to VM components can differ from criteria applicable to higher level components.
- the state criteriaare determined based on a results-oriented empirical analysis. That is, a state engine 350 can use an analysis or model to determine which performance metrics (e.g., a range of values) are indicative of poor or unsatisfactory performance of the Hypervisor. Thus, a result could be a performance metric for a higher level component or a population user satisfaction rating.
- performance metricse.g., a range of values
- An alarm engine 365can access one or more alarm criteria from alarm-criteria database 370 and use the alarm criteria and an assigned state to determine whether an alarm is to be presented.
- an alarm criterionindicates that an alarm is to be presented if one or more states are assigned.
- an alarm criterionincludes a time-sensitive assessment, such as a criterion that is satisfied when the state has changed to (or below) a specific state and/or has changed by a particular number of states since a last time point.
- Alarm engine 365can present the alarm by, e.g., presenting a warning on an interface (e.g., a webpage or app page), transmitting an email, sending a message (e.g., a text message), making a call or sending a page.
- a content of the alarme.g., email, message, etc.
- VM monitoring system 155can include an interface engine 375 that enables a reviewer 115 to request a performance report and/or receive a performance report.
- the reportcan include one or more statistics, states, and/or alarm statuses.
- the reportcan identify which component and/or time period are associated with the statistic, state and/or alarm status.
- Interface engine 370can present most-recent or substantially real-time values (e.g., numerical statistics or states) and/or historical values. In some instances, interface engine accesses a set of values for a given component and generates and presents a table, list or graph to illustrate a change in a performance.
- the reportcan also include activity pertaining to a component and/or time period (e.g., tasks assigned, task statuses, etc.).
- Interface engine 375can receive input from reviewer 115 , which can cause different information to be presented to the user.
- interface engine 375merely accesses different data e.g., states, statistics, alarm statuses and/or activities) from database 320 , 345 , and/or 360 .
- Interface engine 375can then present the accessed data itself or generate and present a representation of the data (e.g., generate and present a graph).
- the inputcauses interface engine 375 to request that aggregator 325 aggregate different performance metrics, that statistics generator 340 generate different statistics, that state engine 350 generate different states and/or that alarm engine 365 re-assess alarm criteria
- the new datacan then be presented to reviewer 115 .
- the reportcan be dynamic.
- the inputcan include selection of a component.
- the selectioncan lead to a presentation (and potentially a generation of) more detailed data pertaining to the component and/or to a presentation of data pertaining to components that are children of the selected component.
- This former strategycan encourage a user to follow branches down an architecture tree to find, e.g., a source of a high-level problem or to understand best-performing branches.
- FIGS. 5A-5Billustrate an example of sequential presentations conveying an architecture and system performance that can be presented to a reviewer 125 .
- FIG. 5Athree relatively high-level nodes are presented. Specifically a highest-level node is presented along with its children. In this instance, the children are at different levels in order to ensure that each presented node has multiple children. It will be appreciated that in other embodiments, the depicted children nodes are in the same level (e.g., such that another “Host Cluster” would be a parent of “Host 1 ” and have no other children).
- this architectureincludes 12 nodes that are hidden in the representation in FIG. 5A .
- the node hidingcan help a user focus on a most likely lower-level cause of an overall sub-par performance.
- An overall state of the represented componentsis indicated based on whether the node is surrounded by a diamond. In this case, nodes in a warning state are surrounded by a diamond. It will be appreciated that other state indicators (e.g., colors, text, icon presence or a number) can be used instead of or in addition to the surrounding indicator.
- state indicatorse.g., colors, text, icon presence or a number
- FIG. 5Bshows a representation of the architecture and system performance after reviewer 125 selected the Host 1 node (having a warning-state indicator). At this point, the children of Host 1 appear. Two of the child VM nodes also have a warning-state indicator.
- FIG. 5Balso illustrates how presentations can indicate which nodes are parent nodes. In this case, “fills” or patterns of the node convey this characteristic, with pattern nodes indicating that the nodes are not parents.
- FIGS. 5A and 5Ballow a reviewer to drill down into sub-optimal system performance, to easily understand which system components are properly operating and to easily understand architecture underlying a Hypervisor.
- more detailed performance informationcan also be presented to a reviewer. For example, detailed information can appear as a transient pop-up when a reviewer 125 hovers a cursor over a component and/or can appear as a report when a reviewer 125 double clicks on a node.
- an architecture provider 105 and reviewer 125are a same party.
- the reviewer 125can then review a representation, such as one shown in FIGS. 5A-5B and access performance indicators of specific system components.
- reviewer 125can use the same representation to modify an architecture. For example, reviewer 125 can add, move or delete connections, move child components, add and/or remove components. Reviewer 125 can also select a particular component (e.g., by double clicking a node) and change its properties.
- FIGS. 6A-6Cillustrate example detailed information that can be presented to characterize performance of a Hypervisor, a host and a VM, respectively. These graphics can be presented in response to a reviewer 125 hovering over a specific hypervisor component.
- FIG. 6Ashows gauges presenting information pertaining to an overall Hypervisor. The gauges identify a percentage of VMs in a Hypervisor having undesirable states. The left gauge shows a percentage of VMs with a state for CPU usage in a “high” category. The middle gauge shows a percentage of VMs with a state for memory usage in a “high” category. The right gauge shows a percentage of VMs within a state for an amount of time a VM is waiting to use a processor that is in a “high” category. Thus, 33% of VMs are seemingly affected in their processing capabilities based on overloading of 2% of VMs. Thus, it would be useful to identify which VMs are within the 2% and/or 4.2% and a source of the problem for those VM
- high-level performance indicatorscan be presented (e.g., ones related to memory.
- other gaugescould identify memory performance indicators. For example, a gauge could identify a percentage of hosts with a “high” amount of memory being used, having a “high” amount of memory ballooning (during which a host is requesting memory be returned from a VM to the host), or having a “high” amount of memory swapping (during which a host is forcefully taking back memory from a VM).
- Host processing characteristicse.g., a percentage of hosts with “high” CPU usage
- FIG. 6Bshows information pertaining to a particular host in a Hypervisor.
- the presented datacompares performance characteristics of the host's children to more global comparable characteristics.
- the left bar graphshows a histogram across VMs assigned to the host identifying a sum-ready performance metric (identifying a time that the VM must wait before using a processor).
- the right bar graphis comparable but characterizes all VMs within a Hypervisor. In this instance, the right histogram is highly skewed to the left, while the left histogram does not exhibit a similar skew. The histogram thus suggests that the sub-network of the host and its children is not operating as well as is possible.
- FIG. 6Cshows a time-graph of the same waiting-time metrics for a VM across period of times (in the lighter line). Specifically, each point in the graph represents the waiting-time metric for a period of time. A comparable average metric across all VMs is simultaneously presented (in the darker line). The higher values underscore sub-optimal performance, as the processor is experiencing higher than average wait times.
- This presentationallows a reviewer 125 to understand whether a VM's performance is particularly poor relative to other VMs' performances, identify whether and when any substantial changes in the performance occurred, and to identify and whether poor performance is becoming a consistent problem. Further, the historical plot may allow a reviewer 125 to notice a positive or negative trend in the performance metric, such that a problem can be remedied before it becomes serious.
- the historical presentation in FIG. 6Cthus offers valuable insight as to a component's performance, when a change in performance occurred, and whether the performance warrants a change in the VM architecture.
- the historical presentationrequires that historical performance characteristics be stored and indexed (e.g., by time and/or component). This is complicated by the facts that this can be a very large amount of data. Storing all raw performance metrics is, not only a very large amount of data, but then the metrics must be repeatedly re-aggregated and historical performance statistics and/or states must be repeatedly recalculated.
- storing only statistics and/or states and not the metricslimits the ability to customize which statistics and/or states are presented (e.g., by fixing time periods instead of allowing statistics to be calculated on a flexible basis depending on a reviewer's interest and reviewing time) and can itself even lead to a large amount of data to store, due to many types of performance variables being calculated at many levels (meaning that a single performance metric may, in combination with other metrics, give rise to several performance statistics and/or states).
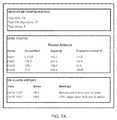
- FIGS. 7A-7Cfurther illustrate example detailed information that can be presented to characterize performance of a Hypervisor, a host and a VM, respectively. These reports can be presented in response to a reviewer 125 selecting (e.g., by double clicking) a specific VM-system component.
- FIG. 7Aillustrates a report for a Hypervisor.
- the reportcan include information about hosts in the system and VMs in the system.
- the reportcan identify system properties, such as a number and type of components within the systems.
- the systemincludes 4 hosts and 74 VMs.
- the reportcan also characterize provider-initiated or automatic architecture changes, such as a number of times a VM automatically migrated to another host (e.g., based on a host-clustering architecture defined by an architecture provider). It will be appreciated that more and/or more detailed information can be presented regarding architecture changes, such as identifying whether the change was automatic, identifying a time of the change, and/or identifying involved components.
- a host-status sectionidentifies hosts by name and storage capacity. A current status of each host is also indicated by showing an amount of the host's capacity that is committed to served VMs and an amount by which the host is overprovisioned. High commitment and overprovisioning numbers can be indicative of poor performance. It will be appreciated that the host information could be expanded to include, e.g., an overall or host-specific memory-ballooning or memory-swapping statistic, host-clustering arrangements, and/or an overall or host-specific CPU usage.
- the reportcan also identify past alarms in an alarm-history section. For each alarm, an applicable component can be identified, a time of the alarm can be identified and a substance or meaning of an alarm can be identified. These alarms can identify state changes for particular components.
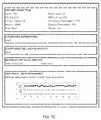
- FIG. 7Billustrates a report for a host.
- Overall performance statistics and corresponding statesare presented in a host-statistics section. These statistics can be recent or real-time statistics and can be equivalent to instantaneous performance metrics or can be calculated using performance metrics from a recent time period.
- a host-configurations sectionidentifies the equipment and capabilities of the host.
- a connected-datastores sectionidentifies which other hosts in the Hyper-visor the instant host is connected to (e.g., via a clustering arrangement). In some instances, the section is expanded to identify a type of connection or a length of time that the connection has existed.
- a VM-information sectionidentifies VMs assigned to the host.
- the reportidentified a number of VMs that are assigned and a number of those in a power-on state.
- the reportalso identifies the number of VMs that migrated to or from the host (e.g., via a host-clustering arrangements).
- the reportcan list recent VM tasks, events and/or log entries, and can identify an applicable time, VM and description.
- taskscan include changing a resource configuration for a VM, adding a VM to a host, and establishing a remote connection.
- Log entriescan include identifications of unrecognized URI versions and software warnings.
- a historical-host-performance sectionshows how a performance statistic has been changing over time.
- the historical statistics(which can include a final real-time statistic) are shown graphically, along with a “normal” threshold (shown as the bottom, dark dashed line) and a “critical” threshold (shown as the top, gray dashed line).
- Reviewer 125is able to set settings to control the statistical presentation. For example, reviewer 125 can identify a performance metric of interest (e.g., CPU usage, memory usage, etc.), whether data is to be aggregated across VMs to derive the statistic, a statistic type (e.g., average, median, maximum, minimum, mode, variance, etc), and a time period (e.g., 24 hours).
- Other settingsmay further be presented, such as time discretization during the time period and graph-formatting options (e.g., marker presence, marker size, line style, axis-tick settings, etc.).
- FIG. 7Cillustrates a report for a VM.
- a VM-configurations sectionidentifies the resources allocated to the VM and other VM and/or relationship characteristics (e.g., a name, assigned host and/or assigned duster).
- a connected-datastores sectionidentifies which hosts are, per an existing architecture, responsible for providing resources to the VM.
- a configuration-change-history sectionidentifies a time and type of a past change to the configuration of the VM and a party initiating the change.
- a migration-request-historyidentifies any attempts and/or successes for migrating the VM from one host to the next. Thus, in this case, it appears as though the VM was attempting to migrate off of the VM but failed.
- This reportalso includes a historical-performance section, which can have similar presentation and setting-changing abilities as the similar section from the host report. It will be appreciated that, e.g., thresholds can differ between the two. For example, a warning threshold can be stricter for a host, since more VMs contribute to the statistic and diminish the probability of observing extreme values.
- reportscan include links to other reports.
- a reviewer 125can click on “Host 1 ” to move to the report shown in FIG. 7B for that component.
- reviewer 125can navigate via the reports to access performance and configuration details for related hypervisor components.
- the presentations shown from FIGS. 5A-7Cshow a variety of ways by which a reviewer 125 can understand how a Hyper visor is structured and performing. By tying together structural and performance information, a reviewer 125 can begin to understand what architecture elements may be giving rise to performance problems and can appropriately improve the architecture. Further, the presentations show how a given performance measure compares to other performance measures.
- One such comparisonis an inter-system-component comparison, which can enable a reviewer 125 to identify a reasonableness of a performance metric and determine a level at which a problem could best be addressed.
- Another such comparisonis a historical comparison, which can allow reviewer 125 to identify concerning trends and/or to pinpoint times at which substantial performance changes occurred. Reviewer 125 can then review configuration-change or task histories to determine whether any events likely gave rise to the performance change.
- FIG. 8illustrates a flowchart of an embodiment of a process 800 for using a VM machine to complete user tasks.
- Process 800begins at block 805 , where user account engine 205 authenticates a user 110 .
- Task intake 215detects a new task request from user 110 at block 810 .
- Prioritizer 225prioritizes the task request(e.g., based on characteristics of user 110 , characteristics of the task, system load and/or when the request was received) at block 815 .
- the prioritizationcan include generating a score, assigning a priority class or assigning a ranking.
- Task intake 215places a queue item identifying the task in queue 220 at block 820 .
- the priority of the taskcan be reflected within the queue item itself, by the queue item's placement within a ranking or by a priority indicator associated with the queue item.
- Load monitor 230monitors loads of virtual machines (e.g., and/or hosts) at block 825 .
- the monitoringcan include detecting characteristics of tasks being processed (e.g., resource requirements, a current total processing time, and/or which user who submitted the task).
- Assigner 235selects the task from queue 220 at block 830 . The selection can occur, e.g., once the task is at sufficiently high priority to be selected over other tasks and can further occur once appropriate resources are available to process the task.
- Assigner 235assigns the task to a VM at block 835 .
- the VM to which the task is assignedcan be a VM with sufficient available resources to process the task. Assignment to a VM can further include assigning the task to a host and/or host cluster.
- Task monitor 240monitors performance of the task at the assigned VM at block 840 .
- task monitor 240can detect whether a VM appears to be stalled in that it has not completed the task for over a threshold duration of time.
- task monitor 240can monitor how much of the VM's processing power and/or memory appears to be being consumed by the task performance.
- task monitor 240can determine whether any errors are occurring during the task performance.
- task monitor 240determines that the performance is unsatisfactory at block 845 (e.g., based on too much consumption of the VM resources, too long of a processing time and/or too many errors), and assigner subsequently reassigns the task to a different VM at block 850 .
- the different VMcan be one with more resources than the initial VM, one in a larger host-clustering network, and/or one currently processing fewer or less intensive tasks as compared to those otherwise being processed by the initial VM.
- FIG. 9illustrates a flowchart of an embodiment of a process 900 for characterizing hypervisor components' performance.
- Process 900begins at block 905 , where activity monitor 315 monitors performance of VMs and hosts. Through this monitoring, activity monitor 315 can detect performance metrics, such as CPU usage, memory usage, task assignment counts, task assignment types, task completion counts, and/or migrations to/from the VM or to/from the host. Activity monitor 315 stores the detected performance metrics in activity database 320 at block 910 .
- performance metricssuch as CPU usage, memory usage, task assignment counts, task assignment types, task completion counts, and/or migrations to/from the VM or to/from the host.
- Activity monitor 315stores the detected performance metrics in activity database 320 at block 910 .
- Aggregator 325accesses an applicable architecture from architecture database 330 at block 915 .
- the applicable architecturecan be one associated with a reviewer, one randomly selected, or one defining a Hypervisor of interest.
- the architecturecan identify some or all of the VMs and/or hosts monitored at block 905 .
- the architecturecan identify relationships from the VM to other hypervisor components.
- Aggregator 325identifies one of the components from the architecture and a time period.
- the time periodcan include a current time/time period (i.e., real-time or most recent time in activity database 320 for the component) or a previous time period.
- process 900first characterizes performance of low-level components (e.g., VMs) before characterizing performance of high-level components.
- Aggregator 325accesses appropriate performance metrics or states at block 920 .
- performance metricscan be accessed from activity database 320 .
- states of children of the componentscan be accessed from state database 360 .
- performance metricsare accessed from activity database 320 for all components.
- Statistics generator 340generates a statistic based on the accessed metrics or states and stores the statistic in statistic database 345 at block 925 .
- the statisticcan include, e.g., an average or extreme metric across the time period or a percentage of children components having been assigned to one or more specific states (e.g., any of states red, orange, or yellow).
- State engine 350accesses one or more state criteria from state-criteria database 355 at block 930 . Which state criteria are accessed can depend on which component is being assessed. in one instance, different levels in an architecture have different criteria.
- State engine 350assesses the criteria in view of the statistic to determine which state the component is in during the time period. State engine 350 then assigns the component to that state (as a present state or a past state associated with the time period) at block 935 .
- State engine 350stores the state in association with the component and time period in state database 360 at block 940 .
- Process 900can then return to block 920 and repeat blocks 920 - 940 tier a different component and/or a different time period. For example, process can repeat in this manner to continue to identify and store current statistics and/or states.
- State determinations for higher-level componentscan depend on performances of underlying children low-level components.
- One technique for arriving at the higher-level statewould then be to aggregate performance metrics from all children components, generate a statistic based on the aggregated metrics, and identify a state based on the statistic.
- this approachcould lead to a positive state assignment even in the case where a small number of children components were performing very poorly.
- the aggregate analysiscould over-look this problem due to the mitigation of the poor data by other positive data from properly performing children components.
- Another approachis to first identify a state for each child component and to then determine a state for a parent component based on the states (not the direct metrics) of the child components.
- the state criteriacan then set forth, e.g., a threshold number of child state assignments to a negative state that would cause the parent component to also be assigned to a negative state.
- FIGS. 10-11illustrate example processes for state assignments determined using this approach.
- FIG. 10illustrates a flowchart of an embodiment of a process 1000 for assigning a performance state to a low-level component in a Hypervisor.
- Process 1000begins at block 1005 , where aggregator 325 accesses an applicable architecture from architecture database 330 .
- the architectureidentifies a particular VM, and aggregator 325 accesses performance metrics characterizing the VM's performance during a time period from activity database 320 at block 1010 .
- statistic generator 340Based on the metrics, statistic generator 340 generates a performance statistic (e.g., an average of the metrics) at block 1015 .
- a performance statistice.g., an average of the metrics
- State engine 350accesses one or more state criteria from state-criteria database 355 at block 1020 .
- state-criteria database 355includes multiple criteria, which may apply to different component types (e.g., having different configurations or capabilities), different architecture levels, different architectures, and/or different reviewers.
- state engine 350can select the criteria that are applicable to the VM and/or to a reviewing reviewer.
- State engine 350evaluates the statistic in view of the accessed criteria, and, as a result of the evaluation, assigns a state to the VM at block 1020 .
- FIG. 11illustrates a flowchart of an embodiment of a process 1100 for assigning a performance state to a high-level component in a Hypervisor.
- Process 1100begins at block 1105 , where aggregator 325 accesses an applicable architecture from architecture database 330 .
- This architecturecan be the same architecture as accessed at block 1005 in process 1000 .
- the architecturecan include a component that is a parent of the VM from process 1000 .
- the architecturecan include a VM-group component (e.g., a host).
- Aggregator 325accesses a state, from state database 360 , for each VM in the VM group at block 1110 .
- Statistics generator 340generates a performance statistic based on the accessed states at block 1115 .
- the statisticcan include, e.g., an average, a percentage of VMs being assigned to a particular state, a percentage of VMs being assigned to a particular state or a worse state, etc.
- State engine 350accesses state criteria from state-criteria database 355 at block 1120 . As in process 1000 , this access can include selecting the criteria that are applicable to the VM group and/or reviewing reviewer. It will be appreciated that the state criteria accessed at block 1120 can differ from the state criteria accessed at block 1020 .
- State engine 350evaluates the statistic in view of the accessed criteria, and, as a result of the evaluation, assigns state to VM group at block 1120 .
- the types of potential states that can be assignedcan be similar or the same. This can enable a reviewer 125 to easily understand how well the component is performing without having to understand the different criteria used in the assessment.
- FIG. 12illustrates a flowchart of an embodiment of a process 1200 for using a VM machine to complete user tasks.
- Process 1200begins at block 1205 , where reviewer account engine 305 authenticates a reviewer 125 .
- interface engine 375presents, to reviewer 125 , a dynamic representation of at least part of an architecture of a Hypervisor and, for each of a set of components represented in the architecture, a performance state assigned to the component.
- the architecture and performance statesare simultaneously represented to reviewer 125 .
- the architecturecan be presented by displaying a series of nodes—each node representing a hypervisor component.
- the nodescan be connected to show relationships. Relationships can include, e.g., resource-providing relationships (e.g., between a host and VM), migration-enabling relationships (e.g., between two hosts in a cluster, which can be denoted via a direct connection or an indirect connection via an upper level host-cluster component).
- the nodescan be presented in a hierarchical manner, and relationships can include familial (e.g., parent-child) relationships. It will be appreciated that the architecture can be presented in a variety of other manners. For example, a series of lists can identify, for each of a set of components, respective “children” components. As another example, rows and columns in a matrix can identify columns, and cells in the matrix can identify relationship presence and/or a type of relationship.
- the presentation of the architecturecan include identifying all components and relationships in the architecture or a subset of the components and relationships.
- the subsetcan include, e.g., components in a highest level in the architecture or in the highest n levels (e.g., n being 2, 3, 4, etc.) and not components in the lower levels.
- Such a representationcan encourage a reviewer 125 to assess a Hypervisor's performance in a top-down manner, rather than requiring that a reviewer 125 already know a tower-level source of sub-optimal performance.
- a performance statecan be represented by a color, word, pattern, icon, or line width.
- nodes in a representation of an architecturecan have an appearance characteristic (e.g., a line color, a line thickness, or a shading) that depends on the state of the represented component.
- the performance statecan include an overall performance state.
- the overall performance statecan be determined based on a plurality of factors, such as CPU usage, memory usage, task-processing times, task-processing intake numbers, and/or received or transmitted task migrations.
- a value for each factoris identified and weighted, and a sum of the weighted values is used to determine the overall performance state.
- an overall performance statedepends on whether any of one or more factors fail respective satisfaction criteria or fall into a particular state (e.g., a warning state).
- the performance stateis not an overall performance state but instead relates to a particular performance factors. States pertaining to different performance factors can be simultaneously presented (e.g., via matrices or lists or via repeated presentation of a family tree with state distinguishers). In one instance, a single family tree is shown to represent the architecture, and each node can have a graphical element (e.g., a line width, line color, shading, icon presence, etc.) that represents a state for one performance factor.
- a reviewer 125could evaluate CPU-usage performances
- line colorreviewer 125 could evaluate memory-usage performances.
- a reviewer 125can select a performance factor of interest. For example, a user can select “CPU usage” from a performance-factor menu, and nodes in a family tree can then be differentially represented based on their CPU-usage performance.
- Interface engine 375detects a selection from reviewer 125 of a first architecture component at block 1215 .
- the selectioncan include, e.g., clicking on or hovering over a component representation (e.g., a node, column heading, or row heading).
- Interface engine 375presents a detailed performance statistic, component characteristic and/or performance history for selected first component at block 1220 .
- the statistic, characteristic and/or historycan pertain to the first component or to a child or children of the first components.
- a performance statisticcan include a recent or real-time performance statistic (e.g., average CPU usage).
- a component characteristiccan include, e.g., resources assigned to the component or equipment of the component.
- a performance historycan include a past performance statistic.
- a statistic and/or performance historyis presented with a threshold value or a comparison (e.g., population) value.
- the presentationcan include a numerical, text and/or graphical presentation. For example, performance history can be shown in a line graph.
- different statistics, characteristics and/or performance historyis presented based on a selection characteristic. For example, hovering over a component node can cause an overall performance statistic for the component to be shown, while more detailed statistics and/or structure characteristics can be presented responsive to a clicking on the component node.
- interface engine 375presents identifications of one or more second architecture components related to the first architecture component at block 1225 .
- This identificationcan include expanding a representation of the architecture to include representations of the second components (which may have been previously hidden). In some instances, part of the architecture that was initially presented is also hidden at block 1225 . This can include, e.g., nodes of components along a non-selected branch in a family-tree architecture.
- the second componentscan include components that are children of the first architecture component. States assigned to the second architecture components can also be (e.g., simultaneously) presented.
- Interface engine 375detects a reviewer's selection of one of the identified second architecture components at block 1230 .
- the selectioncan include a same or similar type of selection as that detected at block 1215 .
- Interface engine 375presents a detailed performance statistic, component characteristic and/or performance history for the selected second component at block 1235 .
- the presentation at block 1235can mirror that at block 1220 or can be different.
- the presentation at block 1220relates to performances and/or characteristics of child components of the first component
- the presentation at block 1235relates to a performance and/or characteristic of the second component (e.g., as the second component may not have child components).
- FIG. 13illustrates a flowchart of an embodiment of a process 1300 for analyzing performance of a Hypervisor using historical data.
- Process 1300begins at block 1305 , where activity monitor 315 stores the detected performance metrics in activity database 320 .
- Block 1305can parallel block 910 from process 900 .
- Interface engine 375detects input from a reviewer 125 at block 1310 .
- the inputcan identify a time period. Identification of the time period can include identifying a duration of the time period and/or identifying one or both endpoints of the time period. Identification of an endpoint can include identifying an absolute date and/or time (e.g., Apr. 1, 2013, 1 pm) or a relative date and/or time (14 days ago).
- the inputcan include a discretization that can be used to define discrete time intervals within the time period.
- the inputcan include entry of a number and/or text and/or selection of an option (e.g., using a scroll-down menu, a sliding cursor bar, list menu options, etc.).
- a beginning and/or end endpoint of the time periodcan be at least 1, 2, 3, 7, 14, or 21 days or 1, 2, 3, 6, or 12 months prior to the detection of the input.
- the time periodcan have a duration that is at least, that is, or that is less than, 1, 4, 8 12 or 24 hours; 1, 2, or 4 weeks or 1, 2 or 3 months.
- Time periods for intra-time-period time intervalscan be equal to or less than 1, 5, 15 or 30 seconds; 1, 5, 15 or 30 minutes; or 1, 2, 4 or 6 hours.
- Architecture manager 335identifies an applicable architecture at block 1315 .
- the architecturecan be one that characterized a structure of the Hypervisor during the identified time period. In some instances, the architecture differs from a current architecture.
- the architecturecan be explicitly or implicitly identified. As an example of implicit identification, activity database 320 can index performance metrics according to direct and indirect components. Thus, a VM CPU usage can be associated with both an identifier of the respective VM and an identifier of a host connected to the VM at the time that the metric was obtained.
- Process 1300continues to then perform blocks 1320 - 4330 or 1325 - 1330 for each of one, more or all components in the architecture, In instances in which the time period is to be analyzed in a discretized manner, blocks 1320 - 1330 or 1325 - 1330 can also be repeated for each discrete time interval in the time period. In these latter cases, it will be appreciated that multiple applicable architectures can be identified to account for any architecture changes during the time period.
- Statistics generator 340generates a historical statistic at block 1320 .
- the historical statisticcan be of a type similar or the same as a performance statistic described herein and can be determined in a similar manner as described herein. It will thus be appreciated that, e.g., depending on a component type, a historical statistic can be determined directly based on the performance metrics (e.g., to determine an average CPU usage) or can be determined based on lower-level component states (e.g., to determine a percentage of VMs with warning-level CPU usages).
- State engine 350accesses an appropriate state criterion and evaluates the generated statistic in view of the criterion. Based on the evaluation, state engine 350 assigns a historical state to the component at block 1330 .
- Interface engine 375presents historical performance indicator(s).
- the historical indicatorscan include historical statistics and/or historical states. As before, the performance indicators can be simultaneously presented along with a representation of the applicable architecture (e.g., by distinguishing appearances of nodes in an architecture family tree based on their states).
- granular low-level performance datacan be dynamically accessed and analyzed. based on performance characteristics and time periods of interest to a reviewer 125 .
- reviewer 125may be able to identify time points at which performance changed.
- Reviewer 125can then drill down into the component details to understand potential reasons for the change or note any time-locked. architecture. Simultaneous presentation of performance indicators and architecture representations aid in the ability to detect temporal coincidence of architecture changes and performance changes.
- Embodiments of the subject matter and the functional operations described in this specificationcan be implemented in digital electronic circuitry, or in computer software, firmware, or hardware, including the structures disclosed in this specification and their structural equivalents, or in combinations of one or more of them.
- Embodiments of the subject matter described in this specificationcan be implemented as one or more computer program products, i.e., one or more modules of computer program instructions encoded on a computer readable medium for execution by, or to control the operation of data processing apparatus.
- the computer readable mediumcan be a machine readable storage device, a machine readable storage substrate, a memory device, a composition of matter effecting a machine readable propagated signal, or a combination of one or more of them.
- data processing apparatusencompasses all apparatus, devices, and machines for processing data, including by way of example a programmable processor, a computer, or multiple processors or computers.
- the apparatuscan include, in addition to hardware, code that creates an execution environment for the computer program in question, e.g., code that constitutes processor firmware, a protocol stack, a database management system, an operating system, or a combination of one or more of them.
- a propagated signalis an artificially generated signal, e.g., a machine generated electrical, optical, or electromagnetic signal, that is generated to encode information for transmission to suitable receiver apparatus.
- a computer program(also known as a program, software, software application, script, or code), can be written in any form of programming language, including compiled or interpreted languages, and it can be deployed in any form, including as a stand alone program or as a module, component, subroutine, or other unit suitable for use in a computing environment.
- a computer programdoes not necessarily correspond to a file in a file system.
- a programcan be stored in a portion of a file that holds other programs or data (e.g., on or more scripts stored in a markup language document), in a single file dedicated to the program in question, or in multiple coordinated files (e.g., files that store one or more modules, sub programs, or portions of code).
- a computer programcan be deployed to be executed on one computer or on multiple computers that are located at one site or distributed across multiple sites and interconnected by a communication network.
- processors suitable for the execution of a computer programinclude, by way of example, both general and special purpose microprocessors, and any one or more processors of any kind of digital computer.
- a processorwill receive instructions and data from a read only memory or a random access memory or both.
- the essential elements of a computerare a processor for performing instructions and one or more memory devices for storing instructions and data.
- a computer wiltalso include, or be operatively coupled to receive data from or transfer data to, or both, one or more mass storage devices for storing data, e.g., magnetic, magneto optical disks, or optical disks.
- mass storage devicesfor storing data, e.g., magnetic, magneto optical disks, or optical disks.
- a computerneed not have such devices.
- embodiments of the subject matter described in this specificationcan be implemented on a computer having a display device, e.g., a CRT (cathode ray tube) to LCD (liquid crystal display) monitor, for displaying information to the user and a keyboard and a pointing device, e.g., a mouse or a trackball, by which the user can provide input to the computer.
- a display devicee.g., a CRT (cathode ray tube) to LCD (liquid crystal display) monitor
- keyboard and a pointing devicee.g., a mouse or a trackball
- Other kinds of devicescan be used to provide for interaction with a user, architecture provider or reviewer as well; for example, feedback provided to the user can be any form. of sensory feedback, e.g., visual feedback, auditory feedback, or tactile feedback; and input from the user, architecture provider or reviewer can be received in any from, including acoustic, speech, or tactile input.
- Embodiments of the subject matter described in this specificationcan be implemented in a computing system that includes a back end component, e.g., as a data server, or that includes a middleware component, e.g., an application server, or that includes a front end component, e.g., a client computer having a graphical user interface or a Web browser through which a user can interact with an implementation of the subject matter described in this specification, or any combination of one or more such back end, middleware, or front end components.
- the components of the systemcan be interconnected by any form or medium of digital data communication, e.g., a communication network. Examples of communication networks include a local area network (“LAN”) and a wide area network (“WAN”), e.g., the Internet.
- LANlocal area network
- WANwide area network
- the computing systemcan include clients and servers.
- a client and serverare generally remote from each other and typically interact through a communication network.
- the relationship of client and serverarises by virtue of computer programs running on the respective computers and having a client server relationship to each other.
Landscapes
- Engineering & Computer Science (AREA)
- Theoretical Computer Science (AREA)
- General Engineering & Computer Science (AREA)
- Physics & Mathematics (AREA)
- General Physics & Mathematics (AREA)
- Software Systems (AREA)
- Quality & Reliability (AREA)
- Computer Hardware Design (AREA)
- Data Mining & Analysis (AREA)
- Computing Systems (AREA)
- Debugging And Monitoring (AREA)
Abstract
Description
Claims (29)
Priority Applications (37)
| Application Number | Priority Date | Filing Date | Title |
|---|---|---|---|
| US13/874,423US8904389B2 (en) | 2013-04-30 | 2013-04-30 | Determining performance states of components in a virtual machine environment based on performance states of related subcomponents |
| US14/167,316US20140324862A1 (en) | 2013-04-30 | 2014-01-29 | Correlation for user-selected time ranges of values for performance metrics of components in an information-technology environment with log data from that information-technology environment |
| US14/253,490US9185007B2 (en) | 2013-04-30 | 2014-04-15 | Proactive monitoring tree with severity state sorting |
| US14/253,548US9142049B2 (en) | 2013-04-30 | 2014-04-15 | Proactive monitoring tree providing distribution stream chart with branch overlay |
| US14/253,529US8972992B2 (en) | 2013-04-30 | 2014-04-15 | Proactive monitoring tree with state distribution ring |
| US14/253,697US9015716B2 (en) | 2013-04-30 | 2014-04-15 | Proactive monitoring tree with node pinning for concurrent node comparisons |
| US14/529,019US10114663B2 (en) | 2013-04-30 | 2014-10-30 | Displaying state information for computing nodes in a hierarchical computing environment |
| US14/609,080US9417774B2 (en) | 2013-04-30 | 2015-01-29 | Proactive monitoring tree with node pinning for concurrent node comparisons |
| US14/609,045US9419870B2 (en) | 2013-04-30 | 2015-01-29 | Proactive monitoring tree with state distribution ring |
| US14/801,721US9754395B2 (en) | 2013-04-30 | 2015-07-16 | Proactive monitoring tree providing distribution stream chart with branch overlay |
| US14/812,948US9426045B2 (en) | 2013-04-30 | 2015-07-29 | Proactive monitoring tree with severity state sorting |
| US15/215,097US10523538B2 (en) | 2013-04-30 | 2016-07-20 | User interface that provides a proactive monitoring tree with severity state sorting |
| US15/215,430US10310708B2 (en) | 2013-04-30 | 2016-07-20 | User interface that facilitates node pinning for a proactive monitoring tree |
| US15/215,191US10243818B2 (en) | 2013-04-30 | 2016-07-20 | User interface that provides a proactive monitoring tree with state distribution ring |
| US15/421,398US10346357B2 (en) | 2013-04-30 | 2017-01-31 | Processing of performance data and structure data from an information technology environment |
| US15/421,370US10353957B2 (en) | 2013-04-30 | 2017-01-31 | Processing of performance data and raw log data from an information technology environment |
| US15/421,353US10225136B2 (en) | 2013-04-30 | 2017-01-31 | Processing of log data and performance data obtained via an application programming interface (API) |
| US15/421,348US10997191B2 (en) | 2013-04-30 | 2017-01-31 | Query-triggered processing of performance data and log data from an information technology environment |
| US15/421,395US10318541B2 (en) | 2013-04-30 | 2017-01-31 | Correlating log data with performance measurements having a specified relationship to a threshold value |
| US15/421,412US10019496B2 (en) | 2013-04-30 | 2017-01-31 | Processing of performance data and log data from an information technology environment by using diverse data stores |
| US15/421,382US10614132B2 (en) | 2013-04-30 | 2017-01-31 | GUI-triggered processing of performance data and log data from an information technology environment |
| US15/582,132US10205643B2 (en) | 2013-04-30 | 2017-04-28 | Systems and methods for monitoring and analyzing performance in a computer system with severity-state sorting |
| US15/582,153US10469344B2 (en) | 2013-04-30 | 2017-04-28 | Systems and methods for monitoring and analyzing performance in a computer system with state distribution ring |
| US15/582,108US10776140B2 (en) | 2013-04-30 | 2017-04-28 | Systems and methods for automatically characterizing performance of a hypervisor system |
| US15/582,191US9959015B2 (en) | 2013-04-30 | 2017-04-28 | Systems and methods for monitoring and analyzing performance in a computer system with node pinning for concurrent comparison of nodes |
| US15/696,076US10515469B2 (en) | 2013-04-30 | 2017-09-05 | Proactive monitoring tree providing pinned performance information associated with a selected node |
| US15/967,472US10761687B2 (en) | 2013-04-30 | 2018-04-30 | User interface that facilitates node pinning for monitoring and analysis of performance in a computing environment |
| US16/000,745US10592522B2 (en) | 2013-04-30 | 2018-06-05 | Correlating performance data and log data using diverse data stores |
| US16/174,261US10929163B2 (en) | 2013-04-30 | 2018-10-29 | Method and system for dynamically monitoring performance of a multi-component computing environment via user-selectable nodes |
| US16/262,824US10877986B2 (en) | 2013-04-30 | 2019-01-30 | Obtaining performance data via an application programming interface (API) for correlation with log data |
| US16/397,466US10877987B2 (en) | 2013-04-30 | 2019-04-29 | Correlating log data with performance measurements using a threshold value |
| US16/412,310US11733829B2 (en) | 2013-04-30 | 2019-05-14 | Monitoring tree with performance states |
| US16/460,395US11119982B2 (en) | 2013-04-30 | 2019-07-02 | Correlation of performance data and structure data from an information technology environment |
| US16/460,423US11250068B2 (en) | 2013-04-30 | 2019-07-02 | Processing of performance data and raw log data from an information technology environment using search criterion input via a graphical user interface |
| US17/153,033US20210173683A1 (en) | 2013-04-30 | 2021-01-20 | Automatic reassignment of tasks to different virtual machines |
| US17/670,773US11782989B1 (en) | 2013-04-30 | 2022-02-14 | Correlating data based on user-specified search criteria |
| US18/453,184US12373497B1 (en) | 2013-04-30 | 2023-08-21 | Dynamic generation of performance state tree |
Applications Claiming Priority (1)
| Application Number | Priority Date | Filing Date | Title |
|---|---|---|---|
| US13/874,423US8904389B2 (en) | 2013-04-30 | 2013-04-30 | Determining performance states of components in a virtual machine environment based on performance states of related subcomponents |
Related Parent Applications (4)
| Application Number | Title | Priority Date | Filing Date |
|---|---|---|---|
| US13/874,441Continuation-In-PartUS9164786B2 (en) | 2013-04-30 | 2013-04-30 | Determining performance states of parent components in a virtual-machine environment based on performance states of related child components during a time period |
| US13/874,434Continuation-In-PartUS8683467B2 (en) | 2013-04-30 | 2013-04-30 | Determining performance states of parent components in a virtual-machine environment based on performance states of related child components |
| US13/874,448Continuation-In-PartUS9495187B2 (en) | 2013-04-30 | 2013-04-30 | Interactive, top-down presentation of the architecture and performance of a hypervisor environment |
| US13/874,423Continuation-In-PartUS8904389B2 (en) | 2013-04-30 | 2013-04-30 | Determining performance states of components in a virtual machine environment based on performance states of related subcomponents |
Related Child Applications (8)
| Application Number | Title | Priority Date | Filing Date |
|---|---|---|---|
| US13/874,441Continuation-In-PartUS9164786B2 (en) | 2013-04-30 | 2013-04-30 | Determining performance states of parent components in a virtual-machine environment based on performance states of related child components during a time period |
| US13/874,434Continuation-In-PartUS8683467B2 (en) | 2013-04-30 | 2013-04-30 | Determining performance states of parent components in a virtual-machine environment based on performance states of related child components |
| US13/874,423Continuation-In-PartUS8904389B2 (en) | 2013-04-30 | 2013-04-30 | Determining performance states of components in a virtual machine environment based on performance states of related subcomponents |
| US14/167,316Continuation-In-PartUS20140324862A1 (en) | 2013-04-30 | 2014-01-29 | Correlation for user-selected time ranges of values for performance metrics of components in an information-technology environment with log data from that information-technology environment |
| US14/167,316ContinuationUS20140324862A1 (en) | 2013-04-30 | 2014-01-29 | Correlation for user-selected time ranges of values for performance metrics of components in an information-technology environment with log data from that information-technology environment |
| US14/253,548Continuation-In-PartUS9142049B2 (en) | 2013-04-30 | 2014-04-15 | Proactive monitoring tree providing distribution stream chart with branch overlay |
| US14/253,697Continuation-In-PartUS9015716B2 (en) | 2013-04-30 | 2014-04-15 | Proactive monitoring tree with node pinning for concurrent node comparisons |
| US14/529,019ContinuationUS10114663B2 (en) | 2013-04-30 | 2014-10-30 | Displaying state information for computing nodes in a hierarchical computing environment |
Publications (2)
| Publication Number | Publication Date |
|---|---|
| US20130239111A1 US20130239111A1 (en) | 2013-09-12 |
| US8904389B2true US8904389B2 (en) | 2014-12-02 |
Family
ID=49115239
Family Applications (5)
| Application Number | Title | Priority Date | Filing Date |
|---|---|---|---|
| US13/874,423ActiveUS8904389B2 (en) | 2013-04-30 | 2013-04-30 | Determining performance states of components in a virtual machine environment based on performance states of related subcomponents |
| US14/529,019Active2033-09-25US10114663B2 (en) | 2013-04-30 | 2014-10-30 | Displaying state information for computing nodes in a hierarchical computing environment |
| US15/582,108ActiveUS10776140B2 (en) | 2013-04-30 | 2017-04-28 | Systems and methods for automatically characterizing performance of a hypervisor system |
| US16/174,261Active2033-10-23US10929163B2 (en) | 2013-04-30 | 2018-10-29 | Method and system for dynamically monitoring performance of a multi-component computing environment via user-selectable nodes |
| US17/153,033AbandonedUS20210173683A1 (en) | 2013-04-30 | 2021-01-20 | Automatic reassignment of tasks to different virtual machines |
Family Applications After (4)
| Application Number | Title | Priority Date | Filing Date |
|---|---|---|---|
| US14/529,019Active2033-09-25US10114663B2 (en) | 2013-04-30 | 2014-10-30 | Displaying state information for computing nodes in a hierarchical computing environment |
| US15/582,108ActiveUS10776140B2 (en) | 2013-04-30 | 2017-04-28 | Systems and methods for automatically characterizing performance of a hypervisor system |
| US16/174,261Active2033-10-23US10929163B2 (en) | 2013-04-30 | 2018-10-29 | Method and system for dynamically monitoring performance of a multi-component computing environment via user-selectable nodes |
| US17/153,033AbandonedUS20210173683A1 (en) | 2013-04-30 | 2021-01-20 | Automatic reassignment of tasks to different virtual machines |
Country Status (1)
| Country | Link |
|---|---|
| US (5) | US8904389B2 (en) |
Cited By (20)
| Publication number | Priority date | Publication date | Assignee | Title |
|---|---|---|---|---|
| US20130247044A1 (en)* | 2013-04-30 | 2013-09-19 | Splunk Inc. | Interactive architecture-base presentation of hypervisor performance |
| US20160098272A1 (en)* | 2014-10-02 | 2016-04-07 | Institute For Information Industry | System and method for visualizing software programs |
| US20160219100A1 (en)* | 2015-01-22 | 2016-07-28 | Alibaba Group Holding Limited | Method and Apparatus of Processing Retransmission Request in Distributed Computing |
| US9471362B2 (en)* | 2014-09-23 | 2016-10-18 | Splunk Inc. | Correlating hypervisor data for a virtual machine with associated operating system data |
| US9733974B2 (en) | 2013-04-30 | 2017-08-15 | Splunk Inc. | Systems and methods for determining parent states of parent components in a virtual-machine environment based on performance states of related child components and component state criteria during a user-selected time period |
| US9747316B2 (en) | 2006-10-05 | 2017-08-29 | Splunk Inc. | Search based on a relationship between log data and data from a real-time monitoring environment |
| US9959015B2 (en) | 2013-04-30 | 2018-05-01 | Splunk Inc. | Systems and methods for monitoring and analyzing performance in a computer system with node pinning for concurrent comparison of nodes |
| US10019496B2 (en) | 2013-04-30 | 2018-07-10 | Splunk Inc. | Processing of performance data and log data from an information technology environment by using diverse data stores |
| US10114663B2 (en) | 2013-04-30 | 2018-10-30 | Splunk Inc. | Displaying state information for computing nodes in a hierarchical computing environment |
| US10205643B2 (en) | 2013-04-30 | 2019-02-12 | Splunk Inc. | Systems and methods for monitoring and analyzing performance in a computer system with severity-state sorting |
| US10225136B2 (en) | 2013-04-30 | 2019-03-05 | Splunk Inc. | Processing of log data and performance data obtained via an application programming interface (API) |
| US10243818B2 (en) | 2013-04-30 | 2019-03-26 | Splunk Inc. | User interface that provides a proactive monitoring tree with state distribution ring |
| US10318541B2 (en) | 2013-04-30 | 2019-06-11 | Splunk Inc. | Correlating log data with performance measurements having a specified relationship to a threshold value |
| US10346357B2 (en) | 2013-04-30 | 2019-07-09 | Splunk Inc. | Processing of performance data and structure data from an information technology environment |
| US10353957B2 (en) | 2013-04-30 | 2019-07-16 | Splunk Inc. | Processing of performance data and raw log data from an information technology environment |
| US10382380B1 (en)* | 2016-11-17 | 2019-08-13 | Amazon Technologies, Inc. | Workload management service for first-in first-out queues for network-accessible queuing and messaging services |
| US10515469B2 (en) | 2013-04-30 | 2019-12-24 | Splunk Inc. | Proactive monitoring tree providing pinned performance information associated with a selected node |
| US10614132B2 (en) | 2013-04-30 | 2020-04-07 | Splunk Inc. | GUI-triggered processing of performance data and log data from an information technology environment |
| US10997191B2 (en) | 2013-04-30 | 2021-05-04 | Splunk Inc. | Query-triggered processing of performance data and log data from an information technology environment |
| US12367125B1 (en)* | 2024-09-18 | 2025-07-22 | Parry Labs, Llc | Apparatus and method for evaluating software performance |
Families Citing this family (22)
| Publication number | Priority date | Publication date | Assignee | Title |
|---|---|---|---|---|
| WO2015049789A1 (en)* | 2013-10-04 | 2015-04-09 | 株式会社日立製作所 | Resource management system and resource management method |
| US9319288B2 (en) | 2014-02-12 | 2016-04-19 | Vmware, Inc. | Graphical user interface for displaying information related to a virtual machine network |
| US9363148B2 (en)* | 2014-02-12 | 2016-06-07 | Vmware, Inc. | Graphical user interface for displaying information related to a virtual machine network |
| US9052938B1 (en) | 2014-04-15 | 2015-06-09 | Splunk Inc. | Correlation and associated display of virtual machine data and storage performance data |
| US10235204B2 (en) | 2014-04-17 | 2019-03-19 | Ab Initio Technology Llc | Integrated monitoring and control of processing environment |
| US9558093B2 (en)* | 2014-07-30 | 2017-01-31 | Microsoft Technology Licensing, Llc | Visual tools for failure analysis in distributed systems |
| US20160077571A1 (en)* | 2014-09-12 | 2016-03-17 | Microsoft Corporation | Heuristic Processor Power Management in Operating Systems |
| US10956919B2 (en)* | 2014-12-17 | 2021-03-23 | International Business Machines Corporation | Interactive visual storage capacity forecasting |
| US20160224379A1 (en)* | 2015-01-29 | 2016-08-04 | The Intellisis Corporation | Mapping Processes to Processors in a Network on a Chip Computing System |
| US10108516B2 (en) | 2015-01-29 | 2018-10-23 | Knuedge Incorporated | Affinity data collection in a computing system |
| US10719187B2 (en) | 2015-04-10 | 2020-07-21 | Cfph, Llc | Resource tracking |
| US9977745B2 (en) | 2016-01-05 | 2018-05-22 | Knuedge, Inc. | Flow control through packet router |
| US9836320B2 (en)* | 2016-03-11 | 2017-12-05 | International Business Machines Corporation | Collecting performance metrics from java virtual machines |
| US11368372B2 (en)* | 2016-06-03 | 2022-06-21 | Nutanix, Inc. | Detection of outlier nodes in a cluster |
| US10606857B2 (en) | 2016-09-26 | 2020-03-31 | Splunk Inc. | In-memory metrics catalog |
| US10545664B2 (en) | 2017-04-11 | 2020-01-28 | Samsung Electronics Co., Ltd. | System and method for identifying SSDs with lowest tail latencies |
| JP6973292B2 (en)* | 2018-05-24 | 2021-11-24 | 日本電信電話株式会社 | VM priority control system and VM priority control method |
| CN110795261B (en)* | 2019-09-26 | 2022-06-17 | 北京浪潮数据技术有限公司 | Virtual disk fault detection method and device |
| US12260258B2 (en)* | 2021-09-03 | 2025-03-25 | International Business Machines Corporation | Distributed system workload management via node autonomy |
| CN115185525B (en)* | 2022-05-17 | 2023-07-18 | 贝壳找房(北京)科技有限公司 | Data inclination code block positioning method, device, equipment and medium |
| CN115292144A (en)* | 2022-10-10 | 2022-11-04 | 北京锘崴信息科技有限公司 | Credibility evaluation method, device and equipment for multi-party model and multi-party financial model |
| CN119025720B (en)* | 2024-10-28 | 2025-01-28 | 天津金城银行股份有限公司 | Information query method, system, computer equipment and readable storage medium |
Citations (25)
| Publication number | Priority date | Publication date | Assignee | Title |
|---|---|---|---|---|
| US5751965A (en) | 1996-03-21 | 1998-05-12 | Cabletron System, Inc. | Network connection status monitor and display |
| US20020154175A1 (en) | 2001-01-04 | 2002-10-24 | James Abello | System and method for visualizing massive multi-digraphs |
| US20040169688A1 (en) | 2003-02-27 | 2004-09-02 | Microsoft Corporation | Multi-directional display and navigation of hierarchical data and optimization of display area consumption |
| US20050289540A1 (en)* | 2004-06-24 | 2005-12-29 | Lu Nguyen | Providing on-demand capabilities using virtual machines and clustering processes |
| US20060153097A1 (en) | 2005-01-10 | 2006-07-13 | Microsoft Corporation | System and methods for inline property editing in tree view based editors |
| US7546553B2 (en) | 2003-07-28 | 2009-06-09 | Sap Ag | Grid landscape component |
| US20090172666A1 (en)* | 2007-12-31 | 2009-07-02 | Netapp, Inc. | System and method for automatic storage load balancing in virtual server environments |
| US7580938B1 (en)* | 2006-06-29 | 2009-08-25 | Emc Corporation | Methods and apparatus facilitating efficient display of data |
| US7580944B2 (en) | 2006-07-27 | 2009-08-25 | Yahoo! Inc. | Business intelligent architecture system and method |
| US20090237404A1 (en)* | 2008-03-20 | 2009-09-24 | Vmware, Inc. | Graphical display for illustrating effectiveness of resource management and resource balancing |
| US20100223619A1 (en)* | 2009-02-27 | 2010-09-02 | International Business Machines Corporation | Visualization-centric performance-based volume allocation |
| US20110161851A1 (en)* | 2009-12-31 | 2011-06-30 | International Business Machines Corporation | Visualization and consolidation of virtual machines in a virtualized data center |
| US20110261055A1 (en)* | 2010-04-21 | 2011-10-27 | Vmware, Inc. | Method and Apparatus for Visualizing the Health of Datacenter Objects |
| US20120036484A1 (en)* | 2010-08-09 | 2012-02-09 | Microsoft Corporation | Relationship visualization and graphical interaction model in it client management |
| US20120174097A1 (en)* | 2011-01-04 | 2012-07-05 | Host Dynamics Ltd. | Methods and systems of managing resources allocated to guest virtual machines |
| US20120216135A1 (en)* | 2011-02-22 | 2012-08-23 | Vmware, Inc. | User interface for managing a virtualized computing environment |
| US20120221314A1 (en)* | 2006-05-17 | 2012-08-30 | Quest Software, Inc. | Model-based systems and methods for monitoring resources |
| US20120278292A1 (en) | 2000-08-17 | 2012-11-01 | Emc Corporation | Method and apparatus for managing and archiving performance information relating to storage system |
| US20120284713A1 (en)* | 2008-02-13 | 2012-11-08 | Quest Software, Inc. | Systems and methods for analyzing performance of virtual environments |
| US20120311153A1 (en) | 2011-05-31 | 2012-12-06 | Morgan Christopher Edwin | Systems and methods for detecting resource consumption events over sliding intervals in cloud-based network |
| US20120311475A1 (en)* | 2011-05-31 | 2012-12-06 | Vmware, Inc. | User interface for managing a virtual computing environment |
| US20130007261A1 (en) | 2011-07-01 | 2013-01-03 | Cisco Technology, Inc. | Virtual data center monitoring |
| US20130055092A1 (en)* | 2011-08-25 | 2013-02-28 | Vmware, Inc. | User interface for networks including virtual machines |
| US20130124714A1 (en)* | 2011-11-11 | 2013-05-16 | Vmware, Inc. | Visualization of combined performance metrics |
| US20130300747A1 (en)* | 2012-05-11 | 2013-11-14 | Vmware, Inc. | Multi-dimensional visualization tool for browsing and troubleshooting at scale |
Family Cites Families (117)
| Publication number | Priority date | Publication date | Assignee | Title |
|---|---|---|---|---|
| US6816175B1 (en) | 1998-12-19 | 2004-11-09 | International Business Machines Corporation | Orthogonal browsing in object hierarchies |
| US20010032307A1 (en)* | 1998-12-30 | 2001-10-18 | Joseph Rohlman | Micro-instruction queue for a microprocessor instruction pipeline |
| US6725235B1 (en) | 1999-09-22 | 2004-04-20 | Harris-Exigent, Inc. | Dynamic state representation method for complex systems |
| US7278103B1 (en) | 2000-06-28 | 2007-10-02 | Microsoft Corporation | User interface to display and manage an entity and associated resources |
| US6907545B2 (en) | 2001-03-02 | 2005-06-14 | Pitney Bowes Inc. | System and method for recognizing faults in machines |
| US7574504B2 (en) | 2001-03-05 | 2009-08-11 | Compuware Corporation | Characterizing application performance within a network |
| US7415671B2 (en) | 2001-06-08 | 2008-08-19 | Computer Associates Think, Inc. | Interactive hierarchical status display |
| JP3975703B2 (en)* | 2001-08-16 | 2007-09-12 | 日本電気株式会社 | Preferential execution control method, apparatus and program for information processing system |
| US7076397B2 (en) | 2002-10-17 | 2006-07-11 | Bmc Software, Inc. | System and method for statistical performance monitoring |
| US20040088314A1 (en) | 2002-10-31 | 2004-05-06 | Simes Scott T. | Method and system for reporting performance data for a network |
| US7219241B2 (en) | 2002-11-30 | 2007-05-15 | Intel Corporation | Method for managing virtual and actual performance states of logical processors in a multithreaded processor using system management mode |
| US7401141B2 (en) | 2003-01-07 | 2008-07-15 | International Business Machines Corporation | Method and system for monitoring performance of distributed applications |
| WO2005015366A2 (en) | 2003-08-08 | 2005-02-17 | Electric Power Group, Llc | Real-time performance monitoring and management system |
| US7526515B2 (en)* | 2004-01-21 | 2009-04-28 | International Business Machines Corporation | Method and system for a grid-enabled virtual machine with movable objects |
| US8244725B2 (en) | 2004-03-10 | 2012-08-14 | Iron Mountain Incorporated | Method and apparatus for improved relevance of search results |
| US20060004909A1 (en) | 2004-04-30 | 2006-01-05 | Shinya Takuwa | Server system and a server arrangement method |
| US7559053B2 (en) | 2004-08-24 | 2009-07-07 | Microsoft Corporation | Program and system performance data correlation |
| US8402361B2 (en) | 2004-11-09 | 2013-03-19 | Oracle International Corporation | Methods and systems for implementing a dynamic hierarchical data viewer |
| US7493304B2 (en) | 2004-11-12 | 2009-02-17 | International Business Machines Corporation | Adjusting an amount of data logged for a query based on a change to an access plan |
| US20060161816A1 (en) | 2004-12-22 | 2006-07-20 | Gula Ronald J | System and method for managing events |
| US7853585B2 (en) | 2005-03-17 | 2010-12-14 | International Business Machines Corporation | Monitoring performance of a data processing system |
| JP4276201B2 (en) | 2005-03-31 | 2009-06-10 | 富士通株式会社 | Billing processing apparatus for SMT processor, billing processing method, and billing processing program |
| US7123172B1 (en) | 2005-07-29 | 2006-10-17 | Hewlett-Packard Development Company, L.P. | Method and system for determining an optimal or near optimal set of contexts by constructing a multi-directional context tree |
| US7991758B2 (en) | 2005-09-07 | 2011-08-02 | International Business Machines Corporation | System and method for performing a search operation within a sequential access data storage subsystem |
| JP5077617B2 (en) | 2005-10-27 | 2012-11-21 | 富士通株式会社 | Unexpected demand detection system and unexpected demand detection program |
| MX2007002806A (en) | 2006-03-08 | 2007-10-22 | Panasonic Corp North America | Vacuum cleaner with wand activated conversion valve. |
| US8274905B2 (en) | 2006-08-22 | 2012-09-25 | Embarq Holdings Company, Llc | System and method for displaying a graph representative of network performance over a time period |
| US8014880B2 (en) | 2006-09-29 | 2011-09-06 | Fisher-Rosemount Systems, Inc. | On-line multivariate analysis in a distributed process control system |
| EP3493074A1 (en) | 2006-10-05 | 2019-06-05 | Splunk Inc. | Time series search engine |
| US8286135B2 (en) | 2006-10-17 | 2012-10-09 | Cray Inc. | Performance visualization including hierarchical display of performance data |
| US8682466B2 (en) | 2007-05-04 | 2014-03-25 | Taiwan Semiconductor Manufacturing Company, Ltd. | Automatic virtual metrology for semiconductor wafer result prediction |
| US8640056B2 (en) | 2007-07-05 | 2014-01-28 | Oracle International Corporation | Data visualization techniques |
| US8041883B2 (en) | 2007-05-09 | 2011-10-18 | Stmicroelectronics S.R.L. | Restoring storage devices based on flash memories and related circuit, system, and method |
| US8225278B2 (en) | 2007-05-14 | 2012-07-17 | International Business Machines Corporation | Method of visualizing modifications of a hierarchical state diagram |
| US7783750B1 (en) | 2007-07-30 | 2010-08-24 | Hewlett-Packard Development Company, L.P. | System and method for externalized real-time log correlation and performance monitoring of service-oriented applications |
| US7788305B2 (en)* | 2007-11-13 | 2010-08-31 | Oracle International Corporation | Hierarchy nodes derived based on parent/child foreign key and/or range values on parent node |
| JP4995104B2 (en) | 2008-01-16 | 2012-08-08 | 株式会社日立製作所 | Performance monitoring condition setting / management method and computer system using the method |
| US8031634B1 (en) | 2008-03-31 | 2011-10-04 | Emc Corporation | System and method for managing a virtual domain environment to enable root cause and impact analysis |
| US9384062B2 (en)* | 2008-12-27 | 2016-07-05 | Vmware, Inc. | Artificial neural network for balancing workload by migrating computing tasks across hosts |
| JP4951034B2 (en) | 2009-06-25 | 2012-06-13 | 株式会社日立製作所 | Computer system and its operation information management method |
| KR20110003947A (en) | 2009-07-07 | 2011-01-13 | 삼성전자주식회사 | Data processing device and method |
| US8327335B2 (en) | 2009-09-02 | 2012-12-04 | Compuware Corporation | Performance management tool having unified analysis report |
| US9037555B2 (en) | 2009-11-12 | 2015-05-19 | Bmc Software, Inc. | Asynchronous collection and correlation of trace and communications event data |
| US8707194B1 (en) | 2009-11-20 | 2014-04-22 | Amazon Technologies, Inc. | System and method for decentralized performance monitoring of host systems |
| US8254282B2 (en) | 2009-12-15 | 2012-08-28 | Tektronix, Inc. | System and method for hierarchical visualization of data |
| US20110179160A1 (en) | 2010-01-21 | 2011-07-21 | Microsoft Corporation | Activity Graph for Parallel Programs in Distributed System Environment |
| US20110283278A1 (en)* | 2010-05-13 | 2011-11-17 | Vmware, Inc. | User interface for managing a distributed virtual switch |
| US8738333B1 (en) | 2010-05-25 | 2014-05-27 | Vmware, Inc. | Capacity and load analysis in a datacenter |
| US20110307716A1 (en)* | 2010-06-10 | 2011-12-15 | Broadcom Corporation | Global control policy manager |
| US9846628B2 (en) | 2010-06-15 | 2017-12-19 | Microsoft Technology Licensing, Llc | Indicating parallel operations with user-visible events |
| US9208050B2 (en) | 2010-07-21 | 2015-12-08 | Hewlett-Packard Development Company, L.P. | Methods and apparatus to manage system performance information |
| WO2012038949A1 (en)* | 2010-08-09 | 2012-03-29 | Neebula Systems Ltd. | System and method for storing a skeleton representation of an application in a computerized organization |
| US8655805B2 (en) | 2010-08-30 | 2014-02-18 | International Business Machines Corporation | Method for classification of objects in a graph data stream |
| US8650564B2 (en)* | 2010-10-19 | 2014-02-11 | Vmware, Inc. | Method and system for synchronizing fault-tolerant virtual machines and adjusting CPU resource limit based on execution latency |
| US9378111B2 (en) | 2010-11-11 | 2016-06-28 | Sap Se | Method and system for easy correlation between monitored metrics and alerts |
| US8842119B2 (en) | 2010-11-17 | 2014-09-23 | Hewlett-Packard Development Company, L.P. | Displaying system performance information |
| WO2012086444A1 (en) | 2010-12-24 | 2012-06-28 | 日本電気株式会社 | Monitoring data analysis device, monitoring data analysis method, and monitoring data analysis program |
| US20120174001A1 (en) | 2010-12-31 | 2012-07-05 | Itschak Friedman | Graphically based hierarchical method for documenting items of evidence genealogy |
| US9195509B2 (en)* | 2011-01-05 | 2015-11-24 | International Business Machines Corporation | Identifying optimal platforms for workload placement in a networked computing environment |
| US9171079B2 (en) | 2011-01-28 | 2015-10-27 | Cisco Technology, Inc. | Searching sensor data |
| US8412696B2 (en) | 2011-01-31 | 2013-04-02 | Splunk Inc. | Real time searching and reporting |
| US8589403B2 (en) | 2011-02-28 | 2013-11-19 | Splunk Inc. | Compressed journaling in event tracking files for metadata recovery and replication |
| US9053221B2 (en) | 2011-03-04 | 2015-06-09 | International Business Machines Corporation | Promotion of performance parameters in distributed data processing environment |
| US8438427B2 (en) | 2011-04-08 | 2013-05-07 | Ca, Inc. | Visualizing relationships between a transaction trace graph and a map of logical subsystems |
| US8631099B2 (en)* | 2011-05-27 | 2014-01-14 | Red Hat, Inc. | Systems and methods for cloud deployment engine for selective workload migration or federation based on workload conditions |
| US9176638B2 (en) | 2011-08-26 | 2015-11-03 | Citrix Systems, Inc. | User interface for large scale system monitoring |
| US8850512B2 (en) | 2011-10-13 | 2014-09-30 | Mcafee, Inc. | Security assessment of virtual machine environments |
| US20130097183A1 (en) | 2011-10-14 | 2013-04-18 | Zenoss, Inc. | Method and apparatus for analyzing a root cause of a service impact in a virtualized environment |
| WO2013057602A1 (en) | 2011-10-19 | 2013-04-25 | International Business Machines Corporation | Application switching in graphical operating system |
| US8655686B2 (en) | 2011-10-24 | 2014-02-18 | Hartford Fire Insurance Company | System and method for providing supplemental bundled insurance |
| US8793118B2 (en) | 2011-11-01 | 2014-07-29 | PES School of Engineering | Adaptive multimodal communication assist system |
| US9356839B2 (en) | 2011-12-09 | 2016-05-31 | Riverbed Technology, Inc. | Policy aggregation for computing network health |
| US8838578B2 (en) | 2011-12-12 | 2014-09-16 | Sap Se | Interactive query plan visualization and optimization |
| US20140317286A1 (en) | 2011-12-15 | 2014-10-23 | Hitachi, Ltd. | Monitoring computer and method |
| US8713541B2 (en) | 2011-12-29 | 2014-04-29 | Sap Ag | Model matching for trace link generation |
| EP2645257A3 (en) | 2012-03-29 | 2014-06-18 | Prelert Ltd. | System and method for visualisation of behaviour within computer infrastructure |
| US9098578B2 (en) | 2012-04-17 | 2015-08-04 | Red Hat Israel, Ltd. | Interactive search monitoring in a virtual machine environment |
| US9239749B2 (en) | 2012-05-04 | 2016-01-19 | Paraccel Llc | Network fault detection and reconfiguration |
| US9027024B2 (en)* | 2012-05-09 | 2015-05-05 | Rackspace Us, Inc. | Market-based virtual machine allocation |
| US8516008B1 (en) | 2012-05-18 | 2013-08-20 | Splunk Inc. | Flexible schema column store |
| WO2013184093A1 (en) | 2012-06-04 | 2013-12-12 | Hewlett-Packard Development Company, L.P. | User-defined loading of data onto a database |
| US9766962B2 (en) | 2012-06-07 | 2017-09-19 | Vmware, Inc. | Correlating performance degradation of applications to specific changes made to applications |
| US20140047342A1 (en) | 2012-08-07 | 2014-02-13 | Advanced Micro Devices, Inc. | System and method for allocating a cluster of nodes for a cloud computing system based on hardware characteristics |
| US20140059488A1 (en) | 2012-08-21 | 2014-02-27 | Sap Ag | System and method for viewing selected descendant nodes in a tree hierarchy displayed in tabular form |
| US9582585B2 (en) | 2012-09-07 | 2017-02-28 | Splunk Inc. | Discovering fields to filter data returned in response to a search |
| US9753909B2 (en) | 2012-09-07 | 2017-09-05 | Splunk, Inc. | Advanced field extractor with multiple positive examples |
| US9594814B2 (en) | 2012-09-07 | 2017-03-14 | Splunk Inc. | Advanced field extractor with modification of an extracted field |
| US9384056B2 (en) | 2012-09-11 | 2016-07-05 | Red Hat Israel, Ltd. | Virtual resource allocation and resource and consumption management |
| US9047352B1 (en) | 2012-09-28 | 2015-06-02 | Emc Corporation | Centralized searching in a data storage environment |
| US10395215B2 (en) | 2012-10-19 | 2019-08-27 | International Business Machines Corporation | Interpretation of statistical results |
| US9294362B2 (en) | 2012-10-22 | 2016-03-22 | International Business Machines Corporation | Adjusting quality of service in a cloud environment based on application usage |
| US20140201642A1 (en) | 2013-01-12 | 2014-07-17 | Lyatiss, Inc. | User interface for visualizing resource performance and managing resources in cloud or distributed systems |
| US9154397B2 (en) | 2013-03-15 | 2015-10-06 | Microsoft Technology Licensing, Llc | Methods and computer program products for transaction relationships between application servers |
| US9164786B2 (en) | 2013-04-30 | 2015-10-20 | Splunk Inc. | Determining performance states of parent components in a virtual-machine environment based on performance states of related child components during a time period |
| US10225136B2 (en) | 2013-04-30 | 2019-03-05 | Splunk Inc. | Processing of log data and performance data obtained via an application programming interface (API) |
| US8904389B2 (en) | 2013-04-30 | 2014-12-02 | Splunk Inc. | Determining performance states of components in a virtual machine environment based on performance states of related subcomponents |
| US10353957B2 (en) | 2013-04-30 | 2019-07-16 | Splunk Inc. | Processing of performance data and raw log data from an information technology environment |
| US8683467B2 (en) | 2013-04-30 | 2014-03-25 | Splunk Inc. | Determining performance states of parent components in a virtual-machine environment based on performance states of related child components |
| US10318541B2 (en) | 2013-04-30 | 2019-06-11 | Splunk Inc. | Correlating log data with performance measurements having a specified relationship to a threshold value |
| US8972992B2 (en) | 2013-04-30 | 2015-03-03 | Splunk Inc. | Proactive monitoring tree with state distribution ring |
| US9495187B2 (en) | 2013-04-30 | 2016-11-15 | Splunk, Inc. | Interactive, top-down presentation of the architecture and performance of a hypervisor environment |
| US9142049B2 (en) | 2013-04-30 | 2015-09-22 | Splunk Inc. | Proactive monitoring tree providing distribution stream chart with branch overlay |
| US10614132B2 (en) | 2013-04-30 | 2020-04-07 | Splunk Inc. | GUI-triggered processing of performance data and log data from an information technology environment |
| US10997191B2 (en) | 2013-04-30 | 2021-05-04 | Splunk Inc. | Query-triggered processing of performance data and log data from an information technology environment |
| US9185007B2 (en) | 2013-04-30 | 2015-11-10 | Splunk Inc. | Proactive monitoring tree with severity state sorting |
| US9015716B2 (en) | 2013-04-30 | 2015-04-21 | Splunk Inc. | Proactive monitoring tree with node pinning for concurrent node comparisons |
| US20140324862A1 (en) | 2013-04-30 | 2014-10-30 | Splunk Inc. | Correlation for user-selected time ranges of values for performance metrics of components in an information-technology environment with log data from that information-technology environment |
| US10019496B2 (en) | 2013-04-30 | 2018-07-10 | Splunk Inc. | Processing of performance data and log data from an information technology environment by using diverse data stores |
| US10346357B2 (en) | 2013-04-30 | 2019-07-09 | Splunk Inc. | Processing of performance data and structure data from an information technology environment |
| US9465523B2 (en) | 2013-06-27 | 2016-10-11 | Sap Se | Visual exploration of multidimensional data |
| US9973392B2 (en) | 2013-10-18 | 2018-05-15 | Microsoft Technology Licensing, Llc | Hierarchical network analysis service |
| US20150143180A1 (en) | 2013-11-21 | 2015-05-21 | Microsoft Corporation | Validating software characteristics |
| US10133806B2 (en) | 2014-07-31 | 2018-11-20 | Splunk Inc. | Search result replication in a search head cluster |
| US9245057B1 (en) | 2014-10-09 | 2016-01-26 | Splunk Inc. | Presenting a graphical visualization along a time-based graph lane using key performance indicators derived from machine data |
| US9158811B1 (en) | 2014-10-09 | 2015-10-13 | Splunk, Inc. | Incident review interface |
| US9130832B1 (en) | 2014-10-09 | 2015-09-08 | Splunk, Inc. | Creating entity definition from a file |
| US9146962B1 (en) | 2014-10-09 | 2015-09-29 | Splunk, Inc. | Identifying events using informational fields |
- 2013
- 2013-04-30USUS13/874,423patent/US8904389B2/enactiveActive
- 2014
- 2014-10-30USUS14/529,019patent/US10114663B2/enactiveActive
- 2017
- 2017-04-28USUS15/582,108patent/US10776140B2/enactiveActive
- 2018
- 2018-10-29USUS16/174,261patent/US10929163B2/enactiveActive
- 2021
- 2021-01-20USUS17/153,033patent/US20210173683A1/ennot_activeAbandoned
Patent Citations (25)
| Publication number | Priority date | Publication date | Assignee | Title |
|---|---|---|---|---|
| US5751965A (en) | 1996-03-21 | 1998-05-12 | Cabletron System, Inc. | Network connection status monitor and display |
| US20120278292A1 (en) | 2000-08-17 | 2012-11-01 | Emc Corporation | Method and apparatus for managing and archiving performance information relating to storage system |
| US20020154175A1 (en) | 2001-01-04 | 2002-10-24 | James Abello | System and method for visualizing massive multi-digraphs |
| US20040169688A1 (en) | 2003-02-27 | 2004-09-02 | Microsoft Corporation | Multi-directional display and navigation of hierarchical data and optimization of display area consumption |
| US7546553B2 (en) | 2003-07-28 | 2009-06-09 | Sap Ag | Grid landscape component |
| US20050289540A1 (en)* | 2004-06-24 | 2005-12-29 | Lu Nguyen | Providing on-demand capabilities using virtual machines and clustering processes |
| US20060153097A1 (en) | 2005-01-10 | 2006-07-13 | Microsoft Corporation | System and methods for inline property editing in tree view based editors |
| US20120221314A1 (en)* | 2006-05-17 | 2012-08-30 | Quest Software, Inc. | Model-based systems and methods for monitoring resources |
| US7580938B1 (en)* | 2006-06-29 | 2009-08-25 | Emc Corporation | Methods and apparatus facilitating efficient display of data |
| US7580944B2 (en) | 2006-07-27 | 2009-08-25 | Yahoo! Inc. | Business intelligent architecture system and method |
| US20090172666A1 (en)* | 2007-12-31 | 2009-07-02 | Netapp, Inc. | System and method for automatic storage load balancing in virtual server environments |
| US20120284713A1 (en)* | 2008-02-13 | 2012-11-08 | Quest Software, Inc. | Systems and methods for analyzing performance of virtual environments |
| US20090237404A1 (en)* | 2008-03-20 | 2009-09-24 | Vmware, Inc. | Graphical display for illustrating effectiveness of resource management and resource balancing |
| US20100223619A1 (en)* | 2009-02-27 | 2010-09-02 | International Business Machines Corporation | Visualization-centric performance-based volume allocation |
| US20110161851A1 (en)* | 2009-12-31 | 2011-06-30 | International Business Machines Corporation | Visualization and consolidation of virtual machines in a virtualized data center |
| US20110261055A1 (en)* | 2010-04-21 | 2011-10-27 | Vmware, Inc. | Method and Apparatus for Visualizing the Health of Datacenter Objects |
| US20120036484A1 (en)* | 2010-08-09 | 2012-02-09 | Microsoft Corporation | Relationship visualization and graphical interaction model in it client management |
| US20120174097A1 (en)* | 2011-01-04 | 2012-07-05 | Host Dynamics Ltd. | Methods and systems of managing resources allocated to guest virtual machines |
| US20120216135A1 (en)* | 2011-02-22 | 2012-08-23 | Vmware, Inc. | User interface for managing a virtualized computing environment |
| US20120311153A1 (en) | 2011-05-31 | 2012-12-06 | Morgan Christopher Edwin | Systems and methods for detecting resource consumption events over sliding intervals in cloud-based network |
| US20120311475A1 (en)* | 2011-05-31 | 2012-12-06 | Vmware, Inc. | User interface for managing a virtual computing environment |
| US20130007261A1 (en) | 2011-07-01 | 2013-01-03 | Cisco Technology, Inc. | Virtual data center monitoring |
| US20130055092A1 (en)* | 2011-08-25 | 2013-02-28 | Vmware, Inc. | User interface for networks including virtual machines |
| US20130124714A1 (en)* | 2011-11-11 | 2013-05-16 | Vmware, Inc. | Visualization of combined performance metrics |
| US20130300747A1 (en)* | 2012-05-11 | 2013-11-14 | Vmware, Inc. | Multi-dimensional visualization tool for browsing and troubleshooting at scale |
Non-Patent Citations (7)
| Title |
|---|
| Foglight for Virtualization retrieved from quest.com/foglight-for-virtualization-free-edition/ on Sep. 30, 2013, 1 page. |
| Non-Final Office Action of Aug. 26, 2013 for U.S. Appl. No. 13/874,441, 10 pages. |
| Non-Final Office Action of Aug. 8, 2013 for U.S. Appl. No. 13/874,434, 10 pages. |
| Non-Final Office Action of Jul. 26, 2013 for U.S. Appl. No. 13/874,448, 13 pages. |
| U.S. Appl. No. 13/874,441, filed Apr. 30, 2013, Advisory Action, Mar. 25, 2014. |
| U.S. Appl. No. 13/874,448, filed Apr. 30, 2013, Final Office Action, Mar. 25, 2014. |
| vCenter Operations Manager 5.7.2 retrieved from vmware.com/support/pubs/vcops-pubs.html on Sep. 30, 2013, 2 pages. |
Cited By (56)
| Publication number | Priority date | Publication date | Assignee | Title |
|---|---|---|---|---|
| US10740313B2 (en) | 2006-10-05 | 2020-08-11 | Splunk Inc. | Storing events associated with a time stamp extracted from log data and performing a search on the events and data that is not log data |
| US11947513B2 (en) | 2006-10-05 | 2024-04-02 | Splunk Inc. | Search phrase processing |
| US11561952B2 (en) | 2006-10-05 | 2023-01-24 | Splunk Inc. | Storing events derived from log data and performing a search on the events and data that is not log data |
| US11550772B2 (en) | 2006-10-05 | 2023-01-10 | Splunk Inc. | Time series search phrase processing |
| US11537585B2 (en) | 2006-10-05 | 2022-12-27 | Splunk Inc. | Determining time stamps in machine data derived events |
| US11526482B2 (en) | 2006-10-05 | 2022-12-13 | Splunk Inc. | Determining timestamps to be associated with events in machine data |
| US9747316B2 (en) | 2006-10-05 | 2017-08-29 | Splunk Inc. | Search based on a relationship between log data and data from a real-time monitoring environment |
| US11249971B2 (en) | 2006-10-05 | 2022-02-15 | Splunk Inc. | Segmenting machine data using token-based signatures |
| US9922067B2 (en) | 2006-10-05 | 2018-03-20 | Splunk Inc. | Storing log data as events and performing a search on the log data and data obtained from a real-time monitoring environment |
| US9928262B2 (en) | 2006-10-05 | 2018-03-27 | Splunk Inc. | Log data time stamp extraction and search on log data real-time monitoring environment |
| US11144526B2 (en) | 2006-10-05 | 2021-10-12 | Splunk Inc. | Applying time-based search phrases across event data |
| US9996571B2 (en) | 2006-10-05 | 2018-06-12 | Splunk Inc. | Storing and executing a search on log data and data obtained from a real-time monitoring environment |
| US10977233B2 (en) | 2006-10-05 | 2021-04-13 | Splunk Inc. | Aggregating search results from a plurality of searches executed across time series data |
| US10891281B2 (en) | 2006-10-05 | 2021-01-12 | Splunk Inc. | Storing events derived from log data and performing a search on the events and data that is not log data |
| US10747742B2 (en) | 2006-10-05 | 2020-08-18 | Splunk Inc. | Storing log data and performing a search on the log data and data that is not log data |
| US10614132B2 (en) | 2013-04-30 | 2020-04-07 | Splunk Inc. | GUI-triggered processing of performance data and log data from an information technology environment |
| US10877987B2 (en) | 2013-04-30 | 2020-12-29 | Splunk Inc. | Correlating log data with performance measurements using a threshold value |
| US10243818B2 (en) | 2013-04-30 | 2019-03-26 | Splunk Inc. | User interface that provides a proactive monitoring tree with state distribution ring |
| US10310708B2 (en) | 2013-04-30 | 2019-06-04 | Splunk Inc. | User interface that facilitates node pinning for a proactive monitoring tree |
| US10318541B2 (en) | 2013-04-30 | 2019-06-11 | Splunk Inc. | Correlating log data with performance measurements having a specified relationship to a threshold value |
| US10346357B2 (en) | 2013-04-30 | 2019-07-09 | Splunk Inc. | Processing of performance data and structure data from an information technology environment |
| US10353957B2 (en) | 2013-04-30 | 2019-07-16 | Splunk Inc. | Processing of performance data and raw log data from an information technology environment |
| US10379895B2 (en) | 2013-04-30 | 2019-08-13 | Splunk Inc. | Systems and methods for determining states of user-selected parent components in a modifiable, hierarchical computing environment based on performance states of related child components |
| US12217075B1 (en) | 2013-04-30 | 2025-02-04 | Splunk Inc. | Interface for presenting performance data for hierarchical networked components represented in an expandable visualization of nodes |
| US10469344B2 (en) | 2013-04-30 | 2019-11-05 | Splunk Inc. | Systems and methods for monitoring and analyzing performance in a computer system with state distribution ring |
| US10515469B2 (en) | 2013-04-30 | 2019-12-24 | Splunk Inc. | Proactive monitoring tree providing pinned performance information associated with a selected node |
| US10523538B2 (en) | 2013-04-30 | 2019-12-31 | Splunk Inc. | User interface that provides a proactive monitoring tree with severity state sorting |
| US9495187B2 (en)* | 2013-04-30 | 2016-11-15 | Splunk, Inc. | Interactive, top-down presentation of the architecture and performance of a hypervisor environment |
| US10592522B2 (en) | 2013-04-30 | 2020-03-17 | Splunk Inc. | Correlating performance data and log data using diverse data stores |
| US20130247044A1 (en)* | 2013-04-30 | 2013-09-19 | Splunk Inc. | Interactive architecture-base presentation of hypervisor performance |
| US9733974B2 (en) | 2013-04-30 | 2017-08-15 | Splunk Inc. | Systems and methods for determining parent states of parent components in a virtual-machine environment based on performance states of related child components and component state criteria during a user-selected time period |
| US10225136B2 (en) | 2013-04-30 | 2019-03-05 | Splunk Inc. | Processing of log data and performance data obtained via an application programming interface (API) |
| US10205643B2 (en) | 2013-04-30 | 2019-02-12 | Splunk Inc. | Systems and methods for monitoring and analyzing performance in a computer system with severity-state sorting |
| US10761687B2 (en) | 2013-04-30 | 2020-09-01 | Splunk Inc. | User interface that facilitates node pinning for monitoring and analysis of performance in a computing environment |
| US10776140B2 (en) | 2013-04-30 | 2020-09-15 | Splunk Inc. | Systems and methods for automatically characterizing performance of a hypervisor system |
| US10877986B2 (en) | 2013-04-30 | 2020-12-29 | Splunk Inc. | Obtaining performance data via an application programming interface (API) for correlation with log data |
| US20190073233A1 (en)* | 2013-04-30 | 2019-03-07 | Splunk Inc. | Method and system for dynamically monitoring performance of a multi-component computing environment via user-selectable nodes |
| US10114663B2 (en) | 2013-04-30 | 2018-10-30 | Splunk Inc. | Displaying state information for computing nodes in a hierarchical computing environment |
| US10929163B2 (en)* | 2013-04-30 | 2021-02-23 | Splunk Inc. | Method and system for dynamically monitoring performance of a multi-component computing environment via user-selectable nodes |
| US10019496B2 (en) | 2013-04-30 | 2018-07-10 | Splunk Inc. | Processing of performance data and log data from an information technology environment by using diverse data stores |
| US10997191B2 (en) | 2013-04-30 | 2021-05-04 | Splunk Inc. | Query-triggered processing of performance data and log data from an information technology environment |
| US11003475B2 (en) | 2013-04-30 | 2021-05-11 | Splunk Inc. | Interface for presenting performance data for hierarchical networked components represented in an expandable visualization of nodes |
| US20210173683A1 (en)* | 2013-04-30 | 2021-06-10 | Splunk Inc. | Automatic reassignment of tasks to different virtual machines |
| US11119982B2 (en) | 2013-04-30 | 2021-09-14 | Splunk Inc. | Correlation of performance data and structure data from an information technology environment |
| US9959015B2 (en) | 2013-04-30 | 2018-05-01 | Splunk Inc. | Systems and methods for monitoring and analyzing performance in a computer system with node pinning for concurrent comparison of nodes |
| US11163599B2 (en)* | 2013-04-30 | 2021-11-02 | Splunk Inc. | Determination of performance state of a user-selected parent component in a hierarchical computing environment based on performance states of related child components |
| US11250068B2 (en) | 2013-04-30 | 2022-02-15 | Splunk Inc. | Processing of performance data and raw log data from an information technology environment using search criterion input via a graphical user interface |
| US11416278B2 (en) | 2014-09-23 | 2022-08-16 | Splunk Inc. | Presenting hypervisor data for a virtual machine with associated operating system data |
| US10664298B2 (en) | 2014-09-23 | 2020-05-26 | Splunk Inc. | Presenting hypervisor data for a virtual machine with associated operating system data |
| US9471362B2 (en)* | 2014-09-23 | 2016-10-18 | Splunk Inc. | Correlating hypervisor data for a virtual machine with associated operating system data |
| US9760473B2 (en)* | 2014-10-02 | 2017-09-12 | Institute For Information Industry | System and method for visualizing software programs |
| US20160098272A1 (en)* | 2014-10-02 | 2016-04-07 | Institute For Information Industry | System and method for visualizing software programs |
| US10536514B2 (en)* | 2015-01-22 | 2020-01-14 | Alibaba Group Holding Limited | Method and apparatus of processing retransmission request in distributed computing |
| US20160219100A1 (en)* | 2015-01-22 | 2016-07-28 | Alibaba Group Holding Limited | Method and Apparatus of Processing Retransmission Request in Distributed Computing |
| US10382380B1 (en)* | 2016-11-17 | 2019-08-13 | Amazon Technologies, Inc. | Workload management service for first-in first-out queues for network-accessible queuing and messaging services |
| US12367125B1 (en)* | 2024-09-18 | 2025-07-22 | Parry Labs, Llc | Apparatus and method for evaluating software performance |
Also Published As
| Publication number | Publication date |
|---|---|
| US10929163B2 (en) | 2021-02-23 |
| US20210173683A1 (en) | 2021-06-10 |
| US10114663B2 (en) | 2018-10-30 |
| US20170255481A1 (en) | 2017-09-07 |
| US20130239111A1 (en) | 2013-09-12 |
| US20190073233A1 (en) | 2019-03-07 |
| US20150089503A1 (en) | 2015-03-26 |
| US10776140B2 (en) | 2020-09-15 |
Similar Documents
| Publication | Publication Date | Title |
|---|---|---|
| US12217075B1 (en) | Interface for presenting performance data for hierarchical networked components represented in an expandable visualization of nodes | |
| US20210173683A1 (en) | Automatic reassignment of tasks to different virtual machines | |
| US11163599B2 (en) | Determination of performance state of a user-selected parent component in a hierarchical computing environment based on performance states of related child components | |
| US8683467B2 (en) | Determining performance states of parent components in a virtual-machine environment based on performance states of related child components | |
| US10877987B2 (en) | Correlating log data with performance measurements using a threshold value | |
| US11782989B1 (en) | Correlating data based on user-specified search criteria | |
| US10877986B2 (en) | Obtaining performance data via an application programming interface (API) for correlation with log data | |
| US10592522B2 (en) | Correlating performance data and log data using diverse data stores | |
| US10614132B2 (en) | GUI-triggered processing of performance data and log data from an information technology environment | |
| US11119982B2 (en) | Correlation of performance data and structure data from an information technology environment | |
| US10997191B2 (en) | Query-triggered processing of performance data and log data from an information technology environment | |
| US20140324862A1 (en) | Correlation for user-selected time ranges of values for performance metrics of components in an information-technology environment with log data from that information-technology environment |
Legal Events
| Date | Code | Title | Description |
|---|---|---|---|
| AS | Assignment | Owner name:SPLUNK INC., CALIFORNIA Free format text:ASSIGNMENT OF ASSIGNORS INTEREST;ASSIGNORS:BINGHAM, BRIAN;FLETCHER, TRISTAN;REEL/FRAME:030323/0580 Effective date:20130430 Owner name:SPLUNK, INC., CALIFORNIA Free format text:ASSIGNMENT OF ASSIGNORS INTEREST;ASSIGNORS:BINGHAM, BRIAN;FLETCHER, TRISTAN;REEL/FRAME:030323/0570 Effective date:20130430 | |
| STCF | Information on status: patent grant | Free format text:PATENTED CASE | |
| FEPP | Fee payment procedure | Free format text:PAYOR NUMBER ASSIGNED (ORIGINAL EVENT CODE: ASPN); ENTITY STATUS OF PATENT OWNER: LARGE ENTITY | |
| MAFP | Maintenance fee payment | Free format text:PAYMENT OF MAINTENANCE FEE, 4TH YEAR, LARGE ENTITY (ORIGINAL EVENT CODE: M1551) Year of fee payment:4 | |
| MAFP | Maintenance fee payment | Free format text:PAYMENT OF MAINTENANCE FEE, 8TH YEAR, LARGE ENTITY (ORIGINAL EVENT CODE: M1552); ENTITY STATUS OF PATENT OWNER: LARGE ENTITY Year of fee payment:8 | |
| AS | Assignment | Owner name:SPLUNK LLC, WASHINGTON Free format text:CHANGE OF NAME;ASSIGNOR:SPLUNK INC.;REEL/FRAME:069825/0782 Effective date:20240923 | |
| AS | Assignment | Owner name:CISCO TECHNOLOGY, INC., CALIFORNIA Free format text:ASSIGNMENT OF ASSIGNORS INTEREST;ASSIGNOR:SPLUNK LLC;REEL/FRAME:072173/0058 Effective date:20250722 Owner name:SPLUNK LLC, CALIFORNIA Free format text:CHANGE OF NAME;ASSIGNOR:SPLUNK INC.;REEL/FRAME:072170/0599 Effective date:20240923 |