US8758245B2 - Systems and methods for pattern recognition in diabetes management - Google Patents
Systems and methods for pattern recognition in diabetes managementDownload PDFInfo
- Publication number
- US8758245B2 US8758245B2US11/688,639US68863907AUS8758245B2US 8758245 B2US8758245 B2US 8758245B2US 68863907 AUS68863907 AUS 68863907AUS 8758245 B2US8758245 B2US 8758245B2
- Authority
- US
- United States
- Prior art keywords
- glucose
- incidence
- meal
- hypoglycemic
- sub
- Prior art date
- Legal status (The legal status is an assumption and is not a legal conclusion. Google has not performed a legal analysis and makes no representation as to the accuracy of the status listed.)
- Active, expires
Links
Images


Classifications
- G—PHYSICS
- G16—INFORMATION AND COMMUNICATION TECHNOLOGY [ICT] SPECIALLY ADAPTED FOR SPECIFIC APPLICATION FIELDS
- G16H—HEALTHCARE INFORMATICS, i.e. INFORMATION AND COMMUNICATION TECHNOLOGY [ICT] SPECIALLY ADAPTED FOR THE HANDLING OR PROCESSING OF MEDICAL OR HEALTHCARE DATA
- G16H20/00—ICT specially adapted for therapies or health-improving plans, e.g. for handling prescriptions, for steering therapy or for monitoring patient compliance
- G16H20/10—ICT specially adapted for therapies or health-improving plans, e.g. for handling prescriptions, for steering therapy or for monitoring patient compliance relating to drugs or medications, e.g. for ensuring correct administration to patients
- G—PHYSICS
- G01—MEASURING; TESTING
- G01N—INVESTIGATING OR ANALYSING MATERIALS BY DETERMINING THEIR CHEMICAL OR PHYSICAL PROPERTIES
- G01N33/00—Investigating or analysing materials by specific methods not covered by groups G01N1/00 - G01N31/00
- G01N33/48—Biological material, e.g. blood, urine; Haemocytometers
- G01N33/50—Chemical analysis of biological material, e.g. blood, urine; Testing involving biospecific ligand binding methods; Immunological testing
- G01N33/66—Chemical analysis of biological material, e.g. blood, urine; Testing involving biospecific ligand binding methods; Immunological testing involving blood sugars, e.g. galactose
- G—PHYSICS
- G06—COMPUTING OR CALCULATING; COUNTING
- G06F—ELECTRIC DIGITAL DATA PROCESSING
- G06F17/00—Digital computing or data processing equipment or methods, specially adapted for specific functions
- G06F17/10—Complex mathematical operations
- G06F17/18—Complex mathematical operations for evaluating statistical data, e.g. average values, frequency distributions, probability functions, regression analysis
- G—PHYSICS
- G16—INFORMATION AND COMMUNICATION TECHNOLOGY [ICT] SPECIALLY ADAPTED FOR SPECIFIC APPLICATION FIELDS
- G16H—HEALTHCARE INFORMATICS, i.e. INFORMATION AND COMMUNICATION TECHNOLOGY [ICT] SPECIALLY ADAPTED FOR THE HANDLING OR PROCESSING OF MEDICAL OR HEALTHCARE DATA
- G16H15/00—ICT specially adapted for medical reports, e.g. generation or transmission thereof
- G—PHYSICS
- G16—INFORMATION AND COMMUNICATION TECHNOLOGY [ICT] SPECIALLY ADAPTED FOR SPECIFIC APPLICATION FIELDS
- G16H—HEALTHCARE INFORMATICS, i.e. INFORMATION AND COMMUNICATION TECHNOLOGY [ICT] SPECIALLY ADAPTED FOR THE HANDLING OR PROCESSING OF MEDICAL OR HEALTHCARE DATA
- G16H50/00—ICT specially adapted for medical diagnosis, medical simulation or medical data mining; ICT specially adapted for detecting, monitoring or modelling epidemics or pandemics
- G16H50/20—ICT specially adapted for medical diagnosis, medical simulation or medical data mining; ICT specially adapted for detecting, monitoring or modelling epidemics or pandemics for computer-aided diagnosis, e.g. based on medical expert systems
- G—PHYSICS
- G16—INFORMATION AND COMMUNICATION TECHNOLOGY [ICT] SPECIALLY ADAPTED FOR SPECIFIC APPLICATION FIELDS
- G16H—HEALTHCARE INFORMATICS, i.e. INFORMATION AND COMMUNICATION TECHNOLOGY [ICT] SPECIALLY ADAPTED FOR THE HANDLING OR PROCESSING OF MEDICAL OR HEALTHCARE DATA
- G16H40/00—ICT specially adapted for the management or administration of healthcare resources or facilities; ICT specially adapted for the management or operation of medical equipment or devices
- G16H40/60—ICT specially adapted for the management or administration of healthcare resources or facilities; ICT specially adapted for the management or operation of medical equipment or devices for the operation of medical equipment or devices
- G16H40/67—ICT specially adapted for the management or administration of healthcare resources or facilities; ICT specially adapted for the management or operation of medical equipment or devices for the operation of medical equipment or devices for remote operation
Definitions
- a diabetes management system or processmay be used to analyze and recognize patterns for a large number of glucose concentration measurements and other physiological or external parameters related to the glycemia of a patient.
- a method of monitoring glycemia in a patientmay include storing a patient's data on a suitable device, such as, for example, a glucose meter.
- the patient's datamay include blood glucose concentration measurements.
- the diabetes management system or processmay be installed on, but is not limited to, a personal computer, an insulin pen, an insulin pump, or a glucose meter.
- the diabetes management system or processmay identify a plurality of pattern types from the data including a testing/dosing pattern, a hypoglycemic pattern, a hyperglycemic pattern, a blood glucose variability pattern, and a comparative pattern. After identifying a particular pattern with the data management system or process, a warning message may be displayed on a screen of a personal computer or a glucose meter. Other messages can also be provided to ensure compliance of any prescribed diabetes regiments or to guide the patient in managing the patient's diabetes.
- a method of monitoring glycemia in a patientis provided.
- the methodcan be achieved by storing a patient's data that includes blood glucose concentration measurements; generating a plurality of patterns including multiple blood glucose variability patterns; and displaying at least one of the multiple blood glucose variability patterns over a predetermined time period.
- a method of monitoring glycemia in a patientis provided.
- the methodcan be achieved by storing a patient's data that includes blood glucose concentration measurements; generating statistically significant patterns from the patient's data, the patterns indicative of hypoglycemia, hyperglycemia, or excessive blood glucose variability by time of day, by day in a week, both by time of day and day of week, or at different time intervals; calculating standard error and Z test with data from the table; and displaying a message upon the Z test is greater than a predetermined value indicative of a pattern of glycemia outside at least a predetermined range for such pattern.
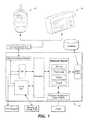
- FIG. 1illustrates a schematic of a diabetes management system that includes a glucose meter, an insulin pump, and a personal computer;
- FIG. 2illustrates a schematic of a diabetes management rules engine
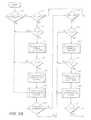
- FIGS. 3A and 3Billustrate a flow chart of the diabetes management system or process system
- FIG. 4Aillustrates a flow chart for analyzing a plurality of glucose concentration measurements for a pattern that may indicate an incidence of hypoglycemia
- FIG. 4Billustrates a flow chart for analyzing a plurality of glucose concentration measurements for a pattern that may indicate a hypoglycemic pattern by time slot;
- FIG. 4Cillustrates an exemplary chi-squared table that can be used to determine statistically significant patterns based on a patient's data.
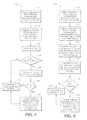
- FIG. 5illustrates a flow chart for analyzing a plurality of glucose concentration measurements for a pattern that may indicate a hypoglycemic pattern by day of week;
- FIG. 6illustrates a flow chart for analyzing a plurality of glucose concentration measurements for a pattern that may indicate an incidence of hypoglycemia by meal
- FIG. 7Aillustrates a flow chart for analyzing a plurality of glucose concentration measurements for a pattern that may indicate an incidence of hyperglycemia
- FIG. 7Billustrates a flow chart for analyzing a plurality of glucose concentration measurements for a pattern that may indicate a hyperglycemic pattern by time slot;
- FIG. 8illustrates a flow chart for analyzing a plurality of glucose concentration measurements for a pattern that may indicate a hyperglycemic pattern by day of week;
- FIG. 9illustrates a flow chart for analyzing a plurality of glucose concentration measurements for a pattern that may indicate an incidence of hyperglycemia by meal
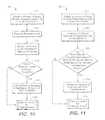
- FIG. 10illustrates a flow chart for analyzing a plurality of glucose concentration measurements for a pattern that may indicate an incidence of high blood glucose variability
- FIG. 11illustrates a flow chart for analyzing a plurality of glucose concentration measurements for a pattern that may indicate an overcorrection for hypoglycemia
- FIG. 12illustrates a flow chart for analyzing a plurality of glucose concentration measurements for a pattern that may indicate an overcorrection for hyperglycemia
- FIG. 13illustrates a flow chart for analyzing a plurality of glucose concentration measurements for a pattern that may indicate whether the frequency of glucose testing is sufficient
- FIG. 14Aillustrates a flow chart for analyzing a plurality of glucose concentration measurements for a pattern that may indicate whether the adequacy of pre-meal testing is sufficient
- FIG. 14Billustrates a flow chart for analyzing a plurality of glucose concentration measurements for a pattern that may indicate whether the adequacy of post-meal testing is sufficient
- FIG. 14Cillustrates a flow chart for analyzing a plurality of glucose concentration measurements for determining whether a user is complying with a targeted testing frequency
- FIG. 15illustrates a flow chart for analyzing a plurality of glucose concentration measurements for comparing pre-meal and post-meal glucose concentrations
- FIG. 16illustrates a flow chart for analyzing a plurality of glucose concentration measurements for comparing daytime and nighttime glucose concentrations
- FIG. 17Aillustrates a flow chart for analyzing a plurality of glucose concentration measurements for comparing previous and current hypoglycemic incidence
- FIG. 17Billustrates a flow chart for analyzing a plurality of glucose concentration measurements for comparing previous and current hyperglycemic incidence
- FIG. 18illustrates a summary report by time of day generated using an embodiment of the diabetes management system.
- FIGS. 19A and 19Billustrate a patient information sheet that was generated using an embodiment of the diabetes management system.
- FIG. 1illustrates a schematic of a diabetes management system that includes a glucose meter 10 , an insulin pump 20 , and a personal computer (PC) 30 .
- PC 30illustrated in schematic form in FIG. 1 , may have a microprocessor unit and a memory unit.
- Glucose meter 10may be configured to use a disposable test strip having a reagent such as, for example, glucose oxidase, ferricyanide, ruthamine hexamine, or combinations thereof.
- the reagent chemistryis capable of a physical transformation of glucose that allows a signal to be measured with glucose meter 10 .
- a diabetes management system or processmay be installed on the memory unit in PC 30 .
- the diabetes management system or processmay be installed on a memory unit of glucose meter 10 , insulin pump 20 , or other suitable computing device such as a personal digital assistant (PDA) or a cellular phone, i.e., any communication device with a processor and graphical user interface with a visual or audio output.
- PDApersonal digital assistant
- cellular phonei.e., any communication device with a processor and graphical user interface with a visual or audio output.
- Glucose meter 10 , insulin pump 20 , and PC 30may all have the ability to bi-directionally transfer data to each other.
- the data transfer processmay be implemented in a wired or wireless manner.
- a cablemay be used to transfer data in a wired manner through a suitable wire medium such as, for example, a universal serial bus (USB), serial port (RS232) or application specific connectors.
- the data transfer processmay also use a suitable wireless medium with a wireless protocol such as, for example, infrared (IR), radio frequency (RF), WiFi (IEEE 802.11 wireless Ethernet standards), and Bluetooth or application specific wireless protocol.
- Diabetes management system or processmay include a communications dynamic link library (DLL), a communications module, a quick print module QP, a graphical user interface (GUI), business object module, a diabetes management rules engine, a data layer module, and a database module, as illustrated in FIG. 1 .
- Diabetes management system or processmay be configured to generate reports, print reports, send reports via e-mail and fax, and to log errors via the logger, as illustrated in FIG. 1 .
- the communications DLLmay be an executable program module that allows PC 30 to recognize and communicate with glucose meter 10 and insulin pump 20 .
- the communications DLLmay allow PC 30 to communicate with several different types of glucose meters and insulin pumps and also a wide array of devices such as scales, sphygmomanometer, thermometers, pedometers, and heart rate monitors.
- the communication modulemay act as a surrogate by abstracting the lower level functionality that establishes connectivity with serial and USB devices.
- the quick print module QPmay be a sub-routine configured to cause a glucose meter to seamlessly transfer data to PC 30 and then print a data report. After an initial setup, glucose meter 10 may be connected to PC 30 with a cable. Without having to manually launch a management application or perform any additional steps, the glucose meter will transfer its data and then print the data report. Details of the quick print module QP are shown and described in U.S. patent application Ser. No. 11/142,903 filed on May 31, 2005, which is incorporated by reference in its entirety herein.
- the GUImay be a plurality of user interface screens that allow a user to configure and operate the diabetes management system or process.
- the screenscan be configured as a touch screen or a combination of a display and a keyboard or buttons.
- the business object modulemay be a central engine that will integrate and communicate with types of results, patient, preference, and reporting functionalities.
- the business object rulesmay be used by the GUI to generate results, reports, or other functionalities.
- patientincludes not only human subjects but also other mammals with indication of diabetes.
- the data layer modulemay be an abstracted data access layer, which may act as an intermediate layer between the database module and the management application.
- the data layer modulemay execute the queries on the database module and return a record set, if applicable.
- the database modulemay be a tool for storing and organizing data collected from glucose meter 10 and alternatively other devices.
- the database modulemay be installed, for example, on PC 30 , a network server or transportable memory storage device.
- the diabetes management rule enginemay include a plurality of processes, devices, or sub-routines for analyzing data from glucose meter 10 and/or insulin pump 20 .
- the plurality of sub-routinesmay apply statistical tests and triggers to analyze data so that messages can be provided to a user and/or a physician to warn about possible problem spots and/or compliance issues.
- a microprocessormay be configured to analyze data using the diabetes management rule engine.
- the diabetes management rule enginemay be configurable by a physician and/or a user.
- the diabetes management rule enginemay include a plurality of pattern recognition rules that can identify a testing/dosing pattern 400 , a hypoglycemic pattern 100 , a hyperglycemic pattern 200 , a blood glucose variability pattern 300 , a comparative pattern 500 , and an insulin pattern 600 , as illustrated in FIG. 2 .
- the testing/dosing pattern 400may include the following sub-routines, such as, for example, a frequency of glucose testing 410 , an adequacy of pre-meal testing 420 , an adequacy of post-meal testing 430 , an adequacy of glucose testing 440 , a post-meal flag prompt 450 , and a pre-meal flag prompt 460 .
- the hypoglycemic pattern 100may include the following sub-routines, such as, for example, an incidence of hypoglycemia 110 , a hypoglycemic pattern by time slot 120 , a hypoglycemic pattern by day of week 130 , and an incidence of hypoglycemia by meal 140 .
- the hyperglycemic pattern 200may include the following sub-routines such as, for example, an incidence of hyperglycemia 210 , a hyperglycemic pattern by time slot 220 , a hyperglycemic pattern by day of week 230 , and an incidence of hyperglycemia by meal 240 .
- the blood glucose variability pattern 300may include the following sub-routines such as, for example, a glucose variability range 310 , an overcorrection for hypoglycemia 320 , and an overcorrection for hyperglycemia 330 .
- the comparative pattern 500may include the following sub-routines such as, for example, a comparison of pre-meal and post-meal glucose concentrations 510 , a comparison of daytime versus nighttime glucose concentrations 520 , a comparison of previous and current hypoglycemic incidence 530 , and a comparison of previous and current hyperglycemic incidence 540 .
- the plurality of pattern recognition rulesmay include an insulin pattern 600 , a carbohydrate intake pattern 700 and a physiological pattern 800 .
- the insulin pattern 600may include the following sub-routines such as, for example, a pre-meal flag prompt by insulin 610 and a post-meal flag prompt by insulin 620 .
- FIGS. 3A and 3Billustrate a flow chart of the diabetes management system or process system.
- a plurality of glucose concentration measurementsmay be processed using incidence of hypoglycemia sub-routine 110 . If the percentage of hypoglycemic incidence Pl is greater than a predetermined threshold, then the method moves to step 111 to determine whether the percentage of hypoglycemic incidence Pl equals about 100%. If the percentage of hypoglycemic incidence Pl in step 110 is less than a pre-determined threshold, then the method moves to the incidence of hypoglycemia by meal sub-routine 140 .
- the pre-determined threshold for the incidence of hypoglycemia sub-routine 110may range from about 3% to about 15%. In the preferred embodiment, the threshold is about 5%.
- the thresholdmay be of any value as selected by a clinician or physician.
- the term “about” or “approximately” in conjunction with a numerical valuedenotes that variations in the numerical value are intended as long as the variations allow the exemplary embodiments to perform for its intended purpose.
- step 111if the hypoglycemic frequency Pl equals about 100%, then the method moves to the frequency of glucose testing sub-routine 410 . However, if the hypoglycemic frequency Pl in step 111 does not equal about 100%, then the method moves to step 112 to determine whether more than about 27 glucose concentration measurements have been collected.
- step 112if there are more than about 27 measurements, then the method moves to the hypoglycemic pattern by time slot sub-routine 120 . However, if there are not more than about 27 measurements, then the method moves to the incidence of hypoglycemia by meal sub-routine 140 .
- the sample size of 27represents approximately the minimum number of glucose measurements required to perform sub-routine 120 and is based on several assumptions including: that a user tests at least once per day; that a user tests in at least two times per day; that there are at least two categories of observed incidences that are hypoglycemic incidences and not hypoglycemic incidences; and that the at least two categories each have greater than or equal to about five incidences.
- the minimum expected number of incidencesis five for each category per time slot.
- two-time slots times two categories times five expected number of incidencesgives approximately a minimum sample size of twenty.
- the sample sizemay be greater than about 20, and preferably be greater than about 27.
- sample sizes greater than 20such as, for example, 27 can be desirable based on a balancing test between consumer expectations of having the capability of receiving accurate warnings about their glycemic patterns without having to do an excessive number of glucose measurements, and having a sufficient number of glucose measurement to ensure a relative low number of false positive and false negative results.
- the hypoglycemic pattern by time slot sub-routine 120is performed if more than about 27 glucose concentration measurements were found in step 112 .
- the methoddetermines whether the plurality of glucose concentration measurements has more than about 46 measurements, as shown in step 128 . If more than about 46 glucose concentration measurements have been collected, as shown in step 128 , then the method moves to the hypoglycemic pattern by day of week sub-routine 130 and also to the incidence of hypoglycemia by meal sub-routine 140 . If not more than about 46 glucose concentration measurements have been collected, as indicated in step 128 , then the method moves to the incidence of hypoglycemia by meal sub-routine 140 .
- the sample size of 46 measurementsis based on several assumptions that include that a user tests at least once per day; that the user tests in at least five of the seven days per week; that there are at least two categories of observed incidences that are hypoglycemic incidences and not hypoglycemic incidences; and that the at least two categories each have greater than or equal to about five incidences for the at least five days of the week.
- the minimum expected number of incidencesis five for each category per day of the week.
- five days times two categories times five expected countsgives a minimum sample size of 50.
- the sample sizemay be greater than about 50, and preferably be greater than about 46.
- sample sizes less than 50such as, for example, 46 can be desirable based on a balancing test between consumer expectations of having the capability of receiving accurate warnings about their glycemic state without having to do an excessive number of glucose measurements, and having a sufficiently number of glucose measurements to ensure a relative low number of false positive and false negative results.
- the pattern recognition rules of hyperglycemic pattern 200may be performed.
- the methodmoves to the incidence of hyperglycemia sub-routine 210 . If the percentage of hyperglycemic incidence Ph is greater than a pre-determined threshold, then the method moves to step 211 to determine whether the percentage of hyperglycemic incidence Ph equals about 100%. If the percentage of hyperglycemic incidence Ph is less than a pre-determined threshold, then the method moves to the incidence of hyperglycemia by meal sub-routine 240 .
- the pre-determined threshold for the incidence of hyperglycemia sub-routine 210may range from about 15% to about 50%.
- step 211if the hyperglycemic frequency Ph equals about 100%, then the method moves to the frequency of glucose testing sub-routine 410 . However, if the hyperglycemic frequency Ph does not equal about 100%, then the method moves to step 212 to determine whether more than about 27 glucose concentration measurements have been collected.
- step 212if there are more than about 27 measurements, then the method moves to the hyperglycemic pattern by time slot sub-routine 220 . However, if there are not more than about 27 measurements, then the method moves to the incidence of hyperglycemia by meal sub-routine 240 .
- the sample size of 27represents approximately the minimum number of glucose measurements required to perform sub-routine 120 and is based on several assumptions including: that a user tests at least once per day; that a user tests in at least two times; that there are at least two categories of observed incidences that are hyperglycemic incidences and not hyperglycemic incidences; and that the at least two categories each have greater than or equal to about five incidences.
- the minimum expected number of incidencesis five for each category per time slot.
- two-time slots times two categories times five expected number of incidencesgives approximately a minimum sample size of twenty.
- the sample sizemay be greater than about 20, and preferably be greater than about 27.
- sample sizes greater than 20such as, for example, 27 can be desirable based on a balancing test between consumer expectations of having the capability of receiving accurate warnings about their glycemic patterns without having to do an excessive number of glucose measurements, and having a sufficient number of glucose measurement to ensure a relative low number of false positive and false negative results.
- the hyperglycemic pattern by time slot sub-routine 220is performed if more than about 27 glucose concentration measurements were found in step 212 .
- the methoddetermines whether the plurality of glucose concentration measurements has more than about 46 measurements, as shown in step 228 . If more than about 46 glucose concentration measurements have been collected, as shown in step 228 , then the method moves to the hyperglycemic pattern by day of week sub-routine 230 and also to the incidence of hyperglycemia by meal sub-routine 240 . If not more than about 46 glucose concentration measurements have been collected, as indicated in step 228 , then the method moves to an incidence of hyperglycemia by meal sub-routine 240 .
- the sample size of 46 measurementsis based on several assumptions including: that a user tests at least once per day; that the user tests in at least five of the seven days per week; that there are at least two categories of observed incidences that are hyperglycemic incidences and not hyperglycemic incidences; and that the at least two categories each have greater than or equal to about five incidences for the at least five days of the week.
- the minimum expected number of incidencesis five for each category per day of the week.
- five days times two categories times five expected countsgives a minimum sample size of 50.
- the sample sizemay be greater than about 50, and preferably be greater than about 46.
- sample sizes less than 50such as, for example, 46 can be desirable based on a balancing test between consumer expectations of having the capability of receiving accurate warnings about their glycemic state without having to do an excessive number of glucose measurements, and having a sufficiently number of glucose measurements to ensure a relative low number of false positive and false negative results.
- the pattern recognition rules of variability pattern 300may be performed. That is, after performing the incidence of hyperglycemia by meal sub-routine 240 , the method moves to step 301 to determine whether more than about 14 glucose concentration measurements have been collected. If more than about 14 glucose concentration measurements have been collected, then the method moves to the glucose variability range sub-routine 310 , the overcorrection for hypoglycemia sub-routine 320 , and to the overcorrection for hyperglycemia sub-routine 330 .
- the methodmoves to the overcorrection for hypoglycemia sub-routine 320 and also to the overcorrection for hyperglycemia sub-routine 330 .
- a sample size of 14 or greatermay be selected to ensure the presence of a clinically significant pattern. Based on statistics, a sample size of 4 is sufficient to determine statistically significant difference, but a larger sample size was selected as a conservative measure to increase the likelihood of identifying a clinically significant pattern.
- variability in blood glucosecan be correlated, as will be described further herein, to a specific time period during a day, a plurality of time periods in a day, a specified day of a week, a plurality of specified days in a week, glucose testing frequency having pre-meal tests in a specific time period during a day, frequency of glucose measurements (i.e., testing) for pre-meal test for specified days of the week, glucose testing frequency having post-meal tests in a specific period during a day, frequency of glucose measurements (i.e., testing) for post-meal test for specified days of the week.
- the pattern recognition rule of testing dosing pattern 400may be performed after one of two condition are met, which are 1) the completion of the overcorrection for hyperglycemia sub-routine 330 or 2) the percentage of hyperglycemic incidence Ph or the percentage of hypoglycemic incidence Pl equals about 100%, as illustrated in step 211 and step 111 , respectively. If one of the two aforementioned conditions are met, then the method will then perform the following processes or sub-routines such as, for example, the frequency of glucose testing sub-routine 410 , the adequacy of pre-meal testing sub-routine 420 , and the adequacy of post-meal testing sub-routine 430 .
- the pattern recognition rules of comparative pattern 500will be performed.
- the methodwill determine whether the number of blood glucose concentration measurements with a pre-meal flag A and the number of blood glucose concentration measurements with a post-meal flag B are both greater than about nine, as illustrated in step 501 .
- both the number of blood glucose concentration measurements with a pre-meal flag A and the number of blood glucose concentration measurements with a post-meal flag Bhave more than about 9 flagged measurements, then the method will perform the comparison of pre-meal and post-meal glucose concentrations sub-routine 510 , the comparison of daytime and nighttime glucose concentrations sub-routine 520 , the comparison of previous and current hypoglycemic glucose incidence sub-routine 530 , and the comparison of previous and current hyperglycemic incidence sub-routine 540 .
- a sample size of 9 or greatermay be selected to ensure the presence of a clinically significant pattern. Based on statistics, a sample size of 4 is sufficient to determine statistically significant difference, but a larger sample size was selected as a conservative measure to increase the likelihood of identifying a clinically significant pattern.
- the methodwill perform the comparison of daytime and nighttime glucose concentrations sub-routine 520 , the comparison of previous and current hypoglycemic glucose incidence sub-routine 530 , and the comparison of previous and current hyperglycemic incidence sub-routine 540 .
- the methodmay be completed after performing the comparison of previous and current hyperglycemic incidence sub-routine 540 .
- the followingwill describe a more detailed description of the aforementioned processes or sub-routines ( 110 , 120 , 130 , 140 , 210 , 220 , 230 , 240 , 310 , 320 , 330 , 410 , 420 , 430 , 510 , 520 , 530 , and 540 ).
- FIG. 4Ashows a flow chart of the incidence of hypoglycemia sub-routine 110 , which may include obtaining a number of blood glucose concentration measurements over a total time period, as shown in step 113 .
- the sub-routine 110may calculate a percentage of hypoglycemic incidence Pl for a total time period by summing a number of substantially hypoglycemic blood glucose concentration measurements divided by a number of blood glucose concentration measurements collected over the total time period, as shown in step 114 .
- the total time periodcan be arbitrarily selected time duration such as, for example, hours in a day, a day, a week, a month, three months, six months, or between visits to a physicians or therapeutic regimens. Equation 1 shows an example of how to calculate percentage of hypoglycemic incidence Pl
- Equation 1the term i represents a particular recurring time interval; n is a total number of recurring time intervals; and L i is a number of substantially hypoglycemic glucose concentration measurements that occur during time interval i; and N i represents the total number of glucose concentration measurements performed during time intervals i.
- the percentage of hypoglycemic incidence Plmay be compared to a predetermined threshold.
- a messagemay be displayed indicating a high incidence of hypoglycemia if the percentage of hypoglycemic incidence Pl is greater than a pre-determined threshold, as shown in step 116 . If the percentage of hypoglycemic incidence Pl is not greater than a pre-determined threshold, then the sub-routine 110 may move to the incidence of hypoglycemia by meal sub-routine 140 .
- the pre-determined thresholdmay range from about 3% to about 15%. In the preferred embodiment, the threshold is about 5%. Alternatively, the threshold may be of any value as selected by a clinician or physician. After displaying a warning message in step 116 , the sub-routine may move to step 111 .
- a hypoglycemic pattern by time slot sub-routine 120may be used to determine if there is a high incidence of hypoglycemia occurring at a particular recurring time interval i.
- the time intervalmay recur daily and be equal to about one eighth of a day.
- the eight daily time slotsmay include before breakfast, after breakfast, before lunch, after lunch, before dinner, after dinner, bedtime, and overnight, which can be pre-defined by default management settings or customized by the user. Note that a recurring time interval may also be referred to as a time slot.
- FIG. 4Bshows a flow chart of the hypoglycemic pattern by time slot sub-routine 120 that may include obtaining a number of blood glucose measurements over a total time period in step 121 and determining a number of hypoglycemic incidences for each of the time slots in step 122 .
- the sub-routine 120determines whether the number of hypoglycemic incidence for at least one of the time slots is different using a statistical test such as, for example, a chi-squared test (as shown in a template of FIG. 4C ), and as shown in step 123 .
- the calculated chi-squared valueis compared to a chi-squared value in a suitable table, shown here as a template in FIG. 4C for a chi-squared table.
- the nomenclatures of this table in FIG. 4Care the same nomenclatures provided in the forthcoming statistical analysis technique.
- the sub-routine 120moves to step 128 . If the calculated chi-squared is greater than the chi-squared value in a table (of which a template is shown in FIG. 4C ), then the sub-routine 120 moves to perform a Z test for each time slot, as shown in step 125 .
- the Z testmay be a two-sided Z test.
- the calculated Z i valueis compared to a value of about 2.
- step 127a message indicating a high incidence of hypoglycemia has occurred at a particular time slot will be displayed, as shown in step 127 .
- the subroutine 120moves to the step 128 . If the calculated Z i is not greater than about 2, then the sub-routine 120 moves to the step 128 .
- a chi-squared testmay be used to determine if any of the time slots are statistically significantly different from each other.
- the chi-squared testmay use a confidence level ranging from about 95% to about 99%. Equation 2 shows an example of how to calculate chi-squared ⁇ 2 .
- L′ iis a number of non-hypoglycemic glucose concentration measurements that occur during time interval i.
- L i,preis a predicted number of substantially hypoglycemic glucose concentration measurements that will occur during time interval i.
- L′ i,preis a predicted number of non-hypoglycemic glucose concentration measurements that will occur during time interval i.
- the calculated ⁇ 2 valueis compared to a ⁇ 2 in a table based on a number of degrees of freedom for each of the time intervals i. If the calculated ⁇ 2 is greater than the ⁇ 2 value on the table, then at least one of the time intervals is statistically significantly different.
- L i,premay be calculated using Equation 3a.
- L′ i,premay be calculated using Equation 3b.
- the method of performing the hypoglycemic pattern by time slot sub-routine 120may further include identifying which one of the recurring time intervals i is statistically significantly different using a Z test if the chi-squared test determines that at least one of the time intervals is statistically significantly different. Equation 4 shows an example of the Z test.
- Z irepresents a Z value at a particular time interval i and SE i represents a standard error for a particular time interval i.
- SE imay be calculated using Equation 5.
- a Z i valuemay be calculated for each recurring time interval i and compared to a Z value in a table. If the Z i value for one of the recurring time intervals is greater than the Z value in the table (e.g., about two), then the particular recurring time interval i is statistically significantly different.
- the hypoglycemic pattern by day of the week sub-routine 130may be performed in a manner similar to hypoglycemic pattern by time slot sub-routine 120 .
- the time intervalsrecur weekly where there are seven time slots to represent each day of the week.
- FIG. 5shows a flow chart of the hypoglycemic pattern by day of week 130 that may include obtaining a number of blood glucose measurements over a total time period in step 131 and determining a number of hypoglycemic incidences for each day in step 132 .
- the sub-routine 130determines whether the number of hypoglycemic incidence for at least one of the days is different using a statistical test such as, for example, a chi-squared test (as shown in a template of FIG. 4C ), and as shown in step 133 .
- the calculated chi-squared valueis compared to a chi-squared value in a table, as shown in step 134 .
- step 136the calculated Z i value is compared to a value of about 2.
- step 137a message indicating a high incidence of hypoglycemia has occurred at a particular day of the week will be displayed, as shown in step 137 .
- the subroutine 130moves to the next sub-routine 140 . If the calculated Z i is not greater than about 2, then the sub-routine 120 moves to the next sub-routine 140 .
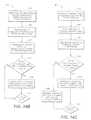
- FIG. 6shows a flow chart of the hypoglycemia by meal sub-routine 140 that may be used to determine if there is a high incidence of hypoglycemia occurring at either a pre-meal or post-meal time interval.
- the incidence of hypoglycemia by meal sub-routine 140may include obtaining a number of blood glucose concentration measurements over a total time period, as shown in step 141 .
- a number of blood glucose concentration measurements with a pre-meal tag A and post-meal tag Bmay be calculated indicating the number of blood glucose measurement performed before eating a meal and alter a meal, respectively, as shown in step 142 .
- a number of substantially hypoglycemic blood glucose concentration measurements with a pre-meal tag L A and post-meal tag L Bmay be calculated, as shown in step 143 .
- the percentage of hypoglycemic incidence having a pre-meal tag Pl A and a post-meal tag Pl Bmay be calculated, as indicated in step 144 .
- Pl Amay be determined by dividing the number of substantially hypoglycemic blood glucose concentration measurements that have the pre-meal flag L A by the number of blood glucose concentration measurements with the pre-meal tag A.
- Pl Bmay be determined by dividing the number of substantially hypoglycemic blood glucose concentration measurements that have the pre-meal flag L B by the number of blood glucose concentration measurements with a pre-meal B.
- Equations 6 and 7illustrate a mathematical embodiment on how to determine the percentage of hypoglycemic incidence having a pre-meal tag Pl A and a post-meal tag Pl B .
- the percentage of hypoglycemic incidence having a pre-meal tag Pl A and a post-meal tag Pl Bmay be compared to a pre-determined threshold, as shown in step 145 . If either Pl A or Pl B is greater than a pre-determined threshold, then a message can be displayed indicating a high incidence of hypoglycemia occurring at a pre-meal time and/or a post-meal time, as shown in step 146 . If Pl A and Pl B are not greater than a pre-determined threshold, then sub-routine 140 may move to the incidence of hyperglycemia sub-routine 210 . After displaying a message in step 146 , the sub-routine 140 may move to the incidence of hyperglycemia sub-routine 210 . In one embodiment, the pre-determined threshold may range from about 10% to about 25%.
- FIG. 7Ashows a flow chart of the incidence of hyperglycemia sub-routine 210 , which may include obtaining a number of blood glucose concentration measurements over a total time period, as shown in step 213 .
- the total time periodcan be any arbitrarily selected time duration, such as, for example, number of hours in a day, one day, one week, one month, three months, six months, time between visits to a physician's office, and so on.
- the sub-routine 210may calculate a percentage of hyperglycemic incidence Ph for a total time period by summing a number of substantially hyperglycemic blood glucose concentration measurements divided by a number of blood glucose concentration measurements collected over the total time period, as shown in step 214 . Equation 8 shows an example of how to calculate percentage of hyperglycemic incidence Ph
- irepresents a particular recurring time interval
- nis a total number of recurring time intervals
- H iis a number of substantially hyperglycemic glucose concentration measurements that occur during time interval i
- N irepresents the total number of glucose concentration measurements performed during time intervals i.
- the percentage of hyperglycemic incidence Phmay be compared to a predetermined threshold.
- a messagemay be displayed indicating a high incidence of hyperglycemia if the percentage of hyperglycemic incidence Ph is greater than a pre-determined threshold, as shown in step 216 . If the percentage of hyperglycemic incidence Ph is not greater than a pre-determined threshold, then the sub-routine 110 may move to the incidence of hyperglycemia by meal sub-routine 240 .
- the pre-determined thresholdmay range from about 15% to about 50%. After displaying a warning message in step 216 , the sub-routine may move to step 211 .
- the hyperglycemic pattern by time slot sub-routine 220may be used to determine if there is a high incidence of hyperglycemia occurring at a particular recurring time interval i.
- FIG. 7Ashows a flow chart of the hyperglycemic pattern by time slot sub-routine 220 that may include obtaining a number of blood glucose measurements over a total time period in step 221 and determining a number of hyperglycemic incidences for each of the time slots in step 222 .
- the sub-routine 220determines whether the number of hyperglycemic incidence for at least one of the time slots is different using a statistical test such as, for example, a chi-squared test (as shown in a template of FIG.
- the calculated chi-squared valueis compared to a chi-squared value in a table, as shown in step 224 . If the calculated chi-squared is not greater than a chi-squared value in a table (of which a template is shown in FIG. 4C ), then the sub-routine 220 moves to step 228 . If the calculated chi-squared is greater than the chi-squared value in a table (of which a template is shown in FIG. 4C ), then the sub-routine 220 moves to perform a Z test for each time slot, as shown in step 225 . In one embodiment, the Z test may be a two-sided Z test.
- step 226the calculated Z i value is compared to a value of about 2. If the calculated Z i is greater than about 2, then a message indicating a high incidence of hyperglycemia has occurred at a particular time slot will be displayed, as shown in step 227 . After displaying the message, the subroutine 220 moves to the step 228 . If the calculated Z i is not greater than about 2, then the sub-routine 220 moves to the step 228 .
- a chi-squared testmay be used to determine if any of the time slots are statistically significantly different.
- the chi-squared testmay use a confidence level ranging from about 95% to about 99%. Equation 9 shows an example of how to calculate chi-squared ⁇ 2 .
- H′ iis a number of non-hyperglycemic glucose concentration measurements that occur during time interval i.
- H i,preis a predicted number of substantially hyperglycemic glucose concentration measurements that will occur during time interval i.
- H′ i,preis a predicted number of non-hyperglycemic glucose concentration measurements that will occur during time interval i.
- the calculated ⁇ 2 valueis compared to a ⁇ 2 in a table based on a number of degrees of freedom for each of the time intervals i. If the calculated ⁇ 2 is greater than the ⁇ 2 value on the table, then at least one of the time intervals is statistically significantly different.
- H i,premay be calculated using Equation 10a.
- H′ i,premay be calculated using Equation 10b.
- the method of performing the hyperglycemic pattern by time slot sub-routine 220 in FIG. 7Bmay further include identifying which one of the recurring time intervals i is statistically significantly different using a Z test if the chi-squared test determines that at least one of the time intervals is statistically significantly different. Equation 11 shows an example of the Z test.
- Equation 11the term Z i represents a Z value at a particular time interval i and SE i represents a standard error for a particular time interval i.
- SE imay be calculated using Equation 12.
- a Z i valuemay be calculated for each recurring time interval i and compared to a Z value in a table. If the Z i value for one of the recurring time intervals is greater than the Z value in the table (e.g., about two), then the particular recurring time interval i is statistically significantly different.
- the hyperglycemic pattern by day of the week sub-routine 230may be performed in a manner similar to hyperglycemic pattern by time slot sub-routine 220 .
- the time intervalsrecur weekly where there are seven time slots to represent each day of the week.
- FIG. 8shows a flow chart of the hyperglycemic pattern by day of week 230 that may include obtaining a number of blood glucose measurements over a total time period in step 231 and determining a number of hyperglycemic incidences for each day in step 232 .
- the sub-routine 230determines whether the number of hyperglycemic incidence for at least one of the days is different using a statistical test such as, for example, a chi-squared test (as shown in a template of FIG. 4C ), and as shown in step 233 .
- the calculated chi-squared valueis compared to a chi-squared value in a table, as shown in step 234 .
- step 236the calculated Z i value is compared to a value of about 2.
- the subroutine 230moves to the next sub-routine 240 . If the calculated Z i is not greater than about 2, then the sub-routine 220 moves to the next sub-routine 240 .
- FIG. 9shows a flow chart of the hyperglycemia by meal sub-routine 240 that may be used to determine if there is a high incidence of hyperglycemia occurring at either a pre-meal or post-meal time interval.
- the incidence of hyperglycemia by meal sub-routine 240may include obtaining a number of blood glucose concentration measurements over a total time period, as shown in step 241 .
- a number of blood glucose concentration measurements with a pre-meal tag A and post-meal tag Bmay be calculated indicating the number of blood glucose measurement performed before eating a meal and after a meal, respectively, as shown in step 242 .
- a number of substantially hyperglycemic blood glucose concentration measurements with a pre-meal tag H A and post-meal tag H Bmay be calculated, as shown in step 243 .
- the percentage of hyperglycemic incidence having a pre-meal tag Ph A and a post-meal tag Ph Bmay be calculated, as indicated in step 244 .
- Ph Amay be determined by dividing the number of substantially hyperglycemic blood glucose concentration measurements that have the pre-meal flag H A by the number of blood glucose concentration measurements with the pre-meal tag A.
- Ph Bmay be determined by dividing the number of substantially hyperglycemic blood glucose concentration measurements that have the pre-meal flag H B by the number of blood glucose concentration measurements with a pre-meal tag B.
- Equations 13 and 14illustrate a mathematical embodiment on how to determine the percentage of hyperglycemic incidence having a pre-meal tag Ph A and a post-meal tag Ph B .
- Ph AH A A * 100 Eq . ⁇ 13
- Ph BH B B * 100 Eq . ⁇ 14
- the percentage of hyperglycemic incidence having a pre-meal tag Ph A and a post-meal tag Ph Bmay be compared to a pre-determined threshold, as shown in step 245 . If either Ph A or PH B is greater than a pre-determined threshold, then a message can be displayed indicating a high incidence of hyperglycemia occurring at a pre-meal time and/or a post-meal time, as shown in step 246 . If Ph A and Ph B are not greater than a pre-determined threshold, then sub-routine 240 may move to step 301 , which is a first step in variability pattern rules 300 . After displaying the message in step 246 , the sub-routine 240 may move to the step 301 . In one embodiment, the pre-determined threshold may range from about 15% to about 50%.
- a methodincludes storing a patient's data that includes blood glucose concentration measurements; generating from the patient's data a suitable table having predetermined conditions (e.g., Time or Day) and outcomes (e.g., Hypoglycemic, Hyperglycemic or Other condition) upon indication of instances of hypoglycemia, hyperglycemia, or excessive blood glucose variability by time of day, by day in a week, both by time of day and day of week, or at different time intervals; calculating standard error (SE) and Z test with data from the table; and displaying a message when the Z test being greater than a predetermined value indicative of a pattern of glycemia outside at least a predetermined range for such pattern.
- a threshold for the Z testis about 2.
- the glucose variability range sub-routine 310may be used to indicate to a user if their glucose concentration has a wide range of blood glucose variability, as illustrated in FIG. 10 .
- the glucose variability range sub-routine 310may include obtaining a number of blood glucose measurements over a total time period in step 311 , and ranking all of the blood glucose measurements based on a magnitude of the blood glucose measurement in step 312 .
- an inter quartile rangemay be determined that includes an upper ranking and a lower ranking in step 313 .
- the upper rankingmay correlate to an upper glucose concentration and the lower ranking may correlate to a lower glucose concentration.
- the inter quartile range selected herecan be a glucose measurement in the 75 th and 25 th percentile.
- step 314the upper glucose concentration is subtracted from the lower glucose concentration to calculate a differential value or, for example, an inter quartile range. If the differential value is greater than a pre-determined threshold, a message may be displayed indicating an incidence of high blood glucose variability as shown in step 315 . If the differential value is not greater than a pre-determined threshold, the sub-routine 310 may move to the overcorrection for hypoglycemia sub-routine 320 .
- the sub-routine 310may move to the overcorrection for hypoglycemia sub-routine 320 .
- the messageis displayed only if there is a statistically significant number of blood glucose measurements collected by the glucose meter such as, for example, about greater than about fourteen blood glucose measurements, as shown in step 301 in FIG. 3A .
- An example of the pre-determined threshold for the glucose variability range sub-routine 310may range from about 30 mg/dL to about 90 mg/dL, and preferably about 50 mg/dL.
- Variabilitycan also be associated graphically with incidences of hypoglycemia or hyperglycemia at a specified time of day or in association with a meal slot.
- Other associations of blood glucose variabilitycan be with a specified date, day of week, timing of meals or insulin injections.
- the systemperforms a generating of blood glucose variability pattern by determining (a) a median of glucose concentration values during a temporal period and (b) a median of test times during the temporal period; and correlating (a) the median of glucose concentration values and (b) the median of test times to define a data point on a two-dimensional coordinate graph having glucose values and test times.
- a suitable range(e.g., interquartile, 10 th and 90 th percentiles or 20 th and 80 th percentiles) can be plotted around each median data point.
- the temporal time periodis selected to be a time period TP from 3:00 AM to 8:00 AM where a median of glucose concentration values is indicated by MGV of approximately 325 mg/dL during this time period with a median of the number of test measurements MT being approximately 4:00 AM, and both MGV and MT can be utilized to define a median data point on a two-dimensional chart for glucose value and time in display area D 4 .
- Association of blood glucose variability for MGV and MTcan be determined for other specified indicators such as, for example, pre or post meal glucose concentration levels by time slot in a day or by days in a week or month, hypoglycemia, hyperglycemia, day of week, dates of week, or any time related specified indicator as deemed suitable by the user, patient, physician, or clinician. Thereafter, a suitable variability indicator (such as, for example, the interquartile range defined as a difference between the 75 th and 25 th percentile) can be determined around each of the median data.
- the data values defining the 75 th percentilecan be connected together as smoothed curve 700 about the median values defining curve 710 with the 25 th percentile values defining curve 720 .
- the curves 700 and 720serve to show graphically the blood glucose variability around the median value associated with a specified indicator (e.g., glucose, insulin, or other physiological indicators).
- the medianis a preferred indicator of a tendency in the blood glucose data to centralize about some value, i.e., a central tendency.
- the medianis also preferred over other indicator such as, for example, the arithmetic mean because it has been observed that measurement data from blood glucose meter do not follow a normal or Gaussian distribution (i.e., an asymmetric instead of symmetric distribution), as it would be for other indicators.
- the use of the medianis preferred because (a) the median is insensitive to outlier data, and (b) the median is essentially unaffected by values outside a range of measurement of blood glucose meters.
- the respective curves 700 , 710 , and 720can be generated by a suitable interpolation technique, i.e., “curve smoothing,” such as, for example, polynominal interpolation, cubic-Bezier spline, cubic cardinal spline, Fritsch-Carlson monotony preserving cubic interpolation, Akima cubic spline interpolation, rational cubic spline, or exponential interpolation.
- the curve smoothingis generated via a cardinal spline through a specified array of point structures using a tension of 1.
- a method of assessing glycemia of a patientcan be provided to provide a graphical comparison of insulin intake and blood glucose along with any other physiological parameters.
- the methodcan be achieved by collecting data related to a patient glycemia, including blood glucose measurements and insulin intake values; determining a combined median of glucose and time as a function of a median of blood glucose values and a median of time periods for each measurement of the blood glucose values over a predetermined temporal period; and displaying the combined median of glucose and time in a graphical format.
- the collectingcan include collecting data of the patient over a plurality of temporal time periods.
- the determiningcan include determining the combined median of glucose and time for each of the plurality of temporal time periods.
- the displayingcan include generating a graphical chart for each of the determining and establishing, where the charts have substantially the same temporal time periods.
- blood glucose variabilitycan be generated by a suitable technique, such as, for example, using the inter quartile range.
- the blood glucose variabilitycan be obtained for each combined median of glucose and time over the plurality of temporal periods.
- the temporal periodscan be any unit indicator of time such as for example, every 4 hours, every 8 hours, every 24 hours, day or days in a week, specific dates, every week or every month and so on.
- the systemcan be utilized to associate the variability of glucose concentration with the intake of insulin via a common specified indicator (e.g., time of day, day of week, and others) to assess the effects of insulin, types of insulin, or frequency of insulin intake.
- a common specified indicatore.g., time of day, day of week, and others
- the systemperforms a generating of blood glucose variability pattern by determining (based on a common indicator of temporal time TP) the following: (i) a median of insulin doses MI taken by the patient during the temporal period selected above and (ii) a median of dosage times MIT during the temporal period and it would correlate both (i) the median of insulin doses MI and (ii) the median of the number of insulin intake values MIT to define a data point on a two-dimensional coordinate graph having insulin doses and dosage times as its ordinate and abscissa, respectively.
- the method abovecan be implemented to establish a combined median of insulin intake and time as a function of both (i) median of insulin intake and (ii) a median of time periods for each insulin intake over the predetermined temporal period; and displaying the combined median of insulin intake and time in a graphical format so that a clinician, patient or diabetes specialist would be able to assess generally the effect of insulin intake and blood glucose.
- This correlation of the median insulin doses and dosage timecan be plotted graphically in an exemplary two-dimensional chart within display area D 5 , which then can be utilized to show the association in the variability of glucose in the chart of display area D 4 and insulin in the chart of display area D 5 by the common specified indicator of “time of day.”
- the chart in display area D 4 or D 5is not limited to a two-dimensional chart but that other types of charts can be utilized such as, for example, three-dimensional charts or charts using graphical representation for more than 4 different variable data inputs.
- M valuederived as a composite measure of glycemic control from blood glucose data, as described by J. Schlichtkrull et al., The M - Value, an Index of Blood - Sugar Control in Diabetics , Acta Medica Scandinavia, Vol. 177, fasc. 1, 1965, pp. 95-93,
- J-indexas described by Wojcicki, J. (1995), J - Index, A New Proposition Of The Assessment Of Current Glucose Control In Diabetic Patients , Horm Metab Res., 27, 41-42, and
- the overcorrection for hypoglycemia sub-routine 320may be used to determine if a user has ingested a bolus of carbohydrate that caused the user's blood glucose concentration to increase from a hypoglycemic state to a hyperglycemic state. Ideally, a user would want to ingest a bolus of carbohydrate to cause a switch from the hypoglycemic state to the euglycemic state.
- the overcorrection for hypoglycemia sub-routine 320may include obtaining a number of blood glucose measurements over a total time period as shown in step 321 , and measuring a first blood glucose concentration that is less than a first pre-determined threshold, as shown in step 322 .
- the first pre-determined thresholdmay be about 70 mg/dL where a blood glucose concentration that is less than the first pre-determined threshold is hypoglycemic.
- the first blood glucose concentrationindicates that the user is in a hypoglycemic state.
- all blood glucose measurements performed from about 30 minutes to about 240 minutes after the first blood glucose concentration measurementare evaluated for hyperglycemia.
- a messageis displayed indicating a possible presence of overcorrection for hypoglycemia, as shown in step 324 .
- the second pre-determined thresholdmay be about 180 mg/dL. If none of the blood glucose concentrations are found to be greater than about the second pre-determined threshold, then the subroutine 320 may move to the overcorrection for hypoglycemia sub-routine 330 . After displaying the message in step 324 , the sub-routine 320 may move to the overcorrection for hyperglycemia sub-routine 330 .
- the overcorrection for hyperglycemia sub-routine 330may be used to determine if a user has taken a bolus of insulin such that the user's glucose concentration decreased from a hyperglycemic state to a hypoglycemic state. Ideally, a user may want an insulin bolus to cause a switch from the hyperglycemic state to the euglycemic state.
- the overcorrection for hyperglycemia sub-routine 330may include obtaining a number of blood glucose measurements over a total time period as shown in step 331 , and measuring a first blood glucose concentration that is greater than a second pre-determined threshold, as shown in step 332 .
- the second pre-determined thresholdmay be about 180 mg/dL where a blood glucose concentration that is greater than the second pre-determined threshold is hyperglycemic.
- all blood glucose measurements performed from about 30 minutes to about 240 minutes after the first blood glucose concentration measurementare evaluated for hypoglycemia.
- a messageis displayed indicating a possible presence of overcorrection for hyperglycemia, as shown in step 334 .
- the first pre-determined thresholdmay be about 70 mg/dL. If none of the blood glucose concentrations are found to be less than about the first pre-determined threshold, then the subroutine 330 may move to the frequency of glucose testing sub-routine 410 . After displaying the message in step 334 , the sub-routine 330 may move to the frequency of blood glucose testing sub-routine 410 .
- FIG. 13shows a flow chart for the frequency of blood glucose testing sub-routine 410 , which may include obtaining a number of blood glucose measurements over a total time period, as shown in step 411 .
- an average number of blood glucose concentration measurements per day or per weekmay be calculated, as shown in step 412 .
- the average number of average number of blood glucose concentration measurements per unit timeis compared to a pre-determined threshold.
- a messagemay be displayed indicating that the average number of blood glucose concentration measurements per unit time is not sufficient if the average number of blood glucose concentration measurements per unit time is less than a pre-determined threshold, as shown in step 414 .
- the sub-routine 410may move to the adequacy of pre-meal testing sub-routine 420 . After displaying the message in step 414 , the sub-routine 410 may move to the adequacy of pre-meal testing sub-routine 420 .
- the pre-determined thresholdmay range from about 3 measurements per week to about 15 measurements per week.
- FIG. 14Ashows a flow chart for the adequacy of pre-meal testing sub-routine 420 , which may include obtaining a number of blood glucose measurements over a total time period, as shown in step 421 .
- the blood glucose concentration measurementmay be flagged as pre-meal if the blood glucose concentration measurement was performed before a meal, as shown in step 422 .
- a number of blood glucose concentration measurements per week that are flagged as pre-mealcan be determined, as shown in step 423 .
- the number of blood glucose concentration measurements flagged as pre-meal per weekis compared to a pre-determined threshold.
- a warning messagemay be displayed if the number of blood glucose concentration measurements per week that are flagged as pre-meal is less than a pre-determined threshold, as shown in step 425 .
- the pre-determined thresholdmay range from about 3 pre-meal flags per week to about 7 pre-meal flags per week.
- the appropriate thresholdis one that can be set by the physician or automatically or semi-automatically via a suitable algorithm by taking into account the average number of tests per day or per week, the pattern of testing being used, and the pattern of testing recommended by the physician.
- step 425the sub-routine 420 may move to the adequacy of post-meal testing sub-routine 430 .
- the sub-routine 420may move to the adequacy of post-meal testing sub-routine 430 .
- the message 425may be dispensed with entirely.
- step 425may include a message asking the user or patient to test or measure their blood glucose level more often, in the future, during a prescribed or determined time period as compared to any comparable prior time periods.
- FIG. 14Bshows a flow chart for the adequacy of post-meal testing sub-routine 430 , which may include obtaining a number of blood glucose measurements over a total time period, as shown in step 431 .
- the blood glucose concentration measurementmay be flagged as post-meal if the blood glucose concentration measurement was performed after a meal, as shown in step 432 .
- a number of blood glucose concentration measurements per week that are flagged as post-mealcan be determined, as shown in step 433 .
- the number of blood glucose concentration measurements flagged as post-meal per weekis compared to a pre-determined threshold.
- a warning messagemay be displayed if the number of blood glucose concentration measurements per week that are flagged as post-meal is less than a pre-determined threshold, as shown in step 435 .
- a pre-determined thresholdis one that can be set by the physician or automatically or semi-automatically via a suitable algorithm by taking into account the average number of tests per day or per week, the pattern of testing being used, and the pattern of testing recommended by the physician.
- the pre-determined thresholdmay range from about 3 post-meal flags per week to about 7 post-meal flags per week.
- the sub-routine 430may move to the step 501 , where A indicates pre-meal testing frequency and B indicates post-meal testing frequency. After displaying the message in step 435 , the sub-routine 430 may move to the step 501 .
- the adequacy of blood glucose testing sub-routine 440may be performed after the adequacy of post-meal testing sub-routine 430 .
- FIG. 14 Cshows a flow chart for the adequacy of blood glucose testing sub-routine 440 that helps a physician determine a user's compliance in performing a sufficient number of blood glucose measurements.
- the adequacy of blood glucose testing sub-routine 440may include inputting a plurality of targeted testing frequencies for a plurality of time intervals, as shown in step 441 .
- the time intervalsmay include before breakfast, after breakfast, before lunch, after lunch, before dinner, after dinner, bedtime, and overnight.
- a physicianmay input a targeted testing frequency for all of the time intervals to provide targeted goals for the user.
- a number of blood glucose measurementsmay be performed at various time intervals, as shown in step 442 .
- An actual testing frequency for each time intervalmay be calculated, as shown in step 443 .
- the actual testing frequencyis compared to the targeted testing frequency.
- a warning messagemay be displayed if the actual testing frequency is less than the targeted testing frequency, as shown in step 445 . If the actual testing frequency is not less than the targeted testing frequency, then a message indicating the user had complied with the targeted testing frequencies, as shown in step 446 . After displaying the message in either step 445 or step 446 , the sub-routine 440 may move to the step 501 .
- the testing/dosing pattern 400may include sub-routines for recognizing patterns indicative of a pre-meal or post meal blood glucose measurements.
- a messagemay be displayed alerting a user that the most recently performed blood glucose measurement is pre-meal or post-meal based on past blood glucose measurements. The user may then be provided the option of flagging the blood glucose measurement with the appropriate flag.
- FIG. 15shows a flow chart for the comparison of pre-meal and post-meal blood glucose concentrations sub-routine 510 , which may be used to determine whether there is a significant increase in blood glucose concentration after a user has ingested a meal.
- the comparison of pre-meal and post-meal blood glucose concentrations sub-routine 510may include obtaining a number for blood glucose concentration measurements, as shown in step 511 .
- a median pre-meal blood glucose concentration and a median post-meal blood glucose concentrationmay be calculated, as shown in steps 512 and 513 , respectively.
- Pre-meal and post-meal blood glucose concentrationsmay be defined as blood glucose concentration measurements that are flagged as pre-meal and post-meal, respectively.
- the median pre-meal glucose concentrationis subtracted from the median post-meal glucose concentration that results in a difference value.
- the difference valuecan be a clinically significant, statistically or both clinically and statistically significant value depending on the types of meal involved.
- a warning message indicating a high post-meal excursionif the difference value is greater than a pre-determined threshold, as shown in step 515 . If the difference value is not greater than a pre-determined threshold, then the sub-routine 510 may move to the comparison of daytime and nighttime glucose concentrations sub-routine 520 . After displaying the message in step 512 , the sub-routine 510 may move to the comparison of daytime and nighttime glucose concentrations sub-routine 520 .
- the pre-determined thresholdmay be about 50 mg/dL.
- An embodimentmay include a pre-condition where a warning message is not displayed unless there are greater than about nine measurements that are flagged as pre-meal and greater than about nine measurements that are flagged as post-meal.
- FIG. 16shows a flow chart for the comparison of daytime and nighttime glucose concentrations sub-routine 520 , which may be used to determine whether there is a significant difference in daytime and nighttime glucose concentrations.
- the comparison of daytime and nighttime glucose concentrations sub-routine 520may include obtaining a number for blood glucose measurements over a total time period, as shown in step 521 .
- a median daytime glucose concentration and nighttime glucose concentrationmay be calculated, as shown in steps 522 and 523 , respectively.
- Daytimemay be a time interval ranging from about 6:00 A.M. to about 4:59 P.M.
- Nighttimemay be a time interval ranging from about 5:00 P.M. to about 5:59 A.M.
- a daytime or nighttime periodcan be of any predetermined time periods, as selected by the physician or clinician.
- a statistical testmay be used to determine whether the daytime median is statistically significantly different from the nighttime median, as shown in step 524 . If there are statistically significant differences, a warning message may be displayed indicating a difference between the daytime median and the nighttime median, as shown in step 525 . If there is not a statistically significant difference, the sub-routine 520 may move to the comparison of previous and current hypoglycemic incidence sub-routine 530 . After displaying the message in step 525 , the sub-routine 520 may move to the comparison of previous and current hypoglycemic incidence sub-routine 530 .
- the statistical testis a non-parametric statistical test.
- the non-parametric statistical testmay be a Wilcoxon test or a Rank Sum test.
- the non-parametric testmay include combining a plurality of glucose concentration measurements performed at the daytime time interval and at the nighttime time interval to form an aggregate of glucose concentration measurements. Next, the aggregate of glucose concentration measurements may be ranked in an ordinal order and a standardized rank sum W std may be calculated using an Equation 15.
- W stdrepresents the standardized rank sum
- W drepresents a rank sum of the plurality of glucose concentration measurements performed at the daytime time interval
- N dis the number of glucose concentration measurements for the daytime interval
- N nis the number of glucose concentration measurements for the nighttime interval.
- a warning messagemay be displayed indicating a statistically significant difference between the daytime median and the nighttime median if the standardized rank sum is greater than about 2.
- the warning messagemay be displayed if the plurality of glucose concentration measurements performed at the daytime includes more than about 9 measurements.
- the warning messagemay be displayed if the plurality of glucose concentration measurements performed at the nighttime includes more than about 9 measurements.
- the non-parametric testmay be performed using a different equation if two or more glucose concentrations have a tie (i.e., have the same value).
- a standardized rank sum W stdmay be calculated using an Equation 16.
- h jrepresents a number of glucose concentration values within a tie
- jrepresents an index value associated with each group of glucose concentrations having a tie
- gis a total number of ties.
- the blood glucose concentration valuesare 93, 93, 100, 100, 100, 104, 104, 104 mg/dL
- a warning messagemay be displayed indicating a statistically significant difference between the daytime median and the nighttime median if the standardized rank sum is greater than about 2.
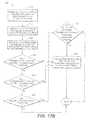
- FIG. 17Ashows the comparison of previous and current hypoglycemic incidence sub-routine 530 , which may indicate a statistical change from a current reporting period and a previous reporting period.
- a reporting periodmay be defined as the period between two successive device downloads for a given user. Note that the device does not have to be the same from download to download.
- the comparison of previous and current hypoglycemic incidence sub-routine 530may include obtaining a number of blood glucose measurements over a total time period, as shown in step 531 .
- a first percentage of hypoglycemic incidence Pl 1may be calculated over a first time period, as shown in step 532 .
- a second percentage of hypoglycemic incidence Pl 2may be calculated over a second time period, as shown in step 533 .
- the first time periodmay be a current time period and the second time period may be a previous time period.
- a calculationmay be performed for determining if two conditions are achieved which are whether the first percentage of hypoglycemic incidence Pl 1 is greater than a pre-determined threshold and whether the second percentage of hypoglycemic incidence Pl 2 less than a pre-determined threshold. If both of the above two conditions in step 534 are met, then the sub-routine 530 may show a warning message indicating a difference between the first percentage of hypoglycemic incidence Pl 1 and the second percentage of hypoglycemic incidence Pl 2 , as shown in step 538 . If at least one of the above two conditions are not met in step 534 , then the sub-routine may move to step 535 .
- a calculationmay be performed for determining if two conditions are achieved which are whether the first percentage of hypoglycemic incidence Pl 1 is less than a pre-determined threshold and whether the second percentage of hypoglycemic incidence Pl 2 is greater than a pre-determined threshold. If both of the above two conditions in step 535 are met, then the sub-routine 530 may show a warning message indicating a difference between the first percentage of hypoglycemic incidence Pl 1 and the second percentage of hypoglycemic incidence Pl 2 , as shown in step 538 . If at least one of the above two conditions are not met in step 535 , then the sub-routine may move to step 536 .
- a calculationmay be performed for determining whether the first percentage of hypoglycemic incidence Pl 1 and second percentage of hypoglycemic incidence Pl 2 are greater than a pre-determined threshold. If the above condition in step 536 is met, then the sub-routine 530 may perform a calculation for determining whether the first percentage of hypoglycemic incidence Pl 1 is statistically significantly different than the second percentage of hypoglycemic incidence Pl 2 , as shown in step 537 . If the above condition in step 536 is not met, then the sub-routine 530 may move to the comparison of previous and current hyperglycemic incidence sub-routine 540 .
- a calculationmay be performed for determining whether the first percentage of hypoglycemic incidence Pl 1 is statistically significantly different than the second percentage of hypoglycemic incidence Pl 2 , as shown in step 537 . If a statistically significant difference is found between the first and second percentage of hypoglycemic incidence, a warning message may be displayed indicating the difference, as shown in step 538 . If a statistically significant difference is not found between the first and second percentage of hypoglycemic incidence, the sub-routine 530 may move to the comparison of previous and current hyperglycemic incidence sub-routine 540 . After displaying the message in the step 538 , the sub-routine 530 may move to the comparison of previous and current hyperglycemic incidence sub-routine 540 . In an embodiment of the comparison of previous and current hypoglycemic incidence sub-routine 530 , the threshold may be about five percent or greater.
- a Z testmay be used to determine whether the first percentage of hypoglycemic incidence is statistically significantly different than the second percentage of hypoglycemic incidence.
- the Z testmay be performed using Equation 17.
- the terms Pl 1is the first percentage of hypoglycemic incidence
- Pl 2is the second percentage of hypoglycemic incidence
- Nl 1is the number of substantially hypoglycemic blood glucose concentration measurements that occur during the first time period
- Nl 2is the number of substantially hypoglycemic blood glucose concentration measurements that occur during the second time period.
- a warning messagemay be displayed indicating a statistically significant difference between the first and second percentage of hypoglycemic incidence if Z is greater than about 2. In one embodiment, the warning message may be displayed if the number of substantially hypoglycemic blood glucose concentration measurements that occur during the first or second time period is greater than about 27.
- FIG. 17Bshows the comparison of previous and current hyperglycemic incidence sub-routine 540 , which may indicate a statistical change from a current reporting period and a previous reporting period.
- a reporting periodmay be defined as the period between two successive device downloads for a given user. Note that the device does not have to be the same from download to download.
- the comparison of previous and current hyperglycemic incidence sub-routine 540may include obtaining a number of blood glucose measurements over a total time period, as shown in step 541 .
- a first percentage of hyperglycemic incidence Ph 1may be calculated over a first time period, as shown in step 542 .
- a second percentage of hyperglycemic incidence Ph 2may be calculated over a second time period, as shown in step 543 .
- the first time periodmay be a current time period and the second time period may be a previous time period.
- a calculationmay be performed for determining if two conditions are achieved which are whether the first percentage of hyperglycemic incidence Ph 1 is greater than a pre-determined threshold and whether the second percentage of hyperglycemic incidence Ph 2 is less than a pre-determined threshold. If both of the above two conditions in step 544 are met, then the sub-routine 540 may show a warning message indicating a difference between the first percentage of hyperglycemic incidence Ph 1 and the second percentage of hyperglycemic incidence Ph 2 , as shown in step 548 . If at least one of the above two conditions are not met in step 544 , then the sub-routine may move to step 545 .
- a calculationmay be performed for determining if two conditions are achieved which are whether the first percentage of hyperglycemic incidence Ph 1 is less than a pre-determined threshold and whether the second percentage of hyperglycemic incidence Ph 2 greater than a pre-determined threshold. If both of the above two conditions in step 545 are met, then the sub-routine 540 may show a warning message indicating a difference between the first percentage of hyperglycemic incidence Ph 1 and the second percentage of hyperglycemic incidence Ph 2 , as shown in step 548 . If at least one of the above two conditions are not met in step 545 , then the sub-routine may move to step 546 .
- a calculationmay be performed for determining whether the first percentage of hyperglycemic incidence Ph 1 and second percentage of hyperglycemic incidence Ph 2 are greater than a pre-determined threshold. If the above condition in step 546 is met, then the sub-routine 540 may perform a calculation for determining whether the first percentage of hyperglycemic incidence Ph 1 is statistically significantly different than the second percentage of hyperglycemic incidence Ph 2 , as shown in step 547 . If the above condition in step 546 is not met, then the sub-routine 540 may move to the end.
- a calculationmay be performed for determining whether the first percentage of hyperglycemic incidence Ph 1 is statistically significantly different than the second percentage of hyperglycemic incidence Ph 2 , as shown in step 547 . If a statistically significant difference is found between the first and second percentage of hyperglycemic incidence, a warning message may be displayed indicating the difference, as shown in step 548 . If a statistically significant difference is not found between the first and second percentage of hyperglycemic incidence, the sub-routine 540 may move to the end. After displaying the message in the step 548 , the sub-routine 540 may move to the end. In an embodiment of the comparison of previous and current hyperglycemic incidence sub-routine 540 , the threshold may be about fifty percent or greater.
- a Z testmay be used to determine whether the first percentage of hyperglycemic incidence is statistically significantly different than the second percentage of hyperglycemic incidence.
- the Z testmay be performed using Equation 18.
- Ph 1is the first percentage of hyperglycemic incidence
- Ph 2is the second percentage of hyperglycemic incidence
- Nh 1is the number of substantially hyperglycemic blood glucose concentration measurements that occur during the first time period
- Nh 2is the number of substantially hyperglycemic blood glucose concentration measurements that occur during the second time period.
- a warning messagemay be displayed indicating a statistically significant difference between the first and second percentage of hyperglycemic incidence if Z is greater than about 2. In one embodiment, the warning message may be displayed if the number of substantially hyperglycemic blood glucose concentration measurements that occur during the first or second time period is greater than about 27.
- glucose concentration in a patientis preferably obtained via the patient's blood for various exemplary embodiments
- other physiological fluids from the patientcan be utilized to provide a determination of glucose level such as, for example, interstitial fluid.
- glucoseany physiological fluids from the patient can be utilized to provide a determination of glucose level such as, for example, interstitial fluid.
- the word “glucose”(whether used herein alone or in conjunction with the word “blood,” as in “blood glucose” or “glucose”) to define not only glucose concentration or value present in blood but also in other biological fluids such as, for example, glucose concentration in interstitial fluid.
- the communication mediumincludes a first display area D 1 that has second, third, fourth, and fifth display areas D 2 , D 3 , D 4 , and D 5 , respectively, in the first display area.
- the second display area D 2has identification information of a patient
- the third display area D 3has a plurality of textual messages
- the fourth display area D 4includes a graphical chart indicative of a variability of the glucose concentration over a predetermined time period of the patient, and other suitable information in graphical or textual format.
- the fifth display area D 5has a graphical chart of units of insulin taken over time for the patient.
- the first display area D 1includes a display selected from any one of a video display monitor, a light projector, a sheet of paper, a hologram, an audio representation of the patient's variability trends (e.g., an automated voice response to the patient stating “high-variability between the hours of 3 A.M. and 9 A.M.) or combinations thereof.
- a displayselected from any one of a video display monitor, a light projector, a sheet of paper, a hologram, an audio representation of the patient's variability trends (e.g., an automated voice response to the patient stating “high-variability between the hours of 3 A.M. and 9 A.M.) or combinations thereof.
- the third display area D 3includes display of information for at least one of but are not limited to (a) incidence of hypoglycemia (b) incidence of hyperglycemia (c) blood glucose variability, (d) overcorrection, (e) differential between night time glucose concentration versus daytime glucose concentration, and (f) comparative analysis of glycemic state of the patient for a time period or at different time periods.
- the incidence of hypoglycemiaincludes (i) incidence of hypoglycemia by time period, (ii) incidence of hypoglycemia by day of the week, (iii) incidence of pre-meal hypoglycemia, and (iv) incidence of post-meal hypoglycemia.
- the third display areahas a plurality of textual messages indicative of diabetes status of the patient including hypoglycemia, hyperglycemia, or excessive blood glucose variability.
- the incidence of hypoglycemiaincludes a textual indication of hypoglycemic incidence that includes a calculated percentage of hypoglycemic events within a predetermined time period, which is provided whenever the calculated percentage is greater than about 5% or a textual indication that all glucose readings are hypoglycemic is provided whenever the calculated percentage is 100%, otherwise no textual indication of hypoglycemic incidence is provided.
- a textual display of an indication of higher hypoglycemia in a specific time periodis provided whenever a statistical correlation is determined between a time slot and a hypoglycemic event and there is an indication of hypoglycemic incidence.
- a textual display of an indication of higher hypoglycemia in a specific day of the weekis provided whenever a statistical correlation is determined between the day of the week and a hypoglycemic event and there is a textual indication of hypoglycemic incidence.
- a textual display of pre-meal hypoglycemic eventsis provided whenever there are more than about 5% of pre-meal glucose readings marked as pre-meal glucose readings within a predetermined time period.
- a textual display of post-meal hypoglycemic eventsis provided whenever there are more than about 5% of glucose readings marked as post-meal glucose readings within a predetermined time period.
- the fourth display area D 4includes a graphical pattern of blood glucose variability about a median blood glucose value by at least one of time of day, of day in a week, of both time of day and day of week, or at different predetermined intervals.
- a graphical blood glucose variability patternis shown in FIG. 18 in relation to a specific day as spanning from 24 hours starting at about 12 A.M. to about 12 A.M., other relations can be also be viewed, as described earlier, in relation to day of a week, both time and day of week, specific date in a week or month, or over predetermined intervals, such as between physician's office visits or between different prescribed therapeutic regimens.
- the communication mediumalso has the ability to provide information regarding incidence of hyperglycemia that includes but are not limited to (i) incidence of hyperglycemia by time period, (ii) incidence of hyperglycemia by day of the week, (iii) incidence of pre-meal hyperglycemia, and (iv) incidence of post-meal hyperglycemia.
- the incidence of hyperglycemiaincludes a textual indication of hyperglycemic incidence that includes a calculated percentage of hyperglycemic events within a predetermined time period is provided whenever the calculated percentage is greater than about 15% or a textual indication that all glucose readings are hyperglycemic is provided whenever the calculated percentage is 100%, otherwise no textual indication of hyperglycemic incidence is provided.
- a textual display of an indication of higher hyperglycemia in a specific time periodis provided.
- a textual display of an indication of higher hyperglycemia in a specific day of the weekis provided whenever a statistical correlation is determined between the day of the week and a hyperglycemic event and there is a textual indication of hyperglycemic incidence.
- a textual display of pre-meal hyperglycemic eventsis provided.
- a textual display of post-meal hyperglycemic eventsis also provided.
- 5%has been selected as a threshold, other values can be utilized depending on the therapeutic regimen prescribed by a physician, such as, for example, 10% or 15%.
- the communication mediumalso has the ability to provide information relating to glucose variability, including, but not limited to (i) glucose variability range, (ii) possible rebound from hypoglycemia to hyperglycemia, (iii) incidence of possible overcorrection from hyperglycemia to hypoglycemia, or (iv) blood glucose variability associated with a specified indicator such as, for example, a specific time period during a day, a plurality of time periods in a day, a specified day in a week, a plurality of specified days in a week, pre-meal tests in a specific time period during a day, frequency of glucose measurements (i.e., testing) for pre-meal test for a specified day of the week, frequency of glucose measurements (i.e., testing) for pre-meal test for specified days of the week, glucose testing frequency having post-meal tests in a specific time period dining a day, frequency of glucose measurements (i.e., testing) for post-meal test for a specified day of the week, or frequency of
- a textual display indicative of high blood glucose variabilityis provided whenever a calculated blood glucose variability of a patient within a predetermined time period is about or greater than about a selected value, such as, for example, any value from about 30 mg/dL to about 90 milligrams per deciliter of glucose.
- a textual display indicative of a possibility of hypoglycemia to hyperglycemia reboundis provided whenever there is a change from a hyperglycemic event to a hypoglycemic event within a predetermined time period of less than about 4 hours. Whenever there is a change from a hypoglycemic event to a hyperglycemic event within a predetermined time period of less than about 4 hours, a textual display indicative of hyperglycemia to hypoglycemia rebound is provided.
- the communication mediumcan also provide information relating to differentials between pre and post meal data. Specifically, a textual indication of a calculated difference between pre-meal and post-meal medians within a reporting period is provided when the calculated difference is greater than about a selected value, such as, for example, any value from about 30 mg/dL to about 90 mg/dL, and preferably about 50 mg/dL.
- the communication mediumcan also provide information relating to hypo or hyper glycemic trends including a textual indication of one of an upward hypoglycemic trend or downward hypoglycemic trend based on a number of hypoglycemic measurement for two or more time periods, and a total number of glucose measurements for all of the time periods, as described earlier.
- a textual indication of one of an upward hyperglycemic trend or downward hyperglycemic trend based on a number of hypoglycemic measurement for two or more time periods, and a total number of glucose measurements for all of the time periodsis intended to cover not only text type representations but also numerical values, symbols (moving or stationary), charts, holograms, graphs, or combinations thereof.
- Applicantshave also, by virtue of the description and illustrations provided herein, provided for a computer program to provide diabetes management information to a user, which may include a clinician or a diabetic patient.
- the computer programincludes a user interface, business object module, and a diabetes management rules engine, illustrated here in FIG. 1 and described earlier.
- the diabetes rule management enginegenerates a plurality of textual pattern recognition messages based on a plurality of data inputs relating to blood glucose of a patient, including a graphical chart indicative of a blood glucose variability of the glucose concentration over a predetermined time period of the patient.
- the plurality of textual messagesmay include information for at least one of but are not limited to (a) incidence of hypoglycemia (b) incidence of hyperglycemia (c) blood glucose variability, (d) overcorrection, (e) differential between night time glucose concentration versus daytime glucose concentration, and (f) comparative analysis of hypoglycemic or hyperglycemic trends.
- the incidence of hypoglycemiaincludes (i) incidence of hypoglycemia by time period, (ii) incidence of hypoglycemia by day of the week, (iii) incidence of pre-meal hypoglycemia, and (iv) incidence of post-meal hypoglycemia.
- the incidence of hypoglycemiaincludes a textual indication of hypoglycemic incidence that includes a calculated percentage of hypoglycemic events within a predetermined time period is provided whenever the calculated percentage is greater than about 5% or a textual indication that all glucose readings are hypoglycemic is provided whenever the calculated percentage is 100%, otherwise no textual indication of hypoglycemic incidence is provided.
- a textual display of an indication of higher hypoglycemia in a specific time periodis provided whenever a statistical correlation is determined between a time slot and a hypoglycemic event and there is an indication of hypoglycemic incidence.
- a textual display of an indication of higher hypoglycemia in a specific day of the weekis provided whenever a statistical correlation is determined between the day of the week and a hypoglycemic event and there is such indication of hypoglycemic incidence.
- a textual display of pre-meal hypoglycemic eventsis provided whenever there are more than about 5% of glucose readings marked as pre-meal glucose readings within a predetermined time period.
- a textual display of post-meal hypoglycemic eventsis provided whenever there are more than about 5% of glucose readings marked as post-meal glucose readings within a predetermined time period.
- the computer programalso has the ability to provide information regarding incidence of hyperglycemia that includes but are not limited to (i) incidence of hyperglycemia by time period, (ii) incidence of hyperglycemia by day of the week, (iii) incidence of pre-meal hyperglycemia, and (iv) incidence of post-meal hyperglycemia.
- the incidence of hyperglycemiaincludes a textual indication of hyperglycemic incidence that includes a calculated percentage of hyperglycemic events within a predetermined time period is provided whenever the calculated percentage is greater than about 15% or a textual indication that all glucose readings are hyperglycemic is provided whenever the calculated percentage is 100%, otherwise no textual indication of hyperglycemic incidence is provided.
- a textual display of an indication of higher hyperglycemia in a specific time periodis provided whenever a statistical correlation is determined between a time slot and a hyperglycemic event and there is a textual indication of hyperglycemic incidence.
- a textual display of an indication of higher hyperglycemia in a specific day of the weekis provided whenever a statistical correlation is determined between the day of the week and a hyperglycemic event and there is indication of hyperglycemic incidence.
- a textual display of pre-meal hyperglycemic eventsis provided whenever there are more than about 5% of glucose readings marked as pre-meal glucose readings within a predetermined time period.
- a textual display of post-meal hyperglycemic eventsis provided whenever there are more than about 5% of glucose readings marked as post-meal glucose readings within a predetermined time period.
- the computer programalso has the ability to provide information relating to glucose variability, including, but not limited to (i) glucose variability range, (ii) a possibility of hypoglycemia to hyperglycemia rebound, (iii) incidence of possible overcorrection from hyperglycemia to hypoglycemia, or (iv) blood glucose variability associated with a specified indicator such as, for example, a specific time period during a day, a plurality of time periods in a day, a specified day in a week, a plurality of specified days in a week, pre-meal tests in a specific time period during a day, frequency of glucose measurements (i.e., testing) for pre-meal test for a specified day of the week, frequency of glucose measurements (i.e., testing) for pre-meal test for specified days of the week, glucose testing frequency having post-meal tests in a specific lime period during a day, frequency of glucose measurements (i.e., testing) for post-meal test for a specified day of the week, or
- a textual display indicative of high blood glucose variabilityis provided whenever a calculated blood glucose variability of a patient within a predetermined time period is about or greater than about 90 milligram per deciliter. Whenever there is a change from a hyperglycemic event to a hypoglycemic event within a predetermined time period less than about 4 hours a textual display indicative of a possibility of hypoglycemia to hyperglycemia rebound is provided. Similarly, a textual display indicative of hyperglycemia to hypoglycemia rebound is provided whenever there is a change from a hypoglycemic event to a hyperglycemic event within a predetermined time period less than about 4 hours.
- the computer programcan also provide information relating to differential between pre and post meal data. Specifically, a textual indication of a calculated difference between pre-meal and post-meal medians within a reporting period is provided when the calculated difference is greater than about a predetermined value such as, for example, any value from about 30 mg/dL to about 90 mg/dL, and preferably about 50 mg/dL of glucose.
- a predetermined valuesuch as, for example, any value from about 30 mg/dL to about 90 mg/dL, and preferably about 50 mg/dL of glucose.
- the computer programcan also provide information relating to hypo glycemic or hyper glycemic trends including a textual indication of one of an upward hypoglycemic trend or downward hypoglycemic trend based on a number of hypoglycemic measurement for two or more time periods, and a total number of glucose measurements for all of the time periods, as described earlier.
- a textual indication of one of an upward hyperglycemic trend or downward hyperglycemic trendbased on a number of hypoglycemic measurement for two or more time periods, and a total number of glucose measurements for all of the time periods.
- Table 1are examples of various pattern recognition textual messages that can be provided to a clinician or user in managing diabetes:
- Pattern Recognition MessagesMessage Nos. Pattern Recognition Messages 01 Average number of glucose tests per week is . 02 Average number of glucose tests per week flagged as pre-meal is . 03 Average number of glucose tests per week flagged as post-meal is . 04 % of values are hypoglycemic. 05 Higher incidence of hypoglycemia present for: . 06 % of pre-meal values are hypoglycemic. 07 % of post-meal values are hypoglycemic. 08 All glucose readings are hyperglycemic. 09 % of values are hyperglycemic. 10 Higher incidence of hyperglycemia present for: . 11 Higher incidence of hyperglycemia present for: .
- the computer program via the diabetes management rules enginealso correlates (a) a median of glucose concentration values during a temporal period and (b) a median of test times during the temporal period to define a data point on a graph having glucose values and test times. Further, the computer program via the diabetes management rule engine correlates (i) a median of insulin doses over a temporal period and (ii) a median of dosage time during the temporal period to define a data point on a graph having insulin doses and dosage times.
- the temporal periodincludes, but is not limited to at least one of a specific time period during a day, a plurality of time periods in a day, a specified day in a week, or a plurality of specified days in a week.
- the temporal periodmay also include at least one of testing incidence or glucose testing frequency having pre-meal tests in a specific time period during a day, frequency of glucose measurements (i.e., testing) for pre-meal test for a specified day of the week, frequency of glucose measurements (i.e., testing) for pre-meal test for specified days of the week, testing incidence having post-meal tests in a specific time period during a day, frequency of glucose measurements (i.e., testing) for post-meal test for a specified day of the week, or frequency of glucose measurements (i.e., testing) for post-meal test for specified days of the week.
- one advantage of the various embodimentsis the ability of the process (which includes processes, machine, system or method) to transform patient's data (e.g., blood glucose level, insulin injection or type of insulin, carbohydrates intakes etc.) so as to provide useful, concrete and tangible results such as, for example, patterns that are statistically or clinically significant in managing diabetes.
- patient's datae.g., blood glucose level, insulin injection or type of insulin, carbohydrates intakes etc.
- the systemtransform blood glucose data of a patient into textual patterns using statistical analysis to provide simple and direct explanation of various patterns rather than complicated charts and graphs of the same.
- a pre-meal test timemay be a time of a glucose measurement performed before eating a meal and a post-meal test time may be a time of a glucose measurement performed after eating a meal.
- blood glucose variability informationcan be provided in as simple text, shown here in display area D 3 , it is sometimes more informative to utilize a graphical format to convey trends in blood glucose variability, shown here in display area D 4 .
- a graphical chart over timeis provided that shows the blood glucose variability of the 1 st and 4 th interquartile ranges about a median glucose curve over time.
- Correlation between median blood glucose values (area D 4 ) and median insulin injections (area D 5 ) over the same time periode.g., “TP”, time of day, day of week, pre or post meal over a set time period
- TPtime of day, day of week, pre or post meal over a set time period
- the exemplary systemalso provides an alternative display format D 1 ′ for use by the patient after the visit with the physician or clinician.
- the display area D 2 ′ and D 3 ′provide the same patient information as display area D 1 of FIG. 18 .
- Display area D 4 ′provides for information that are believed to be more readily understood by a diabetic patient.
- display area D 4 ′shows the average blood glucose with the overall number of glucose measurements.
- the systemfurther categorizes in table D 4 A the data into the number of tests above a target (which is set by the physician), below target and hypoglycemic.
- the systemfurther provides a graphical chart 730 to demonstrate to the patient the data in table D 4 A in percentages.
- the graphical chart 730is a pie chart showing the percentage (of a total number of tests in a predetermined time period) above target 740 ; percentage within target 750 ; percentage below target; and percentage hypoglycemic.
- a physician or clinician recommendation for testingis provided in area D 6 .
- Other informationsuch as goals or targets is provided in display area D 7 .
Landscapes
- Engineering & Computer Science (AREA)
- Health & Medical Sciences (AREA)
- Public Health (AREA)
- Medical Informatics (AREA)
- General Health & Medical Sciences (AREA)
- Biomedical Technology (AREA)
- Epidemiology (AREA)
- Primary Health Care (AREA)
- Physics & Mathematics (AREA)
- Life Sciences & Earth Sciences (AREA)
- Data Mining & Analysis (AREA)
- General Physics & Mathematics (AREA)
- Chemical & Material Sciences (AREA)
- Hematology (AREA)
- Databases & Information Systems (AREA)
- Pathology (AREA)
- Medicinal Chemistry (AREA)
- Bioinformatics & Cheminformatics (AREA)
- Urology & Nephrology (AREA)
- Computational Mathematics (AREA)
- Molecular Biology (AREA)
- Theoretical Computer Science (AREA)
- Mathematical Analysis (AREA)
- Mathematical Optimization (AREA)
- Immunology (AREA)
- Pure & Applied Mathematics (AREA)
- Mathematical Physics (AREA)
- Operations Research (AREA)
- Evolutionary Biology (AREA)
- Software Systems (AREA)
- Diabetes (AREA)
- Algebra (AREA)
- Biotechnology (AREA)
- Cell Biology (AREA)
- Probability & Statistics with Applications (AREA)
- Microbiology (AREA)
- General Engineering & Computer Science (AREA)
- Bioinformatics & Computational Biology (AREA)
- Food Science & Technology (AREA)
- Analytical Chemistry (AREA)
Abstract
Description
represents the total number of substantially hypoglycemic glucose concentration measurements for all of the recurring time intervals i. The term
represents the number of all glucose concentration measurements for all of the recurring time intervals i.
represents a fraction that estimates the likelihood of observing a hypoglycemic event based on all of the recurring time intervals combined.
represents the total number of substantially hyperglycemic glucose concentration measurements for all of the recurring time intervals i. The term
represents the number of all glucose concentration measurements for all of the recurring time intervals i.
represents a fraction that estimates the likelihood of observing a hyperglycemic event based on all of the recurring time intervals combined.
| TABLE 1 |
| Exemplary Pattern Recognition Messages |
| Message Nos. | |
| 01 | Average number of glucose tests per week is |
| . | |
| 02 | Average number of glucose tests per week |
| flagged as pre-meal is . | |
| 03 | Average number of glucose tests per week |
| flagged as post-meal is . | |
| 04 | % of values are hypoglycemic. |
| 05 | Higher incidence of hypoglycemia present for: |
| . | |
| 06 | % of pre-meal values are |
| hypoglycemic. | |
| 07 | % of post-meal values are |
| hypoglycemic. | |
| 08 | All glucose readings are hyperglycemic. |
| 09 | % of values are hyperglycemic. |
| 10 | Higher incidence of hyperglycemia present for: |
| . | |
| 11 | Higher incidence of hyperglycemia present for: |
| . | |
| 12 | % of pre-meal values are |
| hyperglycemic. | |
| 13 | % of post-meal values are |
| hyperglycemic. | |
| 14 | High variability present. |
| 15 | Rebound from Low to High. |
| 16 | Overcorrection from High to Low. |
| 17 | The difference between pre and post-meal |
| medians is: | |
| 18 | The difference between daytime and nighttime |
| glucose readings is significant. | |
| 19 | Downward trend in the percentage of |
| hypoglycemic values. | |
| 20 | Downward trend in the percentage of |
| hyperglycemic values. | |
| 21 | .Note that no glucose tests were found in some |
| time slots. | |
| 22 | .Note that no glucose tests were found on |
| certain days. | |
| 23 | Nighttime readings are lower than daytime |
| readings. | |
| 24 | Daytime readings are lower than nighttime |
| readings. | |
| 25 | Upward trend in hypoglycemic events compared |
| to the previous reporting period. | |
| 26 | Downward trend in hypoglycemic events |
| compared to the previous reporting period. | |
| 27 | Upward trend in hyperglycemic events |
| compared to the previous reporting period. | |
| 28 | Downward trend in hyperglycemic events |
| compared to the previous reporting period. | |
| 29 | % of values are hypoglycemic. |
| 30 | Higher incidence of hypoglycemia present for: |
| . Note that no glucose tests were | |
| found in some time slots. | |
| 31 | Higher incidence of hypoglycemia present for: |
| . Note that no glucose tests were | |
| found on certain days. | |
| 32 | % of pre-meal values are |
| hypoglycemic. | |
| 33 | % of post-meal values are |
| hypoglycemic. | |
| 34 | % of values are hyperglycemic. |
| 35 | Higher incidence of hyperglycemia present for: |
| . Note that no glucose tests were | |
| found in some time slots. | |
| 36 | Higher incidence of hyperglycemia present for: |
| . Note that no glucose tests were | |
| found on certain days. | |
| 37 | % of pre-meal values are |
| hyperglycemic. | |
| 38 | % of post-meal values are |
| hyperglycemic. | |
Claims (3)
Priority Applications (8)
| Application Number | Priority Date | Filing Date | Title |
|---|---|---|---|
| US11/688,639US8758245B2 (en) | 2007-03-20 | 2007-03-20 | Systems and methods for pattern recognition in diabetes management |
| JP2008062994AJP5456981B2 (en) | 2007-03-20 | 2008-03-12 | Pattern recognition methods in diabetes management |
| CA2626349ACA2626349C (en) | 2007-03-20 | 2008-03-19 | Systems and methods for pattern recognition in diabetes management |
| CNA2008101258655ACN101290320A (en) | 2007-03-20 | 2008-03-20 | System and method for mode identification in diabetes management |
| EP08250986.0AEP2031534B1 (en) | 2007-03-20 | 2008-03-20 | Systems and methods for pattern recognition in diabetes management |
| EP11181875.3AEP2400415A3 (en) | 2007-03-20 | 2008-03-20 | Systems and methods for pattern recognition in diabetes management |
| EP11181876.1AEP2400416B1 (en) | 2007-03-20 | 2008-03-20 | Systems and methods for pattern recognition in diabetes management |
| US14/305,347US20140365138A1 (en) | 2007-03-20 | 2014-06-16 | Systems and methods for pattern recognition in diabetes management |
Applications Claiming Priority (1)
| Application Number | Priority Date | Filing Date | Title |
|---|---|---|---|
| US11/688,639US8758245B2 (en) | 2007-03-20 | 2007-03-20 | Systems and methods for pattern recognition in diabetes management |
Related Child Applications (1)
| Application Number | Title | Priority Date | Filing Date |
|---|---|---|---|
| US14/305,347DivisionUS20140365138A1 (en) | 2007-03-20 | 2014-06-16 | Systems and methods for pattern recognition in diabetes management |
Publications (2)
| Publication Number | Publication Date |
|---|---|
| US20080234992A1 US20080234992A1 (en) | 2008-09-25 |
| US8758245B2true US8758245B2 (en) | 2014-06-24 |
Family
ID=39764652
Family Applications (2)
| Application Number | Title | Priority Date | Filing Date |
|---|---|---|---|
| US11/688,639Active2031-12-10US8758245B2 (en) | 2007-03-20 | 2007-03-20 | Systems and methods for pattern recognition in diabetes management |
| US14/305,347AbandonedUS20140365138A1 (en) | 2007-03-20 | 2014-06-16 | Systems and methods for pattern recognition in diabetes management |
Family Applications After (1)
| Application Number | Title | Priority Date | Filing Date |
|---|---|---|---|
| US14/305,347AbandonedUS20140365138A1 (en) | 2007-03-20 | 2014-06-16 | Systems and methods for pattern recognition in diabetes management |
Country Status (5)
| Country | Link |
|---|---|
| US (2) | US8758245B2 (en) |
| EP (3) | EP2031534B1 (en) |
| JP (1) | JP5456981B2 (en) |
| CN (1) | CN101290320A (en) |
| CA (1) | CA2626349C (en) |
Cited By (15)
| Publication number | Priority date | Publication date | Assignee | Title |
|---|---|---|---|---|
| US20140081103A1 (en)* | 2012-09-17 | 2014-03-20 | Lifescan, Inc. | Method and system to derive glycemic patterns from clustering of glucose data |
| US9351670B2 (en) | 2012-12-31 | 2016-05-31 | Abbott Diabetes Care Inc. | Glycemic risk determination based on variability of glucose levels |
| WO2016174206A1 (en) | 2015-04-29 | 2016-11-03 | Ascensia Diabetes Care Holdings Ag | Location-based wireless diabetes management systems, methods and apparatus |
| US10010291B2 (en) | 2013-03-15 | 2018-07-03 | Abbott Diabetes Care Inc. | System and method to manage diabetes based on glucose median, glucose variability, and hypoglycemic risk |
| WO2018178048A1 (en) | 2017-03-28 | 2018-10-04 | Ascensia Diabetes Care Holdings Ag | Diabetes management systems, methods and apparatus for user reminders, pattern recognition, and interfaces |
| US10142823B2 (en) | 2014-07-07 | 2018-11-27 | Ascensia Diabetes Care Holdings Ag | Device pairing taking into account at least one condition |
| US10201296B2 (en) | 2010-11-11 | 2019-02-12 | Ascensia Diabetes Care Holdings Ag | Apparatus, systems, and methods adapted to transmit analyte data having common electronic architecture |
| USD853583S1 (en) | 2017-03-29 | 2019-07-09 | Becton, Dickinson And Company | Hand-held device housing |
| US10383580B2 (en) | 2012-12-31 | 2019-08-20 | Abbott Diabetes Care Inc. | Analysis of glucose median, variability, and hypoglycemia risk for therapy guidance |
| US10391242B2 (en) | 2012-06-07 | 2019-08-27 | Medtronic Minimed, Inc. | Diabetes therapy management system for recommending bolus calculator adjustments |
| US10432717B2 (en) | 2014-01-10 | 2019-10-01 | Ascensia Diabetes Care Holdings Ag | Setup synchronization apparatus and methods for end user medical devices |
| US10956821B2 (en) | 2016-11-29 | 2021-03-23 | International Business Machines Corporation | Accurate temporal event predictive modeling |
| US20210110929A1 (en)* | 2010-06-28 | 2021-04-15 | Heinrich Anhold | System and method for optimizing patient-specific intervention strategies using point of care diagnostics |
| US11065056B2 (en) | 2016-03-24 | 2021-07-20 | Sofradim Production | System and method of generating a model and simulating an effect on a surgical repair site |
| US11237152B2 (en) | 2014-04-11 | 2022-02-01 | Ascensia Diabetes Care Holdings Ag | Wireless transmitter adapters for battery-operated biosensor meters and methods of providing same |
Families Citing this family (118)
| Publication number | Priority date | Publication date | Assignee | Title |
|---|---|---|---|---|
| US9788771B2 (en) | 2006-10-23 | 2017-10-17 | Abbott Diabetes Care Inc. | Variable speed sensor insertion devices and methods of use |
| US8219173B2 (en) | 2008-09-30 | 2012-07-10 | Abbott Diabetes Care Inc. | Optimizing analyte sensor calibration |
| US8346335B2 (en) | 2008-03-28 | 2013-01-01 | Abbott Diabetes Care Inc. | Analyte sensor calibration management |
| US8758245B2 (en) | 2007-03-20 | 2014-06-24 | Lifescan, Inc. | Systems and methods for pattern recognition in diabetes management |
| US20080234943A1 (en)* | 2007-03-20 | 2008-09-25 | Pinaki Ray | Computer program for diabetes management |
| US20080235053A1 (en)* | 2007-03-20 | 2008-09-25 | Pinaki Ray | Communication medium for diabetes management |
| US10111608B2 (en) | 2007-04-14 | 2018-10-30 | Abbott Diabetes Care Inc. | Method and apparatus for providing data processing and control in medical communication system |
| US8103471B2 (en) | 2007-05-14 | 2012-01-24 | Abbott Diabetes Care Inc. | Method and apparatus for providing data processing and control in a medical communication system |
| US8600681B2 (en)* | 2007-05-14 | 2013-12-03 | Abbott Diabetes Care Inc. | Method and apparatus for providing data processing and control in a medical communication system |
| US8260558B2 (en) | 2007-05-14 | 2012-09-04 | Abbott Diabetes Care Inc. | Method and apparatus for providing data processing and control in a medical communication system |
| ES2693097T3 (en) | 2007-05-30 | 2018-12-07 | Ascensia Diabetes Care Holdings Ag | System and method for managing health data |
| US8449523B2 (en)* | 2007-06-15 | 2013-05-28 | Animas Corporation | Method of operating a medical device and at least a remote controller for such medical device |
| US8932250B2 (en)* | 2007-06-15 | 2015-01-13 | Animas Corporation | Systems and methods to pair a medical device and a remote controller for such medical device |
| US8444595B2 (en)* | 2007-06-15 | 2013-05-21 | Animas Corporation | Methods to pair a medical device and at least a remote controller for such medical device |
| US9391670B2 (en) | 2007-06-15 | 2016-07-12 | Animas Corporation | Methods for secure communication and pairing of a medical infusion device and a remote controller for such medical device |
| AU2008265542B2 (en) | 2007-06-21 | 2014-07-24 | Abbott Diabetes Care Inc. | Health monitor |
| WO2008157820A1 (en) | 2007-06-21 | 2008-12-24 | Abbott Diabetes Care, Inc. | Health management devices and methods |
| US20100145725A1 (en)* | 2008-02-12 | 2010-06-10 | Alferness Clifton A | System and method for managing type 1 diabetes mellitus through a personal predictive management tool |
| US20100138203A1 (en)* | 2008-02-12 | 2010-06-03 | Alferness Clifton A | System and method for actively managing type 2 diabetes mellitus on a personalized basis |
| US20100198020A1 (en)* | 2008-02-12 | 2010-08-05 | Alferness Clifton A | System And Method For Computer-Implemented Method For Actively Managing Increased Insulin Resistance In Type 2 Diabetes Mellitus |
| US20100198021A1 (en)* | 2008-02-12 | 2010-08-05 | Alferness Clifton A | Computer-implemented method for providing a tunable personalized tool for estimating glycated hemoglobin |
| US20100138453A1 (en)* | 2008-02-12 | 2010-06-03 | Alferness Clifton A | System and method for generating a personalized diabetes management tool for diabetes mellitus |
| US20100145174A1 (en)* | 2008-02-12 | 2010-06-10 | Alferness Clifton A | System And Method For Providing A Personalized Tool For Estimating Glycated Hemoglobin |
| US20110077930A1 (en)* | 2008-02-12 | 2011-03-31 | Alferness Clifton A | Computer-implemented method for providing a personalized tool for estimating 1,5-anhydroglucitol |
| US20100145173A1 (en)* | 2008-02-12 | 2010-06-10 | Alferness Clifton A | System and method for creating a personalized tool predicting a time course of blood glucose affect in diabetes mellitus |
| US20100145670A1 (en)* | 2008-02-12 | 2010-06-10 | Alferness Clifton A | System and method for managing type 2 diabetes mellitus through a personal predictive management tool |
| US20100137786A1 (en)* | 2008-02-12 | 2010-06-03 | Alferness Clifton A | System and method for actively managing type 1 diabetes mellitus on a personalized basis |
| US20090240127A1 (en)* | 2008-03-20 | 2009-09-24 | Lifescan, Inc. | Methods of determining pre or post meal time slots or intervals in diabetes management |
| US20100095229A1 (en)* | 2008-09-18 | 2010-04-15 | Abbott Diabetes Care, Inc. | Graphical user interface for glucose monitoring system |
| EP2348959B1 (en) | 2008-10-31 | 2018-09-19 | Covidien LP | System for facilitating observation of monitored physiologic data |
| US9326707B2 (en) | 2008-11-10 | 2016-05-03 | Abbott Diabetes Care Inc. | Alarm characterization for analyte monitoring devices and systems |
| JP5388564B2 (en)* | 2008-12-22 | 2014-01-15 | シスメックス株式会社 | Diabetes care support system, computer program, and recording medium |
| US10456036B2 (en) | 2008-12-23 | 2019-10-29 | Roche Diabetes Care, Inc. | Structured tailoring |
| US9918635B2 (en) | 2008-12-23 | 2018-03-20 | Roche Diabetes Care, Inc. | Systems and methods for optimizing insulin dosage |
| US8849458B2 (en) | 2008-12-23 | 2014-09-30 | Roche Diagnostics Operations, Inc. | Collection device with selective display of test results, method and computer program product thereof |
| CA2747309C (en)* | 2008-12-23 | 2023-09-26 | F. Hoffmann-La Roche Ag | Structured testing method for diagnostic or therapy support of a patient with a chronic disease and devices thereof |
| US9117015B2 (en) | 2008-12-23 | 2015-08-25 | Roche Diagnostics Operations, Inc. | Management method and system for implementation, execution, data collection, and data analysis of a structured collection procedure which runs on a collection device |
| US20120011125A1 (en) | 2008-12-23 | 2012-01-12 | Roche Diagnostics Operations, Inc. | Management method and system for implementation, execution, data collection, and data analysis of a structured collection procedure which runs on a collection device |
| US10437962B2 (en) | 2008-12-23 | 2019-10-08 | Roche Diabetes Care Inc | Status reporting of a structured collection procedure |
| US20100174553A1 (en)* | 2008-12-24 | 2010-07-08 | Medtronic Minimed, Inc. | Diabetes Therapy Management System |
| US9402544B2 (en) | 2009-02-03 | 2016-08-02 | Abbott Diabetes Care Inc. | Analyte sensor and apparatus for insertion of the sensor |
| CA3062122C (en)* | 2009-02-04 | 2022-05-17 | Sanofi-Aventis Deutschland Gmbh | Medical device and method for providing information for glycemic control |
| EP2393415B1 (en)* | 2009-02-04 | 2015-11-25 | Sanofi-Aventis Deutschland GmbH | Medical system and method for providing information for glycemic control |
| US8497777B2 (en) | 2009-04-15 | 2013-07-30 | Abbott Diabetes Care Inc. | Analyte monitoring system having an alert |
| EP2420184B1 (en) | 2009-04-17 | 2016-05-11 | ARKRAY, Inc. | Data provision method, program and server device |
| EP2425209A4 (en)* | 2009-04-29 | 2013-01-09 | Abbott Diabetes Care Inc | METHOD AND SYSTEM FOR PROVIDING REAL-TIME ANALYTE SENSOR CALIBRATION WITH RETROSPECTIVE FILLING |
| WO2010135646A1 (en) | 2009-05-22 | 2010-11-25 | Abbott Diabetes Care Inc. | Usability features for integrated insulin delivery system |
| WO2010138856A1 (en) | 2009-05-29 | 2010-12-02 | Abbott Diabetes Care Inc. | Medical device antenna systems having external antenna configurations |
| WO2010141922A1 (en) | 2009-06-04 | 2010-12-09 | Abbott Diabetes Care Inc. | Method and system for updating a medical device |
| US20100331627A1 (en)* | 2009-06-26 | 2010-12-30 | Roche Diagnostics Operations, Inc. | Adherence indication tool for chronic disease management and method thereof |
| EP3973855A1 (en)* | 2009-06-30 | 2022-03-30 | Lifescan, Inc. | Analyte testing methods and device for calculating basal insulin therapy |
| EP3001194B1 (en) | 2009-08-31 | 2019-04-17 | Abbott Diabetes Care, Inc. | Medical devices and methods |
| LT4147999T (en) | 2009-08-31 | 2024-10-10 | Abbott Diabetes Care, Inc. | MEDICAL DEVICE DISPLAYS |
| JP5830466B2 (en)* | 2009-09-02 | 2015-12-09 | ユニバーシティ オブ ヴァージニア パテント ファウンデーション | Method for observing the possibility of occurrence of hypoglycemia in a patient within a predetermined future period, system therefor, and computer program therefor |
| EP2644088B1 (en)* | 2009-09-29 | 2017-01-18 | Lifescan Scotland Limited | Analyte testing method and device for diabetes management |
| US9949672B2 (en)* | 2009-12-17 | 2018-04-24 | Ascensia Diabetes Care Holdings Ag | Apparatus, systems and methods for determining and displaying pre-event and post-event analyte concentration levels |
| CA2728831A1 (en)* | 2010-01-22 | 2011-07-22 | Lifescan, Inc. | Diabetes management unit, method, and system |
| US20110184653A1 (en)* | 2010-01-22 | 2011-07-28 | Lifescan, Inc. | Analyte testing method and system |
| BR112012021572A2 (en) | 2010-02-25 | 2016-10-25 | Lifescan Scotland Ltd | analyte testing method and system with notification of high and low blood glucose trends. |
| US8532933B2 (en) | 2010-06-18 | 2013-09-10 | Roche Diagnostics Operations, Inc. | Insulin optimization systems and testing methods with adjusted exit criterion accounting for system noise associated with biomarkers |
| US10575791B2 (en)* | 2010-12-22 | 2020-03-03 | Roche Diabetes Care, Inc. | Automatic recognition of known patterns in physiological measurement data |
| US20120173151A1 (en) | 2010-12-29 | 2012-07-05 | Roche Diagnostics Operations, Inc. | Methods of assessing diabetes treatment protocols based on protocol complexity levels and patient proficiency levels |
| WO2012108939A1 (en)* | 2011-02-11 | 2012-08-16 | Abbott Diabetes Care Inc. | Feedback from cloud or hcp to payer or patient via meter or cell phone |
| US9913599B2 (en) | 2011-02-11 | 2018-03-13 | Abbott Diabetes Care Inc. | Software applications residing on handheld analyte determining devices |
| WO2012108936A1 (en) | 2011-02-11 | 2012-08-16 | Abbott Diabetes Care Inc. | Data synchronization between two or more analyte detecting devices in a database |
| US9033877B2 (en)* | 2011-02-23 | 2015-05-19 | Roche Diabetes Care, Inc. | Device and method for determining blood glucose characteristics |
| CN107019515B (en) | 2011-02-28 | 2021-02-26 | 雅培糖尿病护理公司 | Method of displaying sensor readings and analyte monitoring device and method of operating the same |
| WO2012133221A1 (en)* | 2011-03-31 | 2012-10-04 | テルモ株式会社 | Blood-glucose level management system |
| US20140031658A1 (en)* | 2011-04-12 | 2014-01-30 | Hui Zheng | System and method for monitoring glucose or other compositions in an individual |
| US8755938B2 (en) | 2011-05-13 | 2014-06-17 | Roche Diagnostics Operations, Inc. | Systems and methods for handling unacceptable values in structured collection protocols |
| US8766803B2 (en) | 2011-05-13 | 2014-07-01 | Roche Diagnostics Operations, Inc. | Dynamic data collection |
| US9974472B2 (en) | 2011-06-16 | 2018-05-22 | Abbott Diabetes Care Inc. | Temperature-compensated analyte monitoring devices, systems, and methods thereof |
| US9069536B2 (en) | 2011-10-31 | 2015-06-30 | Abbott Diabetes Care Inc. | Electronic devices having integrated reset systems and methods thereof |
| US8710993B2 (en) | 2011-11-23 | 2014-04-29 | Abbott Diabetes Care Inc. | Mitigating single point failure of devices in an analyte monitoring system and methods thereof |
| WO2013078426A2 (en) | 2011-11-25 | 2013-05-30 | Abbott Diabetes Care Inc. | Analyte monitoring system and methods of use |
| US9136939B2 (en)* | 2011-12-29 | 2015-09-15 | Roche Diabetes Care, Inc. | Graphical user interface pertaining to a bolus calculator residing on a handheld diabetes management device |
| US20140024907A1 (en)* | 2012-07-19 | 2014-01-23 | Lifescan, Inc. | Method and system to indicate hyperglycemia or hypoglycemia for people with diabetes |
| US8756043B2 (en) | 2012-07-26 | 2014-06-17 | Rimidi Diabetes, Inc. | Blood glucose meter and computer-implemented method for improving glucose management through modeling of circadian profiles |
| US8744828B2 (en) | 2012-07-26 | 2014-06-03 | Rimidi Diabetes, Inc. | Computer-implemented system and method for improving glucose management through modeling of circadian profiles |
| US8768673B2 (en) | 2012-07-26 | 2014-07-01 | Rimidi Diabetes, Inc. | Computer-implemented system and method for improving glucose management through cloud-based modeling of circadian profiles |
| US20140074059A1 (en)* | 2012-09-12 | 2014-03-13 | Lifescan, Inc. | Method and system to indicate glycemic impacts of insulin infusion pump commands |
| US9592002B2 (en) | 2012-09-21 | 2017-03-14 | Lifescan, Inc. | Method and system to derive multiple glycemic patterns from glucose measurements during time of the day |
| WO2014052136A1 (en) | 2012-09-26 | 2014-04-03 | Abbott Diabetes Care Inc. | Method and apparatus for improving lag correction during in vivo measurement of analyte concentration with analyte concentration variability and range data |
| US9258350B2 (en)* | 2012-10-01 | 2016-02-09 | Dexcom, Inc. | Analyte data retriever |
| US9119529B2 (en) | 2012-10-30 | 2015-09-01 | Dexcom, Inc. | Systems and methods for dynamically and intelligently monitoring a host's glycemic condition after an alert is triggered |
| US20140129151A1 (en) | 2012-11-07 | 2014-05-08 | Dexcom, Inc. | Systems and methods for managing glycemic variability |
| PL3008649T3 (en)* | 2013-06-13 | 2020-03-31 | F.Hoffmann-La Roche Ag | Method and apparatus for characteristic monitoring in conjunction with a mode of continuously measured blood glucose values and computer program product |
| US9965587B2 (en)* | 2013-07-08 | 2018-05-08 | Roche Diabetes Care, Inc. | Reminder, classification, and pattern identification systems and methods for handheld diabetes management devices |
| US9459231B2 (en)* | 2013-08-29 | 2016-10-04 | Lifescan Scotland Limited | Method and system to determine erroneous measurement signals during a test measurement sequence |
| EP2851824A1 (en) | 2013-09-20 | 2015-03-25 | Sanofi-Aventis Deutschland GmbH | Data management unit for supporting health control |
| EP2851823A1 (en)* | 2013-09-20 | 2015-03-25 | Sanofi-Aventis Deutschland GmbH | Data management unit for supporting health control |
| CN106455996B (en)* | 2014-03-31 | 2020-09-29 | 皇家飞利浦有限公司 | Methods and devices for non-invasive monitoring and identification of drug effects and interactions |
| USD785673S1 (en)* | 2014-09-03 | 2017-05-02 | Rockwell Collins, Inc. | Avionics display screen with computer icon |
| CN104622449A (en)* | 2015-02-04 | 2015-05-20 | 赵秀伟 | Diabetes treatment case |
| CN104665840B (en)* | 2015-03-02 | 2017-11-21 | 桂林麦迪胜电子科技有限公司 | Woundless blood sugar measuring method and finger tip measuring probe |
| US10617363B2 (en)* | 2015-04-02 | 2020-04-14 | Roche Diabetes Care, Inc. | Methods and systems for analyzing glucose data measured from a person having diabetes |
| DE202016009220U1 (en)* | 2015-07-10 | 2024-07-09 | Abbott Diabetes Care, Inc. | Device and system for dynamic glucose profile response to physiological parameters |
| EP4552567A1 (en)* | 2016-05-02 | 2025-05-14 | DexCom, Inc. | System for providing alerts optimized for a user |
| CA3024111A1 (en)* | 2016-05-13 | 2017-11-16 | WellDoc, Inc. | Database management and graphical user interfaces for measurements collected by analyzing blood |
| CN108335750B (en)* | 2017-01-20 | 2022-08-09 | 华广生技股份有限公司 | Method, system and computer storage medium for dynamically analyzing blood glucose values |
| US11071478B2 (en) | 2017-01-23 | 2021-07-27 | Abbott Diabetes Care Inc. | Systems, devices and methods for analyte sensor insertion |
| ES3007562T3 (en)* | 2017-02-14 | 2025-03-20 | Hoffmann La Roche | A computer-implemented method and a portable device for analyzing glucose monitoring data indicative of a glucose level in a bodily fluid, and a non-transitory computer readable medium |
| EP3586338A1 (en)* | 2017-02-23 | 2020-01-01 | Novo Nordisk A/S | Systems and methods for communicating a dose |
| EP3811375A1 (en) | 2018-06-22 | 2021-04-28 | Sanofi | Predicting rates of hypoglycemia by a machine learning system |
| US11965900B2 (en) | 2018-11-09 | 2024-04-23 | Wyatt Technology, Llc | Indicating a status of an analytical instrument on a screen of the analytical instrument |
| TWI680746B (en)* | 2018-11-21 | 2020-01-01 | 晶神醫創股份有限公司 | Method and system for neurological event detection |
| CN113544794B (en)* | 2018-12-19 | 2025-03-11 | 赛诺菲 | Pattern recognition engine for blood glucose measurement |
| CN110600128A (en)* | 2019-09-24 | 2019-12-20 | 东北大学 | Blood sugar management system for insulin dependent diabetes mellitus patient and use method |
| CN111110249B (en)* | 2019-12-27 | 2021-08-27 | 中国科学院深圳先进技术研究院 | Blood glucose fluctuation evaluation method and evaluation device |
| AU2020445257A1 (en)* | 2020-04-29 | 2022-10-20 | Dexcom, Inc. | Hypoglycemic event prediction using machine learning |
| CN111631730B (en)* | 2020-05-15 | 2023-06-06 | 中国科学院深圳先进技术研究院 | Hypoglycemia early warning method and system based on fusion of sensing data and physiological information |
| CA3188510A1 (en) | 2020-08-31 | 2022-03-03 | Vivek S. RAO | Systems, devices, and methods for analyte sensor insertion |
| USD1013704S1 (en)* | 2021-07-09 | 2024-02-06 | The Regents Of The University Of Colorado, A Body Corporate | Display screen or portion thereof with graphical user interface |
| USD1014518S1 (en)* | 2021-07-09 | 2024-02-13 | The Regents Of The University Of Colorado, A Body Corporate | Display screen or portion thereof with graphical user interface |
| CN115804593A (en)* | 2021-09-15 | 2023-03-17 | 深圳硅基仿生科技股份有限公司 | Glucose monitoring system for glucose concentration levels before and after meals |
| CN115067909A (en)* | 2022-07-21 | 2022-09-20 | 中国民用航空总局第二研究所 | Remote tower human factor work efficiency determination method based on biological information data processing |
| US20240252067A1 (en)* | 2023-01-10 | 2024-08-01 | Abbott Diabetes Care Inc. | Systems, devices, and methods for wellness monitoring with physiological sensors |
| CN119113427B (en)* | 2024-11-08 | 2025-02-14 | 华硼中子科技(杭州)有限公司 | BNCT biological dose calculation method, terminal and medium |
Citations (99)
| Publication number | Priority date | Publication date | Assignee | Title |
|---|---|---|---|---|
| US4695954A (en) | 1984-10-31 | 1987-09-22 | Rose Robert J | Modular medication dispensing system and apparatus utilizing portable memory device |
| US4731726A (en) | 1986-05-19 | 1988-03-15 | Healthware Corporation | Patient-operated glucose monitor and diabetes management system |
| US4779199A (en) | 1984-07-13 | 1988-10-18 | Sumitomo Electric Industries, Ltd. | Patient monitor |
| US4817044A (en) | 1987-06-01 | 1989-03-28 | Ogren David A | Collection and reporting system for medical appliances |
| US5019974A (en) | 1987-05-01 | 1991-05-28 | Diva Medical Systems Bv | Diabetes management system and apparatus |
| JPH04348747A (en) | 1990-10-29 | 1992-12-03 | Miles Inc | Analytic and interpretive system for diabetes data |
| US5216597A (en) | 1987-05-01 | 1993-06-01 | Diva Medical Systems Bv | Diabetes therapy management system, apparatus and method |
| US5307263A (en) | 1992-11-17 | 1994-04-26 | Raya Systems, Inc. | Modular microprocessor-based health monitoring system |
| US5319363A (en) | 1990-08-31 | 1994-06-07 | The General Hospital Corporation | Network for portable patient monitoring devices |
| US5341291A (en) | 1987-12-09 | 1994-08-23 | Arch Development Corporation | Portable medical interactive test selector having plug-in replaceable memory |
| US5376070A (en) | 1992-09-29 | 1994-12-27 | Minimed Inc. | Data transfer system for an infusion pump |
| US5500854A (en) | 1992-12-23 | 1996-03-19 | Instrumentarium Corporation | Data transmission system and equipment |
| US5558638A (en) | 1993-04-30 | 1996-09-24 | Healthdyne, Inc. | Patient monitor and support system |
| US5590648A (en) | 1992-11-30 | 1997-01-07 | Tremont Medical | Personal health care system |
| US5626144A (en) | 1994-05-23 | 1997-05-06 | Enact Health Management Systems | System for monitoring and reporting medical measurements |
| US5713856A (en) | 1995-03-13 | 1998-02-03 | Alaris Medical Systems, Inc. | Modular patient care system |
| US5772586A (en) | 1996-02-12 | 1998-06-30 | Nokia Mobile Phones, Ltd. | Method for monitoring the health of a patient |
| US5822715A (en) | 1997-01-10 | 1998-10-13 | Health Hero Network | Diabetes management system and method for controlling blood glucose |
| US5878384A (en) | 1996-03-29 | 1999-03-02 | At&T Corp | System and method for monitoring information flow and performing data collection |
| US5925021A (en) | 1994-03-09 | 1999-07-20 | Visionary Medical Products, Inc. | Medication delivery device with a microprocessor and characteristic monitor |
| US5946659A (en) | 1995-02-28 | 1999-08-31 | Clinicomp International, Inc. | System and method for notification and access of patient care information being simultaneously entered |
| US5960403A (en) | 1992-11-17 | 1999-09-28 | Health Hero Network | Health management process control system |
| US5974389A (en) | 1996-03-01 | 1999-10-26 | Clark; Melanie Ann | Medical record management system and process with improved workflow features |
| US5997476A (en) | 1997-03-28 | 1999-12-07 | Health Hero Network, Inc. | Networked system for interactive communication and remote monitoring of individuals |
| WO2000004512A2 (en) | 1998-07-20 | 2000-01-27 | Smithkline Beecham Corporation | Method and system for identifying at risk patients diagnosed with diabetes |
| US6022315A (en) | 1993-12-29 | 2000-02-08 | First Opinion Corporation | Computerized medical diagnostic and treatment advice system including network access |
| US6024699A (en) | 1998-03-13 | 2000-02-15 | Healthware Corporation | Systems, methods and computer program products for monitoring, diagnosing and treating medical conditions of remotely located patients |
| US6049764A (en) | 1997-11-12 | 2000-04-11 | City Of Hope | Method and system for real-time control of analytical and diagnostic instruments |
| US6081786A (en) | 1998-04-03 | 2000-06-27 | Triangle Pharmaceuticals, Inc. | Systems, methods and computer program products for guiding the selection of therapeutic treatment regimens |
| US6134504A (en) | 1997-10-31 | 2000-10-17 | Mercury Diagnostics, Incorporated | Analyte concentration information collection and communication system |
| US6144922A (en) | 1997-10-31 | 2000-11-07 | Mercury Diagnostics, Incorporated | Analyte concentration information collection and communication system |
| WO2001000086A1 (en) | 1999-06-25 | 2001-01-04 | Delphi Health Systems, Inc. | Chronic disease monitor |
| US6206829B1 (en) | 1996-07-12 | 2001-03-27 | First Opinion Corporation | Computerized medical diagnostic and treatment advice system including network access |
| US6225901B1 (en) | 1997-03-07 | 2001-05-01 | Cardionet, Inc. | Reprogrammable remote sensor monitoring system |
| US6234964B1 (en) | 1997-03-13 | 2001-05-22 | First Opinion Corporation | Disease management system and method |
| US6270455B1 (en) | 1997-03-28 | 2001-08-07 | Health Hero Network, Inc. | Networked system for interactive communications and remote monitoring of drug delivery |
| JP2001245900A (en) | 2000-03-02 | 2001-09-11 | Arkray Inc | Graph, its indication method and apparatus for its indication |
| US6336900B1 (en) | 1999-04-12 | 2002-01-08 | Agilent Technologies, Inc. | Home hub for reporting patient health parameters |
| US6338713B1 (en) | 1998-08-18 | 2002-01-15 | Aspect Medical Systems, Inc. | System and method for facilitating clinical decision making |
| WO2002005702A2 (en) | 2000-07-18 | 2002-01-24 | Healthetech, Inc. | Closed loop glycemic index system |
| WO2002015777A1 (en) | 2000-08-18 | 2002-02-28 | Cygnus, Inc. | Methods and devices for prediction of hypoglycemic events |
| US6352505B1 (en) | 1997-08-18 | 2002-03-05 | Jonathan David Bortz | Device for diabetes management |
| JP2002132952A (en) | 2000-04-28 | 2002-05-10 | Bryan K Chan | Method and system for managing chronic disease and wellness online |
| US6390986B1 (en) | 1999-05-27 | 2002-05-21 | Rutgers, The State University Of New Jersey | Classification of heart rate variability patterns in diabetics using cepstral analysis |
| US6406426B1 (en) | 1999-11-03 | 2002-06-18 | Criticare Systems | Medical monitoring and alert system for use with therapeutic devices |
| US6418346B1 (en) | 1999-12-14 | 2002-07-09 | Medtronic, Inc. | Apparatus and method for remote therapy and diagnosis in medical devices via interface systems |
| US6422061B1 (en) | 1999-03-03 | 2002-07-23 | Cyrano Sciences, Inc. | Apparatus, systems and methods for detecting and transmitting sensory data over a computer network |
| US6450956B1 (en) | 2000-11-06 | 2002-09-17 | Siemens Corporate Research, Inc. | System and method for treatment and outcome measurement analysis |
| JP2003500744A (en) | 1999-05-20 | 2003-01-07 | メドトロニック ミニメド インコーポレイテッド | Comprehensive medical information management system |
| US6524240B1 (en) | 2000-11-22 | 2003-02-25 | Medwave, Inc. | Docking station for portable medical devices |
| US6540672B1 (en) | 1998-12-09 | 2003-04-01 | Novo Nordisk A/S | Medical system and a method of controlling the system for use by a patient for medical self treatment |
| US6544212B2 (en) | 2001-07-31 | 2003-04-08 | Roche Diagnostics Corporation | Diabetes management system |
| US6544174B2 (en) | 2000-05-19 | 2003-04-08 | Welch Allyn Protocol, Inc. | Patient monitoring system |
| US6551243B2 (en) | 2001-01-24 | 2003-04-22 | Siemens Medical Solutions Health Services Corporation | System and user interface for use in providing medical information and health care delivery support |
| US6558351B1 (en) | 1999-06-03 | 2003-05-06 | Medtronic Minimed, Inc. | Closed loop system for controlling insulin infusion |
| US6575900B1 (en) | 1999-03-29 | 2003-06-10 | Beckman Coulter, Inc. | Meter with integrated database and simplified telemedicine capability |
| US6579231B1 (en) | 1998-03-27 | 2003-06-17 | Mci Communications Corporation | Personal medical monitoring unit and system |
| US6604050B2 (en) | 2000-06-16 | 2003-08-05 | Bayer Corporation | System, method and biosensor apparatus for data communications with a personal data assistant |
| US6611846B1 (en) | 1999-10-30 | 2003-08-26 | Medtamic Holdings | Method and system for medical patient data analysis |
| US6635016B2 (en) | 2000-08-21 | 2003-10-21 | Joseph Finkelstein | Method and system for collecting and processing of biomedical information |
| US6635167B1 (en)* | 1997-12-04 | 2003-10-21 | Roche Diagnostics Corporation | Apparatus and method for determining the concentration of a component of a sample |
| US6645142B2 (en) | 2000-12-01 | 2003-11-11 | Optiscan Biomedical Corporation | Glucose monitoring instrument having network connectivity |
| US20030216628A1 (en) | 2002-01-28 | 2003-11-20 | Bortz Jonathan David | Methods and systems for assessing glycemic control using predetermined pattern label analysis of blood glucose readings |
| US6656114B1 (en) | 1998-11-30 | 2003-12-02 | Novo Noadisk A/S | Method and a system for assisting a user in a medical self treatment, said self treatment comprising a plurality of actions |
| JP2004024699A (en) | 2002-06-27 | 2004-01-29 | Asahi Medical Co Ltd | Blood sugar management system, blood sugar management program, wearing system, and blood sugar management method |
| US6692436B1 (en) | 2000-04-14 | 2004-02-17 | Computerized Screening, Inc. | Health care information system |
| EP1418523A2 (en) | 2002-11-06 | 2004-05-12 | Sysmex Corporation | Diagnosis support system for diabetes |
| JP2004154547A (en) | 2002-06-05 | 2004-06-03 | Diabetes Diagnostics Inc | Specific component testing device, data storage method and data processing method |
| US6781522B2 (en) | 2001-08-22 | 2004-08-24 | Kivalo, Inc. | Portable storage case for housing a medical monitoring device and an associated method for communicating therewith |
| US6799149B2 (en) | 2000-12-29 | 2004-09-28 | Medtronic, Inc. | Therapy management techniques for an implantable medical device |
| US6804558B2 (en) | 1999-07-07 | 2004-10-12 | Medtronic, Inc. | System and method of communicating between an implantable medical device and a remote computer system or health care provider |
| US6872200B2 (en) | 1998-08-18 | 2005-03-29 | Medtronic Minimed, Inc. | External infusion device with remote programming, bolus estimator and/or vibration alarm capabilities |
| US6915170B2 (en) | 1995-05-15 | 2005-07-05 | Alaris Medical Systems, Inc. | System and method for collecting data and managing patient care |
| US20050159656A1 (en) | 2003-03-07 | 2005-07-21 | Hockersmith Linda J. | Method and apparatus for presentation of noninvasive glucose concentration information |
| WO2005065538A2 (en) | 2003-12-31 | 2005-07-21 | Medtronic Minimed, Inc. | System for monitoring physiological characteristics |
| US20050187789A1 (en) | 2004-02-25 | 2005-08-25 | Cardiac Pacemakers, Inc. | Advanced patient and medication therapy management system and method |
| WO2005081170A2 (en) | 2004-02-19 | 2005-09-01 | Edward Henry Mathews | Diabetes management and patient database system via mobile communication device |
| US20050214892A1 (en)* | 2002-08-13 | 2005-09-29 | Kovatchev Boris P | Method, system, and computer program product for the processing of self-monitoring blood glucose(smbg)data to enhance diabetic self-management |
| WO2005093629A2 (en) | 2004-03-26 | 2005-10-06 | Novo Nordisk A/S | Device for displaying data relevant for a diabetic patient |
| US20050267780A1 (en) | 2004-06-01 | 2005-12-01 | Pinaki Ray | Methods and systems of automating medical device data management |
| US20060010098A1 (en) | 2004-06-04 | 2006-01-12 | Goodnow Timothy T | Diabetes care host-client architecture and data management system |
| US20060106644A1 (en) | 2001-05-30 | 2006-05-18 | Koo Charles C | Patient referral and physician-to-physician marketing method and system |
| US20060173260A1 (en) | 2005-01-31 | 2006-08-03 | Gmms Ltd | System, device and method for diabetes treatment and monitoring |
| US20060189863A1 (en) | 1998-04-30 | 2006-08-24 | Abbott Diabetes Care, Inc. | Analyte monitoring device and methods of use |
| US20060264895A1 (en) | 2005-05-18 | 2006-11-23 | Flanders Samuel J | System for managing glucose levels in patients with diabetes or hyperglycemia |
| WO2007005170A2 (en) | 2005-06-29 | 2007-01-11 | Medtronic Minimed, Inc. | Flexible glucose analysis using varying time report deltas and configurable glucose target ranges |
| US20070033074A1 (en) | 2005-06-03 | 2007-02-08 | Medtronic Minimed, Inc. | Therapy management system |
| US20080071580A1 (en) | 2005-06-03 | 2008-03-20 | Marcus Alan O | System and method for medical evaluation and monitoring |
| GB2443434A (en) | 2006-11-02 | 2008-05-07 | Richard Butler | Method for predicting nocturnal hypoglycaemia |
| WO2008071218A1 (en) | 2006-12-14 | 2008-06-19 | Egomedical Swiss Ag | Monitoring device |
| US20080154513A1 (en)* | 2006-12-21 | 2008-06-26 | University Of Virginia Patent Foundation | Systems, Methods and Computer Program Codes for Recognition of Patterns of Hyperglycemia and Hypoglycemia, Increased Glucose Variability, and Ineffective Self-Monitoring in Diabetes |
| US20080234992A1 (en) | 2007-03-20 | 2008-09-25 | Pinaki Ray | Systems and methods for pattern recognition in diabetes management |
| US20080234943A1 (en) | 2007-03-20 | 2008-09-25 | Pinaki Ray | Computer program for diabetes management |
| US20080235053A1 (en) | 2007-03-20 | 2008-09-25 | Pinaki Ray | Communication medium for diabetes management |
| US20080255438A1 (en)* | 2001-12-27 | 2008-10-16 | Medtronic Minimed, Inc. | System for monitoring physiological characteristics |
| US20090105573A1 (en)* | 2007-10-19 | 2009-04-23 | Lifescan Scotland, Ltd. | Medical device for predicting a user's future glycemic state |
| US20090171589A1 (en) | 2006-01-05 | 2009-07-02 | University Of Virginia Patent Foundation | Method, System and Computer Program Product for Evaluation of Blood Glucose Variability In Diabetes From Self-Monitoring Data |
| US20090240127A1 (en)* | 2008-03-20 | 2009-09-24 | Lifescan, Inc. | Methods of determining pre or post meal time slots or intervals in diabetes management |
| US20100332445A1 (en)* | 2009-06-30 | 2010-12-30 | Lifescan, Inc. | Analyte testing method and system |
Family Cites Families (2)
| Publication number | Priority date | Publication date | Assignee | Title |
|---|---|---|---|---|
| US6188968B1 (en)* | 1998-05-18 | 2001-02-13 | Agilent Technologies Inc. | Removing effects of adapters present during vector network analyzer calibration |
| JP2000060803A (en)* | 1998-08-21 | 2000-02-29 | Terumo Corp | Blood sugar level information processing system |
- 2007
- 2007-03-20USUS11/688,639patent/US8758245B2/enactiveActive
- 2008
- 2008-03-12JPJP2008062994Apatent/JP5456981B2/enactiveActive
- 2008-03-19CACA2626349Apatent/CA2626349C/enactiveActive
- 2008-03-20EPEP08250986.0Apatent/EP2031534B1/enactiveActive
- 2008-03-20CNCNA2008101258655Apatent/CN101290320A/enactivePending
- 2008-03-20EPEP11181875.3Apatent/EP2400415A3/ennot_activeWithdrawn
- 2008-03-20EPEP11181876.1Apatent/EP2400416B1/enactiveActive
- 2014
- 2014-06-16USUS14/305,347patent/US20140365138A1/ennot_activeAbandoned
Patent Citations (107)
| Publication number | Priority date | Publication date | Assignee | Title |
|---|---|---|---|---|
| US4779199A (en) | 1984-07-13 | 1988-10-18 | Sumitomo Electric Industries, Ltd. | Patient monitor |
| US4695954A (en) | 1984-10-31 | 1987-09-22 | Rose Robert J | Modular medication dispensing system and apparatus utilizing portable memory device |
| US4731726A (en) | 1986-05-19 | 1988-03-15 | Healthware Corporation | Patient-operated glucose monitor and diabetes management system |
| US5019974A (en) | 1987-05-01 | 1991-05-28 | Diva Medical Systems Bv | Diabetes management system and apparatus |
| US5216597A (en) | 1987-05-01 | 1993-06-01 | Diva Medical Systems Bv | Diabetes therapy management system, apparatus and method |
| US4817044A (en) | 1987-06-01 | 1989-03-28 | Ogren David A | Collection and reporting system for medical appliances |
| US5341291A (en) | 1987-12-09 | 1994-08-23 | Arch Development Corporation | Portable medical interactive test selector having plug-in replaceable memory |
| US5319363A (en) | 1990-08-31 | 1994-06-07 | The General Hospital Corporation | Network for portable patient monitoring devices |
| JPH04348747A (en) | 1990-10-29 | 1992-12-03 | Miles Inc | Analytic and interpretive system for diabetes data |
| US5251126A (en) | 1990-10-29 | 1993-10-05 | Miles Inc. | Diabetes data analysis and interpretation method |
| US5376070A (en) | 1992-09-29 | 1994-12-27 | Minimed Inc. | Data transfer system for an infusion pump |
| US5307263A (en) | 1992-11-17 | 1994-04-26 | Raya Systems, Inc. | Modular microprocessor-based health monitoring system |
| US5960403A (en) | 1992-11-17 | 1999-09-28 | Health Hero Network | Health management process control system |
| US5590648A (en) | 1992-11-30 | 1997-01-07 | Tremont Medical | Personal health care system |
| US5500854A (en) | 1992-12-23 | 1996-03-19 | Instrumentarium Corporation | Data transmission system and equipment |
| US5558638A (en) | 1993-04-30 | 1996-09-24 | Healthdyne, Inc. | Patient monitor and support system |
| US6022315A (en) | 1993-12-29 | 2000-02-08 | First Opinion Corporation | Computerized medical diagnostic and treatment advice system including network access |
| US5925021A (en) | 1994-03-09 | 1999-07-20 | Visionary Medical Products, Inc. | Medication delivery device with a microprocessor and characteristic monitor |
| US5626144A (en) | 1994-05-23 | 1997-05-06 | Enact Health Management Systems | System for monitoring and reporting medical measurements |
| US5704366A (en) | 1994-05-23 | 1998-01-06 | Enact Health Management Systems | System for monitoring and reporting medical measurements |
| US5946659A (en) | 1995-02-28 | 1999-08-31 | Clinicomp International, Inc. | System and method for notification and access of patient care information being simultaneously entered |
| US5713856A (en) | 1995-03-13 | 1998-02-03 | Alaris Medical Systems, Inc. | Modular patient care system |
| US6915170B2 (en) | 1995-05-15 | 2005-07-05 | Alaris Medical Systems, Inc. | System and method for collecting data and managing patient care |
| US5772586A (en) | 1996-02-12 | 1998-06-30 | Nokia Mobile Phones, Ltd. | Method for monitoring the health of a patient |
| US5974389A (en) | 1996-03-01 | 1999-10-26 | Clark; Melanie Ann | Medical record management system and process with improved workflow features |
| US5878384A (en) | 1996-03-29 | 1999-03-02 | At&T Corp | System and method for monitoring information flow and performing data collection |
| US6206829B1 (en) | 1996-07-12 | 2001-03-27 | First Opinion Corporation | Computerized medical diagnostic and treatment advice system including network access |
| US6379301B1 (en) | 1997-01-10 | 2002-04-30 | Health Hero Network, Inc. | Diabetes management system and method for controlling blood glucose |
| US5822715A (en) | 1997-01-10 | 1998-10-13 | Health Hero Network | Diabetes management system and method for controlling blood glucose |
| US6225901B1 (en) | 1997-03-07 | 2001-05-01 | Cardionet, Inc. | Reprogrammable remote sensor monitoring system |
| US6234964B1 (en) | 1997-03-13 | 2001-05-22 | First Opinion Corporation | Disease management system and method |
| US6368273B1 (en) | 1997-03-28 | 2002-04-09 | Health Hero Network, Inc. | Networked system for interactive communication and remote monitoring of individuals |
| US5997476A (en) | 1997-03-28 | 1999-12-07 | Health Hero Network, Inc. | Networked system for interactive communication and remote monitoring of individuals |
| US6270455B1 (en) | 1997-03-28 | 2001-08-07 | Health Hero Network, Inc. | Networked system for interactive communications and remote monitoring of drug delivery |
| US6352505B1 (en) | 1997-08-18 | 2002-03-05 | Jonathan David Bortz | Device for diabetes management |
| US6134504A (en) | 1997-10-31 | 2000-10-17 | Mercury Diagnostics, Incorporated | Analyte concentration information collection and communication system |
| US6144922A (en) | 1997-10-31 | 2000-11-07 | Mercury Diagnostics, Incorporated | Analyte concentration information collection and communication system |
| US6049764A (en) | 1997-11-12 | 2000-04-11 | City Of Hope | Method and system for real-time control of analytical and diagnostic instruments |
| US6635167B1 (en)* | 1997-12-04 | 2003-10-21 | Roche Diagnostics Corporation | Apparatus and method for determining the concentration of a component of a sample |
| US6024699A (en) | 1998-03-13 | 2000-02-15 | Healthware Corporation | Systems, methods and computer program products for monitoring, diagnosing and treating medical conditions of remotely located patients |
| US6579231B1 (en) | 1998-03-27 | 2003-06-17 | Mci Communications Corporation | Personal medical monitoring unit and system |
| US6188988B1 (en) | 1998-04-03 | 2001-02-13 | Triangle Pharmaceuticals, Inc. | Systems, methods and computer program products for guiding the selection of therapeutic treatment regimens |
| US6081786A (en) | 1998-04-03 | 2000-06-27 | Triangle Pharmaceuticals, Inc. | Systems, methods and computer program products for guiding the selection of therapeutic treatment regimens |
| US20060189863A1 (en) | 1998-04-30 | 2006-08-24 | Abbott Diabetes Care, Inc. | Analyte monitoring device and methods of use |
| WO2000004512A2 (en) | 1998-07-20 | 2000-01-27 | Smithkline Beecham Corporation | Method and system for identifying at risk patients diagnosed with diabetes |
| US6872200B2 (en) | 1998-08-18 | 2005-03-29 | Medtronic Minimed, Inc. | External infusion device with remote programming, bolus estimator and/or vibration alarm capabilities |
| US6338713B1 (en) | 1998-08-18 | 2002-01-15 | Aspect Medical Systems, Inc. | System and method for facilitating clinical decision making |
| US6656114B1 (en) | 1998-11-30 | 2003-12-02 | Novo Noadisk A/S | Method and a system for assisting a user in a medical self treatment, said self treatment comprising a plurality of actions |
| US6540672B1 (en) | 1998-12-09 | 2003-04-01 | Novo Nordisk A/S | Medical system and a method of controlling the system for use by a patient for medical self treatment |
| US6422061B1 (en) | 1999-03-03 | 2002-07-23 | Cyrano Sciences, Inc. | Apparatus, systems and methods for detecting and transmitting sensory data over a computer network |
| US6575900B1 (en) | 1999-03-29 | 2003-06-10 | Beckman Coulter, Inc. | Meter with integrated database and simplified telemedicine capability |
| US6336900B1 (en) | 1999-04-12 | 2002-01-08 | Agilent Technologies, Inc. | Home hub for reporting patient health parameters |
| JP2003500744A (en) | 1999-05-20 | 2003-01-07 | メドトロニック ミニメド インコーポレイテッド | Comprehensive medical information management system |
| US6390986B1 (en) | 1999-05-27 | 2002-05-21 | Rutgers, The State University Of New Jersey | Classification of heart rate variability patterns in diabetics using cepstral analysis |
| US6558351B1 (en) | 1999-06-03 | 2003-05-06 | Medtronic Minimed, Inc. | Closed loop system for controlling insulin infusion |
| US6277071B1 (en) | 1999-06-25 | 2001-08-21 | Delphi Health Systems, Inc. | Chronic disease monitor |
| WO2001000086A1 (en) | 1999-06-25 | 2001-01-04 | Delphi Health Systems, Inc. | Chronic disease monitor |
| US6804558B2 (en) | 1999-07-07 | 2004-10-12 | Medtronic, Inc. | System and method of communicating between an implantable medical device and a remote computer system or health care provider |
| US6611846B1 (en) | 1999-10-30 | 2003-08-26 | Medtamic Holdings | Method and system for medical patient data analysis |
| US6406426B1 (en) | 1999-11-03 | 2002-06-18 | Criticare Systems | Medical monitoring and alert system for use with therapeutic devices |
| US6418346B1 (en) | 1999-12-14 | 2002-07-09 | Medtronic, Inc. | Apparatus and method for remote therapy and diagnosis in medical devices via interface systems |
| JP2001245900A (en) | 2000-03-02 | 2001-09-11 | Arkray Inc | Graph, its indication method and apparatus for its indication |
| US6692436B1 (en) | 2000-04-14 | 2004-02-17 | Computerized Screening, Inc. | Health care information system |
| JP2002132952A (en) | 2000-04-28 | 2002-05-10 | Bryan K Chan | Method and system for managing chronic disease and wellness online |
| US6544174B2 (en) | 2000-05-19 | 2003-04-08 | Welch Allyn Protocol, Inc. | Patient monitoring system |
| US6604050B2 (en) | 2000-06-16 | 2003-08-05 | Bayer Corporation | System, method and biosensor apparatus for data communications with a personal data assistant |
| WO2002005702A2 (en) | 2000-07-18 | 2002-01-24 | Healthetech, Inc. | Closed loop glycemic index system |
| US20050119540A1 (en)* | 2000-08-18 | 2005-06-02 | Cygnus, Inc. | Methods and devices for prediction of hypoglycemic events |
| WO2002015777A1 (en) | 2000-08-18 | 2002-02-28 | Cygnus, Inc. | Methods and devices for prediction of hypoglycemic events |
| US6635016B2 (en) | 2000-08-21 | 2003-10-21 | Joseph Finkelstein | Method and system for collecting and processing of biomedical information |
| US6450956B1 (en) | 2000-11-06 | 2002-09-17 | Siemens Corporate Research, Inc. | System and method for treatment and outcome measurement analysis |
| US6524240B1 (en) | 2000-11-22 | 2003-02-25 | Medwave, Inc. | Docking station for portable medical devices |
| US6645142B2 (en) | 2000-12-01 | 2003-11-11 | Optiscan Biomedical Corporation | Glucose monitoring instrument having network connectivity |
| US6799149B2 (en) | 2000-12-29 | 2004-09-28 | Medtronic, Inc. | Therapy management techniques for an implantable medical device |
| US6551243B2 (en) | 2001-01-24 | 2003-04-22 | Siemens Medical Solutions Health Services Corporation | System and user interface for use in providing medical information and health care delivery support |
| US20060106644A1 (en) | 2001-05-30 | 2006-05-18 | Koo Charles C | Patient referral and physician-to-physician marketing method and system |
| US6544212B2 (en) | 2001-07-31 | 2003-04-08 | Roche Diagnostics Corporation | Diabetes management system |
| US6781522B2 (en) | 2001-08-22 | 2004-08-24 | Kivalo, Inc. | Portable storage case for housing a medical monitoring device and an associated method for communicating therewith |
| US20080255438A1 (en)* | 2001-12-27 | 2008-10-16 | Medtronic Minimed, Inc. | System for monitoring physiological characteristics |
| US20030216628A1 (en) | 2002-01-28 | 2003-11-20 | Bortz Jonathan David | Methods and systems for assessing glycemic control using predetermined pattern label analysis of blood glucose readings |
| JP2004154547A (en) | 2002-06-05 | 2004-06-03 | Diabetes Diagnostics Inc | Specific component testing device, data storage method and data processing method |
| US7241265B2 (en) | 2002-06-05 | 2007-07-10 | Diabetes Diagnostics, Inc. | Analyte testing device |
| JP2004024699A (en) | 2002-06-27 | 2004-01-29 | Asahi Medical Co Ltd | Blood sugar management system, blood sugar management program, wearing system, and blood sugar management method |
| US20050214892A1 (en)* | 2002-08-13 | 2005-09-29 | Kovatchev Boris P | Method, system, and computer program product for the processing of self-monitoring blood glucose(smbg)data to enhance diabetic self-management |
| EP1418523A2 (en) | 2002-11-06 | 2004-05-12 | Sysmex Corporation | Diagnosis support system for diabetes |
| US20050159656A1 (en) | 2003-03-07 | 2005-07-21 | Hockersmith Linda J. | Method and apparatus for presentation of noninvasive glucose concentration information |
| WO2005065538A2 (en) | 2003-12-31 | 2005-07-21 | Medtronic Minimed, Inc. | System for monitoring physiological characteristics |
| WO2005081170A2 (en) | 2004-02-19 | 2005-09-01 | Edward Henry Mathews | Diabetes management and patient database system via mobile communication device |
| US20050187789A1 (en) | 2004-02-25 | 2005-08-25 | Cardiac Pacemakers, Inc. | Advanced patient and medication therapy management system and method |
| WO2005093629A2 (en) | 2004-03-26 | 2005-10-06 | Novo Nordisk A/S | Device for displaying data relevant for a diabetic patient |
| US20050267780A1 (en) | 2004-06-01 | 2005-12-01 | Pinaki Ray | Methods and systems of automating medical device data management |
| US20060010098A1 (en) | 2004-06-04 | 2006-01-12 | Goodnow Timothy T | Diabetes care host-client architecture and data management system |
| US20060173260A1 (en) | 2005-01-31 | 2006-08-03 | Gmms Ltd | System, device and method for diabetes treatment and monitoring |
| US20060264895A1 (en) | 2005-05-18 | 2006-11-23 | Flanders Samuel J | System for managing glucose levels in patients with diabetes or hyperglycemia |
| US20080071580A1 (en) | 2005-06-03 | 2008-03-20 | Marcus Alan O | System and method for medical evaluation and monitoring |
| US20070033074A1 (en) | 2005-06-03 | 2007-02-08 | Medtronic Minimed, Inc. | Therapy management system |
| WO2007005170A2 (en) | 2005-06-29 | 2007-01-11 | Medtronic Minimed, Inc. | Flexible glucose analysis using varying time report deltas and configurable glucose target ranges |
| US20090171589A1 (en) | 2006-01-05 | 2009-07-02 | University Of Virginia Patent Foundation | Method, System and Computer Program Product for Evaluation of Blood Glucose Variability In Diabetes From Self-Monitoring Data |
| GB2443434A (en) | 2006-11-02 | 2008-05-07 | Richard Butler | Method for predicting nocturnal hypoglycaemia |
| WO2008071218A1 (en) | 2006-12-14 | 2008-06-19 | Egomedical Swiss Ag | Monitoring device |
| US20080154513A1 (en)* | 2006-12-21 | 2008-06-26 | University Of Virginia Patent Foundation | Systems, Methods and Computer Program Codes for Recognition of Patterns of Hyperglycemia and Hypoglycemia, Increased Glucose Variability, and Ineffective Self-Monitoring in Diabetes |
| US20080234992A1 (en) | 2007-03-20 | 2008-09-25 | Pinaki Ray | Systems and methods for pattern recognition in diabetes management |
| US20080234943A1 (en) | 2007-03-20 | 2008-09-25 | Pinaki Ray | Computer program for diabetes management |
| US20080235053A1 (en) | 2007-03-20 | 2008-09-25 | Pinaki Ray | Communication medium for diabetes management |
| US20090105573A1 (en)* | 2007-10-19 | 2009-04-23 | Lifescan Scotland, Ltd. | Medical device for predicting a user's future glycemic state |
| US20090240127A1 (en)* | 2008-03-20 | 2009-09-24 | Lifescan, Inc. | Methods of determining pre or post meal time slots or intervals in diabetes management |
| US20100332445A1 (en)* | 2009-06-30 | 2010-12-30 | Lifescan, Inc. | Analyte testing method and system |
Non-Patent Citations (34)
| Title |
|---|
| Accu-Chek Camit Pro User's Manual, Roche Diagnostics, 2005, 220 pages. |
| Adil Alaoui, M.S., et al., "Diabetes Home Monitoring Project," ISIS Center, Department of Radiology, Georgetown University Medical Center, Nov. 12, 1998, pp. 2-6. |
| Boris P. Kovatchev, et al., "Evaluation of a New Measure of Blood Glucose Variability in Diabetes", Diabetes Care, Nov. 2006, pp. 2433-2438, vol. 29, No. 11. |
| Boris P. Kovatchev, et al., "Methods for Quantifying Self-Monitoring Blood Glucose Profiles Exemplified by an Examination of Blood Glucose Patterns in Patients with Type 1 and Type 2 Diabetes", Diabetes Technology & Therapeutics, 2002, pp. 295-303, vol. 4, No. 3. |
| Bruce W. Bode, et al., "Continuous Glucose Monitoring Used to Adjust Diabetes Therapy Improves Glycosylated Hemoglobin: A Pilot Study," Diabetes Research and Clinical Practice, vol. 46, 1999, pp. 183-190. |
| David Rodbard, "Improved Methods for Calculating a "Figure of Merit" for Blood Glucose Monitoring Data", Diabetes Technology Meeting, San Francisco, CA Nov. 2005, 1 page. |
| David Rodbard, M.D., "Optimizing Display, Analysis, Interpretation and Utility of Self-Monitoring of Blood Glucose (SMBG) Data for Management of Patients with Diabetes", Journal of Diabetes Science and Technology, vol. 1, Issue 1, Jan. 2007, 62-71. |
| Department of Health and Human Services, Public Health Service, Food and Drug Administration Center for Devices and Radiological Health; Roche Diagnostics Corp. 510(k) No. K043529; ACCU-CHEK Advisor Insulin Guidance Software Mar. 31, 2005; 1201 pages. |
| E.J. Gomez, et al., "Telemedicine for Diabetes Care: the DIABTel Approach Towards Diabetes Telecare," Med. Inform., vol. 21, No. 4, 1996, pp. 283-295. |
| E.J. Gomez-Aguilera, et al., "Diacrono: A New Portable Microcomputer System for Diabetes Management," IEEE/Ninth Annual Conference of the Engineering in Medicine and Biology Society-1231, 1987, 2 pages. |
| Edmond A. Ryan, et al., "Assessment of the Severity of Hypoglycemia and Glycemic Lability in Type 1 Diabetic Subjects Undergoing Islet Transplantation", Diabetes, Apr. 2004, pp. 955-962, vol. 53. |
| European Patent Application No. 11181875.3, extended European Search Report mailed Jun. 18, 2013, European Patent Office, 10 pages. |
| European Patent Application No. 11181876.1, extended European Search Report mailed Jun. 14, 2013, European Patent Office, 9 pages. |
| European Search Report, EP application No. 08250986.0, dated Jan. 28, 2009, 6 pages. |
| European Search Report, EP Application No. 08251030.6, Munich, Germany dated Feb. 12, 2009, 10 pages. |
| Evaluation of a New Measure of Blood Glucose Variability in Diabetes; BP Kovatchev, E Otto, D Cox, L Gonder-Frederick, W Clarke; Diabetes Care, vol. 29, No. 11, Nov. 2006.* |
| F. John Service, M.D., et al., "Mean Amplitude of Glycemic Excursions, a Measure of Diabetic Instability", Diabetes, vol. 19, No. 9, Sep. 1970, 644-655. |
| Irl B. Hirsch, M.D., "Glycemic Variability: It's Not Just About A1C Anymore!", Diabetes Technology & Therapeutics, 2005, pp. 780-783, vol. 7, No. 5. |
| J. Schlichtkrull, et al., "The M-Value, an Index of Blood-sugar Control in Diabetics", Acta Medica Scandinavica, vol. 177, fast. 1, 1965, 95-102. |
| J.M. Wojcicki, ""J"-Index. A New Proposition of the Assessment of Current Glucose Control in Diabetic Patients", Hormone and Metabolic Research, 1995, pp. 41-42, vol. 27. |
| Jacob Jaremko, et al., "Advances Toward the Implantable Artificial Pancreas for Treatment of Diabetes," Diabetes Care, vol. 21, No. 3, Mar. 1998, pp. 444-450. |
| Japanese Patent Application No. 2008-063000, Notice of Reasons for Rejection mailed Sep. 4, 2012, Japanese Patent Office, 3 pages. |
| Japanese Patent Application No. 2008-063023, Notice of Reasons for Rejection mailed Dec. 18, 2012, Japanese Patent Office, 2 pages. |
| Japanese Patent Application No. 2008-62994, Notice of Reasons for Rejection mailed Apr. 9, 2013, Japanese Patent Office, 3 pages. |
| K. Rebrin, et al., "Subcutaneous Glucose Monitoring by Means of Electrochemical Sensors: Fiction or Reality?," J. Biomed. Eng., vol. 14, Jan. 1992, pp. 33-41. |
| Louis Monnier, et al., "Activation of Oxidative Stress by Acute Glucose Fluctuations Compared with Sustained Chronic Hyperglycemia in Patients with Type 2 Diabetes", JAMA, Apr. 12, 2006, pp. 1681-1687, vol. 295, No. 14. |
| M. Berger, et al., "Computer Programs to Assist the Physician in the Analysis of Self-Monitored Blood Glucose Data," Proc. Annu. Symp. Comput. Appl. Med. Care, vol. 9, Nov. 1988, pp. 52-57. |
| M.E. Hernando, et al., "DIABNET: A Qualitative Model-Based Advisory System for Therapy Planning in Gestational Diabetes," Med. Inform., vol. 21, No. 4, 1996, pp. 359-374. |
| M.P. Berger, et al., "Combining Statistical, Rule-Based, and Physiologic Model-Based Methods to Assist in the Management of Diabetes Mellitus," Computers and Biomedical Research, vol. 23, 1990, pp. 346-357. |
| Michael Browlee, et al., "Glycemic Variability: A Hemoglobin A1c-Independent Risk Factor for Diabetic Complications", JAMA, Apr. 12, 2006, pp. 1707-1708, vol. 295, No. 14. |
| N. Pernick, et al., "A Microcomputer Consultation System for Self-Adjustment of Insulin Dosage," The American Association for Medical Systems and Informatics, vol. 2, 1983, pp. 62-67. |
| N. Pernick, et al., "Personal Computer Programs to Assist with Self-Monitoring of Blood Glucose and Self-Adjustment of Insulin Dosage," Diabetes Care, vol. 9, No. 1, Jan.-Feb. 1986, pp. 61-69. |
| Statistical Hypoglycemia Prediction; F Cameron, G Niemeyer, K Gundy-Burlet, B Buckingham; J Diabetes ZSi Technol. 008 Jul.; 2(4): 612-621.* |
| Wintergerst, K.A., et al., "Association of Hypoglycemia, Hyperglycemia, and Glucose Variability with Morbidity and Death in the Pediatric Intensive Care Unit," Pediatrics, vol. 118, No. 1, Jul. 2006, pp. 173-179. |
Cited By (34)
| Publication number | Priority date | Publication date | Assignee | Title |
|---|---|---|---|---|
| US11990240B2 (en)* | 2010-06-28 | 2024-05-21 | Heinrich Anhold | System and method for optimizing patient-specific intervention strategies using point of care diagnostics |
| US20210110929A1 (en)* | 2010-06-28 | 2021-04-15 | Heinrich Anhold | System and method for optimizing patient-specific intervention strategies using point of care diagnostics |
| US20240274289A1 (en)* | 2010-06-28 | 2024-08-15 | Heinrich Anhold | System and method for optimizing patient-specific intervention strategies using point of care diagnostics |
| US10201296B2 (en) | 2010-11-11 | 2019-02-12 | Ascensia Diabetes Care Holdings Ag | Apparatus, systems, and methods adapted to transmit analyte data having common electronic architecture |
| US11253175B2 (en) | 2010-11-11 | 2022-02-22 | Ascensia Diabetes Care Holdings Ag | Apparatus, systems, and methods having common electronic architecture for communicating analyte data |
| US10391242B2 (en) | 2012-06-07 | 2019-08-27 | Medtronic Minimed, Inc. | Diabetes therapy management system for recommending bolus calculator adjustments |
| US20140081103A1 (en)* | 2012-09-17 | 2014-03-20 | Lifescan, Inc. | Method and system to derive glycemic patterns from clustering of glucose data |
| US9504412B2 (en)* | 2012-09-17 | 2016-11-29 | Lifescan, Inc. | Method and system to derive glycemic patterns from clustering of glucose data |
| US12178617B2 (en) | 2012-12-31 | 2024-12-31 | Abbott Diabetes Care Inc. | Analysis of glucose median, variability, and hypoglycemia risk for therapy guidance |
| US10019554B2 (en) | 2012-12-31 | 2018-07-10 | Abbott Diabetes Care Inc. | Glycemic risk determination based on variability of glucose |
| US12102454B2 (en) | 2012-12-31 | 2024-10-01 | Abbott Diabetes Care Inc. | Analysis of glucose median, variability, and hypoglycemia risk for therapy guidance |
| US10383580B2 (en) | 2012-12-31 | 2019-08-20 | Abbott Diabetes Care Inc. | Analysis of glucose median, variability, and hypoglycemia risk for therapy guidance |
| US9351670B2 (en) | 2012-12-31 | 2016-05-31 | Abbott Diabetes Care Inc. | Glycemic risk determination based on variability of glucose levels |
| US11331051B2 (en) | 2012-12-31 | 2022-05-17 | Abbott Diabetes Care Inc. | Analysis of glucose median, variability, and hypoglycemia risk for therapy guidance |
| US10010291B2 (en) | 2013-03-15 | 2018-07-03 | Abbott Diabetes Care Inc. | System and method to manage diabetes based on glucose median, glucose variability, and hypoglycemic risk |
| US11963801B2 (en) | 2013-03-15 | 2024-04-23 | Abbott Diabetes Care Inc. | Systems and methods for use of insulin information for meal indication |
| USD1030780S1 (en) | 2013-03-15 | 2024-06-11 | Abbott Diabetes Care Inc. | Display screen or portion thereof with graphical user interface for continuous glucose monitoring |
| US11304664B2 (en) | 2013-03-15 | 2022-04-19 | Abbott Diabetes Care Inc. | System and method to manage diabetes based on glucose median, glucose variability, and hypoglycemic risk |
| US12402841B2 (en) | 2013-03-15 | 2025-09-02 | Abbott Diabetes Care Inc. | Systems and methods for use of insulin information for meal indication |
| US10897503B2 (en) | 2014-01-10 | 2021-01-19 | Ascensia Diabetes Care Holdings Ag | Setup synchronization apparatus and methods for end user medical devices |
| US10432717B2 (en) | 2014-01-10 | 2019-10-01 | Ascensia Diabetes Care Holdings Ag | Setup synchronization apparatus and methods for end user medical devices |
| US11237152B2 (en) | 2014-04-11 | 2022-02-01 | Ascensia Diabetes Care Holdings Ag | Wireless transmitter adapters for battery-operated biosensor meters and methods of providing same |
| US10582361B2 (en) | 2014-07-07 | 2020-03-03 | Ascensia Diabetes Care Holdings Ag | Device pairing taking into account at least one condition |
| US11064334B2 (en) | 2014-07-07 | 2021-07-13 | Ascensia Diabetes Care Holdings Ag | Device pairing with a dual use piezoelectric acoustic component and vibration sensor |
| US10306444B2 (en) | 2014-07-07 | 2019-05-28 | Ascensia Diabetes Care Holdings Ag | Device pairing with a dual use piezoelectric acoustic component and vibration sensor |
| US11399269B2 (en) | 2014-07-07 | 2022-07-26 | Ascensia Diabetes Care Holdings Ag | Device pairing taking into account at least one condition |
| US10142823B2 (en) | 2014-07-07 | 2018-11-27 | Ascensia Diabetes Care Holdings Ag | Device pairing taking into account at least one condition |
| US11361863B2 (en) | 2015-04-29 | 2022-06-14 | Ascensia Diabetes Care Holdings Ag | Location-based wireless diabetes management systems, methods and apparatus |
| WO2016174206A1 (en) | 2015-04-29 | 2016-11-03 | Ascensia Diabetes Care Holdings Ag | Location-based wireless diabetes management systems, methods and apparatus |
| US11903653B2 (en) | 2016-03-24 | 2024-02-20 | Sofradim Production | System and method of generating a model and simulating an effect on a surgical repair site |
| US11065056B2 (en) | 2016-03-24 | 2021-07-20 | Sofradim Production | System and method of generating a model and simulating an effect on a surgical repair site |
| US10956821B2 (en) | 2016-11-29 | 2021-03-23 | International Business Machines Corporation | Accurate temporal event predictive modeling |
| WO2018178048A1 (en) | 2017-03-28 | 2018-10-04 | Ascensia Diabetes Care Holdings Ag | Diabetes management systems, methods and apparatus for user reminders, pattern recognition, and interfaces |
| USD853583S1 (en) | 2017-03-29 | 2019-07-09 | Becton, Dickinson And Company | Hand-held device housing |
Also Published As
| Publication number | Publication date |
|---|---|
| US20140365138A1 (en) | 2014-12-11 |
| CA2626349A1 (en) | 2008-09-20 |
| JP5456981B2 (en) | 2014-04-02 |
| EP2400416B1 (en) | 2020-10-28 |
| EP2400416A3 (en) | 2013-07-17 |
| CN101290320A (en) | 2008-10-22 |
| EP2031534A1 (en) | 2009-03-04 |
| US20080234992A1 (en) | 2008-09-25 |
| EP2031534B1 (en) | 2020-04-22 |
| EP2400415A3 (en) | 2013-07-17 |
| CA2626349C (en) | 2016-08-09 |
| JP2008229330A (en) | 2008-10-02 |
| EP2400415A2 (en) | 2011-12-28 |
| EP2400416A2 (en) | 2011-12-28 |
Similar Documents
| Publication | Publication Date | Title |
|---|---|---|
| US8758245B2 (en) | Systems and methods for pattern recognition in diabetes management | |
| US20080234943A1 (en) | Computer program for diabetes management | |
| US20080235053A1 (en) | Communication medium for diabetes management | |
| US20090240127A1 (en) | Methods of determining pre or post meal time slots or intervals in diabetes management | |
| US20210090737A1 (en) | Method of hypoglycemia risk determination | |
| ES2755879T3 (en) | Procedure and system for providing both an estimated actual mean blood glucose value and an estimated glycohemoglobin (HbA1C) value from structured point blood glucose measurements | |
| US9213802B2 (en) | Updatability of structured blood glucose tests performed on handheld diabetes management devices | |
| JP2013503712A (en) | Observation of the possibility of impending hypoglycemia in diabetes from self-monitoring blood glucose (SMBG) data | |
| AU2017420200A1 (en) | Method and system for monitoring a diabetes treatment plan | |
| US11864888B2 (en) | User-defined structured testing for use in diabetes care | |
| HK1125713A (en) | Computer program for diabetes management | |
| HK1142145A (en) | Communication medium for diabetes management | |
| HK1165042A (en) | Systems and methods for pattern recognition in diabetes management | |
| HK1165043A (en) | Systems and methods for pattern recognition in diabetes management | |
| HK1128784A (en) | Systems and methods for pattern recognition in diabetes management | |
| HK1128784B (en) | Systems and methods for pattern recognition in diabetes management | |
| HK1165043B (en) | Systems and methods for pattern recognition in diabetes management |
Legal Events
| Date | Code | Title | Description |
|---|---|---|---|
| AS | Assignment | Owner name:LIFESCAN, INC., CALIFORNIA Free format text:ASSIGNMENT OF ASSIGNORS INTEREST;ASSIGNORS:RAY, PINAKI;MATIAN, GREG;SRINIVASAN, APARNA;AND OTHERS;REEL/FRAME:019276/0746;SIGNING DATES FROM 20070322 TO 20070507 Owner name:LIFESCAN, INC., CALIFORNIA Free format text:ASSIGNMENT OF ASSIGNORS INTEREST;ASSIGNORS:RAY, PINAKI;MATIAN, GREG;SRINIVASAN, APARNA;AND OTHERS;SIGNING DATES FROM 20070322 TO 20070507;REEL/FRAME:019276/0746 | |
| STCF | Information on status: patent grant | Free format text:PATENTED CASE | |
| MAFP | Maintenance fee payment | Free format text:PAYMENT OF MAINTENANCE FEE, 4TH YEAR, LARGE ENTITY (ORIGINAL EVENT CODE: M1551) Year of fee payment:4 | |
| AS | Assignment | Owner name:BANK OF AMERICA, N.A., AS COLLATERAL AGENT, NORTH CAROLINA Free format text:SECURITY AGREEMENT;ASSIGNOR:LIFESCAN IP HOLDINGS, LLC;REEL/FRAME:047179/0150 Effective date:20181001 Owner name:BANK OF AMERICA, N.A., AS COLLATERAL AGENT, NORTH Free format text:SECURITY AGREEMENT;ASSIGNOR:LIFESCAN IP HOLDINGS, LLC;REEL/FRAME:047179/0150 Effective date:20181001 | |
| AS | Assignment | Owner name:BANK OF AMERICA, N.A., AS COLLATERAL AGENT, NORTH CAROLINA Free format text:SECURITY AGREEMENT;ASSIGNOR:LIFESCAN IP HOLDINGS, LLC;REEL/FRAME:047186/0836 Effective date:20181001 Owner name:BANK OF AMERICA, N.A., AS COLLATERAL AGENT, NORTH Free format text:SECURITY AGREEMENT;ASSIGNOR:LIFESCAN IP HOLDINGS, LLC;REEL/FRAME:047186/0836 Effective date:20181001 | |
| AS | Assignment | Owner name:LIFESCAN IP HOLDINGS, LLC, CALIFORNIA Free format text:ASSIGNMENT OF ASSIGNORS INTEREST;ASSIGNOR:CILAG GMBH INTERNATIONAL;REEL/FRAME:050837/0001 Effective date:20181001 Owner name:CILAG GMBH INTERNATIONAL, SWITZERLAND Free format text:ASSIGNMENT OF ASSIGNORS INTEREST;ASSIGNOR:LIFESCAN INC.;REEL/FRAME:050836/0737 Effective date:20181001 | |
| MAFP | Maintenance fee payment | Free format text:PAYMENT OF MAINTENANCE FEE, 8TH YEAR, LARGE ENTITY (ORIGINAL EVENT CODE: M1552); ENTITY STATUS OF PATENT OWNER: LARGE ENTITY Year of fee payment:8 | |
| AS | Assignment | Owner name:BANK OF AMERICA, N.A., NORTH CAROLINA Free format text:FIRST LIEN PATENT SECURITY AGREEMENT;ASSIGNOR:LIFESCAN IP HOLDINGS, LLC;REEL/FRAME:063712/0430 Effective date:20230519 | |
| AS | Assignment | Owner name:BANK OF AMERICA, N.A., NORTH CAROLINA Free format text:SECOND LIEN PATENT SECURITY AGREEMENT;ASSIGNOR:LIFESCAN IP HOLDINGS, LLC;REEL/FRAME:063740/0080 Effective date:20230519 | |
| AS | Assignment | Owner name:JOHNSON & JOHNSON CONSUMER INC., NEW JERSEY Free format text:RELEASE OF SECOND LIEN PATENT SECURITY AGREEMENT RECORDED OCT. 3, 2018, REEL/FRAME 047186/0836;ASSIGNOR:BANK OF AMERICA, N.A.;REEL/FRAME:064206/0176 Effective date:20230627 Owner name:JANSSEN BIOTECH, INC., PENNSYLVANIA Free format text:RELEASE OF SECOND LIEN PATENT SECURITY AGREEMENT RECORDED OCT. 3, 2018, REEL/FRAME 047186/0836;ASSIGNOR:BANK OF AMERICA, N.A.;REEL/FRAME:064206/0176 Effective date:20230627 Owner name:LIFESCAN IP HOLDINGS, LLC, CALIFORNIA Free format text:RELEASE OF SECOND LIEN PATENT SECURITY AGREEMENT RECORDED OCT. 3, 2018, REEL/FRAME 047186/0836;ASSIGNOR:BANK OF AMERICA, N.A.;REEL/FRAME:064206/0176 Effective date:20230627 | |
| AS | Assignment | Owner name:CILAG GMBH INTERNATIONAL, SWITZERLAND Free format text:CORRECTIVE ASSIGNMENT TO CORRECT THE PROPERTY LIST BY ADDING PATENTS 6990849;7169116; 7351770;7462265;7468125; 7572356;8093903; 8486245;8066866;AND DELETE 10881560. PREVIOUSLY RECORDED ON REEL 050836 FRAME 0737. ASSIGNOR(S) HEREBY CONFIRMS THE ASSIGNMENT;ASSIGNOR:LIFESCAN INC.;REEL/FRAME:064782/0443 Effective date:20181001 | |
| AS | Assignment | Owner name:ANKURA TRUST COMPANY, LLC, AS SUCCESSOR AGENT, CONNECTICUT Free format text:TRANSFER OF SECURITY AGREEMENT RECORDED AT REEL 047179, FRAME 0150;ASSIGNOR:BANK OF AMERICA, N.A., AS RESIGNING AGENT;REEL/FRAME:069314/0022 Effective date:20241108 | |
| AS | Assignment | Owner name:WILMINGTON SAVINGS FUND SOCIETY, FSB, AS SUCCESSOR AGENT, DELAWARE Free format text:TRANSFER OF SECURITY AGREEMENT RECORDED AT REEL 063740, FRAME 0080;ASSIGNOR:BANK OF AMERICA, N.A., AS RESIGNING AGENT;REEL/FRAME:069340/0243 Effective date:20241108 |