US8543454B2 - Generating audience response metrics and ratings from social interest in time-based media - Google Patents
Generating audience response metrics and ratings from social interest in time-based mediaDownload PDFInfo
- Publication number
- US8543454B2 US8543454B2US13/030,940US201113030940AUS8543454B2US 8543454 B2US8543454 B2US 8543454B2US 201113030940 AUS201113030940 AUS 201113030940AUS 8543454 B2US8543454 B2US 8543454B2
- Authority
- US
- United States
- Prior art keywords
- time
- event
- based media
- media event
- content items
- Prior art date
- Legal status (The legal status is an assumption and is not a legal conclusion. Google has not performed a legal analysis and makes no representation as to the accuracy of the status listed.)
- Active, expires
Links
Images


Classifications
- G—PHYSICS
- G06—COMPUTING OR CALCULATING; COUNTING
- G06Q—INFORMATION AND COMMUNICATION TECHNOLOGY [ICT] SPECIALLY ADAPTED FOR ADMINISTRATIVE, COMMERCIAL, FINANCIAL, MANAGERIAL OR SUPERVISORY PURPOSES; SYSTEMS OR METHODS SPECIALLY ADAPTED FOR ADMINISTRATIVE, COMMERCIAL, FINANCIAL, MANAGERIAL OR SUPERVISORY PURPOSES, NOT OTHERWISE PROVIDED FOR
- G06Q30/00—Commerce
- G06Q30/02—Marketing; Price estimation or determination; Fundraising
- G06Q30/0201—Market modelling; Market analysis; Collecting market data
- G—PHYSICS
- G06—COMPUTING OR CALCULATING; COUNTING
- G06Q—INFORMATION AND COMMUNICATION TECHNOLOGY [ICT] SPECIALLY ADAPTED FOR ADMINISTRATIVE, COMMERCIAL, FINANCIAL, MANAGERIAL OR SUPERVISORY PURPOSES; SYSTEMS OR METHODS SPECIALLY ADAPTED FOR ADMINISTRATIVE, COMMERCIAL, FINANCIAL, MANAGERIAL OR SUPERVISORY PURPOSES, NOT OTHERWISE PROVIDED FOR
- G06Q30/00—Commerce
- G06Q30/02—Marketing; Price estimation or determination; Fundraising
- G06Q30/0241—Advertisements
- G06Q30/0242—Determining effectiveness of advertisements
- G06Q30/0245—Surveys
- G—PHYSICS
- G06—COMPUTING OR CALCULATING; COUNTING
- G06Q—INFORMATION AND COMMUNICATION TECHNOLOGY [ICT] SPECIALLY ADAPTED FOR ADMINISTRATIVE, COMMERCIAL, FINANCIAL, MANAGERIAL OR SUPERVISORY PURPOSES; SYSTEMS OR METHODS SPECIALLY ADAPTED FOR ADMINISTRATIVE, COMMERCIAL, FINANCIAL, MANAGERIAL OR SUPERVISORY PURPOSES, NOT OTHERWISE PROVIDED FOR
- G06Q50/00—Information and communication technology [ICT] specially adapted for implementation of business processes of specific business sectors, e.g. utilities or tourism
- G06Q50/01—Social networking
- H—ELECTRICITY
- H04—ELECTRIC COMMUNICATION TECHNIQUE
- H04N—PICTORIAL COMMUNICATION, e.g. TELEVISION
- H04N21/00—Selective content distribution, e.g. interactive television or video on demand [VOD]
- H04N21/20—Servers specifically adapted for the distribution of content, e.g. VOD servers; Operations thereof
- H04N21/23—Processing of content or additional data; Elementary server operations; Server middleware
- H04N21/234—Processing of video elementary streams, e.g. splicing of video streams or manipulating encoded video stream scene graphs
- H04N21/23418—Processing of video elementary streams, e.g. splicing of video streams or manipulating encoded video stream scene graphs involving operations for analysing video streams, e.g. detecting features or characteristics
- H—ELECTRICITY
- H04—ELECTRIC COMMUNICATION TECHNIQUE
- H04N—PICTORIAL COMMUNICATION, e.g. TELEVISION
- H04N21/00—Selective content distribution, e.g. interactive television or video on demand [VOD]
- H04N21/20—Servers specifically adapted for the distribution of content, e.g. VOD servers; Operations thereof
- H04N21/25—Management operations performed by the server for facilitating the content distribution or administrating data related to end-users or client devices, e.g. end-user or client device authentication, learning user preferences for recommending movies
- H04N21/251—Learning process for intelligent management, e.g. learning user preferences for recommending movies
- H04N21/252—Processing of multiple end-users' preferences to derive collaborative data
- H—ELECTRICITY
- H04—ELECTRIC COMMUNICATION TECHNIQUE
- H04N—PICTORIAL COMMUNICATION, e.g. TELEVISION
- H04N21/00—Selective content distribution, e.g. interactive television or video on demand [VOD]
- H04N21/80—Generation or processing of content or additional data by content creator independently of the distribution process; Content per se
- H04N21/81—Monomedia components thereof
- H04N21/8126—Monomedia components thereof involving additional data, e.g. news, sports, stocks, weather forecasts
- G—PHYSICS
- G06—COMPUTING OR CALCULATING; COUNTING
- G06Q—INFORMATION AND COMMUNICATION TECHNOLOGY [ICT] SPECIALLY ADAPTED FOR ADMINISTRATIVE, COMMERCIAL, FINANCIAL, MANAGERIAL OR SUPERVISORY PURPOSES; SYSTEMS OR METHODS SPECIALLY ADAPTED FOR ADMINISTRATIVE, COMMERCIAL, FINANCIAL, MANAGERIAL OR SUPERVISORY PURPOSES, NOT OTHERWISE PROVIDED FOR
- G06Q30/00—Commerce
- G06Q30/02—Marketing; Price estimation or determination; Fundraising
- G06Q30/0241—Advertisements
- G06Q30/0242—Determining effectiveness of advertisements
Definitions
- the present inventionrelates generally to using social media to estimate interest in media events, and in particular to using social media content items mapped to time-based media events for generating metrics and ratings for time-based media.
- Online social media servicessuch as social networking sites, news aggregators, blogs, and the like provide a rich environment for users to comment on events of interest and communicate with other users.
- Content items contributed by users of these social media servicesoften include references to events that appear in time-based media such as television shows, advertisements, news reports, sporting events, movies, concert performances, and the like.
- time-based mediasuch as television shows, advertisements, news reports, sporting events, movies, concert performances, and the like.
- the content itemssometimes refer to time-based media, traditionally there has been no way to aggregate the social media content items and associate them with those events, or with the time-based media in which those events occur.
- CBMsConsumption-based metrics
- CBMsprovide no information about the virality of the time-based media, and little information about the depth and breadth of the viewing audience's interest.
- Social media content items and references to events that occur thereinare aligned with the time-based media events they describe. These mappings are used as the basis for multiple applications, including calculating metrics based upon the mappings, and ratings of the time-based media there from. Other applications include ranking of search results for time-based media, automatic recommendations for time-based media, prediction of audience interest for media purchasing/planning, and estimating social interest in the time-based media.
- Social interest in time-based media (e.g., video and audio streams and recordings) segmentsis estimated through a process of data ingestion and integration.
- social media content itemsare identified as potentially relevant to the event.
- the probability that the content item is relevant to the time-based media eventis determined for each social media content item, and a confidence score reflecting the probability is assigned to the content item.
- Content items with higher probabilitiesare mapped to the event and stored.
- Audience response metricsare calculated from the mappings, and provide a measure of the extent, depth, or degree of audience engagement with, or response to, the social media content items.
- ARMsprovide information about the virality of the response by the viewing audience of the time based media.
- the calculated metricsare stored and are used to generate ratings for the time-based media. The ratings may be published in whole or in part, e.g., as part of a ratings system.
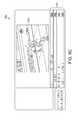
- FIG. 1illustrates the computing environment of one embodiment of a system for associating social media content items with time-based media events and determining social interest in the events based on the resulting associations.
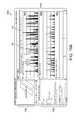
- FIG. 2is a block diagram of one embodiment of a social interest information provider.
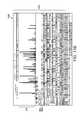
- FIG. 3is a conceptual diagram illustrating the video/metadata alignment/annotation and social media/event alignment processes at a high level according to one embodiment.
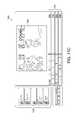
- FIG. 3Ais a flow diagram illustrating one embodiment of a method for associating social media content items with time-based media events, and a related method of determining social interest in the events based on the resulting associations.
- FIG. 4is a flow diagram illustrating one embodiment of a video event segmentation process.
- FIG. 5is a flow diagram illustrating one embodiment of a metadata alignment/annotation process.
- FIG. 6is a flow diagram illustrating one embodiment of a social media/event alignment process.
- FIG. 7is a flow diagram illustrating one embodiment of a social interest estimation process.
- FIGS. 8A and 8Bshow two embodiments of social interest heat maps showing levels of social interest for a plurality of events corresponding to a series of chronological time segments in a time-based medium.
- FIGS. 9A-9Cshow three embodiments of user interfaces of a social interest estimation system.
- FIGS. 10A and 10Bshow two embodiments of user interfaces of a social interest estimation system showing a sentiment view.
- FIGS. 11A-11Cshow three embodiments of user interfaces of a social interest estimation system showing a filtered view.
- FIG. 12Ashows one embodiment of user interface of a social interest estimation system showing a focused unexpanded view.
- FIG. 12Bshows one embodiment of user interface of a social interest estimation system showing a focused expanded view.
- FIGS. 13A-Dshow yet another embodiment of a user interface displaying social interest heat maps showing levels of social interest for a plurality of events corresponding to a series of chronological time segments in a time-based medium.
- FIG. 14is a flow diagram illustrating one embodiment of a method for rating time-based broadcast media based on audience response via social media.
- FIG. 1illustrates the computing environment 100 for one embodiment of a system 130 for associating social media content items and references to events therein with time-based media events and determining social interest in the events based on the resulting associations.
- the environment 100includes social media sources 110 , time-based media sources 120 , the social interest information provider 130 , a network 140 , and client devices 150 .
- the social media sources 110include social networks, blogs, news media, forums, user groups, etc. These sources generally provide a plurality of users with the ability to communicate and interact with other users of the source. Users can typically contribute various content items (e.g., posts, videos, photos, links, status updates, blog entries, tweets, and the like), which may refer to media events, and can engage in discussions, games, online events, and other participatory services.
- content itemse.g., posts, videos, photos, links, status updates, blog entries, tweets, and the like
- the time-based media sources 120include broadcasters, direct content providers, advertisers, and any other third-party providers of time-based media content. These sources 120 typically publish content such as television programs, videos, movies, serials, audio recordings, and the like.
- the social interest information provider 130provides a system for associating social media content items and references to events therein with time-based media events and determining social interest in the events based on the resulting associations, and is further described in conjunction with FIG. 2 .
- the network 140may comprise any combination of local area and/or wide area networks, the Internet, or one or more intranets, using both wired and wireless communication systems.
- the client devices 150comprise computing devices that can receive input from a user and can transmit and receive data via the network 140 .
- client devices 150may be a desktop computer, a laptop computer, a smart phone, a personal digital assistant (PDAs), or any other device including computing functionality and data communication capabilities.
- PDAspersonal digital assistant
- a client device 150is configured to communicate with the social media sources 110 and the social interest information provider system 130 via the network 140 .
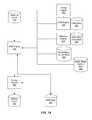
- FIG. 2is a block diagram of one embodiment of a social interest information provider 130 .
- the embodiment of the social interest information provider 130 shown in FIG. 2is a computer system that includes a web server 200 and associated API 202 , a domain ontology engine 205 , an author identifier 210 , a closed captioning extractor 215 , an event segmentation engine 220 , a feature extraction engine 225 , a metadata alignment engine 230 , an annotation engine 235 , a comparative feature extraction engine 240 , a media event/alignment engine 245 , a social interest estimator 250 , a user interface engine 255 , domain ontologies 257 , a social media content store 260 , a social media author store 263 , a usage stats store 265 , a closed captioning store 267 , a multimedia store 270 , an event metadata store 273 , a mapping store 275 , a video event store 280 , a social interest store 285 ,
- One embodiment of the social interest information provider 130also includes a timing engine 253 , an ARM engine 254 , an optional CRM engine 256 , a time-based media cost engine 258 , and a ratings engine 259 , as well as an ARM store 291 , a CRM store 293 , an advertising cost store 295 , and a ratings store 297 .
- This systemmay be implemented using a single computer, or a network of computers, including cloud-based computer implementations.
- the computersare preferably server class computers including one or more high-performance CPUs, 1G or more of main memory, as well as 500 GB to 2Tb of computer readable, persistent storage, and running an operating system such as LINUX or variants thereof.
- the operations of the system 130 as describedcan be controlled through either hardware or through computer programs installed in computer storage and executed by the processors of such servers to perform the functions described herein.
- the system 130includes other hardware elements necessary for the operations described here, including network interfaces and protocols, security systems, input devices for data entry, and output devices for display, printing, or other presentations of data; these and other conventional components are not shown so as to not obscure the relevant details.
- system 130comprises a number of “engines,” which refers to computational logic for providing the specified functionality.
- An enginecan be implemented in hardware, firmware, and/or software.
- An enginemay sometimes be equivalently referred to as a “module” or a “server.”
- moduleor a “server.”
- the enginecan be implemented as a standalone program, but can also be implemented through other means, for example as part of a larger program, as a plurality of separate programs, or as one or more statically or dynamically linked libraries.
- the enginesare stored on the computer readable persistent storage devices of the system 130 , loaded into memory, and executed by the one or more processors of the system's computers.
- the operations of the system 130 and its various componentswill be further described below with respect to FIG. 2 and the remaining figures.
- the various data processing operations described hereinare sufficiently complex and time consuming as to require the operation of a computer system such as the system 130 .
- the web server 200links the social interest information provider 130 to the client devices 150 , the time-based media sources 120 , and the social media sources 110 via network 140 , and is one means for doing so.
- the web server 200serves web pages, as well as other web related content, such as Java, Flash, XML, and so forth.
- the web server 200may include a mail server or other messaging functionality for receiving and routing messages between the social interest information provider 130 and client devices 150 .
- the API 202allows one or more external entities to access information from the social interest information provider 130 .
- the web server 200may also allow external entities to send information to the social interest information provider 130 calling the API 202 .
- an external entitysends an API request to the social interest information provider 130 via the network 140 and the web server 200 receives the API request.
- the web server 200processes the request by calling an API 202 associated with the API request to generate an appropriate response, which the web server 200 communicates to the external entity via the network 140 .
- the API 202can be used for the social interest information provider 130 to receive extracted features and other inputs to the social media/event alignment 330 and social interest estimation 340 processes from third parties (such as entities providing the time-based media), which then would be used by the social interest information provider 130 in those processes.
- the social interest information provider 130can expose an API (e.g., 202 ) through which an advertiser or other interested third party could input key words (e.g., product names, show name, particular sporting event, particular instance/episode of a show, etc.) and in turn receive ratings information as described herein associated with the keyword.
- key wordse.g., product names, show name, particular sporting event, particular instance/episode of a show, etc.
- the APIcould allow the third party to specify the type(s) of rating information desired as well, which data may be associated with various price points set by the social interest information provider 130 .
- the APIcould allow for other settings for the third party to receive the ratings data, e.g., to receive the data “real-time” or very close in time to it being generated, or to specify ahead of time when to provide the ratings data, how often to provide an update to the ratings data, etc.
- Domain ontology engine 205provides domain ontologies indicating vocabularies specific to different media domains for storage in the domain ontologies 257 , and is one means for doing so.
- the domain ontologies 257encode information relevant to specific domains, and are beneficial, since nicknames, slang, acronyms, and other shortened terms commonly are used in certain domains.
- Domain ontologies 257may be organized hierarchically as graphs, where each node in the graph represents a concept (e.g. “football play,” “scoring play”) and each edge represents a relation between concepts (e.g. “type of”).
- Concept instancesmay also be encoded in the domain ontology, as well as, vocabularies that provide alternate terminology for concept nodes (e.g. “TD” for concept “touchdown”).
- the domain ontologies 257may be engineered based on the knowledge of human experts or machine-generated.
- the domain ontologiesare used for initial filtering of social media posts and in the social media/event alignment process.
- An exemplary list of social interest domains for which time-based media is used according to the present inventionincludes broadcast video such as television programs, such as sports, news, episodic television, reality/live event shows, movies, and advertising in conjunction with any of these domains.
- the domain ontology engine 205is configured to filter the time segments according to a search term, wherein the graphical display displays only a subset of the series of chronological time segments corresponding to the search term.
- the author identifier 210identifies the author, or provider, of each social media content item, e.g., as provided to the social interest information provider 130 by the social media sources 110 with the content items, and is one means for doing so. Additional information about the authors may be extracted from the content items themselves, e.g., as stored in the social media content store 260 , or extracted from other external sources.
- the author informationis stored in the social media author store 263 .
- the author informationincludes the network structure of the authors network(s), e.g., including how many other users of the network(s) are connected to the author within the network(s). This information is used, e.g., for calculations that capture the resonance of audience response to an event amongst other users within the social networks of the authors of content items.
- the closed captioning extractor 215extracts closed captioning data from the time-based media, and is one means for doing so.
- Closed captioning datatypically can be extracted from broadcast video or other sources encoded with closed captions using open source software such as CCExtractor available via SourceForge.net.
- open source softwaresuch as CCExtractor available via SourceForge.net.
- imperfect methodssuch as automatic speech recognition can be used to capture and convert the audio data into a text stream comparable to closed captioning text. This can be done, for example, using open source software such as Sphinx 3 available via SourceForge.net.
- the closed captioning informationis stored in the closed captioning store 267 .
- Time-based mediaincludes any data that changes meaningfully with respect to time. Examples include, and are not limited to, videos, (e.g., television programs or portions thereof, movies or portions thereof) audio recordings, MIDI sequences, animations, and combinations thereof. Time-based media can be obtained from a variety of sources, such as local or network stores, as well as directly from capture devices such as cameras, microphones, and live broadcasts. It is anticipated that other types of time-based media within the scope of the invention will be developed in the future (e.g., 3D media, holographic presentations, immersive media, and so forth).
- the event segmentation engine 220segments time-based media into semantically meaningful segments corresponding to discrete portions or “events,” and is one means for doing so.
- Different types of mediamay have different types of events which are recognized as part of a video event segmentation process.
- a television program or moviemay have scenes and shots;
- a sporting eventmay have highly granular events (e.g., plays, passes, catches, hits, shots, baskets, goals, and the like) as well has less granular events (e.g., sides, downs, innings, and the like).
- a news programmay have events such as stories, interviews, shots, commentary and the like.
- the video event segmentation processincludes three main components according to one embodiment: shot boundary detection, event detection, and boundary determination. These components for event segmentation may vary by domain.
- the output of video event segmentationis a set of segmented video events that is stored in the video event store 280 .
- the feature extraction engine 225converts segmented time-based media events retrieved from the video event store 280 into feature vector representations for aligning the events with metadata, and is one means for doing so.
- the featuresmay include image and audio properties and may vary by domain.
- Feature typesmay include, but are not limited to, scale-variant feature transform (SIFT), speeded up robust features (SURF), local energy based shape histogram (LESH), color histogram, and gradient location orientation histogram (GLOH).
- the metadata alignment engine 230aligns video event segments with semantically meaningful information regarding the event or topic that the event is about, and is one means for doing so.
- the metadata alignment engine 230uses metadata instances from the event metadata store 273 .
- a metadata instanceis the metadata for a single event, i.e., a single piece of metadata.
- the annotation engine 235annotates the segments with the metadata, and is one means for doing so.
- Metadata instancesmay include automatic annotations of low level content features, e.g., image features or content features, hand annotations with text descriptions, or both.
- the metadatamay be represented as text descriptions of time-based media events and/or feature vector representations extracted from examples of events.
- the annotationsare stored in the annotated event store 290 .
- the comparative feature extraction engine 240converts an annotated event and a corresponding social media content item into a feature vector representation, and is one means for doing so.
- the three major types of features extracted by the comparative feature extraction engine 240are content features, geo-temporal features, and authority features.
- the media/event alignment engine 245aligns the social media content item 610 and annotated event 530 using the extracted features 620 , and is one means for doing so.
- the media/event alignment engine 245outputs an annotated event/social media mapping and associated confidence score to the mapping store 275 .
- the followingis a non-comprehensive list of media types that can be associated with time-based media: audio of commentators on, or participants of, the event or topic (e.g., announcers on TV or radio) and text transcriptions thereof (generated manually or automatically), event-related metadata (e.g., recipes, instructions, scripts, etc.), statistical data (e.g., sports statistics or financial data streams), news articles, social media content items, and media usage statistics (e.g., user behavior such as viewing, rewind, pausing, etc.).
- the social media content itemsinclude long form and short form social media content items such as posts, videos, photos, links, status updates, blog entries, tweets, and the like from various social media and mainstream news sources that are stored in the social media content store 260 .
- social networksallow their users to publish text-based content items to other members of their network, which content items may be open and viewable by the public through open application program interfaces.
- static text-based mediadescribes a large class of information on the Internet (e.g., blogs, news articles, web pages, etc.). This information changes only minimally once posted (i.e., is relatively static) and is primarily made up of words (i.e., is text-based).
- Dynamic text-based mediarefer to any of a set of “data feeds” composed of short, frequently updated user posts to social network websites that often describe the states and opinions of their authors.
- usage statisticsmay be ingested, either alone or generated from the time-based media in the multimedia store 270 , and stored in the usage stats store 265 .
- Usage statisticsmay include information regarding how the multimedia data was consumed, e.g., number of views, length of views, number of pauses, time codes at which a pause occurs, etc.
- the statisticscan be aggregated with respect to different populations, such as by user type, location, usage type, media type, and so forth.
- the statisticscan represent means, modes, medians, variances, rates, velocities, population measures, and the like.
- the social interest estimator 250aggregates information from the annotated event store 290 and the mapping store 275 to estimate social interest in a given media event using a social interest score, and is one means for doing so.
- the social interest scoreis estimated by the social interest estimator 250 by cycling through all (or selected) annotated events, and for each event, taking a weighted sum of the confidence scores for each social media content item that exceeds a given threshold.
- the resulting social interest scoreis stored in the social interest store 285 .
- the user interface engine 255converts the social interest into a format for display on a user interface, e.g., for depicting social interest heat maps as shown in FIGS. 8A-13D , and is one means for doing so.
- the user interface engine 255allows the client devices 150 to interact with the user interfaces providing the social interest score.
- the user interface engine 255provides a user interface display with three main areas: (1) a social interest heat map area for displaying a social interest heat map showing the levels of social interest for a plurality of events corresponding to a series of chronological time segments, (2) a media display area, visually distinguished from and concurrently displayed with the social interest heat map area, for displaying an event selected from the social interest heat map, and (3) a social media display area, visually distinguished from and concurrently displayed with the social interest heat map and media display areas, for displaying social media content items for the selected event.
- Different event typesmay be displayed such that the different event types each are visually distinct within the social interest heat map area, e.g., for a football game on broadcast television, showing events corresponding to plays of the game in one manner (e.g., a first color) and events corresponding to commercials in between plays of the game in a different manner (e.g., a second color).
- the user interface engine 255may provide additional functionality for the user interface. For example, a user interface field for filtering the time segments according to a keyword or search term, wherein the social interest heat map area then displays only a subset of time segments matching the search term. See FIG. 11A , reference numeral 1105 .
- the user interfacemay allow for separate display of positive and negative sentiment among aggregated content items for each event segment. A first portion of the segment may correspond to a positive sentiment, a second portion of the segment may correspond to a negative sentiment, and both segments may be displayed, such that they are visually distinguished from each other. See FIG. 10A , reference numerals 1010 , 1012 . In some embodiments, an additional portion of the segment may correspond to neutral or uncertain sentiment.
- the domain ontology engine 205may provide the filtering aspects for the user interface, and the social interest estimator 250 may provide the sentiment analysis.
- the timing engine 253extracts detailed timing information from time-based media events and portions thereof, and is one means for doing so. For example, if a particular ARM compares two time-delimited portions of a time-based media event, e.g., the first ten minutes versus the last ten minutes, or two commercials within an event, etc., the timing engine 253 provides additional timing information for the time-based media event such that the desired portions are individually identifiable within the event as a whole. In addition, the timing engine 253 can extract and store basic timing information to the mapping store 275 if not already present.
- Basic timing informationmay include, for example, the length of a media event, time it aired, time and/or length of portions of events within a show or larger event, and time elapsed between two times, as well as timing aspects related to the manner of observation as discussed below.
- the timing engine 253can identify broadcast time periods (e.g., midday, primetime, etc.), pre-event time periods (for anticipation calculations), post-event time periods (e.g., for calculating delayed response that occurs greater than a threshold time after the time-based media event), etc.
- the additional timing informationis added to the annotations associated with a time-based media/social media mapping as stored in the mapping store 275 .
- the timing informationcan be extracted from a programming guide or other source of programming information (e.g., a website for a network, etc.). For other events, e.g., commercials, programming guide-type information may not be available. For these events, the timing information may be derived, e.g., via the video event segmentation 310 and video metadata alignment/annotation 320 processes described herein.
- the timing engine 253also may capture information indicating whether the audience response is to an event that they observe live (e.g., the first run of a television show) or at different times (e.g., as a rerun of the first run broadcast, on demand technologies or other time-shifted viewing). This timing information may be obtained based on whether the time of response is near in time to the time of broadcast, location of viewing (e.g., if viewed via a website), or provided viewing information (e.g., a content item indicates that it was watched via DVR), to name a few means of determining this information. In other embodiments, other methods of determining viewing times are used.
- the audience response metrics (ARM) engine 254generates all of the various audience response metrics described herein, and is one means for doing so.
- the input to the ARM engine 254is the mappings stored in the mapping store 275 , as well as other possible information, e.g., from the timing engine 253 , the consumption-based metrics engine 256 and store 293 , the time-based media cost engine 258 and store 295 , the social media author store 263 , and the social media content store 260 .
- the ARM engine 254executes any of the steps necessary for the metrics calculations, such as selection of events, portions/times within events, comparisons of events, determination of number of unique authors from the plurality of authors, and calculations of ARMs. The determination and use of various ARMS is further described below.
- the ARM engine 254can generate event-specific and comparative content item-based ARMs, based on the number of social media content items associated with time-based media events and unique author ARMs, based on the number of unique authors of social media content items associated with time-based media events.
- the ARM engine 254can apply various filters to the various ARMs, can combine ARMs with other ARMS to generate multiple factor ARMs, with consumption based metrics (CBMs), and/or with monetary values associated with time-based media events.
- CBMsconsumption based metrics
- the ARM store 291stores the generated ARMs for further ARM generation by the ARM engine 254 , ratings determinations by the ratings engine 259 , or other uses, and is one means for doing so.
- the consumption-based metrics (CBM) engine 256collects and/or generates consumption based metrics, which are measures of audience consumption (e.g., size of viewing population, etc.), and is one means for doing so. According to one embodiment the CBM engine 256 simply collects CBMs from a third party for use by the ARM engine 254 in generating the metrics described herein. In another embodiment, the CBM engine 256 generates the CBMs based upon raw data feeds of audience behavior that is input to the engine.
- the CBM store 293stores the collected and/or generated CBMs, e.g., for use by the ARM engine 254 .
- the time-based media cost engine 258communicates with third party resources and collects information regarding the cost of airing a show or advertising, e.g., for a given time period, on a particular channel, and is used by the ARM engine 254 , and is one means for doing so.
- the time-based media cost store 295stores the collected advertising cost information.
- the ratings engine 259creates, and may publish, ratings based on any of the metrics described herein or combinations thereof, and is one means for doing so.
- the term ratingsrefers to how one or more ARMs compare to the same ARM(s) for different events of the same type, in the same time slot, etc.
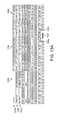
- the Audience Response CountARC
- ARCis a one type of ARM, and is a total number of social media content items aligned with a given time-based media event).
- Neighborswhich is a half-hour comedy sitcom that airs at 8 pm on Thursdays starting on Network A.
- the ARC for the show in this examplecould 12,500.
- the ARC ratings for primetime Thursdays, for this show and two others in this examplecould be:
- these ratingsshow how Neighbors compares to other shows using ARC Thursdays, and primetime as the criteria for inclusion in the comparison. Neighbors is second in the ratings for primetime Thursdays per the above. However, Neighbors might score differently in the ratings if a different ARM is chosen for the ratings determination (e.g., if ARR is used, with a filter for length of show, as both Found and the 8 pm news are 60 minutes long), or if a different time period is used (e.g., primetime across all days of the week), or types of shows (e.g., all comedies), if a combination of metrics are used (e.g., UARM and CRM), etc.
- the ratings engine 259aggregates values for all shows using a particular metric (or metrics) and possible other criteria, to show ratings as a comparison between shows meeting the criteria. Once ratings are determined by the ratings engine 259 , they are stored in the ratings store 297 . The ratings may be published in whole or in part according to some embodiments, or may be used as information for determinations of content creation, media planning, and/or media buying.
- FIG. 3is a conceptual diagram illustrating the video/metadata alignment/annotation 320 and social media/event alignment 330 processes at a high level according to one embodiment. Beginning with metadata instances 307 and events in time-based media 301 as input, annotated events 309 are formed. As shown, time-based media (TBM) 301 includes multiple segments (seg. 1 -M) 303 , which contain events in the time-based media, as described herein. The video/metadata alignment/annotation 320 process aligns one or more metadata instances ( 1 -N) 307 with the events to form annotated events 309 , as further described in conjunction with FIG. 5 .
- TBMtime-based media
- the social media/event alignment 330 processaligns, or “maps,” the annotated events 309 from the video/metadata alignment/annotation 320 to one or more social media content items (A-O) 311 , as further described in conjunction with FIG. 6 .
- the various alignmentsare one-to-one, many-to-one, and/or many-to-many.
- a given social media content item 311can be mapped to multiple different annotated events 309
- an annotated event 309can be mapped to multiple different social media content items 311 .
- the relationships between content items and eventscan be quantified to estimate social interest, as further explained below.
- FIG. 3Ais a flow diagram illustrating one embodiment of a method for aligning social media content items (and references to events therein) with time-based media events, and a related method of determining social interest in the events based on the resulting associations.
- social media content itemsare candidates for aligning with time-based media events, and a confidence score is determined for each indicative of a probability that the content item is relevant to the event. Based on the confidence scores, the content items may be aligned with the event, and the alignments are collected in a data store. The confidence scores are aggregated to produce an aggregate score, and a level of social interest in the event is established based upon the aggregate score.
- multiple streams of dataare ingested 300 at the social interest information provider 130 for processing.
- Datamay be received at the social interest information provider 130 directly from content providers, or via social media sources 110 or time-based media sources 120 , e.g., from broadcast television feeds, directly from content producers, and/or from other third parties.
- web server 200is one means for ingesting 300 the data.
- the types of datamay include, but are not limited to, time-based media, closed captioning data, statistics, social media posts, mainstream news media, and usage statistics, such as described above.
- the ingested datais stored in data stores specific to one or more data types that serve as the input data sources for the primary processes of the method of FIG. 3A (each shown in bold).
- time-based media datais stored in the multimedia store 270 .
- the time-based media in the multimedia store 270may undergo additional processing before being used within the methods shown in FIGS. 3-7 .
- closed captioning datacan be extracted from, or created for 305 , the time-based media, e.g., by closed captioning extractor 215 .
- usage statisticsmay be ingested, either alone or generated from the time-based media in the multimedia store 270 , and stored in the usage stats store 265 .
- event metadata associated with multimediais stored in the event metadata store 273
- social media content items as described hereinare stored in the social media content store 260
- information about authors of social media content itemsare stored in the social media author store 263
- domain ontologies indicating, for example, vocabularies specific to different media typesare stored in the domain ontologies 257 .
- the multimedia store 270includes various forms of time-based media.
- the time-based mediamay be of various types, as described in conjunction with FIG. 2 .
- video event segmentation 310there are three major processes involved in the method according to the depicted embodiment: video event segmentation 310 , video metadata alignment 320 , and social media/event alignment/mapping 330 .
- video metadata alignment 320may be included in the method.
- social media/event alignment/mapping 330may be included in the method.
- social interest estimation 340may be included in the method. Each of these processes 310 - 340 are described below.
- the first processis video event segmentation 310 , in which the time-based media is segmented into semantically meaningful segments corresponding to discrete events depicted in video.
- the input to the video event segmentation 310 processis a raw video (and/or audio) stream that is retrieved from the multimedia store 270 according to one embodiment, and may be performed, e.g., by the event segmentation engine 220 , which is one means for performing this function.
- the video event segmentation 310 processis domain dependent to some extent, e.g., in video of sporting events, event segments may be equated with individual plays, while in broadcast television, event segments may be equated with individual scenes and advertisements.
- event types and segment sizemay vary based on the domain type, and for some media, e.g., short format media such as very short video clips, the entire clip is treated as one segment.
- They systemmay be pre-configured with information about to which domain the video belongs. This configuration may be implemented by hand on a case by case basis, or based on a preloaded schedule based on the source of video and time of day (using, for example, a programming guide of broadcast television shows).
- Segmentationmay be achieved via human annotation, known automated methods, or a hybrid human/automatic approach in which automatic segment boundaries are corrected by human annotators according to various embodiments.
- One automated methodis described in Fleischman, M. and Roy, D., Unsupervised Content - Based Indexing of Sports Video Retrieval, 9th ACM Workshop on Multimedia Information Retrieval (MIR), Augsburg, Germany (September 2007).
- the video event segmentation 310 processincludes three main components according to one embodiment: shot boundary detection, event detection, and boundary determination. These components may vary by domain. For example, for sporting events an additional component may correspond to scene classification (e.g., field or stadium identification).
- scene classificatione.g., field or stadium identification
- the output of video event segmentation 310is a set of segmented video events that are stored in the video event store 280 .
- Video event segmentation 310is described in further detail in conjunction with FIG. 4 .
- the next processis metadata alignment/annotation 320 , in which the segments from video event segmentation 310 are annotated with semantically meaningful information regarding the event that the segment is relevant to, or depicts.
- Input to metadata alignment/annotation 320is a video event retrieved from the video event store 280 and metadata from the event metadata store 273 .
- metadatacan include, but is not limited to: the type of event occurring, the agents involved in the event, the location of the event, the time of the event, the results/causes of the event, etc.
- the metadata alignment/annotation 320 processis domain dependent.
- metadata for an eventmay include information such as “Passer: Tom Brady, Result: Touchdown, Receiver: Randy Moss,” while metadata for an event in a television series may include information such as: “Agent: Jack Bauer, Location: White House, Time: 3:15 pm,” and for an advertisement the metadata may include information such as “Brand: Walmart, Scene: father dresses up as clown, Mood: comic.”
- the metadatacan be structured as tuples of ⁇ name, value> pairs.
- the metadataincludes text and, for certain domains, lower level image and audio properties. Metadata may be generated using human annotation (e.g., via human annotators watching events or samples thereof) and, in certain domains, may be supplemented with automatic annotations for use in the alignment process (e.g., describing lower level image and audio properties of the event such as number and length of each shot, average color histograms of each shot, power levels of the associated audio, etc.)
- the annotationis stored in the annotated event store 290 .
- Metadata alignment/annotation 320includes two steps according to one embodiment: event feature extraction and video metadata alignment. Metadata alignment/annotation 320 is described in further detail in conjunction with FIG. 5 .
- data ingestion 300 , video event segmentation 310 , and video metadata alignment 320could be performed by a separate entity, such as a content provider or owner, e.g., which does not want to release the content to others.
- the social interest information provider 130would provide software, including the software modules and engines described herein, to the separate entity to allow them to perform these processes on the raw time-based media.
- the separate entity in returncould provide the social interest information provider 130 with the extracted features and other inputs to the social media/event alignment 330 and social interest estimation 340 processes, which then would be used by the social interest information provider 130 in those processes.
- APIapplication programming interface
- the next stepis to integrate the annotated time-based media event segments with social media content items that refer to the events.
- Input to social media/event alignment 330is an annotated event retrieved from the annotated event store 290 , a social media content item retrieved from the social media content store 260 , a domain ontology retrieved from the domain ontologies 257 , and optionally author information about the social media content item author retrieved from the social media author store 263 .
- social media content itemsoften are ambiguous as to whether they refer to an event at all, and if so, which event they refer to.
- a simple social media content itemsuch as the single word post “Touchdown!” may refer to an event in a football game, or it may be used as a metaphor for a success in areas unrelated to football.
- the social media/event alignment 330determines a confidence score that a given social media content item refers to a specific event. The method takes as input a single social media content item and a single annotated event, and outputs a score representing the confidence (e.g., likelihood, probability) that the social media content item is relevant to the event.
- a social media content itemcan be relevant to an event by referring to the event.
- the social media/event alignment 330 functionoperates on features of the individual social media content items and annotated events, and can be trained using supervised learning methods or optimized by hand.
- the media/event alignment engine 245is one means for performing this function.
- the output of social media/event alignment 330is a mapping between an annotated event and a social media content item (and/or references to events therein) and an associated confidence score.
- the mapping and confidence scoreare stored in a mapping store 275 .
- the social media/event alignment 330 processis described in further detail in conjunction with FIG. 6 .
- mappings output by social media/event alignment 330are useful in and of themselves, as they may be used as the basis for multiple applications, such as, ranking of search results for time-based media, automatic recommendations for time-based media, prediction of audience interest for media purchasing/planning, and estimation of social interest as described further below.
- One of the uses of the social media/event mappingsis the estimation of social interest in various events.
- Social interest in an eventmay be estimated by aggregating the information gleaned from the processes described with respect to FIG. 3A .
- the input to social interest estimation 340is an annotated event retrieved from the annotated event store 290 and the annotated event social media mapping retrieved from the mapping store 275 .
- inputs from the social media content store 260 and social media author store 263may be used as part of the weighting process.
- the social interest estimator 250is one means for performing this function.
- the social interest estimation 340is achieved for an annotated event by cycling through all social media content items associated with that event (as indicated by the presence of an annotated event/social media mapping 630 ( FIG. 6 ) in the mapping store 275 ), and taking a weighted sum of the confidence scores for each social media content item.
- a weighted sum of the confidence scoresis taken for social media content items that exceed a threshold.
- no thresholdis used or a function with a “sliding scale” of (score, weight) where the weight is applied to the score, and then added to the sum.
- the effect of this weightingis that the events that are associated with more social media content items (and references to events therein) correlate with higher estimated social interest.
- social interest in an eventoften is dependent on the source, author, and/or sentiment of the social media content item referencing it, as described further in conjunction with weighting function 710 in FIG. 7 .
- the output of the social interest estimation 340is a social interest score that is stored in the social interest store 285 .
- the social interest estimation 340is described in further detail in conjunction with FIG. 7 .
- the social interest estimation 340 resultsmay be displayed to a user of a social interest information device 150 , e.g., using user interface engine 255 , as described in conjunction with FIGS. 8A-13D .
- the social interest scoremay be used as the basis for multiple applications, such as data analytics, media planning, ranking of search results for time-based media, automatic recommendations for time-based media, direct end-user data navigation via a user interface, and prediction of audience interest for media purchasing/planning to name a few.
- FIG. 4is a flow diagram illustrating one embodiment of a video event segmentation process 310 .
- video event segmentation 310segments time-based media into semantically meaningful segments corresponding to discrete video portions or “events,” e.g., via event segmentation engine 220 , which is one means for performing this function.
- Video event segmentation 310includes 3 phases: shot boundary detection 410 , event detection 420 , and event boundary determination 430 , each of which is described in greater detail below.
- the output of video event segmentation 310is a segmented video event 435 , which is stored in the video event store 280 .
- the first step in segmentingis shot boundary detection 410 for discrete segments (or “shots”) within a video.
- Shot boundariesare points of non-continuity in the video, e.g., associated with a change in a camera angle or scene. Shot boundaries may be determined by comparing color histograms of adjacent video frames and applying a threshold to that difference. Shot boundaries may be determined to exist wherever the difference in the color histograms of adjacent frames exceeds this threshold.
- Many techniquesare known in the art for shot boundary detection.
- One exemplary algorithmis described in Tardini et al., Shot Detection and Motion Analysis for Automatic MPEG -7 Annotation of Sports Videos, 13th International Conference on Image Analysis and Processing (November 2005).
- Other techniques for shot boundary detection 410may be used as well, such as using motion features.
- Another known techniqueis described in A. Jacobs, et al., Automatic shot boundary detection combining color, edge, and motion features of adjacent frames , Center for Computing Technologies, Bremen, Germany (2004).
- Event detection 420identifies the presence of an event in a stream of (one or more) segments using various features corresponding, for example, to the image, audio, and/or camera motion for a given segment.
- a classifier using such featuresmay be optimized by hand or trained using machine learning techniques such as those implemented in the WEKA machine learning package described in Witten, I. and Frank, E., Data Mining: Practical machine learning tools and techniques (2nd Edition), Morgan Kaufmann, San Francisco, Calif. (June 2005).
- the event detection process 420 detailsmay vary by domain.
- Image featuresare features generated from individual frames within a video. They include low level and higher level features based on those pixel values. Image features include, but are not limited to, color distributions, texture measurements, entropy, motion, detection of lines, detection of faces, presence of all black frames, graphics detection, aspect ratio, and shot boundaries.
- Speech and audio featuresdescribe information extracted from the audio and closed captioning streams. Audio features are based on the presence of music, cheering, excited speech, silence, detection of volume change, presence/absence of closed captioning, etc. According to one embodiment, these features are detected using boosted decision trees. Classification operates on a sequence of overlapping frames (e.g., 30 ms overlap) extracted from the audio stream. For each frame, a feature vector is computed using Mel-frequency cepstral coefficients (MFCCs), as well as energy, the number of zero crossings, spectral entropy, and relative power between different frequency bands. The classifier is applied to each frame, producing a sequence of class labels. These labels are then smoothed using a dynamic programming cost minimization algorithm, similar to those used in hidden Markov models.
- MFCCsMel-frequency cepstral coefficients
- featuresmay be extracted from the words or phrases spoken by narrators and/or announcers. From a domain specific ontology 257 , a predetermined list of words and phrases is selected and the speech stream is monitored for the utterance of such terms. A feature vector representation is created in which the value of each element represents the number of times a specific word from the list was uttered. The presence of such terms in the feature vector correlates with the occurrence of an event associated with the predetermined list of words. For example, the uttering of the phrase “touchdown” is correlated with the occurrence of a touchdown in sports video.
- camera motion featuresrepresent more precise information about the actions occurring in a video.
- the cameraacts as a stand in for a viewer's focus. As actions occur in a video, the camera moves to follow it; this camera motion thus mirrors the actions themselves, providing informative features for event identification.
- shot boundary detectionthere are various methods for detecting the motion of the camera in a video (i.e., the amount it pans left to right, tilts up and down, and zooms in and out).
- Bouthemy, P., et al.A unified approach to shot change detection and camera motion characterization , IEEE Trans.
- this systemcomputes the camera motion using the parameters of a two-dimensional affine model to fit every pair of sequential frames in a video.
- a 15-state first-order hidden Markov modelis used, implemented with the Graphical Modeling Toolkit, and then the output of the Bouthemy is output into a stream of clustered characteristic camera motions (e.g., state 12 clusters together motions of zooming in fast while panning slightly left).
- Some domainsmay use different, or additional, methods of identifying events. For example, in American football, an additional factor may be scene classification.
- a scene classifierIn scene classification, once a shot boundary is detected a scene classifier is used to determine whether that shot is primarily focused on a particular scene, e.g., a playing field. Individual frames (called key frames) are selected from within the shot boundaries and represented as a vector of low level features that describe the key frame's color distribution, entropy, motion, etc. A shot is determined to be of a particular scene if a majority of the sampled frames is classified as that scene.
- Event boundary determination 430may be performed using a classifier that may be optimized by hand or using supervised learning techniques. The classifier may make decisions based on a set of rules applied to a feature vector representation of the data. The features used to represent video overlap with those used in the previous processes.
- Eventshave beginning and end points (or offsets), and those boundaries may be determined based on the presence/absence of black frames, shot boundaries, aspect ratio changes, etc., and have a confidence measure associated with the segmentation.
- the result of event boundary determination 430(concluding video event segmentation 410 ) is a (set of) segmented video event 435 that is stored in the video event store 280 .
- FIG. 5is a flow diagram illustrating one embodiment of a metadata alignment/annotation 320 process.
- the metadata alignment/annotation 320 processproduces annotations of the segments from video event segmentation 310 , which annotations include semantically meaningful information regarding the event or topic that the segment is about.
- Metadata alignment/annotation 320includes two steps: event feature extraction 315 and video metadata alignment 520 .
- the first stepis to convert the video event into a feature vector representation via feature extraction 315 .
- the feature extraction engine 225is one means for performing this function.
- Input to the processis a segmented video event 435 retrieved from the video event store 280 .
- Output from the video feature extraction 315is a video event feature representation 510 .
- the featuresmay be identical to (or a subset of) the image/audio properties discussed above for video events and stored in the event metadata store 273 , and may vary by domain.
- Video metadata alignment 520takes as input the feature vector representation 510 of an event and a metadata instance 505 , defined above as metadata corresponding to a single event.
- the metadata alignment engine 230is one means for performing this function. It cycles through each metadata instance 505 in the event metadata store 273 and uses an alignment function to estimate the likelihood that a particular event may be described by a particular metadata instance for an event.
- metadata instancesmay include automatic annotations of low level content features (e.g., image or audio features), hand annotations of text descriptions, or both.
- the alignment functionmay be a simple cosign similarity function that compares the feature representation 510 of the event to the low level properties described in the metadata instance 505 .
- the video metadata alignment 520 methodmay employ a model which encodes relationships between low level features and descriptive text.
- One exemplary modelis described in Fleischman, M. and Roy, D., Grounded Language Modeling for Automatic Speech Recognition of Sports Video , Proceedings of the Association of Computational Linguistics (ACL), Columbus, Ohio, pp. 121-129 (June 2008).
- This methoduses grounded language models that link visual and text features extracted from a video to the metadata terms used to describe an event.
- grounded language modelscan be manually estimated based on the visual and text features used for event segmentation, from which the following equation describes the likelihood that any particular metadata annotation describes a particular video event:
- the video event associated with the feature representation 510is annotated with the metadata instance 505 and the resulting annotated event 530 is stored in an annotated event store 290 along with a score describing the confidence of the annotation. If no event passes the threshold, the event is marked as not annotated. In order to set this threshold, a set of results from the process is hand annotated into two categories: correct and incorrect results. Cross-validation may then be used to find the threshold that maximizes the precision/recall of the system over the manually annotated result set.
- FIG. 6is a flow diagram illustrating one embodiment of a social media/event alignment 330 process.
- Social media/event alignment 330associates (maps) the annotated time-based media event segments with social media content items and references to the events therein.
- social media filtering step 605occurs; the domain ontologies 257 are one means for performing this function.
- Social media content itemsare filtered in order to create a set of candidate content items with a high likelihood that they are relevant to a specific event.
- Content itemscan be relevant to an event by including a reference to the event.
- a candidate set of content itemsis compiled based on the likelihood that those posts are relevant to the events, for example, by including at least one reference to a specific event.
- the comparative feature extraction engine 240is one means for performing this function.
- this candidate set of content itemscan be the result of filtering 605 associated with a given time frame of the event in question.
- Temporal filtersoften are far too general, as many content items will only coincidentally co-occur in time with a given event.
- broadcast televisione.g., the increasing use of digital video recorders has broadened significantly the relevant timeframe for events.
- Additional filters 605are applied based on terms used in the content item's text content (e.g., actual texts or extracted text from closed caption or audio) that also appear in the metadata for an event and/or domain specific terms in the ontologies 257 .
- terms used in the content item's text contente.g., actual texts or extracted text from closed caption or audio
- content item of a social network posting of “Touchdown Brady! Go Patriots”has a high probability that it refers to an event in a Patriots football game due to the use of the player name, team name, and play name, and this content item would be relevant to the event.
- a content item of a post that “I love that Walmart commercial”has a high probability that it refers to an advertisement event for Walmart due to the use of the store name, and the term “commercial,” and thus would likewise be relevant to this event.
- termsare used from the metadata of an event as well as those domain-specific terms stored in ontology 257 .
- a social media content itemcan be relevant to an event without necessarily including a direct textual reference to the event.
- Various information retrieval and scoring methodscan be applied to the content items to determine relevancy, based on set-theoretic (e.g., Boolean search), algebraic (e.g., vector space models, neural networks, latent semantic analysis), or probabilistic models (e.g., binary independence, or language models), and the like.
- set-theoretice.g., Boolean search
- algebraice.g., vector space models, neural networks, latent semantic analysis
- probabilistic modelse.g., binary independence, or language models
- Social media content items that do not pass certain of these initial filterse.g., temporal or content filters
- the output of social media filtering 605is an updated social media content store 260 , which indicates, for each content item, whether that content item was filtered by temporal or content filters. Additional filters may apply in additional domains.
- Social media/annotated event alignment 330includes a feature extraction process 620 and an alignment function 625 .
- the feature extraction process 620converts input of an annotated event 530 and a social media content item 610 into a feature vector representation, which is then input to the alignment function 625 .
- the feature extraction process 620also may receive input from the social media author store 263 and the domain ontologies 257 .
- the three major types of features extracted in this process 620are content features 620 c , geo-temporal features 620 b , and authority features 620 a .
- the comparative feature extraction engine 240is one means for performing this function, which identifies a relationship between the event features and social media features. The relationship may be co-occurrence, correlation, or other relationships as described herein.
- Content features 620 crefer to co-occurring information within the content of the social media content items and the metadata for the video events, e.g., terms that exist both in the content item and in the metadata for the video event.
- Domain ontologies 257may be used to expand the set of terms used when generating content features.
- Geo-temporal features 620 brefer to the difference in location and time at which the input media was generated from a location associated with the social media content item about the event. Such information is useful as the relevance of social media to an event is often inversely correlated with the distance from the event (in time and space) that the media was produced. In other words, social media relevant to an event is often produced during or soon after that event, and sometimes by people at or near the event (e.g., a sporting event) or exposed to it (e.g., within broadcast area for television-based event).
- geo-temporal informationcan be determined based on the location and/or time zone of the event or broadcast of the event, the time it started, the offset in the video that the start of the event is determined, the channel on which it was broadcast.
- geo-temporal informationcan be part of the content of the media itself (e.g., a time stamp on a blog entry or status update) or as metadata of the media or its author.
- the temporal featuresdescribe the difference in time between when the social media content item was created from the time that the event itself took place. In general, smaller differences in time of production are indicative of more confident alignments. Such differences can be passed through a sigmoid function such that as the difference in time increases, the probability of alignment decreases, but plateaus at a certain point.
- the parameters of this functionmay be tuned based on an annotated verification data set.
- the spatial featuresdescribe the distance from the author of the content item location relative to the geographical area of the event or broadcast. Spatial differences are less indicative because often times people comment on events that take place far from their location. A sigmoid function may be used to model this relationship as well, although parameters are tuned based on different held out data.
- Authority features 620 adescribe information related to the author of the social media and help to increase the confidence that a social media content item refers to a video event.
- the probability that any ambiguous post refers to a particular eventis dependent upon the prior probability that the author would post about a similar type of event (e.g., a basketball game for an author who has posted content about prior basketball games).
- the prior probabilitycan be approximated based on a number of features including: the author's self-generated user profile (e.g., mentions of a brand, team, etc.), the author's previous content items (e.g., about similar or related events), and the author's friends (e.g., their content contributions, profiles, etc.). These prior probability features may be used as features for the mapping function.
- the alignment function 625takes the set of extracted features 620 a - c and outputs a mapping 630 and a confidence score 640 representing the confidence that the social media content item refers to the video event.
- the media/event alignment engine 245is one means for performing this function. For each feature type 620 a - c , a feature specific sub-function generates a score indicating whether the social media content item refers to the annotated event. Each sub-function's score is based only on the information extracted in that particular feature set.
- the output of the social media/event alignment function 330is a mapping between an annotated event and a social media content item. This mapping, along with the real-value confidence score is stored in the mapping store 275 .
- FIG. 7is a flow diagram illustrating one embodiment of a social interest estimation process 340 .
- Social interest in an eventmay be estimated by aggregating the information gleaned from the video event segmentation 310 , video metadata alignment 320 , and social media/event alignment 330 processes.
- the social interest estimator 250is one means for performing this function.
- Input to the social interest estimation process 340includes an annotated event 530 retrieved from the annotated event store 290 and an annotated event/social media mapping 620 retrieved from the mapping store 275 .
- data from the social media content store 260 and social media author store 263may be used for the weighting function 710 .
- social interestis estimated based on a weighted count of references to particular events in each social media content item.
- Social media content items relevant to an eventare indicative of interest, and by discovering and aggregating such content items and references to events therein, a social interest score is generated that represents the level of social interest of the event based on the aggregated content items.
- the social interest estimation process 340includes the computation of a weighted sum over all social media content items that include at least one reference to an event.
- the computationproceeds by cycling through all social media content items that refer to that event (as determined in the social media/annotated event alignment 330 process). For each item aligned to that event the social interest score for that event is incremented by a weighted value based on the metadata of the content item.
- the output social interest score 720can be thought of as an aggregate score aggregated across the confidence scores 640 for each event.
- weightstypically can be set from zero to one depending on the configuration of the system.
- the weightsare multiplicative, and are based on various factors described below: as social media content weights 710 a , source-based weights 710 b , author-based weights 710 c , and/or event-based weights 710 d.
- Social media content weights 710 acan be used in the social interest estimation process 340 based on, for example, the sentiment of the media that mention it. For example, scores can be weighted such that interest is computed based only on posts that describe positive sentiment toward an event (i.e., only posts from authors who expressed positive sentiment toward the event are incorporated in the weighted sum).
- the sentiment expressed in a social media content itemmay be automatically identified using a number of techniques. Exemplary techniques are described in B. Pang and L. Lee, Opinion Mining and Sentiment Analysis , Foundations and Trends in Information Retrieval 2(1-2), pp. 1-135 (2008).
- Source-based weights 710 bcan be used in the social interest estimation process 340 based on how (e.g., in what form) an event is mentioned. Some sources may be given higher weight if they are determined to be more influential as measured by, for example, the size of their audience (as estimated, for example, by QuantCast Corporation, San Francisco, Calif.) or the number of inbound links to the source site. Further, certain sources may be given higher weight in order to generate social interest scores for specific communities of users.
- a social interest scoremay be computed based on only social media content items generated by sources of a particular political leaning (e.g., Republican or Democrat) by setting the weights to zero of all content items with sources that are not predetermined to be of that particular political leaning (e.g., where the political leaning of a source is determined by a human expert or a trained machine classifier).
- sources of a particular political leaninge.g., Republican or Democrat
- Author-based weights 710 ccan be used in the social interest estimation process 340 to bias the social interest estimate toward specific communities of users.
- the estimate of social interestmay be biased based on demographic information about the author of the post, such that, for example, only posts that were generated by men older than 25 years old are given weight greater than zero. Determination of such demographic information may come from an examination of publicly available data posted by the author themselves, by human annotation of specific authors based on expert opinion, or by machine classifiers trained on human labeled examples.
- estimate of social interestcan be weighted toward only fans of the home team by filtering posts based on their location of origin (i.e. only posts from authors in the home team's city are incorporated in the weighted sum) or previous history of posts (i.e. the author has a history of posting positive remarks about the home team).
- Event-based weights 710 dcan be used in the social interest estimation process 340 based on evidence of social interest within the time-based media stream itself.
- Examples of such mediainclude, but are not limited to, series television shows, and broadcast sports games.
- time-based mediamultiple features exist that provide information useful for estimating social interest. Examples of this include, but are not limited to, visual analysis (e.g., looking for specific events, such as explosions), audio analysis (e.g., identification of high energy sound events, such as excited speech), natural language analysis (e.g.
- the social interest scorescan be weighted based on the behaviors of viewers of the time-based media, as stored in the usage statistics 265 .
- Such user behavioris integrated based upon the timing of user content items relative to media and presentation times of the events (e.g., how often a particular event was replayed). Analysis of these behaviors across multiple users can be indicative of social interest, for example, when the same section of media is paused and reviewed multiple times (by multiple people).
- Other recordable user behavior from the usage statistics 265 that can be used for the social interest estimation process 340includes, but is not limited to, viewing times, dwell times, click through rates for advertisements, search queries, sharing behavior, etc.
- the output of the social interest estimation process 340is a social interest score 720 that is stored in the social interest store 285 .
- the social interest score 720may be used to provide information for a user interface, e.g., as described in the displays depicted herein, via user interface engine 255 , which is one means for performing this function.
- multiples streams of dataare ingested as a preliminary step in the method.
- an additional source of datacomes from statistical feeds that contain detailed metadata about events (with text descriptions of those events) in a football game.
- Statistical feedare available from multiple sources such as the NFL's Game Statistics and Information System and private companies such as Stats, Inc.
- the time-based mediae.g., a television feed for a football game
- the time-based mediais segmented into semantically meaningful segments corresponding to discrete “events” that include plays in a game (and advertisements in between).
- the first step in segmenting events in a football videois to detect the shot boundaries of a video. Shot boundaries are points in a video of non-continuity, often associated with the changing of a camera angle or a scene. In the domain of American football, changes in camera angles are typically indicative of changes in plays.
- event detection 420may operate by first identifying shots that depict the football field. Once a shot boundary is detected, a scene classifier is used to determine whether that shot is primarily focused on the playing field. Field shots may then be further classified as depicting a game event (i.e. a play).
- a game eventi.e. a play.
- the beginning and end points (i.e., in/out points) of an eventmay be refined to reflect more appropriate start and stop points of a play. Such in/out points may be adjusted based on clock characterization, and/or utterance segmentation. In a professional football game, the beginning and end of a play is sometimes (but not always) associated with the starting or stopping of the play clock.
- This play clockis often shown as a graphic overlay in a broadcast football game.
- the starting/stopping of this play clockcan be determined by monitoring the amount of change (in pixels) of a frame sub-region (i.e., the region containing the play clock graphic) in the video over time.
- a frame sub-regioni.e., the region containing the play clock graphic
- the state of the play-clockis assumed to be “inactive.” If the aggregate change goes above a threshold, the state of the play-clock is assumed to be “active.” Changes in the state of the play-clock are strong indicators that an event has either begun or ended in the video.
- Aesthetic judgmentis often required when determining boundaries for the precise start and end points of a play. Approximating such judgments can be accomplished using the utterance boundaries in the speech of the game announcers. These utterances boundaries can be detected by identifying pauses in the stream of speech in the video. Pauses can be identified using audio processing software, such as is found in Sphinx 3 .
- the output of video event segmentation 310 for an American football game on televisionis a set of segmented video events corresponding to plays in a game.
- Metadatais stored in the event metadata store 273 .
- Video metadata alignment 520then takes as input the feature vector representation 510 of a single play and a metadata instance 505 . It cycles through each metadata instance 505 in the event metadata store 273 and estimates the likelihood that the particular play may be described by a particular metadata instance using, for example, a probabilistic model.
- a probabilistic modelis the grounded language model described above.
- feature extraction 620In social media/annotated event alignment 330 , feature extraction 620 generates geo-temporal features, content features, and authority features.
- Content feature representationsexpress the amount of correlated content between event metadata and terms within social media content items. For example, the content item “Touchdown Brady! Go Patriots,” and the annotation “passer: Brady, event: touchdown, receiver: Moss” have overlapping content terms (i.e., “touchdown” and “Brady”).
- the domain ontology 257 of football termsis used to expand the term set to include synonyms and hypernyms (e.g., “TD” or “score” for “touchdown”), as well as nicknames for players (e.g. “Tom Terrific” for “Brady”).
- synonyms and hypernymse.g., “TD” or “score” for “touchdown”
- nicknames for playerse.g. “Tom Terrific” for “Brady”.
- Authority feature representationsexpress the prior probability that any author of social media content may be referring to a football event.
- One factor in the estimation of this probabilitymay be based on the friends, followers, or other connections to a user in their social network. Such connections are indicative of an author's likelihood to post about a football event, which can provide additional features for the social media/event alignment 330 function.
- meta-scoresare generated for a user based on the frequency that their contacts have posted about football events. The meta-scores are the average, mode, and median of all of the frequency of their friends' football posts.
- the output of social media/event alignment 330is a mapping between the annotated play and each social media content item, with an associated confidence score.
- the social interest estimation 340may be calculated for every play in the game. The likely result is higher social interest scores for plays such as touchdowns, and lower social interest scores for lesser plays.
- multiples streams of dataare ingested as a preliminary step in the method.
- the time-based mediais segmented into semantically meaningful segments corresponding to discrete “events” which are identified with advertisements (i.e. commercials).
- Event detection 420 in the advertising domainmay operate by identifying one or more shots that may be part of an advertising block (i.e. a sequence of commercials within or between shows). Advertising blocks are detected using image features such as the presence of all black frames, graphics detection (e.g. presence of a channel logo in the frame), aspect ratio, shot boundaries. Speech/audio features may be used including detection of volume change, and the presence/absence of closed captioning.
- Event boundary detection 430operates on an advertisement block and identifies the beginning and ending boundaries of individual ads within the block. Event boundary determination may be performed using a classifier based on features such as the presence/absence of black frames, shot boundaries, aspect ratio changes. Classifiers may be optimized by hand or using machine learning techniques.
- Metadata for an advertisementmay include information such as “Brand: Walmart, Scene: father dresses up as clown, Mood: comic.” This metadata is generated by human annotators who watch sample ad events and log metadata for ads, including, the key products/brands involved in the ad, the mood of the ad, the story/creative aspects of the ad, the actors/celebrities in the ad, etc.
- Metadata for advertisementsmay also include low level image and audio properties of the ad (e.g. number and length of shots, average color histograms of each shot, power levels of the audio, etc.).
- Video metadata alignment 520then takes as input the feature vector representation 510 of a single advertisement and a metadata instance 505 . It cycles through each metadata instance 505 in the event metadata store 273 and estimates the likelihood that the particular advertisement may be described by a particular metadata instance using, for example, a simple cosign similarity function that compares the low level feature representation of the ad event to the low level properties in the metadata.
- feature extractionE.g., generates geo-temporal features, content features, and authority features.
- Content feature representationsexpress the amount of co-occurring content between event metadata and terms within social media content items. For example, the content item “I loved that very Walmart clown commercial” and the annotation “Brand: Walmart, Scene: father dresses up as clown, Mood: comic” have co-occurring content terms (i.e., “Walmart” and “clown”).
- the domain ontologies 257 that encode information relevant the advertising domainmay be used to expand the term set to include synonyms and hypernyms (e.g., “hilarious” for “comic”), names of companies, products, stores, etc., as well as, advertisement associated words (e.g., “commercial”).
- the output of social media/event alignment 330is a mapping between the annotated advertisement and each social media content item, with an associated confidence score.
- the social interest estimation 340may be calculated for every advertisement in an advertising block or television show. The likely result is higher social interest scores for particularly interesting or funny advertisements, and lower social interest scores for less exciting or repetitive advertisements.
- the methods described hereincan be adapted to any domain using time-based media.
- the method of adaptationis general across different domains and focuses on two changes.
- First, techniques and features used for event segmentation and annotationare adapted to reflect domain specific characteristics. For example, detecting events in football exploits the visibility of grass as it is represented in the color distributions in a video frame, while detecting events in news video may exploit clues in the closed captioning stream and graphic overlays in the frames.
- the second changeinvolves the ontology used to link events to social media content items which refer to them. While for football, the requisite ontology contains concepts related to football players, teams, and events, domains such as news video require ontologies with concepts related to germane concepts such as current events and culturally popular figures.
- FIGS. 8A and 8Bshow two embodiments of social interest heat maps 810 , 820 showing levels of social interest for a plurality of events corresponding to a series of chronological time segments in a time-based medium.
- FIG. 8Ashows a social interest heat map 810 corresponding to a football game, in which individual events (plays and advertisements) 815 are shown as vertical bars chronologically across a timeline 830 ; the time location of a bar corresponds to the beginning point of the event.
- the level (height) of estimated social interest in each event 815is shown vertically by number of social content items 850 corresponding to each event 815 , with a taller bar representing greater social interest.
- Two event types, advertisements 870 and plays 880are shown.
- FIG. 8Bshows a similar social interest heat map corresponding to a football game, in which individual events (plays and advertisements) 860 are shown chronologically across a timeline 840 .
- the level of estimated social interest in each event 860is shown by intensity of color of the corresponding bar 860 , with a darker bar representing greater social interest.
- Other color/intensity/texture/pattern scalescan be used to represent the level of interest.
- Two event types, advertisements 890 and plays 860are shown.
- FIGS. 13A-Dshow yet another embodiment of a user interface 1300 displaying social interest heat maps 1310 showing levels of social interest for a plurality of events corresponding to a series of chronological time segments in a time-based medium.
- FIG. 13Ashows a user interface 1300 a with each social interest heat map 1310 (horizontal bars) corresponding to a different channel.
- the width of the maps 1310corresponds to a time period as show in the navigation bar 1320 , between the two ends 1325 .
- Channelshave multiple distinct shows, shown as cells 1315 , thereby forming a grid.
- the level of social interestis indicated by intensity of color in a given cell 1315 , with the darkest cells indicative of the highest social interest in the show.
- the navigation bar 1320allows the user to select the timeframe for viewing, and the ends 1325 allow the size of the navigation bar to be expanded to adjust the visible portion of the social interest heat maps in the user interface 1300 , with the left end 1325 a controlling the beginning time and the right end 1325 b controlling the ending time for the social interest heat maps 1310 .
- FIG. 13Bshows a user interface 1300 b similar to that shown in FIG. 13A , except that the social interest heat maps 1310 include indication of advertisements 1330 that appear during the shows 1315 .
- the darkness of the lines corresponding to individual advertisementswith the darkness as an indicator of social interest in the advertisements, with darker indicating greater interest.
- FIG. 13Cshows a user interface 1300 c similar to that shown in FIG. 13A , except that the social interest heat maps 1310 are zoomed out to the level of days to show a different time scale on the navigation bar 1337 .
- each division 1340 in the navigation barcorresponds to a single day.
- the cells 1345correspond to times of day, e.g., Primetime.
- the darkness of color of each cellis representative of the social interest in shows and/or advertisements during that time frame.
- FIG. 13Dshows a user interface 1300 d similar to that shown in FIG. 13A , except that the social interest heat maps 1310 are zoomed out to the level of months to show a different time scale.
- the division 1365 in the navigation bar 1337corresponds to a quarter of a year.
- the cells 1355 in the gridcorrespond to months of the year.
- the darkness of color of each cellis representative of the social interest in shows and/or advertisements during that time frame.
- FIGS. 9A-9Cshow three embodiments of user interfaces 900 of a social interest estimation system. Each figure shows a social interest heat map area 910 , media display area 920 , and a social media display area 930 (not shown in 9 C).
- FIG. 9Ashows in the social interest heat map area 910 a three social interest heat maps 940 a - c similar to the one described in conjunction with FIG. 8A , each map 940 a - c corresponding to a different channel of media content.
- the media display area 920 ashows a media player for displaying the time-based media associated with the selected event 915 , in this example a Dodge Charger advertisement.
- the social media display area 930 ashows statistical information about the social media corresponding to the selected event, as well as the individual social media content items.
- FIG. 9Bshows in the social interest heat map area 910 b several social interest heat maps 960 similar to the one described in conjunction with FIG. 8B , each map 960 corresponding to a different channel, as well as an overall social interest heat map 970 corresponding to a selected event across all channels.
- the media display area 920 bshows a media player for displaying the time-based media associated with a user selected event 935 , in this example an advertisement scene. The user can select any event 935 in the display and invoke the player to show the video content of the event.
- the social media display areas 930 b 1 and 930 b 2show the individual social media content items ( 930 b 1 ) and statistical information about the social media corresponding to the selected event ( 930 b 2 ).
- FIG. 9Cshows in the social interest heat map area 910 c four social interest heat maps 950 a - d similar to the one described in conjunction with FIG. 8B , each map 950 a - d corresponding to a different channel.
- the media display area 920 cshows a media player for displaying the time-based media associated with the selected event 925 , in this example a pass in a football game. Again, the user can control the player to show an event by selecting the event 925 in a map 950 .
- FIGS. 10A and 10Bshow two embodiments of user interfaces 1000 of a social interest estimation system showing a sentiment view.
- the user interfaces 1000are similar to those shown in FIGS. 9A-9B , except that the social interest heat maps 940 , 970 provide information indicating the sentiment of the social media content items, i.e., whether they are negative or positive, e.g., based on the sentiment detection process described herein.
- FIG. 10Ashows for the event 915 in the social interest heat maps 940 , a (top) positive portion 1010 corresponding to the number of social media content items with positive sentiment, and a (bottom) negative portion 1012 corresponding to the number of social media content items with negative sentiment.
- the positive 1010 and negative 1012 portionsare visually distinguished from each other, such that their relative percentages within the whole of the event bar is visible.
- a radio button 1015is shown for toggling on and off the sentiment view.
- FIG. 10Bshows for an event 1015 in the overall social interest heat map 970 , a (top) positive portion 1020 corresponding to the number of social media content items with positive sentiment, and a (bottom) negative portion 1022 corresponding to the number of social media content items with negative sentiment.
- the positive 1020 and negative 1020 portionsare visually distinguished from each other, such that their relative percentages within the whole of the event bar is visible.
- FIGS. 11A-11Cshow three embodiments of user interfaces 1100 of a social interest estimation system showing a filtered view.
- the user interfaces 1100are similar to those shown in FIGS. 9A-9C , except that the social interest heat maps 940 , 970 provide information for only a filtered subset of the social media content items.
- FIG. 11Ashows a text-based filter “doritos” applied to the data such that social media content item bars corresponding to Doritos brand advertisements ( 1110 ) show up darker, or otherwise visually distinguished, from the non-Doritos brand social media content item bars ( 1115 ).
- FIG. 11Bshows a text-based filter applied to the data (not shown) such that only social media content item bars corresponding to the applied filter are visible in the overall social interest heat map 970 .
- FIG. 11Cshows a filter applied to the data corresponding to players in the user's fantasy football league, such that only social media content item bars corresponding to plays by the fantasy football players are shown in the social interest heat maps 950 .
- An additional players area 1120shows the players in the user's fantasy football league.
- FIG. 12Ashows one embodiment of user interface 1200 of a social interest estimation system showing a focused unexpanded view.
- the user interface 1200is similar to that of FIG. 10A , except that the social interest heat map 940 a has a subsection 1210 of the social interest heat map selected.
- FIG. 12Bshows a user interface 1250 similar to that of FIG. 12A , except that it shows a zoom view 1260 of the social interest heat map 940 a with the subsection 1210 from FIG. 12A expanded.
- mappings of time-based media events with social media content itemse.g., as stored in mapping store 275
- various metricscan be calculated and ratings created for the time-based media. Ratings based on the time-based media events then can be created and published based on individual metrics or combinations thereof.
- FIG. 14is a flow diagram illustrating one embodiment of a method for rating time-based media based on audience response via social media.
- the input to the processis the mappings that are the output of the social media/event alignment 330 process, which mappings are stored in the mapping store 275 .
- the stored mappingsare between time-based media events, which correspond to chronological time segments of the time-based media, and social media content items that have been determined to be associated with the time-based media event.
- one or more audience response metricsare generated by the audience response metrics engine 254 , which is calculated using the social media content items associated with the event. Additional inputs to the process are used depending on the types of metrics being generated, e.g., including input from the timing engine 253 , the consumption-based metrics engine 256 and store 293 , the time-based media cost engine 258 and store 295 , the social media author store 263 , and the social media content store 260 . Other inputs may be used according to other embodiments. A list of some of the metrics generated by the audience response metrics engine 254 according to one embodiment is described below.
- ARMsAudience Response Metrics
- a first class of ARMsis content item-based ARMs, or ciARMs, which are metrics that measure audience response by the number of individual content items associated with an event, either for the individual event or in relation to other events.
- a second class of ARMsis unique author-based ARMs, or UARMs, which are metrics that measure audience response by the number of unique authors of content items associated with an event, either for the individual event or in relation to other events.
- a third class of ARMsis network-based ARMs, or NARMs, which are metrics of audience response that take into account the network of connections between authors of content items associated with an event.
- Each of these classesalso can be broken down into ARMs that are reflective of values specific to individual events, and values that compare events.
- various filterscan be applied to the various ARMs, and ARMs can be combined with other ARMS, consumption based metrics (CBMs), and/or monetary values associated with time-based media events.
- CBMsconsumption based metrics
- Audience Response Counta weighting factor that is specific to a particular event, and includes Audience Response Count, Audience Response Rate, and some forms of Audience Response Acceleration.
- ARCAudience Response Count
- Thiscan be a raw count value, a log scale, or a value normalized against a selected set of events. For example, for a given NFL football game, there may be 18,000 social media content items aligned with that event.
- Audience Response Rateis the ARC for the time-based media event normalized by time.
- ARRcaptures the rate at which audience members are responding to the event through social media.
- An example calculationis the ratio of ARC to length of the event, e.g., [ARC/length]. Length can be in terms of minutes, e.g., to normalize ARCs for comparing events of different lengths (e.g., 30 minutes versus 60 minutes).
- Calculation of ARRmay include additional input from the timing engine 253 . Continuing the above example, if the football game lasted three hours (180 minutes) then the ARR over the entire length of the game would be 18,000/180, or 100 items per minute.
- ARAAudience Response Acceleration
- An example calculationis the ratio of change in ARR to change in time, e.g., [(ARR t2 ⁇ ARR t1 )/(t 2 ⁇ t 1 )], where ARR t1 is the ARR value at times t 1 and t 2 .
- Timecan be measured in various ways, including minutes, seconds, segments (not including commercials), scenes, etc.
- the above-noted ARR of 100 items per minuterepresents the average number of items per minute over the entire game.
- that ARRdoes not provide information about individual times within the event, during which times the ARC might be higher or lower than the average 100 items.
- ARAis calculated as (200-100)/50 min, or an acceleration of 2. Calculation of ARAs may include additional input from the timing engine 253 .
- Content item-based ARMs that compare eventsinclude Audience Response Share and some forms of Audience Response Acceleration, as well as direct comparisons between ARCs, ARRs, and ARAs for different events.
- ARSAudience Response Share
- time periodscan be any measurable period of interest, including programming time slots (8:00-8:30 p.m.; 8:00-9:00 p.m.), portions of a time slot or event (e.g., 8:00-8:10 p.m.), viewing segments (midday; primetime), entire day, week, season, etc.
- An example calculationis the ratio of the ARM for a given event i at given time t to the total of the ARMs for all other events k at that time, [ARM i,t /( ⁇ ARM k,t ))]. For example, if the ARC for a new television show at 8:00-9:00 pm is 10,000 and the total of all ARCs for that time period is 500,000, the ARS would be equal to 0.02, or 2% of the total ARC (2% of total response across all shows) for that time period. By contrast, if a very popular television show had an ARC of 100,000 for the same period, the ARS would be 0.2, or 20% of the total ARC (20% of response across all shows) for that time period.
- ARAis a measure of the rate of change between ARCs.
- Audience Response Trend(ART) is akin to an inter-event ARA, as it measures the rate of change between two different instances of a time-based media event (or different instances of a type of time-based media event) over the duration between the instances. Duration can be absolute time between events (minutes, hours) or relative (number of airings between events). For example, the ARC for the first episode of the season of a TV show could be compared to the ARC for the fifth episode, e.g. normalized by the number of weeks between shows or number of episodes in between.
- An example calculationis the ratio of change in ARC to duration for the change, e.g., (ARC t2 ⁇ ARC t1 )/(t 2 ⁇ t 1 ), where t 2 and t 1 are the times at which the ARCs are measured.
- ARTwould have a positive trend of 1,250 ARCs per week. Calculation of ARTs may include additional input from the timing engine 253 .
- ARC, ARR, ARA, and ART for individual eventscan be aggregated (e.g., summed, unweighted, or weighted) and/or directly compared to each other during a specified time period, e.g., a scheduled programming time slot, viewing segment, day, week, season, etc.
- a specified time periode.g., a scheduled programming time slot, viewing segment, day, week, season, etc.
- ARCs for all primetime shows during a given weekcould be aggregated into a ranked list, e.g., for ratings determinations.
- UARMSUnique Author Response Metrics
- UARMSare metrics that measure audience response by the number of unique authors of content items associated with an event.
- UARMS that are specific to an eventinclude Unique Author Response Count, Unique Author Response Rate, and Unique Author Response Acceleration.
- eachcan be broken down into UARMs that are reflective of values specific to individual events, and values that compare events.
- the calculationmay include additional input from the social media author store 263 .
- UARCUnique Author Response Count
- URRUnique Author Response Rate
- An example calculationis the ratio of UARM to length of the event, e.g., [UARC/length]. Length can be in terms of minutes, e.g., to normalize UARCs for comparing events of different lengths (e.g., 30 minutes versus 60 minutes). Calculation of UARR may include additional input from the timing engine 253 . Continuing the above example, for a three hour football game, there would be 2000 unique authors per hour.
- UARAUnique Author Response Acceleration
- UARMs that compare eventsinclude Unique Author Response Share and some forms of Unique Author Response Trend, as well as direct comparisons between UARCs, UARRs, and UARAs for different events.
- UARSUnique Author Response Share
- UARSis a measure of unique author response to a time-based media event during a time period normalized by the number of total unique authors responding to all time-based media events during the same time period. UARS captures what proportion of the unique authors during a given time period were interested in a specific media event, relative to other media events at that time.
- UARMs usedcan be UARC, UARR, etc. Time periods can be any measurable period of interest, including programming time, portions of a time slot or event, viewing segments, day, week, season, etc. An example calculation is the ratio of UARM at a given time to all UARMs at that time, e.g., [UARM(time t)/( ⁇ UARMs(time t))].
- the UARM for a show at 9 pmis 1,000, and the sum of all UARMs for all shows in that time slot is 150,000, then the UARS is less than a 1% share of all unique authors during that time slot, i.e., the show is not watched by a very broad audience.
- the time limitationscould be removed from the denominator (e.g., sum of all known UARMs across all times) to determine the UARS as a function of all known unique authors of all items to yield an Aggregated Unique Author Response Share (AUARS), indicating a percent response among the population of all unique authors. For example, if a show gets a response (UARM) of 500,000, and the total number of known unique authors is 5,000,000, the AUARS is 10% of all known unique authors.
- the unique author Audience Response Trendis a measure of the rate of change between UARCs for instances of an event (or instances of a type of time-based media event) over a duration between the instances. Duration can be absolute time (minutes, hours) or relative (number of airings in between). For example, the UARC for the first episode of the season of a TV show could be compared to the UARC for the last episode, e.g. normalized by the number of weeks between the first and last episodes or number of episodes between them. For example, a UARC for a first episode of 5,000 unique authors and a UARC for a second episode of 7,000 unique authors would produce a positive trend of 2,000 unique authors between episodes one and two.
- Calculation of UARTsmay include additional input from the timing engine 253 .
- UARC, UARR, UART, and UARA for individual eventscan be aggregated and/or directly compared to each other during a specified time period, e.g., a scheduled programming time slot, viewing segment, day, week, season, etc.
- UARCs for all primetime shows during a given weekcould be aggregated into a ranked list to show the UARCs relative to other primetime content.
- NARMsNetwork-based Author Response Metrics
- Resonancemeans the effect that a first responding author (in a network of responding authors) has on other responding authors in his/her network(s).
- the first author's responseitself may affect the overall audience response, e.g., responding viewers of the same event who did not respond prior to the first author's response, or viewers who increased their number of responses based on the first author's response, or connections of the first author who became viewers (i.e., turned on the show, watched it using a video on demand service, or otherwise time-shifted the program) based in part on the first author's response—each of these groups of authors may increase the overall counts based in part on the first author's response.
- NARMsafford insight into not only the quantity of response to an event, but also the amount of exposure (including an indication of virality) that that response garners.
- the NARM for an eventmay be computed as the cardinality of the set which is composed of the union of all sets of users in the networks of the authors of content items associated with that target event:
- N ⁇ ⁇ A ⁇ ⁇ R ⁇ ⁇ M ⁇ ( event )⁇ ⁇ c ⁇ content - items ⁇ ( event ) ⁇ ⁇ users_in ⁇ _network ⁇ ( author_of ⁇ ( c ) ) ⁇ ⁇
- This measurementallows for overlap, as several user authors may share connections with each other.
- the NARM for an eventmay be computed as the cardinality of the set which is composed of the intersection of all sets of users in the networks of authors of content items associated with the target event:
- N ⁇ ⁇ A ⁇ ⁇ R ⁇ ⁇ M ⁇ ( event )⁇ ⁇ c ⁇ content - items ⁇ ( event ) ⁇ ⁇ users_in ⁇ _network ⁇ ( author_of ⁇ ( c ) ) ⁇ ⁇
- This measurementeliminates overlap and redundancy based on a user falling into the network of more than one author by measuring unique users.
- NARMSthat are specific to an event include Network-based Author Response Count, Network-based Author Response Rate, Network-based Audience Response Trend, and Network-based Author Response Acceleration. As with the content item based and unique author ARMs, each can be broken down into NARMs that are reflective of values specific to individual events, and values that compare events. For NARMs, the calculation may include additional input from the social media author store 263 .
- NARCNetwork-based Author Response Count
- NARCis the cardinality of the set of combined users in the networks of the authors of content items associated with a target event. This can be a raw count or use a log scale. For example, given two events with the same number of unique authors, the NARC for one event still may be higher than the other if the authors responding to one event, on average, have larger social networks than the other event. For an event with 5,000 unique authors, the NARC may be 1,000,000 if the 5,000 authors have, on average, 200 connections in their respective networks. In this example, the NARC is a union type, and thus does not consider whether there is overlap between the authors in the networks. For a NARC that is an intersection type, for the same 5,000 unique authors, the NARC may be lower, e.g., 750,000 considering that the 200 (average) connections of the unique authors overlap with each other,
- NARRNetwork-based Author Response Rate
- NARCnormalized by time.
- An example calculationis the ratio of NARM to length of the event, e.g., [NARC/length].
- Lengthcan be in terms of minutes, e.g., to normalize NARCs for comparing events of different lengths (e.g., 30 minutes versus 60 minutes).
- the NARCabout (1,000,000) is divided by 60 minutes to produce a NARR of 16,667.
- Calculation of NARRmay include additional input from the timing engine 253 .
- NARANetwork-based Author Response Acceleration
- the NARAs for two equal-length shows for a first 10 minutes and last 10 minutes of the showsmay be identical, e.g., (200-100)/50 min, or two-fold acceleration of unique author response rate between the first 10 minutes and the last 10 minutes.
- the authors for the first showon average have larger networks (e.g., 250) than the authors for the second show (e.g., 150)
- the NARA for the first showe.g., (100 ⁇ 250)/50, or 500
- the second showe.g., 100 ⁇ 150)/50, or 300.
- Calculation of NARAsmay include additional input from the timing engine 253 .
- NARMs that compare eventsinclude Network-based Author Response Share and Network-based Author Response Trend, as well as direct comparisons between NARCs, NARRs, and NARAs for different events.
- NARSNetwork-based Author Response Share
- NARMs usedcan be NARC, NARR, etc.
- Time periodscan be any measurable period of interest, including programming time, portions of a time slot or event, viewing segments, day, week, season, etc.
- An example calculationis the ratio of an NARM at a give time to all NARMs at that time, e.g., [NARM t /( ⁇ NARMs t )].
- NARSNetwork-based Author Response Share
- NARTis a measure of the rate of change between NARCs for two instances of an event (or instances of a type of time-based media event) over the duration between the instances. Duration can be absolute time (minutes, hours) or relative (number of airings in between). For example, the NARC for the first episode of the season of a TV show could be compared to the NARC for the last episode, e.g. normalized by the number of weeks between the first and last episodes or number of episodes between them. For comparison between events of the same type, NARCs could be measured between the first and last commercial during a time slot, which might not be instances of the same event, but rather of events of the same type (e.g., commercials).
- NARCscould be compared relative to the time between the commercials, or the number of other commercials in between.
- An example calculationis the ratio of change in NARC to duration between NARCs, e.g., (NARC 2 ⁇ NARC 1 )/D(NARC 2 ⁇ NARC 1 ), where D represents duration.
- Calculation of NARAsmay include additional input from the timing engine 253 .
- NARC, NARR, NART, and NARA for individual eventscan be aggregated and/or directly compared to each other during a specified time period, e.g., a scheduled programming time slot, viewing segment, day, week, season, etc.
- a specified time periode.g., a scheduled programming time slot, viewing segment, day, week, season, etc.
- NARCs for all primetime shows during a given weekcould be aggregated into a ranked list.
- the audience response metrics engine 254also can apply various filters to any of the above ARMs to produce more specific measures. Filter types include event type, observation manner, audience demographics, author influence, response content, and response timing.
- a first filteris an event type filter.
- Event typescan be considered at various levels of granularity. For example, an event type might include all sporting events, or just football events, or just NFL events, or events for a specific team. Similarly, an event type might include all advertisements, or advertisements for a particular product, industry sector, company, brand, etc. Event type filters all regular ARMs such that they reflect numbers only for events within the filter parameters. In addition, an event type filter may be applied while simultaneously removing time restraints for the ARM. For example, allowing comparison of audience response to a time-based event against others at a similar level of granularity, across different time frames.
- a filtered UARScan then be computed by limiting the events used to compute the UARS to all situation comedies, and additionally can be expanded to include a time frame across the entire day.
- Application of an event type filtermay require additional information about the event type as stored in the mapping store 275 .
- the event type informationwas used during the mapping process (e.g., of FIG. 3 ), from information received from the event metadata store 273 .
- Audience response to a time-based media eventcan be partitioned based upon the way in which the members of the audience observed that event. For example, some portion of an audience responds to an event that they observe live (e.g., the first run of a television show). However, other portions of the audience can be said to respond to the same event, even though they observed it at different times (e.g., as a rerun of the first run broadcast).
- “on demand” viewing technologiesallow audiences to observe time-based media events in a growing number of ways; for example, on DVD, using time-shifting technologies like Tivo or digital video recorders, on the Internet through websites like Hulu.com or Netflix.com, on IPTV using devices such as Apple TV or Google TV, or through set-top box on demand services.
- Audience Response Metricscan be filtered based on the manner of observation to create more specific ARMs; for example, a time-shifted Audience Response Count measures the number of content items associated with an event that was viewed using time-shifting technologies.
- Application of manner of observation filtersmay require additional information about the content item as stored in the social media content store 260 , and the timing of the item, as stored in the timing engine 253 .
- audience response metrics engine 254can filter the data is by the responding audience demographics.
- Demographic filtersallow for measuring ARMs for a subset of audience members, e.g., by age, gender, income level, location, education level, ethnicity, etc. For example, applying a female author filter to UARC would produce the count of all female unique authors who responded to a given time-based media event.
- multiple demographic filtersmay be applied (e.g., men, age 18-25). Application of a demographic filter may require additional information about the authors as stored in the social media author store 263 .
- An Author Influence Scoreis a value assigned to an author based on his/her influence within mass media and/or social networks. The basis of the AIS may be the number of others the author is connected to in his/her social network(s), or any other measure of how influential an author may be within his/her network(s).
- a threshold AIScan be set as a filter for authors to include in the ARMs to determine the response to a time-based media event by more influential authors.
- Application of an author influence filtermay require additional information about the authors as stored in the social media author store 263 .
- ARMsalso can be filtered by the content of the responses according to various categories.
- categoriesinclude sentiment of the response (e.g., positive, negative, neutral), subjectivity of the response (e.g., primarily fact-based vs. opinion-based), independence of the response with respect to other content (e.g., with/without links or other content), etc.
- Response content filtersallow the ARMs to be separated out by these categories to further assess response. For example, the overall count of content items for a time-based media event might be high, which might appear to represent positive feedback for the event, but the numbers may represent mostly negative responses, resulting in a very different conclusion about the overall response.
- Application of a content filtermay require additional information about the content of the social media content items, as stored in the social media content store 260 .
- the process for using the additional information to apply a content filtermay be similar to the content weighting function 710 for the social interest estimation process, as described in conjunction with FIG. 7 .
- response timingexamples of which include filters for capturing response in anticipation of a time-based media event or lingering response for an event in the past. For example, in broadcast television much of the programming is scheduled ahead of air time, and thus information about the programming is available to the public ahead of many time-based media events. Thus, ARMs can be filtered based on responses determined to occur before (i.e., in anticipation of) an upcoming event.
- Application of a response timing filtermay include additional input from the timing engine 253 .
- the above-discussed ARMscan be combined by the audience response metrics engine 254 , with or without filtering, in many different useful ways for understanding audience engagement with time-based media events. Multiple ARMs can be combined, ARMs can be combined with Consumption Based Metrics (CBMs), and/or ARMs can be combined with other information about the time-based media, such as costs associated with various time-based media events, as well as information about the authors of content items associated with events.
- CBMsConsumption Based Metrics
- demographic and response content filtersfirst can be applied, combined with Unique Author Response Share (UARS) to provide a measure of positive response to an event normalized by the total count of positive female response to events within the same time period. Then the event could be compared to all other events within the time period (UARS), further filtered by event type. This could provide information about positive female response to an event, e.g., an advertisement for a particular clothing retailer, as compared to other ads for clothing retailers in a one-week period.
- UARSUnique Author Response Share
- ARAcould then be calculated between time 0, e.g., before any advertisement of the new season; time 1, e.g., after a first series of advertisements that the next season is coming; and time 2, e.g., after a preview is shown, to determine how each impacted the audience anticipation of the event.
- time 1e.g., before any advertisement of the new season
- time 2e.g., after a preview is shown
- These metricsthen could be compared to similar numbers for previous seasons to determine whether anticipation has gone up or down since the previous year, or compared to metrics for other television series with similar advertising schedules, as a measure of anticipated engagement with the series versus other series premieres.
- the number and distribution of audience responses over various times and among an author's networks during the time-based media eventcould be used to determine the virality of audience response to the event (e.g., highly viral response would be indicated by overall numbers that increase quickly and are high in number of unique authors responding, especially among authors connected in a network), the breadth of the audience responding to the event (e.g., if many content items are provided, but only by a small number of unique responders, which would indicate strong appeal to a narrower audience), or other measures of event popularity and engagement levels among the responding audience.
- the virality of audience response to the evente.g., highly viral response would be indicated by overall numbers that increase quickly and are high in number of unique authors responding, especially among authors connected in a network
- the breadth of the audience responding to the evente.g., if many content items are provided, but only by a small number of unique responders, which would indicate strong appeal to a narrower audience
- other measures of event popularity and engagement levels among the responding audiencee.g.,
- Measures of various ARMscan be combined by the audience response metrics engine 254 with Consumption Based Metrics (CBMs), which are measures of audience consumption, to estimate the number of viewers who respond to an event and estimate response percentages.
- CBMsConsumption Based Metrics
- an ARM for an eventcan be divided by an estimated audience size that viewed the event (based on a CRM) to provide a metric of Audience Response per, e.g., 100,000 viewers.
- ARMscan be normalized by the percentage of total viewing audience that an event receives to provide a metric of Audience Response per percentage point of total audience size (for a specific time period).
- ARMscan be divided by the potential size of a viewing audience (as estimated, for example, by the total number of homes with televisions in the US) to provide a metric of Audience Response as a share of all possible viewers of an event.
- Calculation of metrics combining ARMs and CBMsmay include additional input from the consumption-based metrics engine 256 and/or consumption-based metrics store 293 .
- ARMs and CBMscan be used by the audience response metrics engine 254 , in conjunction with monetary values associated with an event, to estimate value via a monetary value metric.
- a monetary valuecost
- a monetary valuecost
- an ARM for that showcan be divided by the cost of advertising during that show, in order to generate a normalized measure of the engagement per dollar value for the show.
- the ARM for the advertisement itselfcan be measured against the cost; thus, generating another measure of engagement per dollar value for that advertisement.
- ARMscan be normalized by the costs associated with an event itself.
- the ARM for a television showcan be normalized by the cost of producing the show.
- Monetary value metricsmay include additional input from the time-based media cost engine 258 and/or advertising cost store 295 .
- ARMscan be combined with information about content items associated with time-based media events to create weighted ARMs.
- ARMscan be weighted by measures of the influence of each author of a content item.
- Such a weighted ARMprovides a measure in which higher values are associated with response that comes from more influential authors.
- Application of an author influence weightingmay require additional information about the authors as stored in the social media author store 263 , and may proceed according to the weighting function 710 described in conjunction with FIG. 7 .
- the various audience response metrics generated by the audience response metrics engine 254are stored in the audience response store 291 .
- the stored metricslater may be used by the ARM engine 254 for calculations of additional metrics, or used by the ratings engine 259 for ratings determinations.
- the metrics and/or the ratings themselvesmay be used in various ways, e.g., future content considerations, planning, advertising scheduling, etc.
- the above metricscan be used in a variety of different ways to determine desired statistics.
- a processincluding selection of one or more ARMs and optional applications of one or more filters, e.g., by ARM engine 254 , optional normalization by various means such as time, a larger subset of time-based media, etc. (e.g., using timing information from timing engine 253 ), and/or additional consideration of one or more secondary measures such as combining with other ARMs or CBMs (e.g., using CRM store 293 ).
- a basic methodmight include the steps of storing mappings between each time-based media event and social media content items associated with the time-based media event, selecting one of the time-based media events, calculating an audience response metric for the selected event (including application of filters, application of various additional data from other data stores, combination with another ARM or a CBM, determination of costs, etc.), and, if desired, providing a rating for the time-based media event.
- a filteris applied by the ARM engine for authors over 50 years of age (e.g., using data from the social media author store 263 ), bringing the unique author count to 2,500. That value may then be normalized by the ARM engine 254 by the response by all over-50 unique authors to all commercials at 6 pm (e.g., 10,000), for example using data from the timing engine 253 , to produce a UARS of 25% for this group.
- UARCevent
- the UARSthen could be compared by the ARM engine 254 to a CBM from the CBM store 293 indicating the number of viewers at 6 pm who are over age 50 viewing the channel the commercial was on (e.g., 100,000) and overall (e.g., 1,000,000), to produce results indicating that of all viewers over age 50 who likely saw the commercial, 2.5% responded to the commercial.
- This percentagecould be compared by the ARM engine 254 to 1% of that population responding to all commercials in the same time slot, indicating a stronger than average response to the commercial.
- ratingscould be determined for the commercial by the ratings engine 259 .
- Ratingsas described elsewhere herein, which can be based on any of the metrics described herein or combinations thereof, can be created and published by the ratings engine 259 .
- a ratingis specific to a particular time-based media, so that given a set of time-based media events, and their respective ratings, the events can be ranked accordingly. From the ranked events, additional information can be derived, such as monetary evaluations of the events.
- the metrics and/or rankingscan be used for determinations of content creation, media planning, and/or media buying.
- ARCs for all primetime shows during a given weekcould be aggregated as a total response rating, indicating the broadcast media events during a defined time period with the highest number of responsive individual content items via social media.
- ARCscould be calculated individually for every show in primetime. The respective ARCs then could be ordered largest to smallest to show this ranking, with the highest ARCs having the highest ranking.
- the ratio of the UARC (i.e., unique viewers responding) to a CBM for the showcould be aggregated for all of the shows and ordered to provide ratings indicating the broadcast media events during the time period with the greatest percentage of viewers responding via social media.
- these examplesshow how application and aggregation of various metrics can produce various ratings, e.g., ratings based on total response, total responsive authors, and percentage of viewers responding. Many other variations of ratings can be determined using the calculated metrics.
- ratingsare determined by the ratings engine 259 , they are stored in the ratings store 297 . Ratings from different times may be compared based on the stored information. The ratings may be published in some embodiments, e.g., by the social interest information provider 130 or a third party.
- the social interest information provider 130can expose an API 202 as described in conjunction with FIG. 2 to provide the ratings information to advertisers, broadcasters, and other third parties as a service.
- the third partycould input keyword(s) and get back ratings information associated with the keyword. Keywords could include the name of a show, a product, a particular episode, etc.
- the APIcould allow the third party to specify the type(s) of rating information desired, view pricing structures for the ratings data, set time when to provide the ratings data, how often to provide an update to the ratings data, etc.
- a software moduleis implemented with a computer program product comprising computer program code stored on a non-transitory, tangible computer readable storage medium, which is configured to be executed by a computer system for performing any or all of the steps, operations, or processes described.
- a computer systemis understood to include one or more computers, each computer including one or more hardware-based processors, primary memory devices (e.g., RAM, ROM), secondary storage devices (e.g., hard discs or solid state memory), and networking devices (e.g., networking interface cards).
- the computers in a computer systemcan be interconnected by wired medium (e.g. Ethernet, fiber optic), or wireless medium (e.g., radio-based networks, such as 802.11, 802.16), or combination thereof.
- Embodiments of the inventionmay also relate to an apparatus for performing the operations herein.
- This apparatusmay be specially constructed for the required purposes, and/or it may comprise a general-purpose computing device selectively activated or reconfigured by a computer program stored in the computer.
- Embodiments of the inventionmay also relate to a product that is produced by a computing process described herein.
- a productmay comprise information resulting from a computing process, where the information is stored on a non-transitory, tangible computer readable storage medium and may include any embodiment of a computer program product or other data combination described herein.
Landscapes
- Engineering & Computer Science (AREA)
- Business, Economics & Management (AREA)
- Strategic Management (AREA)
- Accounting & Taxation (AREA)
- Finance (AREA)
- Development Economics (AREA)
- Theoretical Computer Science (AREA)
- General Business, Economics & Management (AREA)
- Entrepreneurship & Innovation (AREA)
- General Physics & Mathematics (AREA)
- Economics (AREA)
- Marketing (AREA)
- Physics & Mathematics (AREA)
- Multimedia (AREA)
- Signal Processing (AREA)
- Computing Systems (AREA)
- Game Theory and Decision Science (AREA)
- Databases & Information Systems (AREA)
- Data Mining & Analysis (AREA)
- Health & Medical Sciences (AREA)
- General Health & Medical Sciences (AREA)
- Human Resources & Organizations (AREA)
- Primary Health Care (AREA)
- Tourism & Hospitality (AREA)
- Information Transfer Between Computers (AREA)
- Information Retrieval, Db Structures And Fs Structures Therefor (AREA)
- Two-Way Televisions, Distribution Of Moving Picture Or The Like (AREA)
Abstract
Description
The grounded language model is used to calculate the probability that each video event found is associated with each human generated metadata annotation.
align(feat(x,y))=[α·content(feat(x,y))]+[β·geoTemp(feat(x,y))]+[γ·author(feat(x,y))]
This measurement allows for overlap, as several user authors may share connections with each other.
This measurement eliminates overlap and redundancy based on a user falling into the network of more than one author by measuring unique users.
Claims (34)
Priority Applications (5)
| Application Number | Priority Date | Filing Date | Title |
|---|---|---|---|
| US13/030,940US8543454B2 (en) | 2011-02-18 | 2011-02-18 | Generating audience response metrics and ratings from social interest in time-based media |
| PCT/US2011/025757WO2012112166A1 (en) | 2011-02-18 | 2011-02-22 | Generating audience respones metrics and ratings from social interest in time-based media |
| US13/975,527US9092829B2 (en) | 2011-02-18 | 2013-08-26 | Generating audience response metrics and ratings from social interest in time-based media |
| US14/795,863US9563901B2 (en) | 2011-02-18 | 2015-07-09 | Generating audience response metrics and ratings from social interest in time-based media |
| US15/420,955US11574321B2 (en) | 2011-02-18 | 2017-01-31 | Generating audience response metrics and ratings from social interest in time-based media |
Applications Claiming Priority (1)
| Application Number | Priority Date | Filing Date | Title |
|---|---|---|---|
| US13/030,940US8543454B2 (en) | 2011-02-18 | 2011-02-18 | Generating audience response metrics and ratings from social interest in time-based media |
Related Child Applications (1)
| Application Number | Title | Priority Date | Filing Date |
|---|---|---|---|
| US13/975,527ContinuationUS9092829B2 (en) | 2011-02-18 | 2013-08-26 | Generating audience response metrics and ratings from social interest in time-based media |
Publications (2)
| Publication Number | Publication Date |
|---|---|
| US20120215903A1 US20120215903A1 (en) | 2012-08-23 |
| US8543454B2true US8543454B2 (en) | 2013-09-24 |
Family
ID=46653679
Family Applications (4)
| Application Number | Title | Priority Date | Filing Date |
|---|---|---|---|
| US13/030,940Active2031-11-25US8543454B2 (en) | 2011-02-18 | 2011-02-18 | Generating audience response metrics and ratings from social interest in time-based media |
| US13/975,527ActiveUS9092829B2 (en) | 2011-02-18 | 2013-08-26 | Generating audience response metrics and ratings from social interest in time-based media |
| US14/795,863Expired - Fee RelatedUS9563901B2 (en) | 2011-02-18 | 2015-07-09 | Generating audience response metrics and ratings from social interest in time-based media |
| US15/420,955Active2032-08-06US11574321B2 (en) | 2011-02-18 | 2017-01-31 | Generating audience response metrics and ratings from social interest in time-based media |
Family Applications After (3)
| Application Number | Title | Priority Date | Filing Date |
|---|---|---|---|
| US13/975,527ActiveUS9092829B2 (en) | 2011-02-18 | 2013-08-26 | Generating audience response metrics and ratings from social interest in time-based media |
| US14/795,863Expired - Fee RelatedUS9563901B2 (en) | 2011-02-18 | 2015-07-09 | Generating audience response metrics and ratings from social interest in time-based media |
| US15/420,955Active2032-08-06US11574321B2 (en) | 2011-02-18 | 2017-01-31 | Generating audience response metrics and ratings from social interest in time-based media |
Country Status (2)
| Country | Link |
|---|---|
| US (4) | US8543454B2 (en) |
| WO (1) | WO2012112166A1 (en) |
Cited By (69)
| Publication number | Priority date | Publication date | Assignee | Title |
|---|---|---|---|---|
| US20130018896A1 (en)* | 2011-07-13 | 2013-01-17 | Bluefin Labs, Inc. | Topic and Time Based Media Affinity Estimation |
| US20130046826A1 (en)* | 2011-07-29 | 2013-02-21 | Rb.tv., Inc. | Devices, Systems, and Methods for Aggregating, Controlling, Enhancing, Archiving, and Analyzing Social Media for Events |
| US20130054591A1 (en)* | 2011-03-03 | 2013-02-28 | Brightedge Technologies, Inc. | Search engine optimization recommendations based on social signals |
| US20130159853A1 (en)* | 2011-12-20 | 2013-06-20 | Guy A. Story, Jr. | Managing playback of supplemental information |
| US20130181993A1 (en)* | 2012-01-13 | 2013-07-18 | Fiona Elizabeth HERRING | Place heat geometries |
| US20130254280A1 (en)* | 2012-03-22 | 2013-09-26 | Microsoft Corporation | Identifying influential users of a social networking service |
| US20130263166A1 (en)* | 2012-03-27 | 2013-10-03 | Bluefin Labs, Inc. | Social Networking System Targeted Message Synchronization |
| US20140172877A1 (en)* | 2012-12-14 | 2014-06-19 | Dan Yigal Rubinstein | Boosting ranks of stories by a needy user on a social networking system |
| US20140172875A1 (en)* | 2012-12-14 | 2014-06-19 | Facebook, Inc. | Arranging stories on newsfeeds based on expected value scoring on a social networking system |
| US20140324895A1 (en)* | 2013-03-01 | 2014-10-30 | GoPop.TV, Inc. | System and method for creating and maintaining a database of annotations corresponding to portions of a content item |
| US20150088878A1 (en)* | 2013-09-23 | 2015-03-26 | Google Inc. | Discovering New Media Items for a User |
| US9092797B2 (en) | 2010-09-22 | 2015-07-28 | The Nielsen Company (Us), Llc | Methods and apparatus to analyze and adjust demographic information |
| US9210313B1 (en) | 2009-02-17 | 2015-12-08 | Ikorongo Technology, LLC | Display device content selection through viewer identification and affinity prediction |
| JP2015535353A (en)* | 2013-04-30 | 2015-12-10 | ザ ニールセン カンパニー (ユーエス) エルエルシー | Method and apparatus for determining audience rating information for online media display |
| US9215288B2 (en) | 2012-06-11 | 2015-12-15 | The Nielsen Company (Us), Llc | Methods and apparatus to share online media impressions data |
| US9218612B2 (en) | 2010-09-22 | 2015-12-22 | The Nielsen Company (Us), Llc | Methods and apparatus to determine impressions using distributed demographic information |
| US9237138B2 (en) | 2013-12-31 | 2016-01-12 | The Nielsen Company (Us), Llc | Methods and apparatus to collect distributed user information for media impressions and search terms |
| US9286619B2 (en) | 2010-12-27 | 2016-03-15 | Microsoft Technology Licensing, Llc | System and method for generating social summaries |
| US9294576B2 (en) | 2013-01-02 | 2016-03-22 | Microsoft Technology Licensing, Llc | Social media impact assessment |
| US20160092935A1 (en)* | 2014-09-26 | 2016-03-31 | Comcast Cable Communications, Llc | Advertisements blended with user's digital content |
| US20160100221A1 (en)* | 2014-10-06 | 2016-04-07 | StreamRail Ltd. | System and method for preventing abandonment of web-based video content |
| US9313294B2 (en) | 2013-08-12 | 2016-04-12 | The Nielsen Company (Us), Llc | Methods and apparatus to de-duplicate impression information |
| US9324112B2 (en) | 2010-11-09 | 2016-04-26 | Microsoft Technology Licensing, Llc | Ranking authors in social media systems |
| US9332035B2 (en) | 2013-10-10 | 2016-05-03 | The Nielsen Company (Us), Llc | Methods and apparatus to measure exposure to streaming media |
| US9355138B2 (en) | 2010-06-30 | 2016-05-31 | The Nielsen Company (Us), Llc | Methods and apparatus to obtain anonymous audience measurement data from network server data for particular demographic and usage profiles |
| US9386111B2 (en) | 2011-12-16 | 2016-07-05 | The Nielsen Company (Us), Llc | Monitoring media exposure using wireless communications |
| US9596150B2 (en) | 2010-12-20 | 2017-03-14 | The Nielsen Company (Us), Llc | Methods and apparatus to determine media impressions using distributed demographic information |
| US20170150217A1 (en)* | 2011-04-01 | 2017-05-25 | The Nielsen Company (Us), Llc | Methods, apparatus and articles of manufacture to estimate local market audiences of media content |
| US9679057B1 (en) | 2010-09-01 | 2017-06-13 | Ikorongo Technology, LLC | Apparatus for sharing image content based on matching |
| US9736503B1 (en)* | 2014-09-12 | 2017-08-15 | Google Inc. | Optimizing timing of display of a mid-roll video advertisement based on viewer retention data |
| US9743141B2 (en) | 2015-06-12 | 2017-08-22 | The Nielsen Company (Us), Llc | Methods and apparatus to determine viewing condition probabilities |
| US9838754B2 (en) | 2015-09-01 | 2017-12-05 | The Nielsen Company (Us), Llc | On-site measurement of over the top media |
| US9852163B2 (en) | 2013-12-30 | 2017-12-26 | The Nielsen Company (Us), Llc | Methods and apparatus to de-duplicate impression information |
| US9912482B2 (en) | 2012-08-30 | 2018-03-06 | The Nielsen Company (Us), Llc | Methods and apparatus to collect distributed user information for media impressions and search terms |
| US9967211B2 (en) | 2015-05-31 | 2018-05-08 | Microsoft Technology Licensing, Llc | Metric for automatic assessment of conversational responses |
| US10007679B2 (en) | 2008-08-08 | 2018-06-26 | The Research Foundation For The State University Of New York | Enhanced max margin learning on multimodal data mining in a multimedia database |
| US10045082B2 (en) | 2015-07-02 | 2018-08-07 | The Nielsen Company (Us), Llc | Methods and apparatus to correct errors in audience measurements for media accessed using over-the-top devices |
| US10068246B2 (en) | 2013-07-12 | 2018-09-04 | The Nielsen Company (Us), Llc | Methods and apparatus to collect distributed user information for media impressions |
| US10147114B2 (en) | 2014-01-06 | 2018-12-04 | The Nielsen Company (Us), Llc | Methods and apparatus to correct audience measurement data |
| US10205994B2 (en) | 2015-12-17 | 2019-02-12 | The Nielsen Company (Us), Llc | Methods and apparatus to collect distributed user information for media impressions |
| US10210459B2 (en) | 2016-06-29 | 2019-02-19 | The Nielsen Company (Us), Llc | Methods and apparatus to determine a conditional probability based on audience member probability distributions for media audience measurement |
| US10243753B2 (en) | 2013-12-19 | 2019-03-26 | Ikorongo Technology, LLC | Methods for sharing images captured at an event |
| US10270673B1 (en) | 2016-01-27 | 2019-04-23 | The Nielsen Company (Us), Llc | Methods and apparatus for estimating total unique audiences |
| US10311464B2 (en) | 2014-07-17 | 2019-06-04 | The Nielsen Company (Us), Llc | Methods and apparatus to determine impressions corresponding to market segments |
| US10331785B2 (en)* | 2012-02-17 | 2019-06-25 | Tivo Solutions Inc. | Identifying multimedia asset similarity using blended semantic and latent feature analysis |
| US10380633B2 (en) | 2015-07-02 | 2019-08-13 | The Nielsen Company (Us), Llc | Methods and apparatus to generate corrected online audience measurement data |
| US10387487B1 (en) | 2018-01-25 | 2019-08-20 | Ikorongo Technology, LLC | Determining images of interest based on a geographical location |
| US10440402B2 (en) | 2011-01-26 | 2019-10-08 | Afterlive.tv Inc | Method and system for generating highlights from scored data streams |
| USD870756S1 (en) | 2019-02-15 | 2019-12-24 | Recentive Analytics | Display screen with an animated graphical user interface |
| US10638206B1 (en) | 2019-01-28 | 2020-04-28 | International Business Machines Corporation | Video annotation based on social media trends |
| US10652127B2 (en) | 2014-10-03 | 2020-05-12 | The Nielsen Company (Us), Llc | Fusing online media monitoring data with secondary online data feeds to generate ratings data for online media exposure |
| US10706601B2 (en) | 2009-02-17 | 2020-07-07 | Ikorongo Technology, LLC | Interface for receiving subject affinity information |
| US10776415B2 (en)* | 2018-03-14 | 2020-09-15 | Fuji Xerox Co., Ltd. | System and method for visualizing and recommending media content based on sequential context |
| US10803475B2 (en) | 2014-03-13 | 2020-10-13 | The Nielsen Company (Us), Llc | Methods and apparatus to compensate for server-generated errors in database proprietor impression data due to misattribution and/or non-coverage |
| US10880465B1 (en) | 2017-09-21 | 2020-12-29 | IkorongoTechnology, LLC | Determining capture instructions for drone photography based on information received from a social network |
| US10956947B2 (en) | 2013-12-23 | 2021-03-23 | The Nielsen Company (Us), Llc | Methods and apparatus to measure media using media object characteristics |
| US10963907B2 (en) | 2014-01-06 | 2021-03-30 | The Nielsen Company (Us), Llc | Methods and apparatus to correct misattributions of media impressions |
| US11012719B2 (en)* | 2016-03-08 | 2021-05-18 | DISH Technologies L.L.C. | Apparatus, systems and methods for control of sporting event presentation based on viewer engagement |
| US11128675B2 (en) | 2017-03-20 | 2021-09-21 | At&T Intellectual Property I, L.P. | Automatic ad-hoc multimedia conference generator |
| US11205103B2 (en) | 2016-12-09 | 2021-12-21 | The Research Foundation for the State University | Semisupervised autoencoder for sentiment analysis |
| US11228544B2 (en) | 2020-01-09 | 2022-01-18 | International Business Machines Corporation | Adapting communications according to audience profile from social media |
| US11328026B2 (en) | 2018-06-13 | 2022-05-10 | The Globe and Mall Inc. | Multi-source data analytics system, data manager and related methods |
| US11562394B2 (en) | 2014-08-29 | 2023-01-24 | The Nielsen Company (Us), Llc | Methods and apparatus to associate transactions with media impressions |
| US11574321B2 (en) | 2011-02-18 | 2023-02-07 | Bluefin Labs, Inc. | Generating audience response metrics and ratings from social interest in time-based media |
| US11588778B2 (en)* | 2012-03-30 | 2023-02-21 | Fox Sports Productions, Llc | System and method for enhanced second screen experience |
| US11869024B2 (en) | 2010-09-22 | 2024-01-09 | The Nielsen Company (Us), Llc | Methods and apparatus to analyze and adjust demographic information |
| US11983730B2 (en) | 2014-12-31 | 2024-05-14 | The Nielsen Company (Us), Llc | Methods and apparatus to correct for deterioration of a demographic model to associate demographic information with media impression information |
| US12335565B2 (en) | 2010-09-21 | 2025-06-17 | The Nielsen Company (Us), Llc | Methods, apparatus, and systems to collect audience measurement data |
| US12363381B2 (en) | 2021-09-14 | 2025-07-15 | The Nielsen Company (Us), Llc | Methods and apparatus to determine audience size based on big data |
Families Citing this family (154)
| Publication number | Priority date | Publication date | Assignee | Title |
|---|---|---|---|---|
| US10430491B1 (en) | 2008-05-30 | 2019-10-01 | On24, Inc. | System and method for communication between rich internet applications |
| US9215423B2 (en) | 2009-03-30 | 2015-12-15 | Time Warner Cable Enterprises Llc | Recommendation engine apparatus and methods |
| US11076189B2 (en) | 2009-03-30 | 2021-07-27 | Time Warner Cable Enterprises Llc | Personal media channel apparatus and methods |
| US11113299B2 (en) | 2009-12-01 | 2021-09-07 | Apple Inc. | System and method for metadata transfer among search entities |
| US8706812B2 (en) | 2010-04-07 | 2014-04-22 | On24, Inc. | Communication console with component aggregation |
| US11438410B2 (en) | 2010-04-07 | 2022-09-06 | On24, Inc. | Communication console with component aggregation |
| IL207176A0 (en)* | 2010-07-25 | 2011-04-28 | Verint Systems Ltd | System and method for video - assisted identification of mobile phone users |
| US8732219B1 (en)* | 2010-08-25 | 2014-05-20 | United Services Automobile Association (Usaa) | Method and system for determining correlated geographic areas |
| US20120215708A1 (en)* | 2011-02-17 | 2012-08-23 | Polk Jon | Social community revolving around new music |
| JP5691735B2 (en)* | 2011-03-29 | 2015-04-01 | ソニー株式会社 | CONTENT RECOMMENDATION DEVICE, RECOMMENDED CONTENT SEARCH METHOD, AND PROGRAM |
| US10474752B2 (en)* | 2011-04-07 | 2019-11-12 | Infosys Technologies, Ltd. | System and method for slang sentiment classification for opinion mining |
| US9652810B2 (en)* | 2011-06-24 | 2017-05-16 | Facebook, Inc. | Dynamic chat box |
| US20230153347A1 (en)* | 2011-07-05 | 2023-05-18 | Michael Stewart Shunock | System and method for annotating images |
| US20130019187A1 (en)* | 2011-07-15 | 2013-01-17 | International Business Machines Corporation | Visualizing emotions and mood in a collaborative social networking environment |
| US8719277B2 (en) | 2011-08-08 | 2014-05-06 | Google Inc. | Sentimental information associated with an object within a media |
| US10296159B2 (en) | 2011-09-21 | 2019-05-21 | Facebook, Inc. | Displaying dynamic user interface elements in a social networking system |
| US8726142B2 (en) | 2011-09-21 | 2014-05-13 | Facebook, Inc. | Selecting social networking system user information for display via a timeline interface |
| US9946430B2 (en)* | 2011-09-21 | 2018-04-17 | Facebook, Inc. | Displaying social networking system user information via a timeline interface |
| US9026592B1 (en) | 2011-10-07 | 2015-05-05 | Google Inc. | Promoting user interaction based on user activity in social networking services |
| US9189797B2 (en)* | 2011-10-26 | 2015-11-17 | Apple Inc. | Systems and methods for sentiment detection, measurement, and normalization over social networks |
| JPWO2013061497A1 (en)* | 2011-10-27 | 2015-04-02 | 株式会社シナジードライブ | Content evaluation and playback system |
| KR101850719B1 (en)* | 2011-12-28 | 2018-04-20 | 엘지전자 주식회사 | Service system and method of providing a service in a digital receiver thereof |
| US9183259B1 (en) | 2012-01-13 | 2015-11-10 | Google Inc. | Selecting content based on social significance |
| US8843491B1 (en) | 2012-01-24 | 2014-09-23 | Google Inc. | Ranking and ordering items in stream |
| US8776116B2 (en)* | 2012-01-31 | 2014-07-08 | The Nielsen Company (Us) Llc | Systems, methods, apparatus, and articles of manufacture to identify times at which live media events are distributed |
| US9177065B1 (en) | 2012-02-09 | 2015-11-03 | Google Inc. | Quality score for posts in social networking services |
| US20130222418A1 (en)* | 2012-02-24 | 2013-08-29 | Ihigh.Com, Inc. | Providing a Graphic for Video Production |
| US8973023B1 (en)* | 2012-02-29 | 2015-03-03 | The Nielsen Company (Us), Llc | Methods and apparatus to determine audience duplication in cross-media campaigns |
| US9467723B2 (en) | 2012-04-04 | 2016-10-11 | Time Warner Cable Enterprises Llc | Apparatus and methods for automated highlight reel creation in a content delivery network |
| US20130283143A1 (en)* | 2012-04-24 | 2013-10-24 | Eric David Petajan | System for Annotating Media Content for Automatic Content Understanding |
| US10304036B2 (en) | 2012-05-07 | 2019-05-28 | Nasdaq, Inc. | Social media profiling for one or more authors using one or more social media platforms |
| US10692045B2 (en)* | 2012-05-31 | 2020-06-23 | International Business Machines Corporation | Intelligent attention management for unified messaging |
| US8949240B2 (en)* | 2012-07-03 | 2015-02-03 | General Instrument Corporation | System for correlating metadata |
| US20140046861A1 (en)* | 2012-08-10 | 2014-02-13 | James E. Dodson | Method and System for Representing Collective and Individual Responses to a Shared Experience Event |
| US9454519B1 (en)* | 2012-08-15 | 2016-09-27 | Google Inc. | Promotion and demotion of posts in social networking services |
| US9224130B2 (en) | 2012-08-23 | 2015-12-29 | Oracle International Corporation | Talent profile infographic |
| US9959548B2 (en)* | 2012-08-31 | 2018-05-01 | Sprinklr, Inc. | Method and system for generating social signal vocabularies |
| GB2505535B (en)* | 2012-09-03 | 2015-06-10 | Nds Ltd | Method and apparatus for selection of advertisements to fill a commercial break of an unknown duration |
| US9691128B2 (en) | 2012-09-20 | 2017-06-27 | Facebook, Inc. | Aggregating and displaying social networking system user information via a map interface |
| US9104667B2 (en)* | 2012-09-24 | 2015-08-11 | International Business Machines Corporation | Social media event detection and content-based retrieval |
| US8612281B1 (en)* | 2012-10-27 | 2013-12-17 | Lions Gate Entertainment Inc. | System and method for producing and distributing audio-visual content |
| US20140149501A1 (en)* | 2012-11-27 | 2014-05-29 | Wayne Kao | Efficient Navigation Through Social Networking Content |
| US10841352B2 (en)* | 2012-11-27 | 2020-11-17 | International Business Machines Corporation | Non-chronological buffering of segments of a media file |
| US20140172499A1 (en)* | 2012-12-17 | 2014-06-19 | United Video Properties, Inc. | Systems and methods providing content ratings based on environmental factors |
| US9609386B2 (en)* | 2012-12-18 | 2017-03-28 | Rentak Corporation | System and methods for analyzing content engagement in conjunction with social media |
| US20140186009A1 (en)* | 2012-12-31 | 2014-07-03 | International Business Machines Corporation | Streaming media buffer points reflecting user behavior and interests |
| US20140195518A1 (en)* | 2013-01-04 | 2014-07-10 | Opera Solutions, Llc | System and Method for Data Mining Using Domain-Level Context |
| US10235683B2 (en) | 2014-07-18 | 2019-03-19 | PlaceIQ, Inc. | Analyzing mobile-device location histories to characterize consumer behavior |
| US20140195296A1 (en)* | 2013-01-04 | 2014-07-10 | Fmr Llc | Method and system for predicting viral adverts to affect investment strategies |
| WO2014117325A1 (en)* | 2013-01-29 | 2014-08-07 | Nokia Corporation | Method and apparatus for providing segment-based recommendations |
| US9491038B2 (en)* | 2013-02-21 | 2016-11-08 | Microsoft Technology Licensing, Llc | Content virality determination and visualization |
| US20140282143A1 (en)* | 2013-03-14 | 2014-09-18 | Michael Matas | Modifying Content of Components in a User Interface |
| US9154838B2 (en)* | 2013-03-14 | 2015-10-06 | Universal Electronics Inc. | System and method for identifying social media influencers |
| US11308503B2 (en)* | 2013-03-15 | 2022-04-19 | Tunein, Inc. | System and method for providing crowd sourced metrics for network content broadcasters |
| US9191422B2 (en)* | 2013-03-15 | 2015-11-17 | Arris Technology, Inc. | Processing of social media for selected time-shifted multimedia content |
| US20140279619A1 (en)* | 2013-03-15 | 2014-09-18 | Cbs Interactive, Inc. | Talent portal with media rating |
| US20140289158A1 (en)* | 2013-03-20 | 2014-09-25 | Adobe Systems Inc. | Method and apparatus for rating a multi-version product |
| US9699502B1 (en) | 2015-01-16 | 2017-07-04 | Optimized Markets, Inc. | Automated allocation of media campaign assets to time and program in digital media delivery systems |
| US11102545B2 (en) | 2013-03-27 | 2021-08-24 | Optimized Markets, Inc. | Digital media campaign management in digital media delivery systems |
| US9210119B2 (en)* | 2013-03-29 | 2015-12-08 | Garret J. LoPorto | Automated triggering of a broadcast |
| US9159031B2 (en) | 2013-04-30 | 2015-10-13 | Microsoft Technology Licensing, Llc | Predicting audience response for scripting |
| US9553922B1 (en)* | 2013-05-02 | 2017-01-24 | Twitter, Inc. | Media event based social networking interfaces |
| US20140337254A1 (en)* | 2013-05-07 | 2014-11-13 | International Business Machines Corporation | Recommending actions for social media engagements |
| US11275748B2 (en)* | 2013-06-03 | 2022-03-15 | Ent. Services Development Corporation Lp | Influence score of a social media domain |
| US10614074B1 (en) | 2013-07-02 | 2020-04-07 | Tomorrowish Llc | Scoring social media content |
| JP6044959B2 (en)* | 2013-07-31 | 2016-12-14 | インターナショナル・ビジネス・マシーンズ・コーポレーションInternational Business Machines Corporation | Apparatus and method for supporting investigation |
| JP7084691B2 (en)* | 2013-08-09 | 2022-06-15 | ヤン,シャオフェン | How to process and present real-time social data on a map |
| US10430420B2 (en) | 2013-08-16 | 2019-10-01 | International Business Machines Corporation | Weighting sentiment information |
| US20150088635A1 (en)* | 2013-09-23 | 2015-03-26 | Umbel Corporation | Systems and methods of measurement and modification of advertisements and content |
| US11429781B1 (en) | 2013-10-22 | 2022-08-30 | On24, Inc. | System and method of annotating presentation timeline with questions, comments and notes using simple user inputs in mobile devices |
| US9471687B2 (en) | 2013-10-23 | 2016-10-18 | International Business Machines Corporation | Optimize follower and search relevancy ratio |
| US20170214752A1 (en)* | 2013-12-16 | 2017-07-27 | Co Everywhere, Inc. | Systems and methods for providing geographically delineated content author information |
| US9471671B1 (en)* | 2013-12-18 | 2016-10-18 | Google Inc. | Identifying and/or recommending relevant media content |
| US20150172145A1 (en)* | 2013-12-18 | 2015-06-18 | Avaya, Inc. | Impact prediction of social media interaction |
| WO2015160415A2 (en)* | 2014-01-31 | 2015-10-22 | The Trustees Of Columbia University In The City Of New York | Systems and methods for visual sentiment analysis |
| WO2015116185A1 (en)* | 2014-01-31 | 2015-08-06 | Hewlett-Packard Development Company, L.P. | Pixel-based visualization of event metric fluctuation |
| US9727582B2 (en)* | 2014-02-18 | 2017-08-08 | Google Inc. | Providing photo heat maps |
| US9876848B1 (en)* | 2014-02-21 | 2018-01-23 | Twitter, Inc. | Television key phrase detection |
| US9699404B2 (en)* | 2014-03-19 | 2017-07-04 | Microsoft Technology Licensing, Llc | Closed caption alignment |
| US11429689B1 (en)* | 2014-04-21 | 2022-08-30 | Google Llc | Generating high visibility social annotations |
| JPWO2015170548A1 (en)* | 2014-05-08 | 2017-04-20 | 株式会社Nttドコモ | User apparatus, collision report method, base station, and resource allocation method |
| US20180356961A1 (en)* | 2014-06-09 | 2018-12-13 | Google Inc. | Low-friction, instant, private, personalized video sharing widget |
| US10373209B2 (en)* | 2014-07-31 | 2019-08-06 | U-Mvpindex Llc | Driving behaviors, opinions, and perspectives based on consumer data |
| US10785325B1 (en) | 2014-09-03 | 2020-09-22 | On24, Inc. | Audience binning system and method for webcasting and on-line presentations |
| US9940634B1 (en) | 2014-09-26 | 2018-04-10 | Bombora, Inc. | Content consumption monitor |
| US11589083B2 (en) | 2014-09-26 | 2023-02-21 | Bombora, Inc. | Machine learning techniques for detecting surges in content consumption |
| US20160189201A1 (en)* | 2014-12-26 | 2016-06-30 | Yahoo! Inc. | Enhanced targeted advertising system |
| US20160189181A1 (en)* | 2014-12-29 | 2016-06-30 | The Nielsen Company (Us), Llc | Methods and apparatus to estimate demographics of an audience of a media event using social media message sentiment |
| US10083454B2 (en)* | 2015-01-30 | 2018-09-25 | Microsoft Technology Licensing, Llc | Social network content item federation based on item utility value |
| US10116676B2 (en) | 2015-02-13 | 2018-10-30 | Time Warner Cable Enterprises Llc | Apparatus and methods for data collection, analysis and service modification based on online activity |
| US9336268B1 (en) | 2015-04-08 | 2016-05-10 | Pearson Education, Inc. | Relativistic sentiment analyzer |
| US9881345B2 (en)* | 2015-04-11 | 2018-01-30 | International Business Machines Corporation | Evaluating an impact of a user's content utilized in a social network |
| US10528573B1 (en) | 2015-04-14 | 2020-01-07 | Tomorrowish Llc | Discovering keywords in social media content |
| US9756370B2 (en)* | 2015-06-01 | 2017-09-05 | At&T Intellectual Property I, L.P. | Predicting content popularity |
| US10785180B2 (en)* | 2015-06-11 | 2020-09-22 | Oath Inc. | Content summation |
| US9704020B2 (en)* | 2015-06-16 | 2017-07-11 | Microsoft Technology Licensing, Llc | Automatic recognition of entities in media-captured events |
| US20160379231A1 (en)* | 2015-06-26 | 2016-12-29 | The Nielsen Company (Us), Llc | Determining ratings data from population sample data having unreliable demographic classifications |
| US10268773B2 (en)* | 2015-06-30 | 2019-04-23 | International Business Machines Corporation | Navigating a website using visual analytics and a dynamic data source |
| US10985993B2 (en) | 2015-09-16 | 2021-04-20 | Adobe Inc. | Identifying audiences that contribute to metric anomalies |
| US10289727B2 (en)* | 2015-09-17 | 2019-05-14 | International Business Machines Corporation | Incorporation of semantic attributes within social media |
| US20170109839A1 (en)* | 2015-10-14 | 2017-04-20 | SUM Entertainment, Inc. | Artist Discovery System |
| US10783535B2 (en)* | 2016-05-16 | 2020-09-22 | Cerebri AI Inc. | Business artificial intelligence management engine |
| US11409791B2 (en) | 2016-06-10 | 2022-08-09 | Disney Enterprises, Inc. | Joint heterogeneous language-vision embeddings for video tagging and search |
| US10321193B2 (en) | 2016-09-02 | 2019-06-11 | Google Llc | Sharing a user-selected video in a group communication |
| US10929752B2 (en) | 2016-09-21 | 2021-02-23 | GumGum, Inc. | Automated control of display devices |
| US10795560B2 (en)* | 2016-09-30 | 2020-10-06 | Disney Enterprises, Inc. | System and method for detection and visualization of anomalous media events |
| US10819810B2 (en)* | 2017-01-05 | 2020-10-27 | International Business Machines Corporation | Event affinity detangling with broadcasts rolling over time zones |
| US10402723B1 (en) | 2018-09-11 | 2019-09-03 | Cerebri AI Inc. | Multi-stage machine-learning models to control path-dependent processes |
| US10762563B2 (en) | 2017-03-10 | 2020-09-01 | Cerebri AI Inc. | Monitoring and controlling continuous stochastic processes based on events in time series data |
| US10846614B2 (en)* | 2017-03-16 | 2020-11-24 | Facebook, Inc. | Embeddings for feed and pages |
| US10158897B2 (en)* | 2017-03-28 | 2018-12-18 | International Business Machines Corporation | Location-based event affinity detangling for rolling broadcasts |
| US10382372B1 (en)* | 2017-04-27 | 2019-08-13 | Snap Inc. | Processing media content based on original context |
| WO2019007477A1 (en)* | 2017-07-03 | 2019-01-10 | Telefonaktiebolaget Lm Ericsson (Publ) | Methods for personalized 360 video delivery |
| US11170288B2 (en) | 2017-08-03 | 2021-11-09 | Facebook, Inc. | Systems and methods for predicting qualitative ratings for advertisements based on machine learning |
| US20190043073A1 (en)* | 2017-08-03 | 2019-02-07 | Facebook, Inc. | Systems and methods for determining visually similar advertisements for improving qualitative ratings associated with advertisements |
| US11172272B2 (en)* | 2017-08-14 | 2021-11-09 | Comcast Cable Communications, Llc | Determining video highlights and chaptering |
| US11188822B2 (en)* | 2017-10-05 | 2021-11-30 | On24, Inc. | Attendee engagement determining system and method |
| US11281723B2 (en) | 2017-10-05 | 2022-03-22 | On24, Inc. | Widget recommendation for an online event using co-occurrence matrix |
| US10636449B2 (en) | 2017-11-06 | 2020-04-28 | International Business Machines Corporation | Dynamic generation of videos based on emotion and sentiment recognition |
| US11405669B2 (en)* | 2017-11-10 | 2022-08-02 | Ses-Imagotag Gmbh | System for synchronized video playback on a number of playback devices |
| US11743536B2 (en) | 2017-11-16 | 2023-08-29 | Tuomas W. Sandholm | Digital media campaign management in digital media delivery systems |
| US10417500B2 (en) | 2017-12-28 | 2019-09-17 | Disney Enterprises, Inc. | System and method for automatic generation of sports media highlights |
| US10809904B2 (en)* | 2018-01-09 | 2020-10-20 | Sap Se | Interactive time range selector |
| US10880601B1 (en)* | 2018-02-21 | 2020-12-29 | Amazon Technologies, Inc. | Dynamically determining audience response to presented content using a video feed |
| US10390097B1 (en) | 2018-05-30 | 2019-08-20 | Rovi Guides, Inc. | Systems and methods for creating an asynchronous social watching experience among users |
| US11200591B2 (en)* | 2018-05-30 | 2021-12-14 | Paypal, Inc. | Electronic content based on neural networks |
| US10735535B2 (en) | 2018-06-01 | 2020-08-04 | International Business Machines Corporation | Methods and systems for analyzing viewer engagement of online content |
| US10558761B2 (en)* | 2018-07-05 | 2020-02-11 | Disney Enterprises, Inc. | Alignment of video and textual sequences for metadata analysis |
| US11153663B2 (en)* | 2018-08-01 | 2021-10-19 | Dish Network L.L.C. | Automatically generating supercuts |
| US10764654B2 (en) | 2018-08-01 | 2020-09-01 | Dish Network L.L.C. | Automatically generating supercuts |
| US11321380B2 (en) | 2018-08-09 | 2022-05-03 | Vivi International Pty Ltd | Real time synchronization of client device actions with presented content |
| US11194849B2 (en) | 2018-09-11 | 2021-12-07 | International Business Machines Corporation | Logic-based relationship graph expansion and extraction |
| US11538045B2 (en)* | 2018-09-28 | 2022-12-27 | Dish Network L.L.C. | Apparatus, systems and methods for determining a commentary rating |
| US11068942B2 (en) | 2018-10-19 | 2021-07-20 | Cerebri AI Inc. | Customer journey management engine |
| WO2020123514A1 (en)* | 2018-12-10 | 2020-06-18 | Groop Internet Platform, Inc. d/b/a Talkspace | System and method for monitoring engagement |
| US11309082B2 (en) | 2018-12-10 | 2022-04-19 | Groop Internet Platform, Inc. | System and method for monitoring engagement |
| US11710065B2 (en)* | 2019-04-01 | 2023-07-25 | Adobe Inc. | Utilizing a bayesian approach and multi-armed bandit algorithms to improve distribution timing of electronic communications |
| US12200075B2 (en)* | 2019-04-10 | 2025-01-14 | IPPM Venture, LLC | Method for assessment of human attention |
| WO2020231920A1 (en)* | 2019-05-10 | 2020-11-19 | Traackr, Inc. | System and method for measuring brand vitality |
| CN110503332B (en)* | 2019-08-21 | 2022-12-30 | 谷元(上海)文化科技有限责任公司 | Information screening processing method |
| US11631015B2 (en) | 2019-09-10 | 2023-04-18 | Bombora, Inc. | Machine learning techniques for internet protocol address to domain name resolution systems |
| US20210097552A1 (en)* | 2019-10-01 | 2021-04-01 | At&T Intellectual Property I, L.P. | Proactive customer care-profiling with modeling of event sequences and relationships |
| US11769063B2 (en)* | 2019-10-21 | 2023-09-26 | International Business Machines Corporation | Providing predictive analytics with predictions tailored for a specific domain |
| US11263677B2 (en) | 2019-11-08 | 2022-03-01 | Bank Of America Corporation | Systems and methods for a social media purchasing tool |
| US11595703B2 (en)* | 2021-04-22 | 2023-02-28 | Shopify Inc. | Systems and methods for controlling transmission of live media streams |
| CN113409157B (en)* | 2021-05-19 | 2022-06-28 | 桂林电子科技大学 | Cross-social network user alignment method and device |
| US12422792B1 (en)* | 2021-05-25 | 2025-09-23 | Amazon Technologies, Inc. | Individual machine configuration based on overall process performance and latent metrics |
| US20220408122A1 (en)* | 2021-06-18 | 2022-12-22 | Applause Creators, Inc. | Live events platform |
| US11637715B2 (en) | 2021-07-28 | 2023-04-25 | Microsoft Technology Licensing, Llc | Virtual event segmentation based on topics and interactions graphs |
| US12096061B2 (en)* | 2021-08-02 | 2024-09-17 | The Nielsen Company (Us), Llc | Methods and apparatus to generate audience metrics for connected television |
| US11934455B2 (en)* | 2021-08-31 | 2024-03-19 | Comcast Cable Communications, Llc | Systems, methods, and apparatuses for audience metric determination |
| US12190871B1 (en)* | 2021-09-07 | 2025-01-07 | Amazon Technologies, Inc. | Deep learning-based automatic detection and labeling of dynamic advertisements in long-form audio content |
| WO2023059651A1 (en)* | 2021-10-05 | 2023-04-13 | Red Dirt Road Productions, Llc | Determining impact of content on an audience |
| US12314316B2 (en)* | 2022-08-10 | 2025-05-27 | Coupang Corp. | Computerized systems and methods for automatic generation of highlight videos |
Citations (12)
| Publication number | Priority date | Publication date | Assignee | Title |
|---|---|---|---|---|
| US20030055759A1 (en) | 2000-01-13 | 2003-03-20 | Erinmedia, Inc. | System and methods for creating and evaluating content and predicting responses to content |
| US20030115188A1 (en) | 2001-12-19 | 2003-06-19 | Narayan Srinivasa | Method and apparatus for electronically extracting application specific multidimensional information from a library of searchable documents and for providing the application specific information to a user application |
| US20040034561A1 (en)* | 2000-04-07 | 2004-02-19 | Smith Glen David | Interactive marketing system |
| US20060042483A1 (en)* | 2004-09-02 | 2006-03-02 | Work James D | Method and system for reputation evaluation of online users in a social networking scheme |
| US20070130580A1 (en) | 2005-11-29 | 2007-06-07 | Google Inc. | Social and Interactive Applications for Mass Media |
| US20070260596A1 (en) | 2006-03-29 | 2007-11-08 | Koran Joshua M | Behavioral targeting system |
| US20080059348A1 (en) | 2006-09-05 | 2008-03-06 | Brian Scott Glassman | Web Site Valuation |
| US20080270541A1 (en) | 2006-04-24 | 2008-10-30 | Ellis Barlow Keener | Interactive audio/video method on the internet |
| US20090083396A1 (en)* | 2007-09-26 | 2009-03-26 | Aq Media, Inc. | Audio-visual navigation and communication dynamic memory architectures |
| US20100281108A1 (en) | 2009-05-01 | 2010-11-04 | Cohen Ronald H | Provision of Content Correlated with Events |
| US7853622B1 (en) | 2007-11-01 | 2010-12-14 | Google Inc. | Video-related recommendations using link structure |
| US20110107369A1 (en) | 2006-03-28 | 2011-05-05 | O'brien Christopher J | System and method for enabling social browsing of networked time-based media |
Family Cites Families (31)
| Publication number | Priority date | Publication date | Assignee | Title |
|---|---|---|---|---|
| US6317722B1 (en)* | 1998-09-18 | 2001-11-13 | Amazon.Com, Inc. | Use of electronic shopping carts to generate personal recommendations |
| US7260823B2 (en)* | 2001-01-11 | 2007-08-21 | Prime Research Alliance E., Inc. | Profiling and identification of television viewers |
| US7197470B1 (en)* | 2000-10-11 | 2007-03-27 | Buzzmetrics, Ltd. | System and method for collection analysis of electronic discussion methods |
| US7185065B1 (en)* | 2000-10-11 | 2007-02-27 | Buzzmetrics Ltd | System and method for scoring electronic messages |
| US7672864B2 (en) | 2004-01-09 | 2010-03-02 | Ricoh Company Ltd. | Generating and displaying level-of-interest values |
| US8185543B1 (en) | 2004-11-10 | 2012-05-22 | Google Inc. | Video image-based querying for video content |
| US7707246B1 (en)* | 2006-02-22 | 2010-04-27 | Qurio Holdings, Inc. | Creating a social network around recorded media |
| AU2007219997A1 (en)* | 2006-02-28 | 2007-09-07 | Buzzlogic, Inc. | Social analytics system and method for analyzing conversations in social media |
| US8065699B2 (en)* | 2006-06-20 | 2011-11-22 | Symantec Corporation | Providing rating information for an event based on user feedback |
| US20080004933A1 (en)* | 2006-06-29 | 2008-01-03 | Destination Excellence, Inc. | System and method for providing daily and long-term contact, allocation and full-time equivalent staff forecasting |
| US8489459B2 (en)* | 2006-08-31 | 2013-07-16 | Accenture Global Services Gmbh | Demographic based content delivery |
| US8271429B2 (en) | 2006-09-11 | 2012-09-18 | Wiredset Llc | System and method for collecting and processing data |
| US8176191B2 (en) | 2006-11-30 | 2012-05-08 | Red Hat, Inc. | Automated identification of high/low value content based on social feedback |
| US8151194B1 (en) | 2008-03-26 | 2012-04-03 | Google Inc. | Visual presentation of video usage statistics |
| MX2011000409A (en)* | 2008-07-11 | 2011-06-24 | Bby Solutions Inc | Ratings switch for portable media players. |
| US20100030648A1 (en)* | 2008-08-01 | 2010-02-04 | Microsoft Corporation | Social media driven advertisement targeting |
| US8561118B2 (en)* | 2008-08-05 | 2013-10-15 | Mediafriends, Inc. | Apparatus and methods for TV social applications |
| US8468158B2 (en)* | 2008-11-06 | 2013-06-18 | Yahoo! Inc. | Adaptive weighted crawling of user activity feeds |
| US8375024B2 (en)* | 2008-11-13 | 2013-02-12 | Buzzient, Inc. | Modeling social networks using analytic measurements of online social media content |
| WO2010065109A1 (en)* | 2008-12-01 | 2010-06-10 | Topsy Labs, Inc. | Advertising based on influence |
| KR102068790B1 (en) | 2009-07-16 | 2020-01-21 | 블루핀 랩스, 인코포레이티드 | Estimating and displaying social interest in time-based media |
| WO2011016141A1 (en)* | 2009-08-04 | 2011-02-10 | 日本電気株式会社 | Frequency reproduction circuit |
| US8990124B2 (en)* | 2010-01-14 | 2015-03-24 | Microsoft Technology Licensing, Llc | Assessing quality of user reviews |
| US20110231296A1 (en)* | 2010-03-16 | 2011-09-22 | UberMedia, Inc. | Systems and methods for interacting with messages, authors, and followers |
| US10540660B1 (en)* | 2010-05-19 | 2020-01-21 | Adobe Inc. | Keyword analysis using social media data |
| US9262517B2 (en)* | 2010-08-18 | 2016-02-16 | At&T Intellectual Property I, L.P. | Systems and methods for social media data mining |
| US10034034B2 (en)* | 2011-07-06 | 2018-07-24 | Symphony Advanced Media | Mobile remote media control platform methods |
| US9324112B2 (en)* | 2010-11-09 | 2016-04-26 | Microsoft Technology Licensing, Llc | Ranking authors in social media systems |
| US10248960B2 (en)* | 2010-11-16 | 2019-04-02 | Disney Enterprises, Inc. | Data mining to determine online user responses to broadcast messages |
| US8543454B2 (en) | 2011-02-18 | 2013-09-24 | Bluefin Labs, Inc. | Generating audience response metrics and ratings from social interest in time-based media |
| EP2678784A4 (en)* | 2011-02-23 | 2014-08-06 | Bottlenose Inc | Adaptive system architecture for identifying popular topics from messages |
- 2011
- 2011-02-18USUS13/030,940patent/US8543454B2/enactiveActive
- 2011-02-22WOPCT/US2011/025757patent/WO2012112166A1/enactiveApplication Filing
- 2013
- 2013-08-26USUS13/975,527patent/US9092829B2/enactiveActive
- 2015
- 2015-07-09USUS14/795,863patent/US9563901B2/ennot_activeExpired - Fee Related
- 2017
- 2017-01-31USUS15/420,955patent/US11574321B2/enactiveActive
Patent Citations (12)
| Publication number | Priority date | Publication date | Assignee | Title |
|---|---|---|---|---|
| US20030055759A1 (en) | 2000-01-13 | 2003-03-20 | Erinmedia, Inc. | System and methods for creating and evaluating content and predicting responses to content |
| US20040034561A1 (en)* | 2000-04-07 | 2004-02-19 | Smith Glen David | Interactive marketing system |
| US20030115188A1 (en) | 2001-12-19 | 2003-06-19 | Narayan Srinivasa | Method and apparatus for electronically extracting application specific multidimensional information from a library of searchable documents and for providing the application specific information to a user application |
| US20060042483A1 (en)* | 2004-09-02 | 2006-03-02 | Work James D | Method and system for reputation evaluation of online users in a social networking scheme |
| US20070130580A1 (en) | 2005-11-29 | 2007-06-07 | Google Inc. | Social and Interactive Applications for Mass Media |
| US20110107369A1 (en) | 2006-03-28 | 2011-05-05 | O'brien Christopher J | System and method for enabling social browsing of networked time-based media |
| US20070260596A1 (en) | 2006-03-29 | 2007-11-08 | Koran Joshua M | Behavioral targeting system |
| US20080270541A1 (en) | 2006-04-24 | 2008-10-30 | Ellis Barlow Keener | Interactive audio/video method on the internet |
| US20080059348A1 (en) | 2006-09-05 | 2008-03-06 | Brian Scott Glassman | Web Site Valuation |
| US20090083396A1 (en)* | 2007-09-26 | 2009-03-26 | Aq Media, Inc. | Audio-visual navigation and communication dynamic memory architectures |
| US7853622B1 (en) | 2007-11-01 | 2010-12-14 | Google Inc. | Video-related recommendations using link structure |
| US20100281108A1 (en) | 2009-05-01 | 2010-11-04 | Cohen Ronald H | Provision of Content Correlated with Events |
Non-Patent Citations (24)
| Title |
|---|
| "MPEG-7 Overview," Martinez, J.M. (ed.), International Organisation for Standardisation, ISO/IEC JTC1/SC29/WG11, Coding of Moving Pictures and Audio, Palma de Mallorca, Oct. 31, 2004, 80 pages, [Online] [Retrieved on Dec. 13, 2012] Retrieved from the Internet. |
| "MPEG-7 Overview," Martinez, J.M. (ed.), International Organisation for Standardisation, ISO/IEC JTC1/SC29/WG11, Coding of Moving Pictures and Audio, Palma de Mallorca, Oct. 31, 2004, 80 pages, [Online] [Retrieved on Dec. 13, 2012] Retrieved from the Internet<URL:http://mpeg.chiariglione.org/standards/mpeg-7>. |
| Ah-Pine, J. et al., "Crossing Textual and Visual Content in Different Application Scenarios," Multimedia Tools and Applications, Kluwer Academic Publishers, Nov. 13, 2008, pp. 31-56, vol. 42, No. 1. |
| Bouthemy, P. et al., "A Unified Approach to Shot Change Detection and Camera Motion Characterization," IEEE Trans. on Circuits and Systems for Video Technology, Oct. 1999, vol. 9, No. 7. |
| Coden, A. et al., "Multi-Search of Video Segments Indexed by Time-Aligned Annotations of Video Content," IBM Research Report, RC21444(96156), Nov. 18, 1998, pp. 1-12. |
| Decamp, P. et al., "A Human-Machine Collaborative Approach to Tracking Human Movement in Multi-Camera Video," Proceedings of the 2009 International Conference on Content-based Image and Video Retrieval (CIVR), 2009, Santorini, Greece, 8 pages. |
| Decamp, P. et al., "An Immersive System for Browsing and Visualizing Surveillance Video," Proceedings of ACM Multimedia 2010, Florence, Italy, 2010, 10 pages. |
| European Extended Search Report, European Application No. 10800647.9, Dec. 21, 2012, 7 pages. |
| Fleischman, M. et al., "Grounded Language Modeling for Automatic Speech Recognition of Sports Video," Proceedings of the Association of Computational Linguistics (ADL), HLT/NAACL. Columbus, OH. Jun. 2008, pp. 121-129. |
| Fleischman, M. et al., "Mining Temporal Patterns of Movement for Video Content Classification," 8th ACM SIGMM International Workshop on Multimedia Information Retrieval, Santa Barbara, CA, Oct. 2006, pp. 183-192. |
| Fleischman, M. et al., "Situated Models of Meaning for Sports Video Retrieval," HLT/NAACL, Rochester, NY, Apr. 2007, 4 pages. |
| Fleischman, M. et al., "Temporal Feature Induction for Sports Highlight Classification,"ACM Multimedia, Augsburg, Germany, Sep. 2007, pp. 333-336. |
| Fleischman, M. et al., "Unsupervised Content-Based Indexing of Sports Video Retrieval," 9th ACM Workshop on Multimedia Information Retrieval (MIR), Augsburg, Germany, Sep. 2007, 9 pages. |
| Hauptmann, A. et al., "Story Segmentation and Detection of Commercials in Broadcast News Video," ADL-98 Advances in Digital Libraries Conference, Santa Barbara, CA, Apr. 22-24, 1998, 12 pages. |
| Jacobs, A. et al., Automatic Shot Boundary Detection Combining Color, Edge, and Motion Features of Adjacent Frames, Center for Computing Technologies, Bremen, Germany, 2004, 10 pages. |
| Kim, S-M. et al., "Extracting Opinions, Opinion Holders, and Topics Expressed in Online News Media Text," Proceedings of the Workshop on Sentiment and Subjectivity in Text, Sydney, Jul. 2006, pp. 1-8. |
| Kubat, R. et al., "TotalRecall: Visualization and Semi-Automatic Annotation of Very Large Audio-Visual Corpora," Ninth International Conference on Multimodal Interfaces (ICMI 2007), 2007, 8 pages. |
| Levy, M. et al., "Music Information Retrieval Using Social Tags and Audio," IEEE Transactions on Multimedia, Apr. 2009, pp. 383-395, vol. 11, No. 3. |
| Pang B. et al., "Opinion Mining and Sentiment Analysis," Foundations and Trends in Information Retrieval, 2008, pp. I-I35, vol. 2, No. 1-2. |
| PCT International Search Report and Written Opinion, PCT Application No. PCT/US10/42362, Sep. 7, 2010, 9 pages. |
| PCT International Search Report and Written Opinion, PCT Application No. PCT/US11/25757, Apr. 19, 2011, 13 pages. |
| Peacock, "Radio Audience Estimates", Peacock Research, Inc., Jan. 2005, found on line at robertoigarza.files.wordpress.com/2008/11/art-radio-audience-estimates-peacock-20051.pdf.* |
| Tardini et al., "Shot Detection and Motion Analysis for Automatic MPEG-7 Annotation of Sports Videos," 13th International Conference on Image Analysis and Processing, Nov. 2005, 8 pages. |
| Wattamar, S. S. et al., "Multimedia Explorer: Content Based Multimedia Exploration," Tencon 2008, IEEE Region 10 Conference, Nov. 19, 2008, pp. 1-6. |
Cited By (188)
| Publication number | Priority date | Publication date | Assignee | Title |
|---|---|---|---|---|
| US10007679B2 (en) | 2008-08-08 | 2018-06-26 | The Research Foundation For The State University Of New York | Enhanced max margin learning on multimodal data mining in a multimedia database |
| US10706601B2 (en) | 2009-02-17 | 2020-07-07 | Ikorongo Technology, LLC | Interface for receiving subject affinity information |
| US9483697B2 (en) | 2009-02-17 | 2016-11-01 | Ikorongo Technology, LLC | Display device content selection through viewer identification and affinity prediction |
| US9400931B2 (en) | 2009-02-17 | 2016-07-26 | Ikorongo Technology, LLC | Providing subject information regarding upcoming images on a display |
| US10084964B1 (en) | 2009-02-17 | 2018-09-25 | Ikorongo Technology, LLC | Providing subject information regarding upcoming images on a display |
| US9210313B1 (en) | 2009-02-17 | 2015-12-08 | Ikorongo Technology, LLC | Display device content selection through viewer identification and affinity prediction |
| US10638048B2 (en) | 2009-02-17 | 2020-04-28 | Ikorongo Technology, LLC | Display device content selection through viewer identification and affinity prediction |
| US11196930B1 (en) | 2009-02-17 | 2021-12-07 | Ikorongo Technology, LLC | Display device content selection through viewer identification and affinity prediction |
| US9355138B2 (en) | 2010-06-30 | 2016-05-31 | The Nielsen Company (Us), Llc | Methods and apparatus to obtain anonymous audience measurement data from network server data for particular demographic and usage profiles |
| US9679057B1 (en) | 2010-09-01 | 2017-06-13 | Ikorongo Technology, LLC | Apparatus for sharing image content based on matching |
| US12335565B2 (en) | 2010-09-21 | 2025-06-17 | The Nielsen Company (Us), Llc | Methods, apparatus, and systems to collect audience measurement data |
| US11144967B2 (en) | 2010-09-22 | 2021-10-12 | The Nielsen Company (Us), Llc | Methods and apparatus to determine impressions using distributed demographic information |
| US9596151B2 (en) | 2010-09-22 | 2017-03-14 | The Nielsen Company (Us), Llc. | Methods and apparatus to determine impressions using distributed demographic information |
| US11580576B2 (en) | 2010-09-22 | 2023-02-14 | The Nielsen Company (Us), Llc | Methods and apparatus to determine impressions using distributed demographic information |
| US9092797B2 (en) | 2010-09-22 | 2015-07-28 | The Nielsen Company (Us), Llc | Methods and apparatus to analyze and adjust demographic information |
| US10909559B2 (en) | 2010-09-22 | 2021-02-02 | The Nielsen Company (Us), Llc | Methods and apparatus to analyze and adjust demographic information |
| US10504157B2 (en) | 2010-09-22 | 2019-12-10 | The Nielsen Company (Us), Llc | Methods and apparatus to determine impressions using distributed demographic information |
| US9344343B2 (en) | 2010-09-22 | 2016-05-17 | The Nielsen Company (Us), Llc | Methods and apparatus to determine impressions using distributed demographic information |
| US11682048B2 (en) | 2010-09-22 | 2023-06-20 | The Nielsen Company (Us), Llc | Methods and apparatus to determine impressions using distributed demographic information |
| US9218612B2 (en) | 2010-09-22 | 2015-12-22 | The Nielsen Company (Us), Llc | Methods and apparatus to determine impressions using distributed demographic information |
| US9582809B2 (en) | 2010-09-22 | 2017-02-28 | The Nielsen Company (Us), Llc | Methods and apparatus to analyze and adjust demographic information |
| US11551246B2 (en) | 2010-09-22 | 2023-01-10 | The Nielsen Company (Us), Llc | Methods and apparatus to analyze and adjust demographic information |
| US11068944B2 (en) | 2010-09-22 | 2021-07-20 | The Nielsen Company (Us), Llc | Methods and apparatus to determine impressions using distributed demographic information |
| US12148007B2 (en) | 2010-09-22 | 2024-11-19 | The Nielsen Company (Us), Llc | Methods and apparatus to determine impressions using distributed demographic information |
| US10096035B2 (en) | 2010-09-22 | 2018-10-09 | The Nielsen Company (Us), Llc | Methods and apparatus to analyze and adjust demographic information |
| US10269044B2 (en) | 2010-09-22 | 2019-04-23 | The Nielsen Company (Us), Llc | Methods and apparatus to determine impressions using distributed demographic information |
| US11869024B2 (en) | 2010-09-22 | 2024-01-09 | The Nielsen Company (Us), Llc | Methods and apparatus to analyze and adjust demographic information |
| US9324112B2 (en) | 2010-11-09 | 2016-04-26 | Microsoft Technology Licensing, Llc | Ranking authors in social media systems |
| US9979614B2 (en) | 2010-12-20 | 2018-05-22 | The Nielsen Company (Us), Llc | Methods and apparatus to determine media impressions using distributed demographic information |
| US10284667B2 (en) | 2010-12-20 | 2019-05-07 | The Nielsen Company (Us), Llc | Methods and apparatus to determine media impressions using distributed demographic information |
| US12244674B2 (en) | 2010-12-20 | 2025-03-04 | The Nielsen Company (Us), Llc | Methods and apparatus to use client-server communications across internet domains to determine distributed demographic information for media impressions |
| US11729287B2 (en) | 2010-12-20 | 2023-08-15 | The Nielsen Company (Us), Llc | Methods and apparatus to determine media impressions using distributed demographic information |
| US11218555B2 (en) | 2010-12-20 | 2022-01-04 | The Nielsen Company (Us), Llc | Methods and apparatus to use client-server communications across internet domains to determine distributed demographic information for media impressions |
| US12015681B2 (en) | 2010-12-20 | 2024-06-18 | The Nielsen Company (Us), Llc | Methods and apparatus to determine media impressions using distributed demographic information |
| US10951721B2 (en) | 2010-12-20 | 2021-03-16 | The Nielsen Company (Us), Llc | Methods and apparatus to determine media impressions using distributed demographic information |
| US10567531B2 (en) | 2010-12-20 | 2020-02-18 | The Nielsen Company (Us), Llc | Methods and apparatus to determine media impressions using distributed demographic information |
| US11533379B2 (en) | 2010-12-20 | 2022-12-20 | The Nielsen Company (Us), Llc | Methods and apparatus to determine media impressions using distributed demographic information |
| US9596150B2 (en) | 2010-12-20 | 2017-03-14 | The Nielsen Company (Us), Llc | Methods and apparatus to determine media impressions using distributed demographic information |
| US9286619B2 (en) | 2010-12-27 | 2016-03-15 | Microsoft Technology Licensing, Llc | System and method for generating social summaries |
| US11082722B2 (en) | 2011-01-26 | 2021-08-03 | Afterlive.tv Inc. | Method and system for generating highlights from scored data streams |
| US10440402B2 (en) | 2011-01-26 | 2019-10-08 | Afterlive.tv Inc | Method and system for generating highlights from scored data streams |
| US11574321B2 (en) | 2011-02-18 | 2023-02-07 | Bluefin Labs, Inc. | Generating audience response metrics and ratings from social interest in time-based media |
| US20130054591A1 (en)* | 2011-03-03 | 2013-02-28 | Brightedge Technologies, Inc. | Search engine optimization recommendations based on social signals |
| US9900655B2 (en)* | 2011-04-01 | 2018-02-20 | The Nielsen Company (Us), Llc | Methods, apparatus and articles of manufacture to estimate local market audiences of media content |
| US20170150217A1 (en)* | 2011-04-01 | 2017-05-25 | The Nielsen Company (Us), Llc | Methods, apparatus and articles of manufacture to estimate local market audiences of media content |
| US11089361B2 (en) | 2011-04-01 | 2021-08-10 | The Nielsen Company (Us), Llc | Methods, apparatus and articles of manufacture to estimate local market audiences of media content |
| US12081832B2 (en) | 2011-04-01 | 2024-09-03 | The Nielsen Company (Us), Llc | Methods, apparatus and articles of manufacture to estimate local market audiences of media content |
| US11496799B2 (en) | 2011-04-01 | 2022-11-08 | The Nielsen Company (Us), Llc | Methods, apparatus and articles of manufacture to estimate local market audiences of media content |
| US10560740B2 (en) | 2011-04-01 | 2020-02-11 | The Nielsen Company (Us), Llc | Methods, apparatus and articles of manufacture to estimate local market audiences of media content |
| US9753923B2 (en) | 2011-07-13 | 2017-09-05 | Bluefin Labs, Inc. | Topic and time based media affinity estimation |
| US20130018896A1 (en)* | 2011-07-13 | 2013-01-17 | Bluefin Labs, Inc. | Topic and Time Based Media Affinity Estimation |
| US8600984B2 (en)* | 2011-07-13 | 2013-12-03 | Bluefin Labs, Inc. | Topic and time based media affinity estimation |
| US11301505B2 (en) | 2011-07-13 | 2022-04-12 | Bluefin Labs, Inc. | Topic and time based media affinity estimation |
| US9009130B2 (en) | 2011-07-13 | 2015-04-14 | Bluefin Labs, Inc. | Topic and time based media affinity estimation |
| US10769194B2 (en) | 2011-07-13 | 2020-09-08 | Bluefin Labs, Inc. | Topic and time based media affinity estimation |
| US9053517B2 (en)* | 2011-07-29 | 2015-06-09 | Rb.tv., Inc. | Devices, systems, and methods for aggregating, controlling, enhancing, archiving, and analyzing social media for events |
| US20130046826A1 (en)* | 2011-07-29 | 2013-02-21 | Rb.tv., Inc. | Devices, Systems, and Methods for Aggregating, Controlling, Enhancing, Archiving, and Analyzing Social Media for Events |
| US9386111B2 (en) | 2011-12-16 | 2016-07-05 | The Nielsen Company (Us), Llc | Monitoring media exposure using wireless communications |
| US20130159853A1 (en)* | 2011-12-20 | 2013-06-20 | Guy A. Story, Jr. | Managing playback of supplemental information |
| US9348554B2 (en)* | 2011-12-20 | 2016-05-24 | Audible, Inc. | Managing playback of supplemental information |
| US20130181993A1 (en)* | 2012-01-13 | 2013-07-18 | Fiona Elizabeth HERRING | Place heat geometries |
| US12223280B2 (en) | 2012-02-17 | 2025-02-11 | Adeia Media Solutions Inc. | Identifying multimedia asset similarity using blended semantic and latent feature |
| US10331785B2 (en)* | 2012-02-17 | 2019-06-25 | Tivo Solutions Inc. | Identifying multimedia asset similarity using blended semantic and latent feature analysis |
| US9218630B2 (en)* | 2012-03-22 | 2015-12-22 | Microsoft Technology Licensing, Llc | Identifying influential users of a social networking service |
| US20130254280A1 (en)* | 2012-03-22 | 2013-09-26 | Microsoft Corporation | Identifying influential users of a social networking service |
| US9934512B2 (en) | 2012-03-22 | 2018-04-03 | Microsoft Technology Licensing, Llc | Identifying influential users of a social networking service |
| US20130263166A1 (en)* | 2012-03-27 | 2013-10-03 | Bluefin Labs, Inc. | Social Networking System Targeted Message Synchronization |
| US11381856B2 (en) | 2012-03-27 | 2022-07-05 | Bluefin Labs, Inc. | Social networking system targeted message synchronization |
| US10694233B2 (en) | 2012-03-27 | 2020-06-23 | Bluefin Labs, Inc. | Social networking system targeted message synchronization |
| US11588778B2 (en)* | 2012-03-30 | 2023-02-21 | Fox Sports Productions, Llc | System and method for enhanced second screen experience |
| US9215288B2 (en) | 2012-06-11 | 2015-12-15 | The Nielsen Company (Us), Llc | Methods and apparatus to share online media impressions data |
| US12010191B2 (en) | 2012-06-11 | 2024-06-11 | The Nielsen Company (Us), Llc | Methods and apparatus to share online media impressions data |
| US9912482B2 (en) | 2012-08-30 | 2018-03-06 | The Nielsen Company (Us), Llc | Methods and apparatus to collect distributed user information for media impressions and search terms |
| US11792016B2 (en) | 2012-08-30 | 2023-10-17 | The Nielsen Company (Us), Llc | Methods and apparatus to collect distributed user information for media impressions and search terms |
| US10778440B2 (en) | 2012-08-30 | 2020-09-15 | The Nielsen Company (Us), Llc | Methods and apparatus to collect distributed user information for media impressions and search terms |
| US11483160B2 (en) | 2012-08-30 | 2022-10-25 | The Nielsen Company (Us), Llc | Methods and apparatus to collect distributed user information for media impressions and search terms |
| US10063378B2 (en) | 2012-08-30 | 2018-08-28 | The Nielsen Company (Us), Llc | Methods and apparatus to collect distributed user information for media impressions and search terms |
| US11870912B2 (en) | 2012-08-30 | 2024-01-09 | The Nielsen Company (Us), Llc | Methods and apparatus to collect distributed user information for media impressions and search terms |
| US9378529B2 (en)* | 2012-12-14 | 2016-06-28 | Facebook, Inc. | Arranging stories on newsfeeds based on expected value scoring on a social networking system |
| US20160188607A1 (en)* | 2012-12-14 | 2016-06-30 | Facebook, Inc. | Arranging stories on newsfeed based on expected value scoring on a social networking system |
| US11487769B2 (en)* | 2012-12-14 | 2022-11-01 | Meta Platforms, Inc. | Arranging stories on newsfeeds based on expected value scoring on a social networking system |
| US20140172877A1 (en)* | 2012-12-14 | 2014-06-19 | Dan Yigal Rubinstein | Boosting ranks of stories by a needy user on a social networking system |
| US20140172875A1 (en)* | 2012-12-14 | 2014-06-19 | Facebook, Inc. | Arranging stories on newsfeeds based on expected value scoring on a social networking system |
| US9672255B2 (en) | 2013-01-02 | 2017-06-06 | Microsoft Technology Licensing, Llc | Social media impact assessment |
| US9294576B2 (en) | 2013-01-02 | 2016-03-22 | Microsoft Technology Licensing, Llc | Social media impact assessment |
| US10614077B2 (en) | 2013-01-02 | 2020-04-07 | Microsoft Corporation | Computer system for automated assessment at scale of topic-specific social media impact |
| US20140324895A1 (en)* | 2013-03-01 | 2014-10-30 | GoPop.TV, Inc. | System and method for creating and maintaining a database of annotations corresponding to portions of a content item |
| US11410189B2 (en) | 2013-04-30 | 2022-08-09 | The Nielsen Company (Us), Llc | Methods and apparatus to determine ratings information for online media presentations |
| US10192228B2 (en) | 2013-04-30 | 2019-01-29 | The Nielsen Company (Us), Llc | Methods and apparatus to determine ratings information for online media presentations |
| US9519914B2 (en)* | 2013-04-30 | 2016-12-13 | The Nielsen Company (Us), Llc | Methods and apparatus to determine ratings information for online media presentations |
| US12093973B2 (en)* | 2013-04-30 | 2024-09-17 | The Nielsen Company (Us), Llc | Methods and apparatus to determine ratings information for online media presentations |
| US20230316306A1 (en)* | 2013-04-30 | 2023-10-05 | The Nielsen Company (Us), Llc | Methods and apparatus to determine ratings information for online media presentations |
| JP2015535353A (en)* | 2013-04-30 | 2015-12-10 | ザ ニールセン カンパニー (ユーエス) エルエルシー | Method and apparatus for determining audience rating information for online media display |
| US11669849B2 (en) | 2013-04-30 | 2023-06-06 | The Nielsen Company (Us), Llc | Methods and apparatus to determine ratings information for online media presentations |
| US10937044B2 (en)* | 2013-04-30 | 2021-03-02 | The Nielsen Company (Us), Llc | Methods and apparatus to determine ratings information for online media presentations |
| US10643229B2 (en) | 2013-04-30 | 2020-05-05 | The Nielsen Company (Us), Llc | Methods and apparatus to determine ratings information for online media presentations |
| US10068246B2 (en) | 2013-07-12 | 2018-09-04 | The Nielsen Company (Us), Llc | Methods and apparatus to collect distributed user information for media impressions |
| US11205191B2 (en) | 2013-07-12 | 2021-12-21 | The Nielsen Company (Us), Llc | Methods and apparatus to collect distributed user information for media impressions |
| US11830028B2 (en) | 2013-07-12 | 2023-11-28 | The Nielsen Company (Us), Llc | Methods and apparatus to collect distributed user information for media impressions |
| US10552864B2 (en) | 2013-08-12 | 2020-02-04 | The Nielsen Company (Us), Llc | Methods and apparatus to de-duplicate impression information |
| US11651391B2 (en) | 2013-08-12 | 2023-05-16 | The Nielsen Company (Us), Llc | Methods and apparatus to de-duplicate impression information |
| US11222356B2 (en) | 2013-08-12 | 2022-01-11 | The Nielsen Company (Us), Llc | Methods and apparatus to de-duplicate impression information |
| US9928521B2 (en) | 2013-08-12 | 2018-03-27 | The Nielsen Company (Us), Llc | Methods and apparatus to de-duplicate impression information |
| US9313294B2 (en) | 2013-08-12 | 2016-04-12 | The Nielsen Company (Us), Llc | Methods and apparatus to de-duplicate impression information |
| US20150088878A1 (en)* | 2013-09-23 | 2015-03-26 | Google Inc. | Discovering New Media Items for a User |
| US9503784B2 (en) | 2013-10-10 | 2016-11-22 | The Nielsen Company (Us), Llc | Methods and apparatus to measure exposure to streaming media |
| US11968413B2 (en) | 2013-10-10 | 2024-04-23 | The Nielsen Company (Us), Llc | Methods and apparatus to measure exposure to streaming media |
| US10356455B2 (en) | 2013-10-10 | 2019-07-16 | The Nielsen Company (Us), Llc | Methods and apparatus to measure exposure to streaming media |
| US10687100B2 (en) | 2013-10-10 | 2020-06-16 | The Nielsen Company (Us), Llc | Methods and apparatus to measure exposure to streaming media |
| US11563994B2 (en) | 2013-10-10 | 2023-01-24 | The Nielsen Company (Us), Llc | Methods and apparatus to measure exposure to streaming media |
| US11197046B2 (en) | 2013-10-10 | 2021-12-07 | The Nielsen Company (Us), Llc | Methods and apparatus to measure exposure to streaming media |
| US9332035B2 (en) | 2013-10-10 | 2016-05-03 | The Nielsen Company (Us), Llc | Methods and apparatus to measure exposure to streaming media |
| US10243753B2 (en) | 2013-12-19 | 2019-03-26 | Ikorongo Technology, LLC | Methods for sharing images captured at an event |
| US10841114B2 (en) | 2013-12-19 | 2020-11-17 | Ikorongo Technology, LLC | Methods for sharing images captured at an event |
| US10956947B2 (en) | 2013-12-23 | 2021-03-23 | The Nielsen Company (Us), Llc | Methods and apparatus to measure media using media object characteristics |
| US11854049B2 (en) | 2013-12-23 | 2023-12-26 | The Nielsen Company (Us), Llc | Methods and apparatus to measure media using media object characteristics |
| US9852163B2 (en) | 2013-12-30 | 2017-12-26 | The Nielsen Company (Us), Llc | Methods and apparatus to de-duplicate impression information |
| US11562098B2 (en) | 2013-12-31 | 2023-01-24 | The Nielsen Company (Us), Llc | Methods and apparatus to collect distributed user information for media impressions and search terms |
| US9641336B2 (en) | 2013-12-31 | 2017-05-02 | The Nielsen Company (Us), Llc | Methods and apparatus to collect distributed user information for media impressions and search terms |
| US9237138B2 (en) | 2013-12-31 | 2016-01-12 | The Nielsen Company (Us), Llc | Methods and apparatus to collect distributed user information for media impressions and search terms |
| US9979544B2 (en) | 2013-12-31 | 2018-05-22 | The Nielsen Company (Us), Llc | Methods and apparatus to collect distributed user information for media impressions and search terms |
| US10498534B2 (en) | 2013-12-31 | 2019-12-03 | The Nielsen Company (Us), Llc | Methods and apparatus to collect distributed user information for media impressions and search terms |
| US10846430B2 (en) | 2013-12-31 | 2020-11-24 | The Nielsen Company (Us), Llc | Methods and apparatus to collect distributed user information for media impressions and search terms |
| US12008142B2 (en) | 2013-12-31 | 2024-06-11 | The Nielsen Company (Us), Llc | Methods and apparatus to collect distributed user information for media impressions and search terms |
| US10147114B2 (en) | 2014-01-06 | 2018-12-04 | The Nielsen Company (Us), Llc | Methods and apparatus to correct audience measurement data |
| US12073427B2 (en) | 2014-01-06 | 2024-08-27 | The Nielsen Company (Us), Llc | Methods and apparatus to correct misattributions of media impressions |
| US10963907B2 (en) | 2014-01-06 | 2021-03-30 | The Nielsen Company (Us), Llc | Methods and apparatus to correct misattributions of media impressions |
| US11727432B2 (en) | 2014-01-06 | 2023-08-15 | The Nielsen Company (Us), Llc | Methods and apparatus to correct audience measurement data |
| US11068927B2 (en) | 2014-01-06 | 2021-07-20 | The Nielsen Company (Us), Llc | Methods and apparatus to correct audience measurement data |
| US12045845B2 (en) | 2014-03-13 | 2024-07-23 | The Nielsen Company (Us), Llc | Methods and apparatus to compensate for server-generated errors in database proprietor impression data due to misattribution and/or non-coverage |
| US10803475B2 (en) | 2014-03-13 | 2020-10-13 | The Nielsen Company (Us), Llc | Methods and apparatus to compensate for server-generated errors in database proprietor impression data due to misattribution and/or non-coverage |
| US11568431B2 (en) | 2014-03-13 | 2023-01-31 | The Nielsen Company (Us), Llc | Methods and apparatus to compensate for server-generated errors in database proprietor impression data due to misattribution and/or non-coverage |
| US10311464B2 (en) | 2014-07-17 | 2019-06-04 | The Nielsen Company (Us), Llc | Methods and apparatus to determine impressions corresponding to market segments |
| US11854041B2 (en) | 2014-07-17 | 2023-12-26 | The Nielsen Company (Us), Llc | Methods and apparatus to determine impressions corresponding to market segments |
| US11068928B2 (en) | 2014-07-17 | 2021-07-20 | The Nielsen Company (Us), Llc | Methods and apparatus to determine impressions corresponding to market segments |
| US11562394B2 (en) | 2014-08-29 | 2023-01-24 | The Nielsen Company (Us), Llc | Methods and apparatus to associate transactions with media impressions |
| US9736503B1 (en)* | 2014-09-12 | 2017-08-15 | Google Inc. | Optimizing timing of display of a mid-roll video advertisement based on viewer retention data |
| US11151614B2 (en)* | 2014-09-26 | 2021-10-19 | Comcast Cable Communications, Llc | Advertisements blended with user's digital content |
| US20160092935A1 (en)* | 2014-09-26 | 2016-03-31 | Comcast Cable Communications, Llc | Advertisements blended with user's digital content |
| US10652127B2 (en) | 2014-10-03 | 2020-05-12 | The Nielsen Company (Us), Llc | Fusing online media monitoring data with secondary online data feeds to generate ratings data for online media exposure |
| US11757749B2 (en) | 2014-10-03 | 2023-09-12 | The Nielsen Company (Us), Llc | Fusing online media monitoring data with secondary online data feeds to generate ratings data for online media exposure |
| US20160100221A1 (en)* | 2014-10-06 | 2016-04-07 | StreamRail Ltd. | System and method for preventing abandonment of web-based video content |
| US11983730B2 (en) | 2014-12-31 | 2024-05-14 | The Nielsen Company (Us), Llc | Methods and apparatus to correct for deterioration of a demographic model to associate demographic information with media impression information |
| US9967211B2 (en) | 2015-05-31 | 2018-05-08 | Microsoft Technology Licensing, Llc | Metric for automatic assessment of conversational responses |
| US9743141B2 (en) | 2015-06-12 | 2017-08-22 | The Nielsen Company (Us), Llc | Methods and apparatus to determine viewing condition probabilities |
| US10045082B2 (en) | 2015-07-02 | 2018-08-07 | The Nielsen Company (Us), Llc | Methods and apparatus to correct errors in audience measurements for media accessed using over-the-top devices |
| US12015826B2 (en) | 2015-07-02 | 2024-06-18 | The Nielsen Company (Us), Llc | Methods and apparatus to correct errors in audience measurements for media accessed using over-the-top devices |
| US11259086B2 (en) | 2015-07-02 | 2022-02-22 | The Nielsen Company (Us), Llc | Methods and apparatus to correct errors in audience measurements for media accessed using over the top devices |
| US11706490B2 (en) | 2015-07-02 | 2023-07-18 | The Nielsen Company (Us), Llc | Methods and apparatus to correct errors in audience measurements for media accessed using over-the-top devices |
| US11645673B2 (en) | 2015-07-02 | 2023-05-09 | The Nielsen Company (Us), Llc | Methods and apparatus to generate corrected online audience measurement data |
| US10785537B2 (en) | 2015-07-02 | 2020-09-22 | The Nielsen Company (Us), Llc | Methods and apparatus to correct errors in audience measurements for media accessed using over the top devices |
| US10368130B2 (en) | 2015-07-02 | 2019-07-30 | The Nielsen Company (Us), Llc | Methods and apparatus to correct errors in audience measurements for media accessed using over the top devices |
| US10380633B2 (en) | 2015-07-02 | 2019-08-13 | The Nielsen Company (Us), Llc | Methods and apparatus to generate corrected online audience measurement data |
| US9838754B2 (en) | 2015-09-01 | 2017-12-05 | The Nielsen Company (Us), Llc | On-site measurement of over the top media |
| US10827217B2 (en) | 2015-12-17 | 2020-11-03 | The Nielsen Company (Us), Llc | Methods and apparatus to collect distributed user information for media impressions |
| US11272249B2 (en) | 2015-12-17 | 2022-03-08 | The Nielsen Company (Us), Llc | Methods and apparatus to collect distributed user information for media impressions |
| US10205994B2 (en) | 2015-12-17 | 2019-02-12 | The Nielsen Company (Us), Llc | Methods and apparatus to collect distributed user information for media impressions |
| US11785293B2 (en) | 2015-12-17 | 2023-10-10 | The Nielsen Company (Us), Llc | Methods and apparatus to collect distributed user information for media impressions |
| US11971922B2 (en) | 2016-01-27 | 2024-04-30 | The Nielsen Company (Us), Llc | Methods and apparatus for estimating total unique audiences |
| US10536358B2 (en) | 2016-01-27 | 2020-01-14 | The Nielsen Company (Us), Llc | Methods and apparatus for estimating total unique audiences |
| US10270673B1 (en) | 2016-01-27 | 2019-04-23 | The Nielsen Company (Us), Llc | Methods and apparatus for estimating total unique audiences |
| US11232148B2 (en) | 2016-01-27 | 2022-01-25 | The Nielsen Company (Us), Llc | Methods and apparatus for estimating total unique audiences |
| US10979324B2 (en) | 2016-01-27 | 2021-04-13 | The Nielsen Company (Us), Llc | Methods and apparatus for estimating total unique audiences |
| US11562015B2 (en) | 2016-01-27 | 2023-01-24 | The Nielsen Company (Us), Llc | Methods and apparatus for estimating total unique audiences |
| US20230076146A1 (en)* | 2016-03-08 | 2023-03-09 | DISH Technologies L.L.C. | Apparatus, systems and methods for control of sporting event presentation based on viewer engagement |
| US11012719B2 (en)* | 2016-03-08 | 2021-05-18 | DISH Technologies L.L.C. | Apparatus, systems and methods for control of sporting event presentation based on viewer engagement |
| US12052444B2 (en)* | 2016-03-08 | 2024-07-30 | DISH Technologies L.L.C. | Apparatus, systems and methods for control of sporting event presentation based on viewer engagement |
| US11503345B2 (en)* | 2016-03-08 | 2022-11-15 | DISH Technologies L.L.C. | Apparatus, systems and methods for control of sporting event presentation based on viewer engagement |
| US11574226B2 (en) | 2016-06-29 | 2023-02-07 | The Nielsen Company (Us), Llc | Methods and apparatus to determine a conditional probability based on audience member probability distributions for media audience measurement |
| US11321623B2 (en) | 2016-06-29 | 2022-05-03 | The Nielsen Company (Us), Llc | Methods and apparatus to determine a conditional probability based on audience member probability distributions for media audience measurement |
| US11880780B2 (en) | 2016-06-29 | 2024-01-23 | The Nielsen Company (Us), Llc | Methods and apparatus to determine a conditional probability based on audience member probability distributions for media audience measurement |
| US10210459B2 (en) | 2016-06-29 | 2019-02-19 | The Nielsen Company (Us), Llc | Methods and apparatus to determine a conditional probability based on audience member probability distributions for media audience measurement |
| US11205103B2 (en) | 2016-12-09 | 2021-12-21 | The Research Foundation for the State University | Semisupervised autoencoder for sentiment analysis |
| US11128675B2 (en) | 2017-03-20 | 2021-09-21 | At&T Intellectual Property I, L.P. | Automatic ad-hoc multimedia conference generator |
| US11363185B1 (en) | 2017-09-21 | 2022-06-14 | Ikorongo Technology, LLC | Determining capture instructions for drone photography based on images on a user device |
| US10880465B1 (en) | 2017-09-21 | 2020-12-29 | IkorongoTechnology, LLC | Determining capture instructions for drone photography based on information received from a social network |
| US11889183B1 (en) | 2017-09-21 | 2024-01-30 | Ikorongo Technology, LLC | Determining capture instructions for drone photography for event photography |
| US12298786B1 (en) | 2017-09-21 | 2025-05-13 | Ikorongo Technology, LLC | Operating a drone device based on capture instructions determined from social network information |
| US11693899B1 (en) | 2018-01-25 | 2023-07-04 | Ikorongo Technology, LLC | Determining images of interest based on a geographical location |
| US11068534B1 (en) | 2018-01-25 | 2021-07-20 | Ikorongo Technology, LLC | Determining images of interest based on a geographical location |
| US10387487B1 (en) | 2018-01-25 | 2019-08-20 | Ikorongo Technology, LLC | Determining images of interest based on a geographical location |
| US10776415B2 (en)* | 2018-03-14 | 2020-09-15 | Fuji Xerox Co., Ltd. | System and method for visualizing and recommending media content based on sequential context |
| US11328026B2 (en) | 2018-06-13 | 2022-05-10 | The Globe and Mall Inc. | Multi-source data analytics system, data manager and related methods |
| US10638206B1 (en) | 2019-01-28 | 2020-04-28 | International Business Machines Corporation | Video annotation based on social media trends |
| US12316926B2 (en) | 2019-01-28 | 2025-05-27 | International Business Machines Corporation | Video annotation based on social media trends |
| USD870756S1 (en) | 2019-02-15 | 2019-12-24 | Recentive Analytics | Display screen with an animated graphical user interface |
| US11228544B2 (en) | 2020-01-09 | 2022-01-18 | International Business Machines Corporation | Adapting communications according to audience profile from social media |
| US12363381B2 (en) | 2021-09-14 | 2025-07-15 | The Nielsen Company (Us), Llc | Methods and apparatus to determine audience size based on big data |
Also Published As
| Publication number | Publication date |
|---|---|
| US9092829B2 (en) | 2015-07-28 |
| US20160071120A1 (en) | 2016-03-10 |
| US9563901B2 (en) | 2017-02-07 |
| US20120215903A1 (en) | 2012-08-23 |
| US20130346330A1 (en) | 2013-12-26 |
| US11574321B2 (en) | 2023-02-07 |
| US20170140398A1 (en) | 2017-05-18 |
| WO2012112166A1 (en) | 2012-08-23 |
Similar Documents
| Publication | Publication Date | Title |
|---|---|---|
| US11574321B2 (en) | Generating audience response metrics and ratings from social interest in time-based media | |
| US11048752B2 (en) | Estimating social interest in time-based media | |
| US9432721B2 (en) | Cross media targeted message synchronization | |
| US9154853B1 (en) | Web identity to social media identity correlation | |
| US9553922B1 (en) | Media event based social networking interfaces |
Legal Events
| Date | Code | Title | Description |
|---|---|---|---|
| AS | Assignment | Owner name:BLUEFIN LABS, INC., MASSACHUSETTS Free format text:ASSIGNMENT OF ASSIGNORS INTEREST;ASSIGNORS:FLEISCHMAN, MICHAEL BEN;ROY, DEB KUMAR;RISHEL, JEREMY;SIGNING DATES FROM 20110616 TO 20110620;REEL/FRAME:026472/0733 | |
| STCF | Information on status: patent grant | Free format text:PATENTED CASE | |
| CC | Certificate of correction | ||
| FPAY | Fee payment | Year of fee payment:4 | |
| MAFP | Maintenance fee payment | Free format text:PAYMENT OF MAINTENANCE FEE, 8TH YEAR, LARGE ENTITY (ORIGINAL EVENT CODE: M1552); ENTITY STATUS OF PATENT OWNER: LARGE ENTITY Year of fee payment:8 | |
| AS | Assignment | Owner name:MORGAN STANLEY SENIOR FUNDING, INC., MARYLAND Free format text:SECURITY INTEREST;ASSIGNOR:TWITTER, INC.;REEL/FRAME:062079/0677 Effective date:20221027 Owner name:MORGAN STANLEY SENIOR FUNDING, INC., MARYLAND Free format text:SECURITY INTEREST;ASSIGNOR:TWITTER, INC.;REEL/FRAME:061804/0086 Effective date:20221027 Owner name:MORGAN STANLEY SENIOR FUNDING, INC., MARYLAND Free format text:SECURITY INTEREST;ASSIGNOR:TWITTER, INC.;REEL/FRAME:061804/0001 Effective date:20221027 | |
| AS | Assignment | Owner name:X CORP. (F/K/A TWITTER, INC.), TEXAS Free format text:RELEASE BY SECURED PARTY;ASSIGNOR:MORGAN STANLEY SENIOR FUNDING, INC.;REEL/FRAME:070670/0857 Effective date:20250220 | |
| AS | Assignment | Owner name:X CORP. (F/K/A TWITTER, INC.), TEXAS Free format text:RELEASE BY SECURED PARTY;ASSIGNOR:MORGAN STANLEY SENIOR FUNDING, INC., AS COLLATERAL AGENT;REEL/FRAME:071127/0240 Effective date:20250429 | |
| FEPP | Fee payment procedure | Free format text:MAINTENANCE FEE REMINDER MAILED (ORIGINAL EVENT CODE: REM.); ENTITY STATUS OF PATENT OWNER: LARGE ENTITY |