US8489735B2 - Central cross-system PI monitoring dashboard - Google Patents
Central cross-system PI monitoring dashboardDownload PDFInfo
- Publication number
- US8489735B2 US8489735B2US12/872,936US87293610AUS8489735B2US 8489735 B2US8489735 B2US 8489735B2US 87293610 AUS87293610 AUS 87293610AUS 8489735 B2US8489735 B2US 8489735B2
- Authority
- US
- United States
- Prior art keywords
- message
- monitor
- central dashboard
- components
- notification
- Prior art date
- Legal status (The legal status is an assumption and is not a legal conclusion. Google has not performed a legal analysis and makes no representation as to the accuracy of the status listed.)
- Active, expires
Links
Images


Classifications
- G—PHYSICS
- G06—COMPUTING OR CALCULATING; COUNTING
- G06F—ELECTRIC DIGITAL DATA PROCESSING
- G06F11/00—Error detection; Error correction; Monitoring
- G06F11/30—Monitoring
- G06F11/32—Monitoring with visual or acoustical indication of the functioning of the machine
- G06F11/324—Display of status information
- G06F11/327—Alarm or error message display
- G—PHYSICS
- G06—COMPUTING OR CALCULATING; COUNTING
- G06F—ELECTRIC DIGITAL DATA PROCESSING
- G06F11/00—Error detection; Error correction; Monitoring
- G06F11/07—Responding to the occurrence of a fault, e.g. fault tolerance
- G06F11/0703—Error or fault processing not based on redundancy, i.e. by taking additional measures to deal with the error or fault not making use of redundancy in operation, in hardware, or in data representation
- G06F11/0706—Error or fault processing not based on redundancy, i.e. by taking additional measures to deal with the error or fault not making use of redundancy in operation, in hardware, or in data representation the processing taking place on a specific hardware platform or in a specific software environment
- G06F11/0709—Error or fault processing not based on redundancy, i.e. by taking additional measures to deal with the error or fault not making use of redundancy in operation, in hardware, or in data representation the processing taking place on a specific hardware platform or in a specific software environment in a distributed system consisting of a plurality of standalone computer nodes, e.g. clusters, client-server systems
- G—PHYSICS
- G06—COMPUTING OR CALCULATING; COUNTING
- G06F—ELECTRIC DIGITAL DATA PROCESSING
- G06F11/00—Error detection; Error correction; Monitoring
- G06F11/07—Responding to the occurrence of a fault, e.g. fault tolerance
- G06F11/0703—Error or fault processing not based on redundancy, i.e. by taking additional measures to deal with the error or fault not making use of redundancy in operation, in hardware, or in data representation
- G06F11/0706—Error or fault processing not based on redundancy, i.e. by taking additional measures to deal with the error or fault not making use of redundancy in operation, in hardware, or in data representation the processing taking place on a specific hardware platform or in a specific software environment
- G06F11/0748—Error or fault processing not based on redundancy, i.e. by taking additional measures to deal with the error or fault not making use of redundancy in operation, in hardware, or in data representation the processing taking place on a specific hardware platform or in a specific software environment in a remote unit communicating with a single-box computer node experiencing an error/fault
- G—PHYSICS
- G06—COMPUTING OR CALCULATING; COUNTING
- G06F—ELECTRIC DIGITAL DATA PROCESSING
- G06F11/00—Error detection; Error correction; Monitoring
- G06F11/07—Responding to the occurrence of a fault, e.g. fault tolerance
- G06F11/0703—Error or fault processing not based on redundancy, i.e. by taking additional measures to deal with the error or fault not making use of redundancy in operation, in hardware, or in data representation
- G06F11/079—Root cause analysis, i.e. error or fault diagnosis
- G—PHYSICS
- G06—COMPUTING OR CALCULATING; COUNTING
- G06F—ELECTRIC DIGITAL DATA PROCESSING
- G06F11/00—Error detection; Error correction; Monitoring
- G06F11/30—Monitoring
- G06F11/34—Recording or statistical evaluation of computer activity, e.g. of down time, of input/output operation ; Recording or statistical evaluation of user activity, e.g. usability assessment
- G06F11/3409—Recording or statistical evaluation of computer activity, e.g. of down time, of input/output operation ; Recording or statistical evaluation of user activity, e.g. usability assessment for performance assessment
- G—PHYSICS
- G06—COMPUTING OR CALCULATING; COUNTING
- G06Q—INFORMATION AND COMMUNICATION TECHNOLOGY [ICT] SPECIALLY ADAPTED FOR ADMINISTRATIVE, COMMERCIAL, FINANCIAL, MANAGERIAL OR SUPERVISORY PURPOSES; SYSTEMS OR METHODS SPECIALLY ADAPTED FOR ADMINISTRATIVE, COMMERCIAL, FINANCIAL, MANAGERIAL OR SUPERVISORY PURPOSES, NOT OTHERWISE PROVIDED FOR
- G06Q10/00—Administration; Management
- G06Q10/06—Resources, workflows, human or project management; Enterprise or organisation planning; Enterprise or organisation modelling
Definitions
- the disclosed subject matterrelates to the field of computer systems and, more particularly, to a method and apparatus for providing a central cross system monitor.
- a message exchange framework based on SOAP/XML technologyprovides a platform that allows different interfaces to communicate using a uniform technology and promotes overall clarity and reduces maintenance effort. However, customers keep complaining about high total cost of ownership in operations of an exchange framework product, such as SAP Netweaver Process Integration (PI).
- PISAP Netweaver Process Integration
- SAP Netweaver PI systemtypically consists for several technical components which all offer local monitoring applications.
- FIG. 1illustrates an exemplary system according to an embodiment.
- FIG. 2illustrates an exemplary system for an integrated, message-based infrastructure according to an embodiment.
- FIG. 3illustrates an exemplary integration server according to an embodiment.
- FIG. 4illustrates an exemplary user interface of a cross system monitor for an overview of a process integration domain according to an embodiment.
- FIG. 5illustrates an exemplary user interface of a cross system monitor for an overview monitor according to an exemplary embodiment.
- FIG. 6illustrates an exemplary user interface of a cross system monitor for an overview monitor with system monitoring according to an exemplary embodiment.
- FIG. 7illustrates an exemplary user interface of a cross system monitor for a component monitor according to an exemplary embodiment.
- FIG. 8illustrates an exemplary user interface of a cross system monitor for an alert inbox according to an exemplary embodiment.
- FIG. 9illustrates an exemplary user interface of a cross system monitor for integration with incident management according to an exemplary embodiment.
- FIG. 10illustrates an exemplary user interface of a cross system monitor for integration with notification management according to an exemplary embodiment.
- FIG. 11illustrates an exemplary user interface of a cross system monitor for a channel monitor according to an exemplary embodiment.
- FIG. 12illustrates an exemplary user interface of a cross system monitor for a message error monitor according to an exemplary embodiment.
- FIG. 13illustrates an exemplary user interface of a cross system monitor for a message backlog monitor according to an exemplary embodiment.
- FIG. 14illustrates an exemplary user interface of a cross system monitor for a message flow monitor according to an exemplary embodiment.
- Embodiments of the present inventionmay provide a cross system monitor.
- the cross system monitormay function as a central dashboard for all PI components in PI domains being monitored.
- the cross system monitormay tightly integrate PI monitoring with system monitoring.
- the cross system monitormay provide integration with incident management, notification management and alerting infrastructure.
- the cross system monitormay provide context specific guidance with analysis.
- the cross system monitormay collect all necessary information regularly and automatically in background.
- FIG. 1illustrates an exemplary system 100 according to an embodiment.
- the system 100may comprise a process integration (PI) domain 102 and a cross system monitor 114 .
- the PI domain 102may comprise a variety of PI components, such as, a business system 104 , a proxy 106 and adapter engines 110 and 112 .
- the business system 104may be a backend system that represents any of a number of processes or services and their software and hardware, such as Web portals, buying or selling programs, electronic mail, business management programs, project planning programs, etc.
- Some backend systems (not shown) in the PI domain 102may be Web-based applications programmed according to standard computing platforms using web-specific programming languages such as Java and ABAP, for instance. These backend systems may be integrated into the PI domain 102 by the proxy 106 (e.g., an ABAP proxy), or adapters (e.g., Java adapters) hosted in the adapter engines 110 and 112 .
- the proxy 106e.g
- Proxies and adaptersmake the communication technology stack transparent to backend systems, and present a backend system with a programming language-dependent interface.
- the communication logicmay be implemented within the proxy and adapter that represents the interface description of the respective development platform, such as Java, ABAP, and .NET for a web-based application.
- the proxies and adaptersmay convert platform-specific data types into XML and provide access to the component-specific local integration engine.
- the proxies and adaptersmay be deployed on any machines (e.g., a physical machine or a virtual instance that also host one or more backend systems) and are not necessarily on stand aloe machines.
- the PI componentsmay communicate with each other by message based interaction.
- Some backend systemssuch as the business system 104 , may send PI messages (e.g., SOAP messages) directly.
- Others backend systemsmay need translators, such as adapters or proxies (e.g., the proxy 106 , or adapters for different protocols hosted by the adapter engines 110 and 112 ), to translate messages from different systems into PI messages.
- the proxy 106 and adapter engines 110 and 112may be used as bridges to exchange messages in the PI domain 102 .
- the cross system monitor 114may be a central dashboard running on a computing device as shown in FIG. 1 .
- the computing devicemay have a memory to store computer instructions and a computer processor coupled to the memory to execute the computer instructions to monitor one or more PI domains. That is, in addition to the PI domain 102 , the cross system monitor 114 may be connected to multiple PI domains and used to monitor multiple PI domains simultaneously.
- the monitoringmay include all components of each of the PI domain being monitored.
- Each component being monitoredmay push diagnostic information, such as, but not limited to, availability and self-test information, to the cross system monitor 114 .
- each componentmay have databases storing message flow data and the cross system monitor 114 may actively read and aggregate message flow data from each component being monitored to generate a component-independent view.
- FIG. 2illustrates an exemplary system 200 for an integrated, message-based infrastructure according to an embodiment.
- the system 200may comprise a variety of backend systems connected by an integration server 208 .
- the variety of backend systemsmay include a JDBC database 212 , a SOAP backend system 214 , a JMS system 218 , an IDoc backend system 222 , a file system 226 .
- the system 200may further comprise proxies 220 and 228 , and adapter engines 210 , 216 and 224 .
- the integration server 208may also comprise an adapter engine (shown in FIG. 3 ).
- the adapter engines 210 , 216 and 224may be referred to as decentral adapter engines and the adapter engine of the integration server 208 may be referred to as a central adapter engine.
- the JDBC database 212 and SOAP backend system 214may be connected to the integration server 208 by the adapter engine 210 , which may host respective adapters for the JDBC database 212 and SOAP backend system 214 .
- the JMS system 218may be connected to the integration server 208 by the adapter engine 216 .
- the file system 226may be connected to the integration server 208 by the adapter engine 224 .
- the IDoc backend system 222may be connected to the integration server 208 directly and indirectly via the proxy 220 .
- the proxy 220may be hosted in a separate machine.
- the proxy softwaremay be installed on the same machine as the IDoc backend system 222 .
- the communication between different PI componentsmay be message based.
- any PI components directly connected to the integration server 208may communicate with the integration server 208 in PI messages, such as the communication between any of the adapter engines, proxies and integration server 208 .
- communication between an end system and its proxy or adaptermay be in non-PI messages (e.g., a point-to-point proprietary message).
- the message based communicationmay be implemented by communication channels.
- Each communication channelmay be an entity that acts as some kind of connection. It may be customized and may know what to read at a certain time and what to do after the read. For example: a file channel may know where to poll files at what times and how to translate the retrieved files and where to send them.
- the communication channelsmay be implemented in adapters (e.g., a file adapter for file channel) and run on any adapter engine (e.g., cross system monitor 114 and adapter engines 210 , 216 and 224 ).
- the PI domain 102may comprise a business system 104 , a proxy 106 and adapter engines 110 and 112 .
- the PI domain 102may be a message based exchange infrastructure that interconnects a variety of components, such as the business system 104 , the proxy 106 and adapter engines 110 and 112 .
- the proxy 106 and adapter engines 110 and 112may be used by other systems (not shown) as bridges to exchange messages with other systems in the PI domain 102 .
- the cross system monitor 202may be a central dashboard similar to the cross system monitor 114 .
- the monitoringmay include all components of each of the PI domain being monitored. Each component being monitored may push availability and self-test information to the cross system monitor 202 . Further, the cross system monitor 202 may actively read and aggregate message flow data from each component being monitored to generate a component-independent view.
- the monitored data flowmay be referred to as PI-related data flow.
- the PI related data flowmay include, for example, a file adapter reading a .txt-file via a communication channel, or a file containing several entries that each can result in different PI messages (XI SOAP format).
- the cross system monitor 202may also monitor data collection for other systems (e.g., IDoc backend system 222 ), which may end up in the system monitoring application and may be integrated with PI Monitoring application.
- IDoc backend system 222may end up in the system monitoring application and may be integrated with PI Monitoring application.
- FIG. 3illustrates an exemplary integration server 300 according to an embodiment.
- the integration server 300include components implemented in different programming languages.
- the integration server 300include an ABAP stack 302 and a JAVA stack 310 .
- the ABAP stack 302may include a business process server 306 and an integration engine 308 .
- the JAVA stack 310may include a central adapters engine 312 , a mapping runtime 314 , an integration directory 316 , an enterprise services repository 318 and a system landscape directory 320 .
- the exemplary integration server 300may be used as the integration server 108 and 208 shown in FIGS. 1 and 2 .
- the business process server 306may execute centrally modeled business processes.
- the integration engine 308may provide messaging and business process control at runtime for connecting services and managing the process flow.
- the central adapters engine 312may include various adapters to provide connectivity between the integration server 300 and a variety of software applications (e.g., backend systems).
- the mapping runtime 314may define required transformations between different message interfaces, message types, or data types in different PI messages.
- the enterprise services repository 318may capture design-time collaboration descriptions of all software components that can communicate via the integration server 300 .
- the integration directory 316may capture configuration-specific collaboration descriptions of the integration server at runtime, which includes accessing actual component installations from the system landscape directory 320 and connectivity descriptions for backend systems, all of which represents the shared business semantics of a PI domain containing the integration server 300 .
- the integration server 300may uses the shared business semantics at runtime to execute message-based collaboration among the active software components.
- FIG. 4illustrates an exemplary user interface 400 of a cross system monitor for an overview of a process integration domain according to an embodiment.
- the user interface 400 of the cross system monitormay include a drop down box 402 to select different views (e.g., a standard list view, a detailed view, a thumb view) and a list 412 of PI domains being monitored.
- the user interface 400 of the cross system monitormay also provide a plurality of buttons to launch different PI monitoring applications: overview monitor 404 , component monitor 406 , channel monitor 408 and message monitor 410 .
- a specific PI domain from the list 412 of PI domainsmay be selected and a PI monitoring application may be launched by clicking one of the buttons for the PI monitoring applications.
- the cross system monitormay be referred also as cross PI component monitor. It may provide an integrated central PI product monitor with the system monitoring in one “overview monitor,” which is different from any prior art monitoring tools that are either standalone or only mixes up contents for different components to be monitored.
- FIG. 5illustrates an exemplary user interface 500 of a cross system monitor for an overview monitor according to an exemplary embodiment.
- FIG. 5may be launched when the button for overview monitor 404 of FIG. 4 is clicked.
- the user interface 500 of the cross system monitormay display an aggregated view 502 for each component type (e.g., integration server, decentral adapter engines and business systems) and a detailed view 504 for individual view per PI component.
- the aggregated view 502may show important information for each PI component, for example, number of alerts, availability, self test result, conditions of communication channels, error messages and backlog messages.
- the detailed view 504may display details of a PI component.
- the detailed view 504may display the components of the ABAP stack (e.g., integration engine, business process engine) in a panel 506 and the JAVA stack (e.g., central adapter engine, mapping runtime, integration directory, integration repository and system landscape directory) in a panel 508 .
- the aggregated view 502may be used as an entry point with most important status information on Integration Server, Decentral Adapter Engines and connected backend business systems.
- the user interface 500may provide a drill down capability such that each individual component or a subcomponent may be clicked to show further detail. For example, clicking on the integration server in the aggregated view 502 may show the detailed view 504 of the integration server. Clicking on any of the information icons for a PI component, for example, self-test icon for the integration engine, may show more detailed information about that particular PI component. Self-Test for each PI component may enable an user (e.g., a supporter, admin, or integration expert) to see what's going on with the PI component.
- B4Ymay be a technical system that in this case may consist of two stacks—one is the ABAP stack (B4Y ⁇ ABAP), the other is the JAVA stack (B4Y ⁇ JAVA).
- the PI domainmay be referred to as B4Y because an Integration Server is running on the B4Y Technical system. It should be noted that the PI domain may contain components (decentral Adapter Engines) from other technical systems as well.
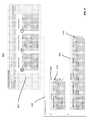
- FIG. 6illustrates an exemplary user interface 600 of a cross system monitor for an overview monitor with system monitoring according to an exemplary embodiment.
- the screen display of user interface 600may comprise a display 602 of the B4Y ⁇ JAVA and a system hierarchy 604 .
- the system hierarchy 604may comprise hosts 610 at the bottom, instances 608 in the middle and a system 606 at the top.
- Each host 610may be a technical box, such as a personal computer.
- Each instancemay be a logical entity like a server node in JAVA.
- the systemmay be an artificial entity for metrics that are not specific for an instance or host but relevant for the entire system.
- the system hierarchymay show a view category selected from: availability, configuration, exception, and performance. For example, clicking on the icon for technical system “PERFORMANCE” may navigate to System Monitoring where all monitoring metrics that are active for category “PERFORMANCE” may be displayed.
- One example for these metricsmay be Number of Internet Communication Manager (ICM) requests in Queue, which may show whether the ICM is overloaded and therefore the performance of the instance may not be well. Further, the display may help analyze how this value behaved in the last 24 hours)
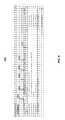
- FIG. 7illustrates an exemplary user interface 700 of a cross system monitor for a component monitor according to an exemplary embodiment.
- the component monitor user interface 700may comprise a list view 702 of the components and a list view 704 of one category of detailed view of a particular component.
- the list view 702may show a central view of on availability and self-test status of all PI components and the list view 704 may show details of availability or self-test for a particular PI component.
- the list view 702may show two self-tests for B4X-JAVA are red and need to be checked and the list view 704 may show details of self-tests of the PI component of central adapter engine B4X.
- FIG. 8illustrates an exemplary user interface 800 of a cross system monitor for an alert inbox according to an exemplary embodiment.
- the alert inbox user interface 800may comprise a navigation query 802 , an alert type table 804 showing activities and an alert group table 806 showing activities.
- the navigation query 802may be a pre-defined personal object work list (POWL) queries per category and per monitored object type.
- POWLpersonal object work list
- the alert type table 804may display number of occurrences per alert type and number of status changes. In one embodiment, the alert type table 804 may be personalized for content and look-and-feel.
- the alert group table 806may indicate status, processor and comments to track status of alert group directly in the alert box. Further, the alert group table 806 may also include incident ticket ID and status for incident reports.
- FIG. 9illustrates an exemplary user interface 900 of a cross system monitor for integration with incident management according to an exemplary embodiment.
- the incident management user interface 900may comprise a component view 902 , a command 904 on the component view 902 to create incident ticket, a popup window 906 to create a message for reporting an incident.
- the popup window 906may comprise a plurality of fields to capture the context of the incident and the fields may be automatically filled by the cross system monitor using context information of the incident. For example, the system, component, and a short description of known conditions for the incident may be filled as shown on the popup window 906 .
- FIG. 10illustrates an exemplary user interface 1000 of a cross system monitor for integration with notification management according to an exemplary embodiment.
- the notification management user interface 1000may comprise a popup window 1002 for creating a notification.
- the popup window 1002may be invoked by clicking on a “create notification” command button from a component view.
- a usermay copy and past a ticket number (e.g. 8000000946).
- all known context informationmay be filled automatically, such as the component details information in the notification body.
- FIG. 11illustrates an exemplary user interface 1100 of a cross system monitor for a channel monitor according to an exemplary embodiment.
- the channel monitor user interface 1100may include a channel filter 1102 , a channel overview window 1104 and a channel detail display 1106 .
- the channel filter 1102may include a filter name and a plurality of parameters, for example, adapter engine, adapter type, channel name and channel status.
- the filter namemay be an existing filter that saved with pre-configured parameters. If no filter name is specified, a specific filter may be configured by the parameters.
- the channel overview 1104may display a list of channels satisfying the parameters. For example, the adapter engine parameter may determine whether the channel overview 1104 should provide a central view on availability of all channels of different adapter engines.
- the channel detail display 1106may show details of a selected channel from a list of channels shown in the channel overview 1104 .
- the channel monitor user interface 1100may show channels of all connected adapter engines. Many channels in error status may be found. Further investigation may be enabled by using local Channel Monitor, which may be accessed by a drop down command list.
- the channel monitor user interface 1100may provide follow-up actions, for example, context sensitive navigation to further monitors, start/stop/ping of channels. For example, a user responsible for file-based channels may restrict the output to file channels using an existing filter, select a channel in status ERROR, and click a button ‘Manage’-‘PING’. Further, the user may try to find out the root-cause by checking the details. In another example, the user may select a channel in status ‘Stopped or Not-Administered’ and click a button ‘Manage’-‘START’ to start the channel.
- the cross system monitormay provide PI Channel Independent Logs.
- FIG. 12illustrates an exemplary user interface 1200 of a cross system monitor for a message monitor according to an exemplary embodiment.
- the message monitor user interface 1200may comprise a message filter 1202 and a plurality of monitors, such as error monitor 1204 , backlog monitor (shown in FIG. 13 ) and message flow monitor (shown in FIG. 14 ).
- the message filter 1202may enable a user to input a plurality of filtering parameters to create a filter for detailed filtering.
- the error monitor 1204may show PI components with messages in error in an error localization view, and status of the errors in an error status view.
- the error monitor 1204may further provide drill down options to allow more detailed drill down on all components and/or based on status.
- the error localization viewmay provide some drill-downs to find out on which components messages in error status exist and the error status view may provide some drill-downs to find out the real root-cause.
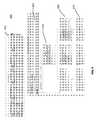
- FIG. 13illustrates an exemplary user interface 1300 of a cross system monitor for a message backlog monitor according to an exemplary embodiment.
- the message backlog monitor user interface 1300a backlog monitor 1302 and a trend graph 1304 .
- the message backlog monitor 1302may show PI components with message backlogs in a backlog localization view, and status of the message backlogs in a backlog status view.
- the message backlog monitor 1302may further provide drill down options to allow more detailed drill down on all components and/or based on status.
- the backlog localization viewmay provide some drill-downs to find out on how many backlogged messages each component has and the backlog status view may provide some drill-downs on based on status.
- the trend graph 1304may display a historical view and help to detect a trend for the backlogs.
- FIG. 14illustrates an exemplary user interface 1400 of a cross system monitor for a message flow monitor according to an exemplary embodiment.
- the message flow monitormay be navigated to by clicking on any number of messages.
- the message flow monitor user interface 1400may comprise a message filter 1402 and a message flow monitor 1404 .
- the message filter 1402may be identical to the message filter 1202 .
- the message flow monitor 1404may offer a component independent view on the message processing and may provide some drill-downs details for selected sender and receiver combination.
- the message monitormay provide a convenient tool for diagnose and fix problems in communications. For example, a user of the PI domain may report missing messages of a certain sender interface. An administrator may remove all columns in a message flow monitor except “sender interface,” enter the interface name and check on which PI components those messages failed. The administrator may restart/cancel messages via a context sensitive popup button ‘Manage.”
- the message monitorprovide context-sensitive navigation to the local message monitors using a button “Navigate To” and select “Message Monitor.”
- the message monitormay be integrated with notification and incident management, and may report on message throughput cross the PI components.
- the cross system monitormay be highly integrated with system monitoring. It may help identify issues of underlying technical system for a running PI component. As described above, the cross system monitor may be also highly integrated with the incident management functionality, which allows to create support tickets in the context of an analysis and necessary data may be passed automatically. The cross system monitor may be highly integrated with the notification management functionality that allows to create notifications (via email or SMS) in the context of an analysis and necessary data may be passed automatically. Further, a user may be guided after an error detection by offering a suitable set of navigation links according the analysis context (e.g., depending on the PI component, technical system). In one embodiment, incidents may automatically result in alerts that may be forwarded via email or SMS.
- the exemplary method and computer program instructionsmay be embodied on a machine readable storage medium such as a computer disc, optically-readable media, magnetic media, hard drives, RAID storage device, and flash memory.
- a server or database servermay include machine readable media configured to store machine executable program instructions.
- the features of the embodiments of the present inventionmay be implemented in hardware, software, firmware, or a combination thereof and utilized in systems, subsystems, components or subcomponents thereof.
- the elements of the inventionare programs or the code segments used to perform the necessary tasks.
- the program or code segmentscan be stored on machine readable storage media.
- the “machine readable storage media”may include any medium that can store information.
- Examples of a machine readable storage mediuminclude electronic circuits, semiconductor memory device, ROM, flash memory, erasable ROM (EROM), floppy diskette, CD-ROM, optical disk, hard disk, fiber optic medium, or any electromagnetic or optical storage device.
- the code segmentsmay be downloaded via computer networks such as Internet, Intranet, etc.
Landscapes
- Engineering & Computer Science (AREA)
- Theoretical Computer Science (AREA)
- General Engineering & Computer Science (AREA)
- Quality & Reliability (AREA)
- Physics & Mathematics (AREA)
- General Physics & Mathematics (AREA)
- Business, Economics & Management (AREA)
- Computer Hardware Design (AREA)
- Human Resources & Organizations (AREA)
- Entrepreneurship & Innovation (AREA)
- Strategic Management (AREA)
- Economics (AREA)
- Health & Medical Sciences (AREA)
- Educational Administration (AREA)
- Game Theory and Decision Science (AREA)
- Biomedical Technology (AREA)
- Development Economics (AREA)
- Marketing (AREA)
- Operations Research (AREA)
- Tourism & Hospitality (AREA)
- General Business, Economics & Management (AREA)
- Debugging And Monitoring (AREA)
Abstract
Description
Claims (9)
Priority Applications (2)
| Application Number | Priority Date | Filing Date | Title |
|---|---|---|---|
| US12/872,936US8489735B2 (en) | 2010-08-31 | 2010-08-31 | Central cross-system PI monitoring dashboard |
| EP11006927AEP2423817A1 (en) | 2010-08-31 | 2011-08-24 | Central cross-system pi monitoring dashboard |
Applications Claiming Priority (1)
| Application Number | Priority Date | Filing Date | Title |
|---|---|---|---|
| US12/872,936US8489735B2 (en) | 2010-08-31 | 2010-08-31 | Central cross-system PI monitoring dashboard |
Publications (2)
| Publication Number | Publication Date |
|---|---|
| US20120054334A1 US20120054334A1 (en) | 2012-03-01 |
| US8489735B2true US8489735B2 (en) | 2013-07-16 |
Family
ID=44533728
Family Applications (1)
| Application Number | Title | Priority Date | Filing Date |
|---|---|---|---|
| US12/872,936Active2031-03-20US8489735B2 (en) | 2010-08-31 | 2010-08-31 | Central cross-system PI monitoring dashboard |
Country Status (2)
| Country | Link |
|---|---|
| US (1) | US8489735B2 (en) |
| EP (1) | EP2423817A1 (en) |
Cited By (7)
| Publication number | Priority date | Publication date | Assignee | Title |
|---|---|---|---|---|
| US20110145357A1 (en)* | 2009-12-15 | 2011-06-16 | Symantec Corporation | Storage replication systems and methods |
| US20130132940A1 (en)* | 2011-11-17 | 2013-05-23 | Andreas Meier | Adaptation of data flow of one or multiple systems within a system landscape |
| US20140282010A1 (en)* | 2013-03-15 | 2014-09-18 | Bmc Software, Inc. | Story-mode user interface |
| US20160019295A1 (en)* | 2014-07-16 | 2016-01-21 | Otto Makris | Odata enablement for personal object worklists |
| US9509574B2 (en)* | 2015-04-03 | 2016-11-29 | Illumio, Inc. | End-to-end policy enforcement in the presence of a traffic midpoint device |
| US9582838B1 (en) | 2013-03-01 | 2017-02-28 | Health Care Systems, Inc. | Targeted surveillance system with mini-screen dashboard |
| US12250467B2 (en) | 2017-03-08 | 2025-03-11 | Samsung Electronics Co., Ltd. | Event detecting device including an event signal generator and an output signal generator configured to generate an output signal by combining event signals |
Families Citing this family (9)
| Publication number | Priority date | Publication date | Assignee | Title |
|---|---|---|---|---|
| US9679009B2 (en) | 2011-11-17 | 2017-06-13 | Sap Se | Component independent process integration message search |
| US20130326079A1 (en) | 2012-05-31 | 2013-12-05 | Sap Ag | Unifying Programming Models in Connectivity Framework |
| US9135093B2 (en) | 2012-08-31 | 2015-09-15 | Sap Se | Event-driven approach for collecting monitoring data of messaging systems |
| US10310594B2 (en) | 2012-12-04 | 2019-06-04 | Aetherpal Inc. | Knowledge base in virtual mobile management |
| US9146798B2 (en)* | 2013-03-13 | 2015-09-29 | Sap Se | System and method of performing a health check on a process integration component |
| US9965135B2 (en) | 2013-03-14 | 2018-05-08 | Sap Se | Configurable metrics and metric visualization |
| CN104346231B (en) | 2013-07-30 | 2018-06-29 | 商业对象软件有限公司 | Instrument board performance analyser |
| CN106951337B (en)* | 2017-03-28 | 2020-09-11 | 北京奇虎科技有限公司 | Method and equipment for realizing cross-system operation of application based on exception handling |
| US11875297B2 (en) | 2020-12-23 | 2024-01-16 | International Business Machines Corporation | Generation of dashboard templates for operations management |
Citations (24)
| Publication number | Priority date | Publication date | Assignee | Title |
|---|---|---|---|---|
| US5845062A (en)* | 1996-06-25 | 1998-12-01 | Mci Communications Corporation | System and method for monitoring network elements organized in data communication channel groups with craft interface ports |
| US5913036A (en)* | 1996-06-28 | 1999-06-15 | Mci Communications Corporation | Raw performance monitoring correlated problem alert signals |
| US5974237A (en)* | 1996-12-18 | 1999-10-26 | Northern Telecom Limited | Communications network monitoring |
| EP1475734A2 (en) | 2003-03-31 | 2004-11-10 | Sap Ag | Alert Notification Management |
| US20060085376A1 (en)* | 2004-10-14 | 2006-04-20 | The Trizetto Group, Inc. | Centralized management of software adapters |
| US20060126801A1 (en) | 2004-12-14 | 2006-06-15 | Sbc Knowledge Ventures, L.P. | Trouble ticket monitoring system having internet enabled and web-based graphical user interface to trouble ticket workload management systems |
| US20060212445A1 (en)* | 1999-11-03 | 2006-09-21 | Mads Rydahl | Method, system, and computer readable medium for managing resource links |
| US20060233311A1 (en)* | 2005-04-14 | 2006-10-19 | Mci, Inc. | Method and system for processing fault alarms and trouble tickets in a managed network services system |
| US20060253566A1 (en)* | 2005-03-28 | 2006-11-09 | Dimitris Stassinopoulos | Method and system for managing a distributed network of network monitoring devices |
| US20060265418A1 (en)* | 2005-05-23 | 2006-11-23 | Board Of Regents, The University Of Texas System | System, program product, and methods for managing events |
| US7143161B2 (en)* | 2001-11-16 | 2006-11-28 | Nortel Networks Limited | Tandem connection monitoring parallel processing |
| US20070011317A1 (en)* | 2005-07-08 | 2007-01-11 | Gordon Brandyburg | Methods and apparatus for analyzing and management of application traffic on networks |
| US20070066297A1 (en)* | 2005-09-20 | 2007-03-22 | Ghobad Heidari-Bateni | Network monitoring system and method |
| US7216162B2 (en)* | 2000-05-24 | 2007-05-08 | Verint Systems Ltd. | Method of surveilling internet communication |
| US20070234426A1 (en)* | 2000-06-23 | 2007-10-04 | Rajeev Khanolkar | Comprehensive security structure platform for network managers |
| US20070240061A1 (en)* | 2006-03-29 | 2007-10-11 | Lucent Technologies Inc. | Method for distributed tracking of approximate join size and related summaries |
| US7313324B1 (en)* | 2003-07-25 | 2007-12-25 | At&T Corp. | SONET outage impact measurement technique |
| US7453815B1 (en)* | 1999-02-19 | 2008-11-18 | 3Com Corporation | Method and system for monitoring and management of the performance of real-time networks |
| US7478151B1 (en)* | 2003-01-23 | 2009-01-13 | Gomez, Inc. | System and method for monitoring global network performance |
| US20090182825A1 (en)* | 2007-07-04 | 2009-07-16 | International Business Machines Corporation | Method and system for providing source information of data being published |
| WO2009134945A2 (en) | 2008-04-29 | 2009-11-05 | Tibco Software Inc. | Service performance manager with obligation-bound service level agreements and patterns for mitigation and autoprotection |
| US7853472B2 (en)* | 2005-07-15 | 2010-12-14 | Saudi Arabian Oil Company | System, program product, and methods for managing contract procurement |
| US8255525B2 (en)* | 2009-08-19 | 2012-08-28 | International Business Machines Corporation | System and method for circuit and path based event correlation |
| US8271633B2 (en)* | 2009-04-16 | 2012-09-18 | Exfo Service Assurance Inc. | Correlating network transactions |
Family Cites Families (2)
| Publication number | Priority date | Publication date | Assignee | Title |
|---|---|---|---|---|
| US7382371B1 (en)* | 2003-11-10 | 2008-06-03 | Compuware Corporation | Visual landscape for multi-tiered application environment component interactions |
| US20060026467A1 (en)* | 2004-07-30 | 2006-02-02 | Smadar Nehab | Method and apparatus for automatically discovering of application errors as a predictive metric for the functional health of enterprise applications |
- 2010
- 2010-08-31USUS12/872,936patent/US8489735B2/enactiveActive
- 2011
- 2011-08-24EPEP11006927Apatent/EP2423817A1/ennot_activeWithdrawn
Patent Citations (26)
| Publication number | Priority date | Publication date | Assignee | Title |
|---|---|---|---|---|
| US5845062A (en)* | 1996-06-25 | 1998-12-01 | Mci Communications Corporation | System and method for monitoring network elements organized in data communication channel groups with craft interface ports |
| US5913036A (en)* | 1996-06-28 | 1999-06-15 | Mci Communications Corporation | Raw performance monitoring correlated problem alert signals |
| US5974237A (en)* | 1996-12-18 | 1999-10-26 | Northern Telecom Limited | Communications network monitoring |
| US7453815B1 (en)* | 1999-02-19 | 2008-11-18 | 3Com Corporation | Method and system for monitoring and management of the performance of real-time networks |
| US20060212445A1 (en)* | 1999-11-03 | 2006-09-21 | Mads Rydahl | Method, system, and computer readable medium for managing resource links |
| US7216162B2 (en)* | 2000-05-24 | 2007-05-08 | Verint Systems Ltd. | Method of surveilling internet communication |
| US20070234426A1 (en)* | 2000-06-23 | 2007-10-04 | Rajeev Khanolkar | Comprehensive security structure platform for network managers |
| US7143161B2 (en)* | 2001-11-16 | 2006-11-28 | Nortel Networks Limited | Tandem connection monitoring parallel processing |
| US7478151B1 (en)* | 2003-01-23 | 2009-01-13 | Gomez, Inc. | System and method for monitoring global network performance |
| EP1475734A2 (en) | 2003-03-31 | 2004-11-10 | Sap Ag | Alert Notification Management |
| US7313324B1 (en)* | 2003-07-25 | 2007-12-25 | At&T Corp. | SONET outage impact measurement technique |
| US20060085376A1 (en)* | 2004-10-14 | 2006-04-20 | The Trizetto Group, Inc. | Centralized management of software adapters |
| US20060126801A1 (en) | 2004-12-14 | 2006-06-15 | Sbc Knowledge Ventures, L.P. | Trouble ticket monitoring system having internet enabled and web-based graphical user interface to trouble ticket workload management systems |
| US20060253566A1 (en)* | 2005-03-28 | 2006-11-09 | Dimitris Stassinopoulos | Method and system for managing a distributed network of network monitoring devices |
| US20060233311A1 (en)* | 2005-04-14 | 2006-10-19 | Mci, Inc. | Method and system for processing fault alarms and trouble tickets in a managed network services system |
| US20060265418A1 (en)* | 2005-05-23 | 2006-11-23 | Board Of Regents, The University Of Texas System | System, program product, and methods for managing events |
| US20070011317A1 (en)* | 2005-07-08 | 2007-01-11 | Gordon Brandyburg | Methods and apparatus for analyzing and management of application traffic on networks |
| US7804787B2 (en)* | 2005-07-08 | 2010-09-28 | Fluke Corporation | Methods and apparatus for analyzing and management of application traffic on networks |
| US7853472B2 (en)* | 2005-07-15 | 2010-12-14 | Saudi Arabian Oil Company | System, program product, and methods for managing contract procurement |
| US20070066297A1 (en)* | 2005-09-20 | 2007-03-22 | Ghobad Heidari-Bateni | Network monitoring system and method |
| US20070240061A1 (en)* | 2006-03-29 | 2007-10-11 | Lucent Technologies Inc. | Method for distributed tracking of approximate join size and related summaries |
| US20090182825A1 (en)* | 2007-07-04 | 2009-07-16 | International Business Machines Corporation | Method and system for providing source information of data being published |
| WO2009134945A2 (en) | 2008-04-29 | 2009-11-05 | Tibco Software Inc. | Service performance manager with obligation-bound service level agreements and patterns for mitigation and autoprotection |
| US20100083145A1 (en)* | 2008-04-29 | 2010-04-01 | Tibco Software Inc. | Service Performance Manager with Obligation-Bound Service Level Agreements and Patterns for Mitigation and Autoprotection |
| US8271633B2 (en)* | 2009-04-16 | 2012-09-18 | Exfo Service Assurance Inc. | Correlating network transactions |
| US8255525B2 (en)* | 2009-08-19 | 2012-08-28 | International Business Machines Corporation | System and method for circuit and path based event correlation |
Non-Patent Citations (1)
| Title |
|---|
| Extended European Search Report, dated Dec. 27, 2011, from corresponding European Patent Application No. 11006927.5. |
Cited By (15)
| Publication number | Priority date | Publication date | Assignee | Title |
|---|---|---|---|---|
| US8700726B2 (en)* | 2009-12-15 | 2014-04-15 | Symantec Corporation | Storage replication systems and methods |
| US20110145357A1 (en)* | 2009-12-15 | 2011-06-16 | Symantec Corporation | Storage replication systems and methods |
| US20130132940A1 (en)* | 2011-11-17 | 2013-05-23 | Andreas Meier | Adaptation of data flow of one or multiple systems within a system landscape |
| US9298478B2 (en)* | 2011-11-17 | 2016-03-29 | Sap Se | Adaptation of data flow of one or multiple systems within a system landscape |
| US9582838B1 (en) | 2013-03-01 | 2017-02-28 | Health Care Systems, Inc. | Targeted surveillance system with mini-screen dashboard |
| US20140282010A1 (en)* | 2013-03-15 | 2014-09-18 | Bmc Software, Inc. | Story-mode user interface |
| US10824993B2 (en)* | 2013-03-15 | 2020-11-03 | Bmc Software, Inc. | Story-mode user interface |
| US10108711B2 (en)* | 2014-07-16 | 2018-10-23 | Sap Se | OData enablement for personal object worklists |
| US20160019295A1 (en)* | 2014-07-16 | 2016-01-21 | Otto Makris | Odata enablement for personal object worklists |
| US9509574B2 (en)* | 2015-04-03 | 2016-11-29 | Illumio, Inc. | End-to-end policy enforcement in the presence of a traffic midpoint device |
| US20180159748A1 (en)* | 2015-04-03 | 2018-06-07 | Illumio, Inc. | End-To-End Policy Enforcement in the Presence of a Traffic Midpoint Device |
| US10476762B2 (en)* | 2015-04-03 | 2019-11-12 | Ilumio, Inc. | End-to-end policy enforcement in the presence of a traffic midpoint device |
| US10819590B2 (en)* | 2015-04-03 | 2020-10-27 | Illumio, Inc. | End-to-end policy enforcement in the presence of a traffic midpoint device |
| US9912554B2 (en)* | 2015-04-03 | 2018-03-06 | Illumio, Inc. | End-to-end policy enforcement in the presence of a traffic midpoint device |
| US12250467B2 (en) | 2017-03-08 | 2025-03-11 | Samsung Electronics Co., Ltd. | Event detecting device including an event signal generator and an output signal generator configured to generate an output signal by combining event signals |
Also Published As
| Publication number | Publication date |
|---|---|
| US20120054334A1 (en) | 2012-03-01 |
| EP2423817A1 (en) | 2012-02-29 |
Similar Documents
| Publication | Publication Date | Title |
|---|---|---|
| US8489735B2 (en) | Central cross-system PI monitoring dashboard | |
| AU2020203653B2 (en) | Integrated monitoring and control of processing environment | |
| US8826077B2 (en) | Defining a computer recovery process that matches the scope of outage including determining a root cause and performing escalated recovery operations | |
| US8751283B2 (en) | Defining and using templates in configuring information technology environments | |
| US8219974B2 (en) | Enforcing legal holds of heterogeneous objects for litigation | |
| US8346931B2 (en) | Conditional computer runtime control of an information technology environment based on pairing constructs | |
| US7856575B2 (en) | Collaborative troubleshooting computer systems using fault tree analysis | |
| US8763006B2 (en) | Dynamic generation of processes in computing environments | |
| Curbera et al. | Business provenance–a technology to increase traceability of end-to-end operations | |
| US7437686B1 (en) | Systems, methods and computer program products for graphical user interface presentation to implement filtering of a large unbounded hierarchy to avoid repetitive navigation | |
| US20080262860A1 (en) | System and Method for Supporting Software | |
| US20090150906A1 (en) | Automatic electronic discovery of heterogeneous objects for litigation | |
| US20090150431A1 (en) | Managing relationships of heterogeneous objects | |
| US20090172769A1 (en) | Programmatic validation in an information technology environment | |
| US20090171706A1 (en) | Computer pattern system environment supporting business resiliency | |
| US9411969B2 (en) | System and method of assessing data protection status of data protection resources | |
| US7343529B1 (en) | Automatic error and corrective action reporting system for a network storage appliance | |
| JP2009245285A (en) | Computer system for managing progress of plurality of tasks, and its method and computer program | |
| JP2010009552A (en) | Computer system for backing up software constituent elements, method therefor, and computer program | |
| EP4016306A1 (en) | Automatic discovery of executed processes | |
| CN114116429A (en) | Abnormal log collection method, device, equipment, medium and product | |
| US7162390B2 (en) | Framework for collecting, storing, and analyzing system metrics | |
| US9448998B1 (en) | Systems and methods for monitoring multiple heterogeneous software applications | |
| US20170285923A1 (en) | Multi-perspective application components dependencies | |
| WO2006110235A2 (en) | Playbook automation |
Legal Events
| Date | Code | Title | Description |
|---|---|---|---|
| AS | Assignment | Owner name:SAP AG, GERMANY Free format text:ASSIGNMENT OF ASSIGNORS INTEREST;ASSIGNOR:BEFORT, WALDEMAR;REEL/FRAME:025059/0744 Effective date:20100925 | |
| FEPP | Fee payment procedure | Free format text:PAYOR NUMBER ASSIGNED (ORIGINAL EVENT CODE: ASPN); ENTITY STATUS OF PATENT OWNER: LARGE ENTITY | |
| STCF | Information on status: patent grant | Free format text:PATENTED CASE | |
| AS | Assignment | Owner name:SAP SE, GERMANY Free format text:CHANGE OF NAME;ASSIGNOR:SAP AG;REEL/FRAME:033625/0334 Effective date:20140707 | |
| FEPP | Fee payment procedure | Free format text:PAYER NUMBER DE-ASSIGNED (ORIGINAL EVENT CODE: RMPN); ENTITY STATUS OF PATENT OWNER: LARGE ENTITY Free format text:PAYOR NUMBER ASSIGNED (ORIGINAL EVENT CODE: ASPN); ENTITY STATUS OF PATENT OWNER: LARGE ENTITY | |
| FPAY | Fee payment | Year of fee payment:4 | |
| MAFP | Maintenance fee payment | Free format text:PAYMENT OF MAINTENANCE FEE, 8TH YEAR, LARGE ENTITY (ORIGINAL EVENT CODE: M1552); ENTITY STATUS OF PATENT OWNER: LARGE ENTITY Year of fee payment:8 | |
| MAFP | Maintenance fee payment | Free format text:PAYMENT OF MAINTENANCE FEE, 12TH YEAR, LARGE ENTITY (ORIGINAL EVENT CODE: M1553); ENTITY STATUS OF PATENT OWNER: LARGE ENTITY Year of fee payment:12 |