US8341540B1 - Visualizing object behavior - Google Patents
Visualizing object behaviorDownload PDFInfo
- Publication number
- US8341540B1 US8341540B1US12/365,093US36509309AUS8341540B1US 8341540 B1US8341540 B1US 8341540B1US 36509309 AUS36509309 AUS 36509309AUS 8341540 B1US8341540 B1US 8341540B1
- Authority
- US
- United States
- Prior art keywords
- node
- user
- indicium
- files
- sub
- Prior art date
- Legal status (The legal status is an assumption and is not a legal conclusion. Google has not performed a legal analysis and makes no representation as to the accuracy of the status listed.)
- Expired - Fee Related, expires
Links
Images


Classifications
- G—PHYSICS
- G06—COMPUTING OR CALCULATING; COUNTING
- G06F—ELECTRIC DIGITAL DATA PROCESSING
- G06F3/00—Input arrangements for transferring data to be processed into a form capable of being handled by the computer; Output arrangements for transferring data from processing unit to output unit, e.g. interface arrangements
- G06F3/01—Input arrangements or combined input and output arrangements for interaction between user and computer
- G06F3/048—Interaction techniques based on graphical user interfaces [GUI]
- G06F3/0481—Interaction techniques based on graphical user interfaces [GUI] based on specific properties of the displayed interaction object or a metaphor-based environment, e.g. interaction with desktop elements like windows or icons, or assisted by a cursor's changing behaviour or appearance
- G—PHYSICS
- G06—COMPUTING OR CALCULATING; COUNTING
- G06F—ELECTRIC DIGITAL DATA PROCESSING
- G06F16/00—Information retrieval; Database structures therefor; File system structures therefor
- G06F16/10—File systems; File servers
- G06F16/16—File or folder operations, e.g. details of user interfaces specifically adapted to file systems
- G06F16/168—Details of user interfaces specifically adapted to file systems, e.g. browsing and visualisation, 2d or 3d GUIs
- G—PHYSICS
- G06—COMPUTING OR CALCULATING; COUNTING
- G06F—ELECTRIC DIGITAL DATA PROCESSING
- G06F16/00—Information retrieval; Database structures therefor; File system structures therefor
- G06F16/90—Details of database functions independent of the retrieved data types
- G06F16/903—Querying
- G06F16/9038—Presentation of query results
- G—PHYSICS
- G06—COMPUTING OR CALCULATING; COUNTING
- G06F—ELECTRIC DIGITAL DATA PROCESSING
- G06F3/00—Input arrangements for transferring data to be processed into a form capable of being handled by the computer; Output arrangements for transferring data from processing unit to output unit, e.g. interface arrangements
- G06F3/01—Input arrangements or combined input and output arrangements for interaction between user and computer
- G06F3/048—Interaction techniques based on graphical user interfaces [GUI]
- G06F3/0481—Interaction techniques based on graphical user interfaces [GUI] based on specific properties of the displayed interaction object or a metaphor-based environment, e.g. interaction with desktop elements like windows or icons, or assisted by a cursor's changing behaviour or appearance
- G06F3/04812—Interaction techniques based on cursor appearance or behaviour, e.g. being affected by the presence of displayed objects
- G—PHYSICS
- G06—COMPUTING OR CALCULATING; COUNTING
- G06F—ELECTRIC DIGITAL DATA PROCESSING
- G06F2203/00—Indexing scheme relating to G06F3/00 - G06F3/048
- G06F2203/048—Indexing scheme relating to G06F3/048
- G06F2203/04803—Split screen, i.e. subdividing the display area or the window area into separate subareas
- G—PHYSICS
- G06—COMPUTING OR CALCULATING; COUNTING
- G06F—ELECTRIC DIGITAL DATA PROCESSING
- G06F2203/00—Indexing scheme relating to G06F3/00 - G06F3/048
- G06F2203/048—Indexing scheme relating to G06F3/048
- G06F2203/04806—Zoom, i.e. interaction techniques or interactors for controlling the zooming operation
Definitions
- Web analyticsis the measurement of the behaviors of visitors to a website. In an electronic commerce context, it refers to the measurement of which aspects of an entity's website work towards the business objectives; for example, which landing pages encourage people to make a purchase.
- Off-site web analyticsrefers to web measurement and analysis of a website's potential audience, visibility and level of interest in an electronic network, e.g., the Internet, as a whole.
- on-site web analyticsrefers to analyzing a visitor's journey once on a website, for example, specific landing pages.
- datais typically analyzed against key performance indicators to improve website performance, increase traffic to a website, etc.
- the two main technological approaches for collecting data to be analyzed by on-site web analytics softwareare the use of log-file analysis, page tagging, or both.
- the first methodlog-file analysis, reads the log-files in which the web server records all of its transactions.
- the second method, page tagginguses an embedded software script in a web page to notify a third party server when a page is rendered by a web browser.
- Both types of approachescollect data that can be processed to produce web traffic reports. Integrating such web analytics approaches into the server is gaining popularity due to increases in need for real-time or near real-time improvements in performance.
- FIG. 1is an illustrative graphical representation or visualization of the behavior of a small sample of users accessing a network resource.
- FIG. 2is an illustrative graphical representation or visualization of the behavior of a large sample of users accessing a network resource.
- FIG. 3is a block diagram depicting an illustrative networked environment in which a visualization service generates graphical representations of the behavior of users accessing a network resource such as the graphical representations depicted in FIGS. 1 and 2 .
- FIG. 4is a block diagram of a general architecture of a visualization server suitable for use in the networked environment depicted in FIG. 3 and for carrying out aspects of the visualization service.
- FIG. 5is an illustrative graphical representation or visualization of the behavior of a small sample of users accessing the network resource in which different attributes of users or users' behavior are highlighted.
- FIG. 6is a flow diagram of an illustrative routine implemented by the visualization service to generate path records based on user behavioral data.
- FIG. 7is a flow diagram of an illustrative routine implemented by the visualization service to generate a graphical representation or visualization based on the path records.
- FIG. 8is an illustrative graphical representation or visualization that includes state statistical data generated by the visualization service.
- FIG. 9is an illustrative graphical representation or visualization that includes user statistical data generated by the visualization service.
- FIG. 10is an illustrative graphical representation or visualization that reflects a possible fatal error in the network resource.
- FIG. 11is a pictorial diagram of a user interface tool known as a “scrubber bar” that enables selection and display of operational metrics for the network resource that are generated by the visualization service.
- FIG. 12illustrates graphical representations or visualizations that may be, upon selection of a state indicia included in the visualization, expanded or contracted to show the behavior of users at higher or lower state levels within the network resource.
- FIG. 13is an illustrative graphical representation or visualization that includes a display of the file or page a user may be accessing at a particular point in time.
- FIG. 14is an illustrative graphical representation or visualization of a user traversing a path within a single file accessed from the network resource.
- aspects of the present disclosurerelate to graphically representing or “visualizing” the behavior of users as they access a network resource, such as a website.
- a visualization serviceis described that generates a graphical representation or visualization of each user's behavior within the network resource.
- the visualization serviceprovides a dynamic visualization of each user accessing the network resource.
- each useris graphically represented in the visualization with an indicium, such as a point or dot.
- the visualization(and thus, the position of each indicium representing a user) is dynamically updated as each user accesses data files, such as web pages, from the network resource and thus, moves from state to state (or page to page) over time.
- the visualizationmay be generated in real-time or near real-time (referred to collectively herein as “real-time”) as the data upon which the visualization is generated is received.
- the datais typically live data as opposed to historical data.
- the visualizationmay be generated off-line, with a delay instituted after receiving the data or based on historical data.
- the visualization generated by the visualization servicemay include many users, individually represented with indicium, transitioning from one state to the next, illustrating the user's behavioral interaction with the network resource.
- Focusing on an individual user's behavior as the user accesses different data files from the network resourceenables a viewer to observe a particular user's experience with the network resource, while at the same time comparing that user to the rest of the users that are also accessing the network resource.
- This graphical representation of user trafficenables the viewer to see patterns in user behavior as well as abnormalities that may be affecting the performance of the network resource.
- the graphical representation generated by the visualization servicemay be applicable to any network resource and in a variety of environments.
- the graphical representationmay provide a work flow analysis of users accessing a network resource providing an electronic photo album sharing application; whereby the users sign in, create a new album name, upload photos to the new album, edit/organize their photos, send a link to the photos to their friends/family, and log-out of the application.
- the graphical representationmay provide a work flow analysis of users accessing an email application; whereby the users sign in, review their inbox, review their calendar, compose a new e-mail, and log-out of the email application.
- the graphical representationmay provide for an item flow analysis of physical objects moving to different physical locations.
- the physical objectsmay be items in a warehouse or letters in a postal system.
- the visualization servicegenerates statistical data relating to a path that each user follows as he or she accesses different files from the network resource.
- a user's pathmay include accessing: (1) a Sign In page, (2) a Product Review page, (3) a Checkout page, and (4) a Payment page.
- Statistical datamay be gathered during a user's traversal of such a path through the different files of the network resource and can include a variety of attributes associated with the user or the user's behavior. Accordingly, the visualization service may filter or highlight the graphical representation based on at least one attribute.
- the various states traversed by a usermay be organized into a hierarchical structure. Accordingly, the graphical representation generated by the visualization service may be, upon selection, expanded or contracted to show the behavior of users at higher or lower state levels within the network resource. While the visualization service is described below as visualizing the behavior of users, e.g., accessing a network resource, the visualization service may also be used to visualize the behavior of any animate or inanimate object that is capable of transitioning between states. Nonlimiting examples of such objects may include packages, containers, items of inventory, etc.
- the visualization servicemay also be used to visualize the behavior of objects among one or more states associated with one or more physical locations, e.g., an item of inventory transitioning through a fulfillment center and/or being shipped to an address.
- the visualization servicemay also be used to visualize the behavior of objects among one or more states associated with a condition of the object, e.g., the condition of a perishable good, or the status conditions of network resource.
- the visualization servicemay be used to visualize the behavior of objects among mixed states, e.g., physical states and conditions states.
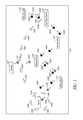
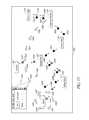
- FIG. 1is an illustrative graphical representation or visualization 105 generated by a visualization service of the behavior of a small sample of users (e.g., users 150 , 155 and 160 ) accessing a network resource. More specifically, as users access various files (e.g., web pages) from the network resource, the visualization service updates the graphical representation to depict the access of the user of one file after another. Thus, each file accessed by the user from the network resource can be referred to as a “state” to which the user transitions or traverses a path.
- a stateto which the user transitions or traverses a path.
- each useris graphically represented in the visualization 105 with a visual user indicium such as a dot or point, while each file the user accesses (or state to which the user transitions) is graphically represented by a state indicium, such as a circle, oval or square.
- a user indicium and/or a state indiciummay be an aural indicium such as a tone or series of tones.
- each user 150 , 155 and 160is graphically represented in the visualization 105 as a dot, while each state to which a user may transition in the network resource is represented as an oval.
- the network resource in the illustrated exampleis a retail website from which a user may browse, select, and purchase items offered for sale.
- the visualization 105includes a plurality of states associated with a retail website, such as a Sign In state 110 , an Address Select state 115 , a Shipping Select state 120 , a Payment Select state 125 , a Single Page Checkout state 130 , a Thank You Page state 135 , and an Abandon state 140 .
- states associated with a retail websitesuch as a Sign In state 110 , an Address Select state 115 , a Shipping Select state 120 , a Payment Select state 125 , a Single Page Checkout state 130 , a Thank You Page state 135 , and an Abandon state 140 .
- FIG. 1is used for purposes of discussion, and thus, should not be construed
- FIG. 1illustrates the behaviors of three users 150 , 155 , and 160 as they proceed from the Sign In state 110 to their respective final destination state.
- the three users 150 , 155 , and 160traverse different paths between states, as indicated by arrows associated with each user's indicium.
- the visualization 105is typically generated dynamically, the user indicia will appear as moving along a path from one state to another. For example, as user 150 spends time accessing the Sign In page for the network resource, the user 150 is dynamically displayed as looping around the Sign In state 110 , as illustrated statically in FIG. 1 by user indicia 150 A to 150 F and the associated arrows.
- the user 150After spending some time accessing the Sign In page, the user 150 is dynamically displayed as traversing a path to the Single Page Checkout state 130 , as shown by user indicia 150 G to 150 M and associated arrows, presumably to complete a purchase. The user 150 then traverses a path to the Thank You Page state 135 , as illustrated by the movement of user indicia 150 N to 150 P and associated arrows. Accordingly, the user 150 accesses a Thank You page from the network resource which thanks the user for completing the purchase.
- the user 155begins at the Sign In state 110 , and then transitions to the Address Select state 115 , as illustrated by the movement of user indicia 155 A to 155 B.
- the usertraverses a path to the Shipping Select state 120 , as illustrated by the movement of user indicia 155 C to 155 D.
- the userexits the network resource.
- the user 155traverses a path to the Abandon state 140 , as illustrated by the movement of user indicia 155 E to 155 F. If the transition to the Abandon state 140 is not expected, the visualization 105 may then provide the user with an indication that an issue exists with network resource performance at the Shipping Select state 120 .
- user 160begins at the Sign In state 110 and then traverses a path to the Address Select state 115 , as illustrated by the movement of user indicia 160 A to 160 B. The user 160 then traverses a path to the Shipping Select state 120 , as illustrated by the movement of user indicia 160 C to 160 D. After the user 160 has selected a shipping method, the user 160 traverses a path to the Payment Select state 125 , as illustrated by the movement from of user indicia 160 E to 160 F. Upon access of a Payment Selection page from the network resource, the user may select the desired method of payment for a purchase.
- the user 160traverses a path to the Single Page Checkout state 130 , as illustrated by the movement of user indicia 160 G to 160 H, to complete the purchase from a Checkout page.
- the user 160traverses a path to the Thank You Page state 135 , as illustrated by the movement of user indicia 1601 to 160 J.
- the velocity at which the user indicia for users 150 , 155 , and 160 move between states during dynamic visualizationmay be fixed or adjustable.
- the user indicia for users that are transitioning more quickly from one state to anotherare shown as moving at higher velocities between states than the user indicia for users who are not quickly accessing different files from the network resource.
- the relative velocities at which different user indicia traverse the same pathmay reveal additional pertinent information regarding the user and/or the network resource.
- a viewermay configure the visualization service to speed or slow the velocity at which the user indicia move from one state to another.
- the velocity at which a user indicium transitions between statesis determined based on the times at which the user accessed the corresponding states.
- the users 150 , 155 , and 160may transition directly from one state to another during visualization. However, a user may also remain in a particular state for several expected or unexpected reasons. For example, as depicted in FIG. 1 , user 150 is graphically represented as looping around the Sign In state 110 while accessing a Sign In page from the network resource. One reason for this behavior may be that user 150 forgot his/her password and was presented with the same Sign In page for re-input, therefore creating a loop representation within the visualization 105 . An alternative reason for this behavior may be that user 150 encountered an error on the Sign In page or does not know how to properly access the network resource using the Sign In page, e.g., due to unclear instructions, confusing layout, etc.
- a statistically significant number of usersmay indicate an issue with the performance of the page or the network resource at this particular state. Accordingly, this may lead a provider of the network resource to review the page at issue to ensure that the page is operating properly and/or to make improvements to the page and/or the network resource. If the same user is shown to be looping around a particular state, it may indicate that the user is in need of assistance. Accordingly, this may lead a provider of the network resource to offer assistance to the user, e.g., through electronic messaging (via electronic mail message, text message, pop-up window, etc.), voice messaging, etc.
- such messagesmay include a selectable control, such as a “click to call” button or an embedded hyperlink, that would initiate or otherwise facilitate interaction between, for example, a customer service representative for the network resource and the user.
- a selectable controlsuch as a “click to call” button or an embedded hyperlink
- Such interactionmay be initiated using a voice over IP (“VOIP”) communication link with the user.
- VOIPvoice over IP
- the visualization 105may utilize markings or color in order to differentiate between different users 150 , 155 , and 160 , different states, different paths of users among states, etc.
- colormay be applied in the visualization 105 to indicate attributes related to either states or users. Accordingly, in one embodiment, color is utilized to highlight different user paths. Thus, the color green may be used to represent paths that lead to the Thank You state 135 , whereas the color red may be applied to signify paths that lead to the Abandon state 140 .
- colormay be utilized in order to differentiate between different states. For example, the Sign In state 110 may be indicated in blue, while the Address Select state 115 may be indicated in green.
- colormay be utilized in the visualization 105 in order to represent the paths of users suspected in conducting fraudulent transactions.
- a pathmay be highlighted if an anomaly is detected in association with the network resource.
- the highlightmay be, for example, a visual notification displayed to the user in proximity to the state and/or user indicia to which it applies or an aural notification output to the user.
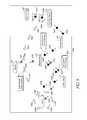
- FIG. 2is a “snapshot” of an illustrative visualization 200 of the behavior of a large sample of users accessing a network resource.
- Each useris represented in FIG. 2 by a user indicium, such as a dot or point.
- the visualization 200graphically represents a large number of users transitioning from one state to the next within the network resource at a particular point in time.
- the user indiciawill appear in the visualization 200 as moving along a path from one state to another over time at different velocities according to, e.g., the speed at which each user is transitioning from one state to another.
- the visualization 200graphically represents users remaining at a particular state as looping back to the same state and users transitioning from one state to another as or traversing an arced path to the next state.
- any type or style of display mechanismmay be implemented to visually depict user behavior without departing from the scope of the present disclosure.
- the visualization 200 generated by the visualization servicecan reveal patterns in user behavior as well as abnormalities that may be affecting the performance of the network resource. For example, given the large number and density of users looping around the Single Page Checkout state 202 and then traversing a path to the Abandon state 204 , it may be possible that users are experiencing difficulty completing a purchase at the Single Page Checkout page and are thus, exiting the network resource. For the provider of the network resource (i.e., an electronic commerce website in the illustrated example), such user behavior is of concern as it indicates possible lost sales due to a potential issue related to the Single Page Checkout page. A resulting investigation may reveal, for example, an operational error on the Single Page Checkout page that prohibits users from completing purchase. Corrective action may then be taken, thus improving the performance of the page and/or the network resource.
- the provider of the network resourcei.e., an electronic commerce website in the illustrated example
- a resulting investigationmay reveal, for example, an operational error on the Single Page Checkout page that prohibits users from completing purchase.
- FIG. 3is a block diagram depicting an illustrative networked environment 300 in which a visualization service 355 generates graphical representations or visualizations of the behavior of users accessing a network resource such as that depicted in FIG. 2 .
- the illustrative networked environment 300 of FIG. 3includes one or more client computing devices 305 , 310 , and 315 .
- the computing devicesmay be laptop or tablet computers, personal computers, personal digital assistants (PDAs), hybrid PDA/mobile phones, mobile phones, electronic book readers, workstations, and the like.
- PDAspersonal digital assistants
- the client computing devices 305 , 310 , and 315communicate via a communication network 320 , such as the Internet, with a network resource 325 (e.g., a website used to conduct electronic shopping).
- the communication network 320may be a wired and/or wireless communication network, a cable network, a local area network (LAN), a wide area network (WAN), a collection of networks such as the Internet, etc. Because protocols for network communications such as TCP/IP are well-known to those skilled in the art of computer networks, further description of these protocols and other methods/devices used to implement the communication network 320 are not provided herein.
- the network resource 325may be a group of related documents and associated files, scripts, and data stores that is provided by a server in response to requests from one or more client computing devices 305 , 310 , and 315 , each executing a browser or other navigation application or tool.
- the datais served to the client computing devices in the form of one or more web pages.
- a web pagemay consist of an HTML file, with associated files for graphics, scripts, etc., in a particular directory on a particular server (and thus, the file is identifiable by a Uniform Resource Identifier (“URI”)).
- URIUniform Resource Identifier
- a web pageincludes links to other web pages and/or objects (e.g., scripts, content, images, etc.).
- the client computing devices 305 , 310 , and 315utilize the communication network 320 to access files or web pages from the network resource 325 .
- Such time-stamped user activity datamay be logged by an activities log 340 in communication with the network resource 325 in order to provide a session history that can be used to analyze user behavior and/or diagnose network resource issues. Activities log data may then be provided to the visualization service 355 , which may parse and model the data to generate a visualization, such as those described above, of the users' access of the network resource 325 .
- at least one client computing device 310is a thin client executing, e.g., only a browser, in order to communicate with the network resource 325 .
- the network resource 325may include server side scripting language or programs to capture user activity data and transmit such data to the visualization service 355 in order to generate a visualization such as that shown in FIG. 2 .
- additional user behavioral datasuch as time-stamped user browse histories and user purchase histories, may be stored in a data store 330 of behavioral data accessible by the network resource 325 .
- the networked resource 325maintains time-stamped item browse histories and purchase histories of users in a behavioral data data-store 330 .
- a user browse historyidentifies items selected by the user for viewing, and indicates the date and time such items were viewed by the user.
- a user purchase historymay identify all of the items purchased by the user, together with an associated dataset of purchase information.
- the item browse and purchase histories of the usermay be maintained in any suitable format (log, database, event history dataset, etc.), and may be stored separately from each other and from other types of user activity data.
- the behavioral data data store 330may include data obtained from external sources.
- user activity datamay additionally be acquired from third party network resources, and/or from browser toolbars (not shown) that report user browsing activities.
- the user behavioral datamay be provided to the visualization service 355 , which may parse and model the data to generate a visualization, such as those described above, of the users' access of the network resource 325 .
- the network resource 325provides users access to catalog information related to items that may be browsed and/or purchased, which catalog information may be stored in an item data store 335 .
- the itemsmay include consumer electronics products, household appliances; books, music and video titles in physical or downloadable form, magazine, and other subscriptions, etc., and may be arranged within a hierarchy of categories to facilitate browsing of the catalog. Accordingly, many different items may be represented in the item data store 335 .
- the networked environment 300also includes a visualization service 355 that may acquire data from the activities log 340 , the behavioral data data store 330 , and other sources, such as JavaScript (not shown) embedded on a thin client computing device, in order to generate a visualization of user behavioral data.
- the process of aggregating data from a plurality of sourcesmay be done dynamically, without disturbing normal operations (e.g., “on the fly”) or in an off-line process.
- the visualization service 355may aggregate extremely large data sets relating to network resource traffic and produce a visualization of user behavioral data that enables a viewer to identify information and/or conditions relevant to network resource performance or user need.
- the visualization service 355may store the aggregated data in a data store 365 of time series data described in more detail below.
- the networked environment 300 depicted in FIG. 3is illustrated as a distributed computer environment including several computer systems that are interconnected using one or more computer networks. However, it will be appreciated by those skilled in the art that the networked environment 300 could have fewer or greater components than are illustrated in FIG. 3 . For example, the networked environment 300 could include various web services components and/or peer-to-peer network configurations. Thus, the depiction of the networked environment in FIG. 3 should be taken as illustrative and not limiting to the present disclosure.
- FIG. 4is a block diagram of a general architecture of a visualization server 445 suitable for implementing a visualization service 355 . While the visualization service 355 , as illustrated in FIG. 4 , is depicted as implemented by a single computing device (i.e., visualization server 445 ), this is illustrative only. In an actual embodiment, the visualization service 355 may be embodied in a plurality of visualization servers 445 , each executing an instance of the visualization service.
- the general architecture of the visualization server 445 depicted in FIG. 4includes an arrangement of computer hardware and software components that may be used to implement the visualization service 355 .
- the visualization server 445may include many more (or fewer) components than those shown in FIG. 4 . It is not necessary, however, that all of these generally conventional components be shown in order to provide an enabling disclosure.
- the visualization server 445includes a network interface 410 , a processing unit 405 , an input/output interface 415 , and a computer readable medium drive 420 , all of which may communicate with one another by way of a communication bus.
- the network interface 410may provide connectivity to the communication network 320 and/or other networks or computing systems.
- the processing unit 405may thus receive information and instructions from other computing systems such as client computing devices 305 , 310 , and 315 via the communication network 320 .
- the processing unit 405may also communicate to and from a memory 450 .
- the input/output device interface 415may accept input from device such as a keyboard, mouse, digital pen, etc (not shown).
- the memory 450contains computer program instructions that the processing unit 405 executes in order to operate the visualization service 355 .
- the memorygenerally includes RAM, ROM, and/or other persistent memory.
- the memory 450may store an operating system 430 that provides computer program instructions for use by the processing unit 405 in the general administration and operation of the visualization server 345 .
- the memory 450may further include computer program instructions and other information for implementing features of the visualization service 355 .
- the memory 450includes a user interface module 425 that generates user interfaces (and/or instructions therefor) including the visualizations such as those depicted in FIG. 2 .
- the memory 450contains computer program instructions for implementing the visualization service 355 , which instructions are discussed in more detail below in connection with FIG. 6 and FIG. 7 .
- the visualization service 355may include a parser component 457 and a modeling component 456 .
- the parser 457may be configured to parse user behavioral data received from the network resource 325 and generate a path record for each user that describes the path traversed by the user within the network resource 325 . More specifically, the parser 457 may reconstruct the path traversed by the user within the network resource 325 based on session data obtained, for example, from the activities log 340 or the behavioral data data store 330 .
- the parser 457may be configured to preprocess the user behavioral data received from the network resource 325 to remove redundant or irrelevant information and sort/organize the remaining data.
- the modeling component 456may be configured to read the path records preprocessed by the parser 457 and generate a visualization of the user's behavior over time while accessing the network resource 325 .
- the visualization server 345may optionally be connected to a display 360 to render the graphical representations or visualizations generated by the visualization service 355 .
- the visualization service 355may also provide visualizations to external devices by means of, for example, a web services interface.
- a web service interfacepermits an external device the ability to establish a communication connection with an analytics service provider.
- the analytics service providermay request access or receipt of user behavioral data form the external device and/or other sources in order to generate a graphical representation and provide it to the external device.
- the web services interfacemay permit an external device to transfer or upload a file and receive a graphical representation of the data within the transferred or uploaded file.
- the graphical representation provided to the client devicemay be a multimedia file that is transmitted to the external device. As those skilled in the art will appreciate, the multimedia file may be downloaded or streamed to the external device.
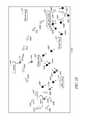
- FIG. 5is an illustrative graphical representation or visualization of the behavior of a small sample of users accessing the network resource 325 in which different attributes of users or user behavior are highlighted. Similar to FIG. 1 , FIG. 5 illustrates the behavior of three users 150 , 155 and 160 as they traverse different paths among a Sign In state 110 , an Address Select state 115 , etc. of the network resource 325 . As depicted in FIG. 5 , the user indicia for users 150 , 155 , and 160 are represented using different hash marks. In one embodiment, a viewer or system administrator selects the highlight (e.g., hash marks, color, prominence, etc.) to be applied to the user/user indicia in order to gain more insight from the graphical representation.
- the highlighte.g., hash marks, color, prominence, etc.
- user 150is identified as an “existing customer” 510 , and thus, the corresponding user indicia (e.g., user indicia 150 A-P) are a clear dot; user 155 is identified as a “new customer” 515 , and thus, the corresponding user indicia (e.g., user indicia 155 A- 155 F) are a cross-hatched dot; and user 160 is identified as a “fraud customer” 520 , and thus, the corresponding user indicia (e.g., user indicia 160 A- 160 J) are a solid dot.
- the paths followed by “existing customers” 510may be compared to the paths followed by “new customers” 515 , for example, in order to the compare the differences in behaviors among such users.
- highlighting of user indicia within a graphical representationis based upon attributes associated with each user.
- an attributemay be related to the user, e.g., it may describe the user's behavior or an aspect of the user, anything related to the user or user's behavior, or anything that can be correlated to the user or user's behavior.
- attributes associated with a user or a user's behaviormay include type of user, age of user, prior purchase amount for user, purchase total for user, type of credit card selected by user, etc.
- the visualization service 355may highlight attributes of users using different methods, such as use of different colors, shapes, prominence, sizes, etc. in order to reveal desired information or trends. For example, paths of users making “high value purchases” may be displayed more prominently than paths of users making “low value purchases.”
- the visualization service 355may also filter the user behavioral data upon which the visualization is generated based on a specific attribute. For example, the visualization service 355 may filter the user behavioral data based on type of customer and thus isolate only the paths traversed by “new customers” 515 for display in the visualization. In yet another example, the visualization service 355 may filter the user behavioral data based on age of customer, and thus only display (or display in a different color, for example) the paths traversed by users between the ages of 18 and 25 in the visualization. Those skilled in the art will appreciate that one or more attributes may be selected for the purposes of filtering and that the one or more attributes may be selected manually (e.g., by the viewer or a system administrator) or automatically (e.g., by default).
- FIG. 6is a flow diagram of an illustrative routine implemented by the visualization service 355 to generate path records based on user behavioral data. The process begins at block 605 , where the visualization service 355 receives user behavioral data from the network resource 325 .
- the behavioral datamay be obtained from one or more of the activities log 340 , the behavior data data store 330 , executable programs (not shown) embedded in one of the client computing devices 305 , 310 , or 315 , etc.
- the behavioral data receivedis sorted by the object ID for each user.
- the sorted datais parsed in order to select a current object ID for a user.
- the sorted datais parsed and the current object ID is selected by the parser component 457 of the visualization service 355 .
- the visualization service 355determines if a path record exists for the current object ID by parsing the sorted data to identify a path record associated with the current object ID.
- a path recordis created.
- the path recordmay be created from the data obtained from the network resource 325 .
- datamay include, for example, log entries, each of which indicates a file accessed by the user from the network resource (i.e., a state) and a time at which the user accessed the file.
- the data received by the visualization service 355may include one or more tuples sorted by timestamp, each tuple including an object ID, timestamp, and state.
- a “state”may represent the file that was accessed by the user having the object ID at a specific point in time.
- path recordsidentifies the files that a particular user accesses over time (e.g., in a session).
- path recordsmay also include attributes associated with the user or the user's behavior as discussed above. Such a path record may be described as follows: [object ID; time(1), state(1); time(2), state(2); . . . time(n), state(n); . . . attribute(a); attribute(b); (attribute(c), . . . ].
- the visualization service 355appends a new time/state pair for the user to the existing path record for the object ID. Once created or appended, the path record is stored in the time series data data store 365 for further use by the visualization service 355 .
- the visualization service 355determines if the user identified by the current object ID has reached an end state. In other words, the visualization service 355 determines if the user has ended his or her session with the network resource 325 (e.g., by exiting the network resource, timing out from the network resource, etc.). For example, in one embodiment, after a threshold time value (e.g., ten minutes) is exceeded, an abandon request is injected into the current path record to force an end state for a current object ID.
- a threshold time valuee.g., ten minutes
- an abandon requestis injected into the current path record to force an end state for a current object ID.
- the threshold time value applied by the visualization service 355may be pre-set or it may be configured by the viewer or a system administrator.
- a path recordmay indicate that the user identified by the current object ID has signed out of the network resource 325 and thus, reached an end state. In such cases, the path record is marked as closed at block 645 . Closed path records may be discarded by the visualization service 355 once the visualization has advanced past the last entry in the path record.
- the routinereturns to block 630 and another new time and state pair (and perhaps one or more attributes) is appended to the path record for the current object ID.
- the visualization service 355may choose to hold the current state of the current object ID and wait for more data to be received, rather than mark the path record as closed. In such cases, the routine may return to block 630 and append a new time and state pair to the path record once received.
- the visualization service 355selects the next object ID and returns to decision block 620 so that it may iterate through blocks 620 through 645 and build a path record for the next object ID.
- FIG. 7is a flow diagram of an illustrative routine implemented by the visualization service 355 to generate a graphical representation or visualization based on the path records generated by the routine implemented in FIG. 6 .
- the routineimplements an iterative process to render the visualization at time (t). Accordingly, as (t) changes, so does the visualization.
- the routinebegins at block 705 , where the visualization service 355 parses the path records stored in the time series data data store 365 for a current object ID.
- the visualization service 355finds the time and state pairs occurring “before” and “after” time (t).
- the visualization service 355generates an onscreen location for a state indicium corresponding to each identified “before” state and “after” state. More specifically, the visualization service 355 generates an X-Y coordinate on a pixel display at which a state indicium is to be displayed by the visualization service for each state in the path records found to occur before time (t) and for each state in the path records found to occur after time (t).
- the modeling component 456 of the visualization service 355identifies a parametric equation that can be used to model the user's transition (i.e., the path traversed by the user) from the “before” state to the “after” state.
- the parametric equationcan be either arbitrarily generated when needed, or preconfigured.
- a two dimensional parametric equationis applied in one embodiment to capture not only the offset of user indicia lengthwise along the path, but also the width across which the user indicia are displayed along the path. This is done so that user indicia do not substantially overlap in the visualization. Instead, the user indicia form a path in the visualization with a visual width.
- the parametric equations implemented by the visualization service 355generate a line of user indicia or an arc of user indicia.
- the viewer or a system administratormay configure the parametric equations, save them, and load them again for later use. Accordingly, this enables a viewer or system administrator to layout a particular visualization of interest for a particular network resource.
- the visualization service 355uses the parametric equation identified in block 720 , the visualization's current time and the “before” and “after” time (t), to determine the current onscreen location (e.g., an X-Y coordinate in a pixel display) for a user indicium associated with the user identified by the current object ID and display an image of the user indicium at this location.
- Blocks 705 through 725are continuously repeated to provide an animated visualization where users appear to be dynamically traversing paths from one state to another, (e.g., as he user's indicium traverses the line or arc generated by the parametric equation from one state indicium to another state indicium).
- the visualization service 355calculates a wide variety of statistics based on the path records stored in the time series data data store 365 .
- the statisticsmay be based on user traffic associated with a state, user traffic associated with a path between states, user traffic associated with a path from an originating state to a destination state, etc.
- the statisticsmay be absolute or relative, and in some embodiments the statistics may be based on attributes associated with users or users' behavior.
- the statisticsmay be generated on the fly, during post-processing, or off-line (e.g., in connection with a data warehouse query). If statistics are computed on the fly, then the statistics calculated by the visualization service 355 may be displayed with the visualization.
- the statisticsmay be displayed in proximity to a particular state or user included in the visualization.
- statistics related to a particular statecan be displayed upon selection by the viewer of the corresponding state indicium in the visualization.
- the visualization service 355may generate reports that can be viewed off-line. Regardless of how the statistics are generated and/or presented, viewers may use the statistics to identify patterns in, or instances of, user behavior that may reflect an anomaly at a particular point in time. Such information may be useful in detecting faults, taking corrective action, reallocating resources, providing customer service, etc.
- FIG. 8is an illustrative graphical representation or visualization 800 of a small sample of users accessing the network resource 325 .
- the visualization 800includes statistical data generated by the visualization service 355 that is related to one or more of the states included in the visualization 800 (e.g., Sign In state 110 , Address Select state 115 , etc.).
- a statistical data layersuch as state statistics view bar 805 , is associated with, and displayed in proximity to, each of the state indicia included in the visualization 800 .
- state statistic view barsmay be displayed only for a subset of states or for those states individually selected by a viewer.
- each state statistics view bar 805includes statistics related to the corresponding state, such as the sum of outgoing users from the state, the percentage of users transitioning from the given state to the Abandon state 140 , and the dollar sum of potential lost sales due to such abandonment.
- state statistics view bar 805includes the statistics of “4,138 outgoing traffic; 26% abandon; $30,000 lost potential.”
- a state statistics view barmay include any type of statistic that may be of possible interest to a viewer. Non-limiting examples of such statistics include “total hit count,” “total page views,” “bounce rate,” “percent exit,” “sum count,” “sum revenue,” “sum loss,” etc.
- FIG. 9is an illustrative graphical representation or visualization 900 of a small sample of users accessing the network resource 325 .
- the visualization 900includes statistical data generated by the visualization service 355 that is related to particular users represented in the visualization 900 .
- a user statistics view baris associated with, and displayed in proximity to, particular user indicia included in the visualization 900 .
- user statistics view bar 909includes attributes and statistics related to user 155 at user indicia 155 C, such as “New Customer; $45.15 Purchase Amount.”
- a user statistics view barmay include any type of statistic and/or attribute that may be of possible interest to a viewer. Non-limiting examples include “number of returns,” “total year to date purchase amount,” “average purchase amount,” “session duration,” “page view duration,” “page views per session,” etc.
- FIG. 10is another illustrative graphical representation or visualization 1000 of a small sample of users accessing the network resource 325 .
- visualization 1000reflects a possible fatal error in the network resource 325 .
- the visualization 1000includes similar states to those found in visualization 105 (e.g., Sign In state 110 , Address Select state 115 , etc.) and includes user indicia for three users 150 , 155 , and 160 as they proceed from the Sign In state 110 to their respective final destinations.
- users 150 and 160remain at the Single Page Checkout state 130 as indicated by their respective user indicia 150 R- 150 W and 160 L- 160 P looping around the Single Page Checkout state 130 .
- One possible reason for this loopingis that users 150 and 160 are refreshing their respective Single Page Checkout web pages after a modification in their order.
- another possible reason for this loopingis that a serious usability issue or systemic error has occurred that prevents the users 150 and 160 from transitioning to the Thank You page state 135 , as desired. In such cases, a fatal error may be determined to have occurred in the system.
- the visualization service 355may be used to provide insight to identify errors or bottlenecks from an operational standpoint.
- the visualization service 355may automatically detect and report abnormalities, areas of interest or out of the ordinary data to a viewer. In one embodiment, the visualization service 355 may provide a warning or an alert to a viewer in an event of a fatal error or abnormalities within a visualization. In other embodiments, the visualization service 355 may produce reports that detail the severity or explanation for the fatal error which in turn provides guidance on reallocation of operational resources to alleviate unexpected or undesirable interruptions and restore the expected operations of the system.
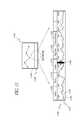
- FIG. 11is a pictorial diagram of a user interface tool that enables selection and display of operational metrics for the network resource that are generated by the visualization service 355 .
- the visualization service 355generates a split screen display 1145 having a visualization display 1150 and a metrics bar display 1155 .
- the metrics bar display 1155is shown in detail in FIG. 11 as a detail metrics bar display 1156 .
- the detail metrics bar display 1156includes multiple metrics controls, such as, an orders metrics control 1105 , an errors metrics control 1110 , a latency metrics control 1115 , a page views metrics control 1120 , an external events metrics control 1125 , etc.
- the metrics bar displaymay be configured to include any metrics control considered to be of interest to a viewer.
- the orders metrics control 1105is selected by the viewer.
- a spark linesuch as spark line 1130
- the visualization service 355may generate and display a spark line, such as spark line 1135 , representing errors occurring over a specific time segment within the metrics data stream 1157 .
- the visualization service 355may generate and display information regarding any latency concerns/issues experienced over a specific time segment within the metrics data stream 1157 .
- the visualization service 355may provide a spark line representing page views over a specific time segment within the metrics data stream 1157 .
- the visualization service 355may provide a short description of events related to the specific time segment under review, for example, “super bowl half time show.”
- the detail metric bar display 1156includes spark lines 1130 and 1135 corresponding to different selected metrics controls, e.g., order metrics control 1105 and errors metrics control 1110 . Accordingly, multiple spark lines may be provided by the detail metric bar display 1156 to illustrate relationships between different metrics, for example, an increase in errors may lead to a decrease in orders.
- the detail metric bar display 1156includes a scrubber bar 1140 that parses through the metrics data stream 1157 similar to a scrubber bar in video editing application. Accordingly, the detail metric bar display 1156 may enable the automatic/manual insertion of flags or markers where interesting data events occur within a metric data stream 1157 . For example, a metric data stream 1157 may be marked to reflect when maintenance upgrades begin and end. Accordingly, the metric data stream 1157 may be viewed during maintenance upgrades in order to capture unexpected events in the network resource 325 that may ultimately be due to maintenance upgrades, rather than, e.g., a typical user error.
- the visualization service 355enables comparison of user behavioral data by comparing a first time segment with a second time segment.
- the visualization service 355may provide a split screen display or an overlay display to compare visualizations of user behavioral data at different time segments. This comparison may be helpful in identifying changes in user behavior over different time segments, anomalies, performance issues, etc.
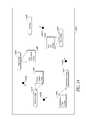
- FIG. 12illustrates graphical representations or visualizations generated by the visualization service 355 that may be, upon selection of a state indicia included in the visualization, expanded or contracted to show the behavior of users at higher or lower state levels within the network resource.
- the states available within a network resourcemay be organized hierarchically. Accordingly, the root node of the hierarchy may represent the entire network resource, child nodes or sub-nodes of the root node (or other sub-nodes) may represent different categories or sub-categories of states available in the network resource, and the leaf nodes of the hierarchy may represent individual states (e.g., files or web pages) available in the network resource.
- the visualization service 355may generate a visualization 1205 that reflects a path followed by a number of user among states A, B, C, D and E of the network resource.
- state Bis actually a sub-category of states associated with a sub-node in the hierarchical structure representing the network resource.
- the node indicium for state Bmay be expanded to show the state indicia for the states 1255 categorized under state B, e.g., states B 1 , B 2 , B 3 and B 4 , and the paths formed among such states.
- state Be.g., by “clicking” in proximity to the expanded view of states 1255
- contract or collapse the state indicia for the states 1255 back to the node indicium for state B in the visualization 1205e.g., by “clicking” on the state or “node” indicium for state B displayed in the visualization 1205 .
- the visualization service 355may be configured to expand or collapse a node within the hierarchical structure automatically, rather than upon selection of an associated node indicium.
- the node indicium for state Bmay be configured to automatically expand into the state indicia for states 1255 upon satisfaction of a threshold associated with the amount of user traffic to the states 1255 .
- the visualization service 355may be configured to automatically trigger expansion or contraction of a node based on any one of a number or combination of events without departing from the scope of the present disclosure.
- the visualization service 355may also provide capability to add or remove certain states from a visualization after rendering is provided.
- the Sign In state 110may be selected by a viewer to be removed from a visualization.
- the visualization service 355may also provide capability to permit a user (e.g., a viewer, system administrator, visualization designer, etc.) to manually or automatically move any or all states to a new location or position within the visualization.
- a usere.g., a viewer, system administrator, visualization designer, etc.
- a statemay be selected and dragged to a new physical location in the visualization.
- automated organization of statesmay be preconfigured to provide the most efficient organization within the visualization.
- the visualization service 355may also enable a permit manual or automatic categorization of one or more states into a hierarchical structure of states, such as that described above. For example, a state indicium for a state may be dragged and dropped by a user into a node indicium for a node in the hierarchy.
- the visualization service 355may provide the capability to expand or collapse the user indicia presented on a path. For example, if such a large number of users are transitioning between the same to states, the path between those states in the visualization may become so blurred as to degrade the quality of the visualization.
- the visualization service 355may be configures to automatically collapse the user indicia along such a path into a smaller subset (a subset including one or more) of user indicia, e.g., upon satisfaction of a user traffic threshold.
- the visualization service 355may enable a user to manually select user indicia for contraction or expansion.
- FIG. 13is an illustrative graphical representation or visualization 1300 of the behavior of a small sample of users accessing the network resource 325 .
- the visualization 900includes a display of the file or page a user may be accessing at that particular point in time.
- a viewermay locate and select an item detail control 1305 in the proximity of the user indicia associated with user 150 .
- the visualization service 355displays, within the visualization 1300 , a thumbnail image 1310 of the data file being viewed by user 150 at that particular point in time. Such a display may be helpful to customer support representatives in providing quick, one-on-one support to the user 150 .
- FIG. 14is an illustrative graphical representation or visualization 1400 of a user traversing a path within a single file (e.g., a web page) accessed from the network resource 355 .
- the visualization 1400includes states such as an Image on Page state 1405 , a Reviews on Page state 1410 , a Related-Items on Page state 1415 , a Price on Page state 1420 , and an Exit Page state 1430 .
- the user 1425traverses a path from one state within the page to another.
- user 1425traverses a path from the Image on Page state 1405 to the Reviews on Page state 1410 , as depicted by the movement of user indicia 1425 A.
- the user 1425then traverses a path from Reviews on Page state 1410 to Related-Items on Page state 1415 , as depicted by the movement of user indicia 1425 B, and so on.
- the graphical representationalso includes a statistical data layer of user behaviors within a single data file.
- the statistical data layerincludes statistics such as how long the user remained in the state and how many “clicks” the user made while in that state.
- state statistic view bar 1480reflects that user 1425 accessed the Image on Page state 1405 for 34 seconds and made two mouse clicks
- the state statistic view bar 1485reflects that that user 1425 remained at the Review on Page state 1410 for one minute and made two mouse clicks.
- the visualization 1400 of user behavior within a single pagemay be helpful in illustrating areas within a data file of most importance or relevance to users or for other reasons.
- All of the processes described hereinmay be embodied in, and fully automated via, software code modules executed by one or more general purpose computers or processors.
- the code modulesmay be stored in any type of computer-readable medium or other computer storage device. Some or all the methods may alternatively be embodied in specialized computer hardware.
- the components referred to hereinmay be implemented in hardware, software, firmware or a combination thereof.
Landscapes
- Engineering & Computer Science (AREA)
- Theoretical Computer Science (AREA)
- General Engineering & Computer Science (AREA)
- Physics & Mathematics (AREA)
- General Physics & Mathematics (AREA)
- Human Computer Interaction (AREA)
- Databases & Information Systems (AREA)
- Data Mining & Analysis (AREA)
- Computational Linguistics (AREA)
- User Interface Of Digital Computer (AREA)
Abstract
Description
Claims (21)
Priority Applications (1)
| Application Number | Priority Date | Filing Date | Title |
|---|---|---|---|
| US12/365,093US8341540B1 (en) | 2009-02-03 | 2009-02-03 | Visualizing object behavior |
Applications Claiming Priority (1)
| Application Number | Priority Date | Filing Date | Title |
|---|---|---|---|
| US12/365,093US8341540B1 (en) | 2009-02-03 | 2009-02-03 | Visualizing object behavior |
Publications (1)
| Publication Number | Publication Date |
|---|---|
| US8341540B1true US8341540B1 (en) | 2012-12-25 |
Family
ID=47359833
Family Applications (1)
| Application Number | Title | Priority Date | Filing Date |
|---|---|---|---|
| US12/365,093Expired - Fee RelatedUS8341540B1 (en) | 2009-02-03 | 2009-02-03 | Visualizing object behavior |
Country Status (1)
| Country | Link |
|---|---|
| US (1) | US8341540B1 (en) |
Cited By (31)
| Publication number | Priority date | Publication date | Assignee | Title |
|---|---|---|---|---|
| US20120158952A1 (en)* | 2010-12-21 | 2012-06-21 | Sitecore A/S | Method and a system for analysing traffic on a website by means of path analysis |
| US20130155068A1 (en)* | 2011-12-16 | 2013-06-20 | Palo Alto Research Center Incorporated | Generating a relationship visualization for nonhomogeneous entities |
| US20130246950A1 (en)* | 2012-03-18 | 2013-09-19 | Adobe Systems Incorporated | Methods and apparatus for creating overlays according to trending information |
| US20130297694A1 (en)* | 2009-12-01 | 2013-11-07 | Topsy Labs, Inc. | Systems and methods for interactive presentation and analysis of social media content collection over social networks |
| US8682816B2 (en)* | 2009-10-20 | 2014-03-25 | Google Inc. | Method and system for detecting anomalies in time series data |
| US20150339002A1 (en)* | 2014-05-21 | 2015-11-26 | Facebook, Inc. | Asynchronous Execution of Animation Tasks for a GUI |
| US9250759B1 (en)* | 2010-07-23 | 2016-02-02 | Amazon Technologies, Inc. | Visual representation of user-node interactions |
| US9459766B1 (en) | 2009-02-03 | 2016-10-04 | Amazon Technologies, Inc. | Visualizing object behavior |
| US10783534B2 (en) | 2015-06-09 | 2020-09-22 | Clickagy, LLC | Method, system and computer readable medium for creating a profile of a user based on user behavior |
| US20210158057A1 (en)* | 2019-11-26 | 2021-05-27 | Scanalytics, Inc. | Path analytics of people in a physical space using smart floor tiles |
| US11347699B2 (en) | 2018-12-20 | 2022-05-31 | Qumulo, Inc. | File system cache tiers |
| US11360936B2 (en) | 2018-06-08 | 2022-06-14 | Qumulo, Inc. | Managing per object snapshot coverage in filesystems |
| US11372819B1 (en) | 2021-01-28 | 2022-06-28 | Qumulo, Inc. | Replicating files in distributed file systems using object-based data storage |
| US11372735B2 (en) | 2020-01-28 | 2022-06-28 | Qumulo, Inc. | Recovery checkpoints for distributed file systems |
| US11435901B1 (en) | 2021-03-16 | 2022-09-06 | Qumulo, Inc. | Backup services for distributed file systems in cloud computing environments |
| US11461286B2 (en) | 2014-04-23 | 2022-10-04 | Qumulo, Inc. | Fair sampling in a hierarchical filesystem |
| US11461241B2 (en) | 2021-03-03 | 2022-10-04 | Qumulo, Inc. | Storage tier management for file systems |
| US11567660B2 (en) | 2021-03-16 | 2023-01-31 | Qumulo, Inc. | Managing cloud storage for distributed file systems |
| US11599508B1 (en) | 2022-01-31 | 2023-03-07 | Qumulo, Inc. | Integrating distributed file systems with object stores |
| US11669255B2 (en) | 2021-06-30 | 2023-06-06 | Qumulo, Inc. | Distributed resource caching by reallocation of storage caching using tokens and agents with non-depleted cache allocations |
| US11722150B1 (en) | 2022-09-28 | 2023-08-08 | Qumulo, Inc. | Error resistant write-ahead log |
| US11729269B1 (en) | 2022-10-26 | 2023-08-15 | Qumulo, Inc. | Bandwidth management in distributed file systems |
| US11734147B2 (en) | 2020-01-24 | 2023-08-22 | Qumulo Inc. | Predictive performance analysis for file systems |
| US11775481B2 (en)* | 2020-09-30 | 2023-10-03 | Qumulo, Inc. | User interfaces for managing distributed file systems |
| US11921677B1 (en) | 2023-11-07 | 2024-03-05 | Qumulo, Inc. | Sharing namespaces across file system clusters |
| US11934660B1 (en) | 2023-11-07 | 2024-03-19 | Qumulo, Inc. | Tiered data storage with ephemeral and persistent tiers |
| US11966592B1 (en) | 2022-11-29 | 2024-04-23 | Qumulo, Inc. | In-place erasure code transcoding for distributed file systems |
| US12222903B1 (en) | 2024-08-09 | 2025-02-11 | Qumulo, Inc. | Global namespaces for distributed file systems |
| US12292853B1 (en) | 2023-11-06 | 2025-05-06 | Qumulo, Inc. | Object-based storage with garbage collection and data consolidation |
| US12346290B2 (en) | 2022-07-13 | 2025-07-01 | Qumulo, Inc. | Workload allocation for file system maintenance |
| US12443568B1 (en) | 2024-11-12 | 2025-10-14 | Qumulo, Inc. | Verifying performance characteristics of network infrastructure for file systems |
Citations (70)
| Publication number | Priority date | Publication date | Assignee | Title |
|---|---|---|---|---|
| US5754939A (en) | 1994-11-29 | 1998-05-19 | Herz; Frederick S. M. | System for generation of user profiles for a system for customized electronic identification of desirable objects |
| US5870559A (en)* | 1996-10-15 | 1999-02-09 | Mercury Interactive | Software system and associated methods for facilitating the analysis and management of web sites |
| US6031537A (en)* | 1996-11-07 | 2000-02-29 | Natrificial Llc | Method and apparatus for displaying a thought network from a thought's perspective |
| US6072490A (en) | 1997-08-15 | 2000-06-06 | International Business Machines Corporation | Multi-node user interface component and method thereof for use in accessing a plurality of linked records |
| US6144962A (en)* | 1996-10-15 | 2000-11-07 | Mercury Interactive Corporation | Visualization of web sites and hierarchical data structures |
| US6154212A (en)* | 1997-11-06 | 2000-11-28 | Lucent Technologies Inc. | Method and apparatus for constructing network interfaces |
| US6166739A (en)* | 1996-11-07 | 2000-12-26 | Natrificial, Llc | Method and apparatus for organizing and processing information using a digital computer |
| US6182097B1 (en) | 1998-05-21 | 2001-01-30 | Lucent Technologies Inc. | Method for characterizing and visualizing patterns of usage of a web site by network users |
| US6212545B1 (en) | 1997-10-31 | 2001-04-03 | Fujitsu Limited | Distributed searching system and searching apparatus for use in the distributed searching system |
| US20020019837A1 (en) | 2000-08-11 | 2002-02-14 | Balnaves James A. | Method for annotating statistics onto hypertext documents |
| US20020070953A1 (en) | 2000-05-04 | 2002-06-13 | Barg Timothy A. | Systems and methods for visualizing and analyzing conditioned data |
| US20020087679A1 (en)* | 2001-01-04 | 2002-07-04 | Visual Insights | Systems and methods for monitoring website activity in real time |
| US20020089532A1 (en) | 2000-12-05 | 2002-07-11 | Tal Cohen | Graphical user interface and web site evaluation tool for customizing web sites |
| US6434556B1 (en) | 1999-04-16 | 2002-08-13 | Board Of Trustees Of The University Of Illinois | Visualization of Internet search information |
| US20020129363A1 (en) | 2001-03-09 | 2002-09-12 | Mcguire Todd J. | System and method for visualizing user activity |
| US20020130907A1 (en)* | 2001-03-15 | 2002-09-19 | Chi Ed H. | Method for visualizing user path through a web site and a path's associated information scent |
| US20020147772A1 (en)* | 1999-06-04 | 2002-10-10 | Charles Glommen | Internet website traffic flow analysis |
| US20020188864A1 (en)* | 2001-06-06 | 2002-12-12 | Jackson Gary Manuel | Intrusion prevention system |
| US20030023715A1 (en)* | 2001-07-16 | 2003-01-30 | David Reiner | System and method for logical view analysis and visualization of user behavior in a distributed computer network |
| US20030115333A1 (en)* | 2001-07-06 | 2003-06-19 | Tal Cohen | System and method for analyzing system visitor activities |
| US6584504B1 (en) | 2000-05-26 | 2003-06-24 | Networks Associates Technology, Inc. | Method and apparatus for monitoring internet traffic on an internet web page |
| US20030126613A1 (en) | 2001-03-09 | 2003-07-03 | Mcguire Todd J. | System and method for visualizing user activity |
| US20030128233A1 (en) | 2002-01-09 | 2003-07-10 | Stephane Kasriel | Path-analysis toolbar |
| US20030131097A1 (en) | 2002-01-09 | 2003-07-10 | Stephane Kasriel | Interactive path analysis |
| US20030184580A1 (en) | 2001-08-14 | 2003-10-02 | Kodosky Jeffrey L. | Configuration diagram which graphically displays program relationship |
| US20030214504A1 (en) | 2002-05-15 | 2003-11-20 | Hao Ming C. | Method for visualizing graphical data sets having a non-uniform graphical density for display |
| US20040001104A1 (en) | 2002-06-28 | 2004-01-01 | Microsoft Corporation | Resource browser sessions search |
| US20040030741A1 (en) | 2001-04-02 | 2004-02-12 | Wolton Richard Ernest | Method and apparatus for search, visual navigation, analysis and retrieval of information from networks with remote notification and content delivery |
| US20040059746A1 (en) | 2002-06-28 | 2004-03-25 | Brett Error | Capturing and presenting site visitation path data |
| US6757740B1 (en)* | 1999-05-03 | 2004-06-29 | Digital Envoy, Inc. | Systems and methods for determining collecting and using geographic locations of internet users |
| US6784901B1 (en) | 2000-05-09 | 2004-08-31 | There | Method, system and computer program product for the delivery of a chat message in a 3D multi-user environment |
| US20040174397A1 (en) | 2003-03-05 | 2004-09-09 | Paul Cereghini | Integration of visualizations, reports, and data |
| US20040189701A1 (en) | 2003-03-25 | 2004-09-30 | Badt Sig Harold | System and method for facilitating interaction between an individual present at a physical location and a telecommuter |
| US20040243944A1 (en) | 2003-05-30 | 2004-12-02 | Sabiers Mark L. | Graphical user interface for viewing interactions between web service objects |
| US20050039132A1 (en) | 2001-03-14 | 2005-02-17 | Bmc Software, Inc. | Performance and flow analysis method for communication networks |
| US6961910B2 (en)* | 2000-02-17 | 2005-11-01 | International Business Machines Corporation | System for interacting with participants at a web site through an interactive visual proxy |
| US20060015824A1 (en) | 2004-07-15 | 2006-01-19 | Microsoft Corporation | Web service visualizer and display service |
| US20060184886A1 (en) | 1999-12-22 | 2006-08-17 | Urbanpixel Inc. | Spatial chat in a multiple browser environment |
| US7219300B2 (en) | 2002-09-30 | 2007-05-15 | Sanavigator, Inc. | Method and system for generating a network monitoring display with animated utilization information |
| US20070143343A1 (en) | 2005-12-21 | 2007-06-21 | Omniture, Inc. | Web analytics data ranking and audio presentation |
| US20070184855A1 (en) | 2006-02-03 | 2007-08-09 | Research In Motion Limited | Visual representation of contact location |
| US7260551B2 (en) | 2001-03-07 | 2007-08-21 | Omniture, Inc. | Method for performing a plurality of candidate actions and monitoring the responses so as to choose the next candidate action to take to control a system so as to optimally control its objective function |
| US20070233511A1 (en) | 2006-03-28 | 2007-10-04 | Omniture, Inc. | Automated Integration of Partner Products |
| US20070255754A1 (en) | 2006-04-28 | 2007-11-01 | James Gheel | Recording, generation, storage and visual presentation of user activity metadata for web page documents |
| US20080046218A1 (en) | 2006-08-16 | 2008-02-21 | Microsoft Corporation | Visual summarization of activity data of a computing session |
| US20080091553A1 (en) | 2006-09-29 | 2008-04-17 | Apple Computer, Inc. | Enhancing online shopping atmosphere |
| US7383334B2 (en) | 2005-10-28 | 2008-06-03 | Omniture, Inc. | Comparison of website visitation data sets generated from using different navigation tools |
| US20080181463A1 (en) | 2007-01-31 | 2008-07-31 | Omniture, Inc. | Use of color in a site analysis report |
| US20080183860A1 (en) | 2007-01-31 | 2008-07-31 | Omniture, Inc. | Intelligent node positioning in a site analysis report |
| US20080184113A1 (en) | 2007-01-31 | 2008-07-31 | Omniture, Inc. | Relevance slider in a site analysis report |
| US20080201357A1 (en) | 2003-06-27 | 2008-08-21 | Omniture, Inc. | Page Grouping for Site Traffic Analysis Reports |
| US20080201638A1 (en) | 2007-02-15 | 2008-08-21 | Yahoo! Inc. | Context avatar |
| US7426687B1 (en) | 2001-01-04 | 2008-09-16 | Omniture, Inc. | Automatic linking of documents |
| US20080249905A1 (en) | 2006-06-26 | 2008-10-09 | Omniture, Inc. | Multi-party web-beacon-based analytics |
| US20080256444A1 (en) | 2007-04-13 | 2008-10-16 | Microsoft Corporation | Internet Visualization System and Related User Interfaces |
| US7441195B2 (en) | 2003-03-04 | 2008-10-21 | Omniture, Inc. | Associating website clicks with links on a web page |
| US20090024962A1 (en) | 2007-07-20 | 2009-01-22 | David Gotz | Methods for Organizing Information Accessed Through a Web Browser |
| US7493317B2 (en) | 2005-10-20 | 2009-02-17 | Omniture, Inc. | Result-based triggering for presentation of online content |
| US20090063517A1 (en) | 2007-08-30 | 2009-03-05 | Microsoft Corporation | User interfaces for scoped hierarchical data sets |
| US7502994B2 (en) | 2001-02-05 | 2009-03-10 | Omniture, Inc. | Web page link-tracking system |
| US7584435B2 (en) | 2004-03-03 | 2009-09-01 | Omniture, Inc. | Web usage overlays for third-party web plug-in content |
| US7603373B2 (en) | 2003-03-04 | 2009-10-13 | Omniture, Inc. | Assigning value to elements contributing to business success |
| US7617186B2 (en) | 2004-10-05 | 2009-11-10 | Omniture, Inc. | System, method and computer program for successive approximation of query results |
| US7620697B1 (en) | 2006-03-10 | 2009-11-17 | Omniture, Inc. | Online syndicated content feed metrics |
| US20090327402A1 (en) | 2008-06-25 | 2009-12-31 | Ebay, Inc. | Systems and methods for mapping user experiences in network navigation |
| US7673340B1 (en) | 2004-06-02 | 2010-03-02 | Clickfox Llc | System and method for analyzing system user behavior |
| US20100169792A1 (en) | 2008-12-29 | 2010-07-01 | Seif Ascar | Web and visual content interaction analytics |
| US20100185640A1 (en) | 2009-01-20 | 2010-07-22 | International Business Machines Corporation | Virtual world identity management |
| US7809752B1 (en) | 2005-04-14 | 2010-10-05 | AudienceScience Inc. | Representing user behavior information |
| US7945658B1 (en) | 2005-12-05 | 2011-05-17 | Narus, Inc. | Method for real-time visualization of BGP analysis and trouble-shooting |
- 2009
- 2009-02-03USUS12/365,093patent/US8341540B1/ennot_activeExpired - Fee Related
Patent Citations (81)
| Publication number | Priority date | Publication date | Assignee | Title |
|---|---|---|---|---|
| US5754939A (en) | 1994-11-29 | 1998-05-19 | Herz; Frederick S. M. | System for generation of user profiles for a system for customized electronic identification of desirable objects |
| US6144962A (en)* | 1996-10-15 | 2000-11-07 | Mercury Interactive Corporation | Visualization of web sites and hierarchical data structures |
| US5870559A (en)* | 1996-10-15 | 1999-02-09 | Mercury Interactive | Software system and associated methods for facilitating the analysis and management of web sites |
| US20020147805A1 (en) | 1996-10-15 | 2002-10-10 | Eran Leshem | Software system and methods for generating and graphically representing web site usage data |
| US6166739A (en)* | 1996-11-07 | 2000-12-26 | Natrificial, Llc | Method and apparatus for organizing and processing information using a digital computer |
| US6031537A (en)* | 1996-11-07 | 2000-02-29 | Natrificial Llc | Method and apparatus for displaying a thought network from a thought's perspective |
| US6072490A (en) | 1997-08-15 | 2000-06-06 | International Business Machines Corporation | Multi-node user interface component and method thereof for use in accessing a plurality of linked records |
| US6212545B1 (en) | 1997-10-31 | 2001-04-03 | Fujitsu Limited | Distributed searching system and searching apparatus for use in the distributed searching system |
| US6154212A (en)* | 1997-11-06 | 2000-11-28 | Lucent Technologies Inc. | Method and apparatus for constructing network interfaces |
| US6182097B1 (en) | 1998-05-21 | 2001-01-30 | Lucent Technologies Inc. | Method for characterizing and visualizing patterns of usage of a web site by network users |
| US6449604B1 (en) | 1998-05-21 | 2002-09-10 | Lucent Technologies Inc. | Method for characterizing and visualizing patterns of usage of a web site by network users |
| US6434556B1 (en) | 1999-04-16 | 2002-08-13 | Board Of Trustees Of The University Of Illinois | Visualization of Internet search information |
| US6757740B1 (en)* | 1999-05-03 | 2004-06-29 | Digital Envoy, Inc. | Systems and methods for determining collecting and using geographic locations of internet users |
| US7464187B2 (en) | 1999-06-04 | 2008-12-09 | Omniture, Inc. | Internet website traffic flow analysis |
| US20090083421A1 (en) | 1999-06-04 | 2009-03-26 | Omniture, Inc. | Internet Website Traffic Flow Analysis |
| US20020147772A1 (en)* | 1999-06-04 | 2002-10-10 | Charles Glommen | Internet website traffic flow analysis |
| US20060184886A1 (en) | 1999-12-22 | 2006-08-17 | Urbanpixel Inc. | Spatial chat in a multiple browser environment |
| US6961910B2 (en)* | 2000-02-17 | 2005-11-01 | International Business Machines Corporation | System for interacting with participants at a web site through an interactive visual proxy |
| US20020070953A1 (en) | 2000-05-04 | 2002-06-13 | Barg Timothy A. | Systems and methods for visualizing and analyzing conditioned data |
| US6784901B1 (en) | 2000-05-09 | 2004-08-31 | There | Method, system and computer program product for the delivery of a chat message in a 3D multi-user environment |
| US6584504B1 (en) | 2000-05-26 | 2003-06-24 | Networks Associates Technology, Inc. | Method and apparatus for monitoring internet traffic on an internet web page |
| US20020019837A1 (en) | 2000-08-11 | 2002-02-14 | Balnaves James A. | Method for annotating statistics onto hypertext documents |
| US20020089532A1 (en) | 2000-12-05 | 2002-07-11 | Tal Cohen | Graphical user interface and web site evaluation tool for customizing web sites |
| US7426687B1 (en) | 2001-01-04 | 2008-09-16 | Omniture, Inc. | Automatic linking of documents |
| US20020087679A1 (en)* | 2001-01-04 | 2002-07-04 | Visual Insights | Systems and methods for monitoring website activity in real time |
| US20090172159A1 (en) | 2001-02-05 | 2009-07-02 | Omniture, Inc. | Web Page Link-Tracking System |
| US7502994B2 (en) | 2001-02-05 | 2009-03-10 | Omniture, Inc. | Web page link-tracking system |
| US7542918B2 (en) | 2001-03-07 | 2009-06-02 | Omniture, Inc. | Method for performing a plurality of candidate actions and monitoring the responses so as to choose the next candidate action to take to control a system so as to optimally control its objective function |
| US20080004940A1 (en) | 2001-03-07 | 2008-01-03 | Omniture, Inc. | Method for performing a plurality of candidate actions and monitoring the responses so as to choose the next candidate action to take to control a system so as to optimally control its objective function |
| US7260551B2 (en) | 2001-03-07 | 2007-08-21 | Omniture, Inc. | Method for performing a plurality of candidate actions and monitoring the responses so as to choose the next candidate action to take to control a system so as to optimally control its objective function |
| US20030126613A1 (en) | 2001-03-09 | 2003-07-03 | Mcguire Todd J. | System and method for visualizing user activity |
| US20020129363A1 (en) | 2001-03-09 | 2002-09-12 | Mcguire Todd J. | System and method for visualizing user activity |
| US20050039132A1 (en) | 2001-03-14 | 2005-02-17 | Bmc Software, Inc. | Performance and flow analysis method for communication networks |
| US20020130907A1 (en)* | 2001-03-15 | 2002-09-19 | Chi Ed H. | Method for visualizing user path through a web site and a path's associated information scent |
| US20040030741A1 (en) | 2001-04-02 | 2004-02-12 | Wolton Richard Ernest | Method and apparatus for search, visual navigation, analysis and retrieval of information from networks with remote notification and content delivery |
| US20020188864A1 (en)* | 2001-06-06 | 2002-12-12 | Jackson Gary Manuel | Intrusion prevention system |
| US20030115333A1 (en)* | 2001-07-06 | 2003-06-19 | Tal Cohen | System and method for analyzing system visitor activities |
| US7165105B2 (en) | 2001-07-16 | 2007-01-16 | Netgenesis Corporation | System and method for logical view analysis and visualization of user behavior in a distributed computer network |
| US20030023715A1 (en)* | 2001-07-16 | 2003-01-30 | David Reiner | System and method for logical view analysis and visualization of user behavior in a distributed computer network |
| US20030184580A1 (en) | 2001-08-14 | 2003-10-02 | Kodosky Jeffrey L. | Configuration diagram which graphically displays program relationship |
| US20030128233A1 (en) | 2002-01-09 | 2003-07-10 | Stephane Kasriel | Path-analysis toolbar |
| US20030131097A1 (en) | 2002-01-09 | 2003-07-10 | Stephane Kasriel | Interactive path analysis |
| US20030214504A1 (en) | 2002-05-15 | 2003-11-20 | Hao Ming C. | Method for visualizing graphical data sets having a non-uniform graphical density for display |
| US20040059746A1 (en) | 2002-06-28 | 2004-03-25 | Brett Error | Capturing and presenting site visitation path data |
| US20040001104A1 (en) | 2002-06-28 | 2004-01-01 | Microsoft Corporation | Resource browser sessions search |
| US7792844B2 (en) | 2002-06-28 | 2010-09-07 | Adobe Systems Incorporated | Capturing and presenting site visitation path data |
| US7219300B2 (en) | 2002-09-30 | 2007-05-15 | Sanavigator, Inc. | Method and system for generating a network monitoring display with animated utilization information |
| US7441195B2 (en) | 2003-03-04 | 2008-10-21 | Omniture, Inc. | Associating website clicks with links on a web page |
| US7603373B2 (en) | 2003-03-04 | 2009-10-13 | Omniture, Inc. | Assigning value to elements contributing to business success |
| US20090006995A1 (en) | 2003-03-04 | 2009-01-01 | Omniture, Inc. | Associating Website Clicks With Links On A Web Page |
| US20040174397A1 (en) | 2003-03-05 | 2004-09-09 | Paul Cereghini | Integration of visualizations, reports, and data |
| US20040189701A1 (en) | 2003-03-25 | 2004-09-30 | Badt Sig Harold | System and method for facilitating interaction between an individual present at a physical location and a telecommuter |
| US20040243944A1 (en) | 2003-05-30 | 2004-12-02 | Sabiers Mark L. | Graphical user interface for viewing interactions between web service objects |
| US20090037579A1 (en) | 2003-06-27 | 2009-02-05 | Omniture, Inc. | Page Grouping For Site Traffic Analysis Reports |
| US20080201357A1 (en) | 2003-06-27 | 2008-08-21 | Omniture, Inc. | Page Grouping for Site Traffic Analysis Reports |
| US7584435B2 (en) | 2004-03-03 | 2009-09-01 | Omniture, Inc. | Web usage overlays for third-party web plug-in content |
| US7673340B1 (en) | 2004-06-02 | 2010-03-02 | Clickfox Llc | System and method for analyzing system user behavior |
| US20060015824A1 (en) | 2004-07-15 | 2006-01-19 | Microsoft Corporation | Web service visualizer and display service |
| US7617186B2 (en) | 2004-10-05 | 2009-11-10 | Omniture, Inc. | System, method and computer program for successive approximation of query results |
| US7809752B1 (en) | 2005-04-14 | 2010-10-05 | AudienceScience Inc. | Representing user behavior information |
| US7493317B2 (en) | 2005-10-20 | 2009-02-17 | Omniture, Inc. | Result-based triggering for presentation of online content |
| US7383334B2 (en) | 2005-10-28 | 2008-06-03 | Omniture, Inc. | Comparison of website visitation data sets generated from using different navigation tools |
| US7945658B1 (en) | 2005-12-05 | 2011-05-17 | Narus, Inc. | Method for real-time visualization of BGP analysis and trouble-shooting |
| US20070143343A1 (en) | 2005-12-21 | 2007-06-21 | Omniture, Inc. | Web analytics data ranking and audio presentation |
| US20070184855A1 (en) | 2006-02-03 | 2007-08-09 | Research In Motion Limited | Visual representation of contact location |
| US7620697B1 (en) | 2006-03-10 | 2009-11-17 | Omniture, Inc. | Online syndicated content feed metrics |
| US20070233511A1 (en) | 2006-03-28 | 2007-10-04 | Omniture, Inc. | Automated Integration of Partner Products |
| US20070255754A1 (en) | 2006-04-28 | 2007-11-01 | James Gheel | Recording, generation, storage and visual presentation of user activity metadata for web page documents |
| US20080249905A1 (en) | 2006-06-26 | 2008-10-09 | Omniture, Inc. | Multi-party web-beacon-based analytics |
| US20080046218A1 (en) | 2006-08-16 | 2008-02-21 | Microsoft Corporation | Visual summarization of activity data of a computing session |
| US20080091553A1 (en) | 2006-09-29 | 2008-04-17 | Apple Computer, Inc. | Enhancing online shopping atmosphere |
| US20080184113A1 (en) | 2007-01-31 | 2008-07-31 | Omniture, Inc. | Relevance slider in a site analysis report |
| US20080183860A1 (en) | 2007-01-31 | 2008-07-31 | Omniture, Inc. | Intelligent node positioning in a site analysis report |
| US20080181463A1 (en) | 2007-01-31 | 2008-07-31 | Omniture, Inc. | Use of color in a site analysis report |
| US20080201638A1 (en) | 2007-02-15 | 2008-08-21 | Yahoo! Inc. | Context avatar |
| US20080256444A1 (en) | 2007-04-13 | 2008-10-16 | Microsoft Corporation | Internet Visualization System and Related User Interfaces |
| US20090024962A1 (en) | 2007-07-20 | 2009-01-22 | David Gotz | Methods for Organizing Information Accessed Through a Web Browser |
| US20090063517A1 (en) | 2007-08-30 | 2009-03-05 | Microsoft Corporation | User interfaces for scoped hierarchical data sets |
| US20090327402A1 (en) | 2008-06-25 | 2009-12-31 | Ebay, Inc. | Systems and methods for mapping user experiences in network navigation |
| US20100169792A1 (en) | 2008-12-29 | 2010-07-01 | Seif Ascar | Web and visual content interaction analytics |
| US20100185640A1 (en) | 2009-01-20 | 2010-07-22 | International Business Machines Corporation | Virtual world identity management |
Non-Patent Citations (10)
| Title |
|---|
| Google Analytics: Make Profit-Generating Improvements to Your Advertising and Website, Google, , Jul. 30, 2008. |
| Google Analytics: Make Profit-Generating Improvements to Your Advertising and Website, Google, <http://web.archive.org/web/20080730065058/www.google.com/analytics/features.html>, Jul. 30, 2008. |
| Holter, E., Google's Site Overlay: Visual Website Design Analysis, Newfangled Web Factory, <http://www.newfangled.com/googles-site-overlay-visual-website-design-analysis>, Jun. 2005. |
| Holter, E., Google's Site Overlay: Visual Website Design Analysis, Newfangled Web Factory, <http://www.newfangled.com/googles—site—overlay—visual—website—design—analysis>, Jun. 2005. |
| Inside Scoop on Google Analytics Funnel Visualization Report: Digital Marketing Factor, Webmetro, <http://www.webmetro.com/blog/Web-Analytics?Inside-Scoop-on-Google-Analytics-Fun . . . >, Jul. 11, 2008. |
| Inside Scoop on Google Analytics Funnel Visualization Report: Digital Marketing Factor, Webmetro, <http://www.webmetro.com/blog/Web—Analytics?Inside—Scoop—on—Google—Analytics—Fun . . . >, Jul. 11, 2008. |
| Reed, M., Using Google Analytics Site Overlay, CommunitySpark.com, , Apr. 13, 2007. |
| Reed, M., Using Google Analytics Site Overlay, CommunitySpark.com, <http://www.communityspark.com/using-google-analytics-site-overlay/>, Apr. 13, 2007. |
| Teixeira, J., Let's Talk About Funnel Visualization: The Analytics and Site Intelligence Blog @ More Analytics, More Visibility, , Sep. 18, 2008. |
| Teixeira, J., Let's Talk About Funnel Visualization: The Analytics and Site Intelligence Blog @ More Analytics, More Visibility, <http://www.morevisibility.com/analyticsblog/lets-talk-about-funnel-visiualization.html>, Sep. 18, 2008. |
Cited By (40)
| Publication number | Priority date | Publication date | Assignee | Title |
|---|---|---|---|---|
| US9459766B1 (en) | 2009-02-03 | 2016-10-04 | Amazon Technologies, Inc. | Visualizing object behavior |
| US8682816B2 (en)* | 2009-10-20 | 2014-03-25 | Google Inc. | Method and system for detecting anomalies in time series data |
| US20130297694A1 (en)* | 2009-12-01 | 2013-11-07 | Topsy Labs, Inc. | Systems and methods for interactive presentation and analysis of social media content collection over social networks |
| US9250759B1 (en)* | 2010-07-23 | 2016-02-02 | Amazon Technologies, Inc. | Visual representation of user-node interactions |
| US9177321B2 (en)* | 2010-12-21 | 2015-11-03 | Sitecore A/S | Method and a system for analysing traffic on a website by means of path analysis |
| US9524511B2 (en) | 2010-12-21 | 2016-12-20 | Sitecore A/S | Method and a system for analysing traffic on a website by means of path analysis |
| US20120158952A1 (en)* | 2010-12-21 | 2012-06-21 | Sitecore A/S | Method and a system for analysing traffic on a website by means of path analysis |
| US20130155068A1 (en)* | 2011-12-16 | 2013-06-20 | Palo Alto Research Center Incorporated | Generating a relationship visualization for nonhomogeneous entities |
| US9721039B2 (en)* | 2011-12-16 | 2017-08-01 | Palo Alto Research Center Incorporated | Generating a relationship visualization for nonhomogeneous entities |
| US10866692B2 (en)* | 2012-03-18 | 2020-12-15 | Adobe Inc. | Methods and apparatus for creating overlays according to trending information |
| US20130246950A1 (en)* | 2012-03-18 | 2013-09-19 | Adobe Systems Incorporated | Methods and apparatus for creating overlays according to trending information |
| US11461286B2 (en) | 2014-04-23 | 2022-10-04 | Qumulo, Inc. | Fair sampling in a hierarchical filesystem |
| US9569062B2 (en)* | 2014-05-21 | 2017-02-14 | Facebook, Inc. | Asynchronous execution of animation tasks for a GUI |
| US20150339002A1 (en)* | 2014-05-21 | 2015-11-26 | Facebook, Inc. | Asynchronous Execution of Animation Tasks for a GUI |
| US10783534B2 (en) | 2015-06-09 | 2020-09-22 | Clickagy, LLC | Method, system and computer readable medium for creating a profile of a user based on user behavior |
| US11861628B2 (en) | 2015-06-09 | 2024-01-02 | Clickagy Llc | Method, system and computer readable medium for creating a profile of a user based on user behavior |
| US11360936B2 (en) | 2018-06-08 | 2022-06-14 | Qumulo, Inc. | Managing per object snapshot coverage in filesystems |
| US11347699B2 (en) | 2018-12-20 | 2022-05-31 | Qumulo, Inc. | File system cache tiers |
| US20210158057A1 (en)* | 2019-11-26 | 2021-05-27 | Scanalytics, Inc. | Path analytics of people in a physical space using smart floor tiles |
| US11734147B2 (en) | 2020-01-24 | 2023-08-22 | Qumulo Inc. | Predictive performance analysis for file systems |
| US11372735B2 (en) | 2020-01-28 | 2022-06-28 | Qumulo, Inc. | Recovery checkpoints for distributed file systems |
| US11775481B2 (en)* | 2020-09-30 | 2023-10-03 | Qumulo, Inc. | User interfaces for managing distributed file systems |
| US11372819B1 (en) | 2021-01-28 | 2022-06-28 | Qumulo, Inc. | Replicating files in distributed file systems using object-based data storage |
| US11461241B2 (en) | 2021-03-03 | 2022-10-04 | Qumulo, Inc. | Storage tier management for file systems |
| US11567660B2 (en) | 2021-03-16 | 2023-01-31 | Qumulo, Inc. | Managing cloud storage for distributed file systems |
| US11435901B1 (en) | 2021-03-16 | 2022-09-06 | Qumulo, Inc. | Backup services for distributed file systems in cloud computing environments |
| US11669255B2 (en) | 2021-06-30 | 2023-06-06 | Qumulo, Inc. | Distributed resource caching by reallocation of storage caching using tokens and agents with non-depleted cache allocations |
| US11599508B1 (en) | 2022-01-31 | 2023-03-07 | Qumulo, Inc. | Integrating distributed file systems with object stores |
| US12346290B2 (en) | 2022-07-13 | 2025-07-01 | Qumulo, Inc. | Workload allocation for file system maintenance |
| US11722150B1 (en) | 2022-09-28 | 2023-08-08 | Qumulo, Inc. | Error resistant write-ahead log |
| US11729269B1 (en) | 2022-10-26 | 2023-08-15 | Qumulo, Inc. | Bandwidth management in distributed file systems |
| US11966592B1 (en) | 2022-11-29 | 2024-04-23 | Qumulo, Inc. | In-place erasure code transcoding for distributed file systems |
| US12292853B1 (en) | 2023-11-06 | 2025-05-06 | Qumulo, Inc. | Object-based storage with garbage collection and data consolidation |
| US11921677B1 (en) | 2023-11-07 | 2024-03-05 | Qumulo, Inc. | Sharing namespaces across file system clusters |
| US11934660B1 (en) | 2023-11-07 | 2024-03-19 | Qumulo, Inc. | Tiered data storage with ephemeral and persistent tiers |
| US12019875B1 (en) | 2023-11-07 | 2024-06-25 | Qumulo, Inc. | Tiered data storage with ephemeral and persistent tiers |
| US12038877B1 (en) | 2023-11-07 | 2024-07-16 | Qumulo, Inc. | Sharing namespaces across file system clusters |
| US12222903B1 (en) | 2024-08-09 | 2025-02-11 | Qumulo, Inc. | Global namespaces for distributed file systems |
| US12443568B1 (en) | 2024-11-12 | 2025-10-14 | Qumulo, Inc. | Verifying performance characteristics of network infrastructure for file systems |
| US12443559B2 (en) | 2025-04-18 | 2025-10-14 | Qumulo, Inc. | Object-based storage with garbage collection and data consolidation |
Similar Documents
| Publication | Publication Date | Title |
|---|---|---|
| US8341540B1 (en) | Visualizing object behavior | |
| US8250473B1 (en) | Visualizing object behavior | |
| US8234582B1 (en) | Visualizing object behavior | |
| US11947556B1 (en) | Computerized monitoring of a metric through execution of a search query, determining a root cause of the behavior, and providing a notification thereof | |
| US11741089B1 (en) | Interactive location queries for raw machine data | |
| US11514278B2 (en) | Graphical user interface for automated data preprocessing for machine learning | |
| US11620300B2 (en) | Real-time measurement and system monitoring based on generated dependency graph models of system components | |
| US10671692B2 (en) | Uniquely identifying and tracking selectable web page objects | |
| US8006187B1 (en) | Checkpoint sequence fallout metrics management during path analysis | |
| US10997190B2 (en) | Context-adaptive selection options in a modular visualization framework | |
| US8600796B1 (en) | System, method and computer program product for identifying products associated with polarized sentiments | |
| US11921799B1 (en) | Generating and using alert definitions | |
| US7305622B2 (en) | Graphical user interface and web site evaluation tool for customizing web sites | |
| US9384502B2 (en) | Techniques for organizing and presenting deal content | |
| US12019858B1 (en) | Generating new visualizations based on prior journey definitions | |
| US8209406B2 (en) | Assessment of click or traffic quality | |
| US9250759B1 (en) | Visual representation of user-node interactions | |
| US10311490B2 (en) | Visual tag editor | |
| US20140173509A1 (en) | Device, Method and User Interface for Emphasizing Divisions in Data | |
| US20090319365A1 (en) | System and method for assessing marketing data | |
| US20020070953A1 (en) | Systems and methods for visualizing and analyzing conditioned data | |
| US20020087679A1 (en) | Systems and methods for monitoring website activity in real time | |
| US10970338B2 (en) | Performing query-time attribution channel modeling | |
| US9390138B2 (en) | Bridge event analytics tools and techniques | |
| US20220036477A1 (en) | System and method for determining revenue generated by any zone in a webpage |
Legal Events
| Date | Code | Title | Description |
|---|---|---|---|
| AS | Assignment | Owner name:AMAZON TECHNOLOGIES, INC., NEVADA Free format text:ASSIGNMENT OF ASSIGNORS INTEREST;ASSIGNORS:HAYNES, JEREMY S.;FRIEDMAN, MICHAEL W.;SIGNING DATES FROM 20090202 TO 20090216;REEL/FRAME:027838/0611 | |
| ZAAA | Notice of allowance and fees due | Free format text:ORIGINAL CODE: NOA | |
| ZAAB | Notice of allowance mailed | Free format text:ORIGINAL CODE: MN/=. | |
| STCF | Information on status: patent grant | Free format text:PATENTED CASE | |
| FPAY | Fee payment | Year of fee payment:4 | |
| MAFP | Maintenance fee payment | Free format text:PAYMENT OF MAINTENANCE FEE, 8TH YEAR, LARGE ENTITY (ORIGINAL EVENT CODE: M1552); ENTITY STATUS OF PATENT OWNER: LARGE ENTITY Year of fee payment:8 | |
| FEPP | Fee payment procedure | Free format text:MAINTENANCE FEE REMINDER MAILED (ORIGINAL EVENT CODE: REM.); ENTITY STATUS OF PATENT OWNER: LARGE ENTITY | |
| LAPS | Lapse for failure to pay maintenance fees | Free format text:PATENT EXPIRED FOR FAILURE TO PAY MAINTENANCE FEES (ORIGINAL EVENT CODE: EXP.); ENTITY STATUS OF PATENT OWNER: LARGE ENTITY | |
| STCH | Information on status: patent discontinuation | Free format text:PATENT EXPIRED DUE TO NONPAYMENT OF MAINTENANCE FEES UNDER 37 CFR 1.362 | |
| FP | Lapsed due to failure to pay maintenance fee | Effective date:20241225 |