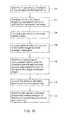
US8170799B2 - Method for determining in-situ relationships between physical properties of a porous medium from a sample thereof - Google Patents
Method for determining in-situ relationships between physical properties of a porous medium from a sample thereofDownload PDFInfo
- Publication number
- US8170799B2 US8170799B2US12/276,431US27643108AUS8170799B2US 8170799 B2US8170799 B2US 8170799B2US 27643108 AUS27643108 AUS 27643108AUS 8170799 B2US8170799 B2US 8170799B2
- Authority
- US
- United States
- Prior art keywords
- image
- rock
- porosity
- pixels
- pore space
- Prior art date
- Legal status (The legal status is an assumption and is not a legal conclusion. Google has not performed a legal analysis and makes no representation as to the accuracy of the status listed.)
- Active, expires
Links
Images


Classifications
- G—PHYSICS
- G01—MEASURING; TESTING
- G01V—GEOPHYSICS; GRAVITATIONAL MEASUREMENTS; DETECTING MASSES OR OBJECTS; TAGS
- G01V1/00—Seismology; Seismic or acoustic prospecting or detecting
- G01V1/28—Processing seismic data, e.g. for interpretation or for event detection
- G01V1/30—Analysis
- G—PHYSICS
- G06—COMPUTING OR CALCULATING; COUNTING
- G06T—IMAGE DATA PROCESSING OR GENERATION, IN GENERAL
- G06T7/00—Image analysis
- G06T7/0002—Inspection of images, e.g. flaw detection
- G06T7/0004—Industrial image inspection
Definitions
- the inventionrelates generally to the field of estimating material properties of porous media. More specifically, the invention relates to methods for estimating such properties using computer tomographic (CT) images of porous media such as subsurface rock formations.
- CTcomputer tomographic
- the method described in the Nur patentincludes preparing a “thin section” from a specimen of rock formation.
- the preparationtypically includes filling the pore spaces with a dyed epoxy resin.
- a color micrograph of the sectionis digitized and converted to an n-ary index image, for example a binary index image.
- Statistical functionsare derived from the two-dimensional image and such functions are used to generate three-dimensional representations of the rock formation. Boundaries can be unconditional or conditioned to the two-dimensional n-ary index image. Desired physical property values are estimated by performing numerical simulations on the three-dimensional representations.
- permeabilityis estimated by using a Lattice-Boltzmann flow simulation.
- multiple, equiprobable three-dimensional representationsare generated for each n-ary index image, and the multiple estimated physical property values are averaged to provide a result.
- CT image generating devicestypically produce three-dimensional gray scale images of the samples analyzed in the scanner. Such gray scale images can be used essentially contemporaneously as drill cuttings are generated during the drilling of a wellbore through subsurface rock formations.
- a rock physics transformis a mathematical formula that relates one property of a rock formation to another.
- Such transformscan be based on an idealized mathematical model of rock, such as the differential effective medium that models rock as a solid with ideal-shape inclusions or the Hertz-Mindlin model that models rock as a composite made of perfect elastic spheres.
- Such transformscan also be based on a sufficient number of experimental data (e.g., well log measurements or laboratory measurements) using a statistically fit expression that approximates such data.
- An example of the latteris the Raymer transform between porosity ⁇ and the compressional wave (P-wave) velocity of the rock (V p ).
- V p(1 ⁇ ) 2 V ps + ⁇ V pf , where V ps is the P-wave velocity in the mineral (matrix or solid) phase of the rock (e.g., quartz) and V pf is the P-wave velocity in the pore fluid (e.g., water).
- the foregoing modulican be obtained by laboratory measurement and also by calculations made from an image of a rock sample.
- the parameters that enter these two equations, one for permeability and the other for the formation factorcan be obtained by laboratory measurement and also by calculations based on an image of a rock sample. Instead of using the k and F equation examples above, one may conduct a large number of laboratory tests on samples that represent the formation under examination. Alternatively, such data can be obtained by digital calculations on a digitally imaged rock sample.
- the inventionrelates to a method for determining in-situ relationships between physical properties of a porous medium from a sample thereof which comprises acquiring a three-dimensional image of the sample and segmenting the image into pixels representing pore space and pixels representing mineral matrix.
- the methodfurther includes selecting a plurality of sub-volumes from the segmented image and calculating a porosity for each of the sub-volumes.
- the methodalso includes conducting a simulation on each of the sub-volumes to obtain a selected physical property for the sub-volume.
- the methodincludes determining a relationship between porosity and the selected physical property using relationship data comprising the calculated porosity and the simulated physical property for each of the sub-volumes.
- the methodfurther includes at least one of storing and displaying the relationship.
- the inventionin another aspect, relates to a method for determining in-situ relationships between physical properties of a porous medium from sample thereof which comprises acquiring a three-dimensional image of the sample and segmenting the image into pixels representing pore space and pixels representing mineral matrix.
- the methodfurther includes producing one or more healed images from the segmented image by selectively removing artifacts from the segmented image.
- the methodincludes calculating a porosity for each of the healed images.
- the methodfurther includes conducting a simulation on each of the healed images to obtain a selected physical property for the healed image.
- the methodincludes determining a relationship between porosity and the selected physical property using relationship data comprising the calculated porosity and the simulated physical property for each of the healed images.
- the methodfurther includes at least one of storing and displaying the relationship.
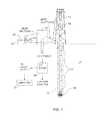
- FIG. 1shows an example of obtaining cuttings during drilling of a wellbore and analysis thereof during the drilling.
- FIG. 2shows a flow chart of an example process for CT image segmentation.
- FIG. 3is an image of a sample of heavy oil sand.
- FIG. 4is an image of a sample of tight gas sand.
- FIG. 5is an image of a sample of drill cutting.
- FIG. 6is a flowchart of a process for determining in-situ rock physics relationships.
- FIG. 7is a flowchart depicting a procedure for determining in-situ rock physics relationships by subsampling.
- FIG. 8illustrates subdividing of a segmented image into sub-volumes.
- FIG. 9is a sample permeability versus porosity plot depicting data points at in-situ conditions obtained by subsampling.
- FIG. 10is a flowchart depicting a procedure for determining in-situ rock physics relationships by artifact healing.
- FIG. 11is a sample permeability versus porosity plot depicting data points at in-situ conditions obtained by artifact healing.
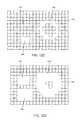
- FIGS. 12A-12Dillustrate a procedure for healing a segmented image.
- drill cuttingsobtained during the drilling of a wellbore through subsurface formations. It should be clearly understood that drill cuttings is only one example of types of samples of rock formation that may be used with the present invention. Any other source of a rock formation sample, e.g., whole cores, sidewall cores, and outcrop quarrying, may provide suitable samples for analysis using methods according to the invention. Consequently, the invention is not limited in scope to analysis of drill cuttings.
- a drilling unit or “rig” 10is disposed at the Earth's surface.
- the rig 10includes lifting equipment (not shown separately) for raising and lowering one of several types of device used to rotate a drill string 14 .
- the device, shown at 18 in the present examplemay be a top drive, although the use of a top drive is not a limit on the scope of the invention.
- the drill string 14is assembled by threadedly coupling segments of drill pipe end to end.
- a drill bit 16is disposed at the lower end of the drill string 14 and cuts through subsurface rock formations 11 to form a wellbore 12 .
- the rig 10is operated to cause some of the axial load (weight) of the drill string 14 to be applied to the drill bit 16 .
- the top drive 18rotates the drill string 14 and the drill bit 16 at the lower end thereof. The combination of axial load and rotation causes the drill bit 16 to cut through the formations 11 .
- the rig 10includes a tank or pit 22 having drilling fluid (“mud”) 20 stored therein.
- a pump 24lifts the mud 20 and discharges it through suitable flow lines 26 so that the mud 20 passes through an internal passage in the drill string 14 , whereupon it is discharged through suitable orifices or courses in the drill bit 16 .
- the discharged mud 20cools and lubricates the drill bit 16 and lifts the cuttings generated by the bit 16 to the Earth's surface.
- the cuttings and mud thus liftedenter separation and cleaning devices, shown generally at 28 and including, for example, devices known as “degassers” and “shale shakers” to remove the cuttings and contamination from the mud 20 .
- the mud after such cleaningis returned to the pit 22 for subsequent use in drilling the wellbore 12 .
- the cuttings removed from the separation and cleaning device 28may be transported to a computer tomographic (“CT”) scanner 30 , which may use x-rays for analysis of internal structure of the cuttings, for generation of three dimensional (3D) images of the cuttings.
- CTcomputer tomographic
- the images so generatedmay be in numerical form and their content will be further explained below.
- the cuttingsmay be saved for further analysis or may be suitably discarded.
- An example of a suitable CT scanner for making images usable with methods according to the inventionis sold under model designation MicroXCT Series 3D tomographic x-ray transmission microscope by Xradia, Inc., 5052 Commercial Circle, Concord, Calif. 94520.
- an analysis of the cuttings from the CT scan imagesmay provide, substantially in real time during the drilling of the wellbore, an estimate of certain properties of the subsurface formations being drilled, for example fluid mobility of one or more constituent fluids in the pore spaces of the rock formations 11 .
- images generated by the CT scanner 30may be transferred to a computer 32 having program instructions for carrying out image analysis and subsequent formation property modeling as described below.
- drill cuttingsare only one type of rock sample that may be analyzed according to the invention.
- the drill bit 16may be an annular type configured to drill whole cores of the rock formations 11 .
- percussion sidewall core samplesmay be obtained during drilling or when the drill string 14 is withdrawn from the wellbore 12 , such as for “wireline” well evaluation techniques. Accordingly, the scope of the invention is not limited to analysis of drill cuttings.
- CT-scan imaging of a porous material sampleis used in the invention to produce a numerical object that represents the material sample digitally in the computer 32 for subsequent numerical simulations of various physical processes, such as viscous fluid flow (for permeability estimation); stress loading (for the effective elastic moduli); electrical current flow (for resistivity); and pore size distribution for nuclear magnetic resonance relaxation time properties, including distribution of relaxation time.
- various physical processessuch as viscous fluid flow (for permeability estimation); stress loading (for the effective elastic moduli); electrical current flow (for resistivity); and pore size distribution for nuclear magnetic resonance relaxation time properties, including distribution of relaxation time.
- such analysiscan be performed while drilling operations are underway, substantially in real time.
- the CT-scan image produced by the CT scanner 30may be a 3D numerical object consisting of a plurality of 2D sections of the imaged sample.
- Each 2D sectionconsists of a grid of values each corresponding to a small region of space defined within the plane of the grid. Each such small region of space is referred to as a “pixel” and has assigned thereto a number representing the image darkness (or for example the density of the material) determined by the CT scan procedure.
- the value ascribed to each pixel of the 2D sectionsis typically an integer that may vary between zero and 255 where 0 is, e.g., pure white, and 255 is pure black. Such integer is typically referred to as a “gray scale” value.
- 0 to 255is associated with eight digital bits in a digital word representing the gray scale value in each pixel.
- Other gray scale rangesmay be associated with longer or shorter digital words in other implementations, and the range of 0 to 255 is not intended to limit the scope of the invention.
- the numerical objectis preferably processed so that all the pixels allocated to the void space in the rock formation (pore space) are represented by a common numerical value, e.g., by only 255s, and all the pixels associated with the rock matrix (or rock grains) are represented by a different numerical value, for example, zeroes.
- image segmentationis called image segmentation.
- the resulting numerical objectcan be normalized so that the pore spaces are represented by, for example, ones and the rock grains are represented by zeroes.
- the foregoingmay be described as converting the image into a binary index.
- the imagemay be converted into an index having any selected number, n, of indices. It has been determined that sufficiently accurate modeling of rock properties may be obtained using a binary index, in which one value represents pore space and another single value represents rock grains.
- a technique known in the art for segmenting a gray-scale objectis called “thresholding”, where all pixels having a gray scale value below a selected threshold value (e.g., a gray scale value of 150 on a scale of 0 to 255) are identified as grains, while all other pixels are identified as pore space.
- a selected threshold valuee.g., a gray scale value of 150 on a scale of 0 to 255
- regions growinga type of image segmentation known as “region growing” can be used. Region growing may be described as follows. Consider a 2D section of a CT scan image made of a porous rock formation such as sandstone, which has primarily quartz rock grains.
- a substantial number of “seeds”(each seed consists of one or more pixels having a similar pixel gray scale level, e.g., 250 ⁇ 5) is placed within the image. All pixels within a seed are assigned the same gray scale level which may be an average (e.g., arithmetic) of the gray levels of all the pixels within the seed. The seeds in the image frame do not overlap spatially. Next, two or more adjacent seeds are merged and are identified as a “region” if the gray scale levels of the adjacent seeds have gray scale values within a selected difference threshold of each other. Each identified region is assigned a uniform (fixed) gray level, which can be a weighted average of the gray scale values of all the seeds that have been merged into the identified region.
- the unprocessed CT imageis transformed into internally uniform regions plus unclassified pixels that were not assigned to any of the identified regions (because such pixels included gray scale values outside the allocation threshold criteria).
- Each of such unclassified pixelscan be assigned to an adjacent region with the closest gray scale level. If the resulting number of regions is greater than two, however, the foregoing method simply fails to allocate the CT image correctly into grains and pores.
- all pixels having a gray scale value below a selected initial limit for the gray scale level of rock grainsare classified as rock grains; and all pixels in which the gray scale level is larger than a selected initial limit for pore spaces (e.g., 130) are classified as pore space.
- a selected initial limit for the gray scale level of rock grainse.g. 60
- all pixels in which the gray scale level is larger than a selected initial limit for pore spacese.g., 130
- One simple way of specifying these initial limitsis by selecting the gray scale levels corresponding to the peaks of a gray level histogram. In many subsurface formations, such a histogram will be bimodal, wherein one mode value will correspond to the gray scale level of pores, and another mode value will correspond to the gray scale level of rock grains.
- the next element in image classification according to the inventionis to grow each of the two initially formed seeds by allocating to such seeds all adjacent pixels having gray scale levels within a selected tolerance, e.g., 130 ⁇ 5 for pore spaces and 60+5 for rock grains.
- a selected tolerancee.g. 130 ⁇ 5 for pore spaces and 60+5 for rock grains.
- the foregoing processcan continue by incrementally increasing the gray scale lower limit for rock grains and incrementally reducing the gray scale upper limit for pore spaces until the two limits meet.
- the resultis that all pixels will be allocated to either pore space or to rock grains, thus providing a fully segmented image.
- a possible advantage of the foregoing procedureis that instead of forming multiple regions, the foregoing technique grows only two distinctive regions from start to end, thus avoiding the situation where multiple distinctive regions appear and then have to be reclassified into either pores or grains. If the resulting segmented image appears noisy (cluttered), it can be smoothed by any of conventional filters.
- the size of the filteris provided by the user and should depend on, among other factors, the quality of the image (level of noise). It should be noted that the image segmenting procedure that follows has been demonstrated to be sufficiently noise resistant as to make the preprocessing frequently unnecessary.
- two user-selected thresholdst 1 and t 2 are selected to determine initial regions for pore space and rock grains, respectively.
- the initial thresholdsmay be selected, for example, by analysis of a histogram of the gray scale values in the CT image. For every pixel p i having a gray scale level represented by B(p i ):
- contiguous pixelsmay be referred to as “clusters.” All of the pixels allocated as explained above then become the image seeds from which region growing proceeds.
- each pixel classified as a poreits eight neighbors (spatially contiguous pixels) in the 2D image plane are interrogated. If any of the interrogated neighbor pixels is not already identified as pore or rock grain, and the gray scale level of such pixel is within a preselected tolerance level of (or initially selected different between) the gray scale level assigned to the “pore” seed (as in Step 2 above), the interrogated neighbor pixel is then classified as a pore and is allocated to the “pore” cluster.
- contiguous pixel interrogationis also performed for pixels classified as rock grain.
- Contiguous, previously unallocated pixels having gray scale level within a preselected tolerance of the gray scale level of the rock grain seedare allocated to the rock grain cluster.
- the foregoing cluster allocation and region growing processcontinues for both pore space and rock grain until all the pixels in the 2D image frame are interrogated. If any of the pixels is not classified as pore space or rock grain, the foregoing tolerance value for each of the pore space and the rock grain may be increased by a selected increment (for example five gray scale numbers), and the contiguous pixel interrogation and classification may be repeated. The foregoing tolerance increase and repeated adjacent pixel interrogation may be repeated until all or substantially all the pixels in the 2D image frame are allocated to either rock grain or pore space.
- the foregoing region growing procedureis then repeated for each 2D image frame in the 3D CT scan image.
- the resultis a three dimensional characterization of the pore structure of the rock samples on which CT imaging has been performed.
- FIG. 2An example implementation of the above process for image segmentation is shown in a flow chart in FIG. 2 .
- a 2D image frame of a CT scan imageis selected.
- the image framemay be subjected to histogram analysis, at 42 to determine possible mode values of gray scale for pore spaces and for rock grains.
- the possible modes of the histogrammay be used to set initial values for the image segmentation thresholds t 1 and t 2 .
- all pixels in the image frame are interrogatedmay be are allocated to pore space or to rock grains, depending on whether the gray scale value in each pixel exceeds the respective segmentation threshold.
- the allocated pixelsare then segmented into seeds where two or more contiguous pixels are allocated to either pore space or rock grain.
- pixels adjacent to the each of the seedsare interrogated.
- Previously unallocated pixels having a gray scale value falling within an initially selected threshold difference (or tolerance) of the adjacent cluster pixel gray scale valueare allocated to the seed at 50 .
- the image frameis interrogated to determine if all or substantially all the image frame pixels have been allocated to either pore space or rock grain.
- the number of allocated pixelsis counted and at 60 if all or substantially all the pixels in the image frame have been allocated, a new 2D image frame can be selected, at 58 , and the above process repeated.
- next 2D image framewill be adjacent to the most recently analyzed 2D image frame.
- the above processcan be repeated until all available 2D image frames have been analyzed. If all pixels in the image frame have not been allocated, at 52 , the tolerance or difference threshold values used at 50 may be increased and the interrogation of pixels adjacent to the existing seeds can be repeated, at 48 , and the remainder of the process can be repeated.
- the result of the foregoing procedureis a segmented 3D image of the rock sample including image elements for rock grain and for pore space.
- imagecan be stored or displayed in a computer and can be used as input to one or more rock property characterization models.
- 3D tomographic images of a rock sampleare usually obtained at surface conditions (e.g., 1 atmosphere pressure and 25 degrees C ambient temperature).
- surface conditionse.g., 1 atmosphere pressure and 25 degrees C ambient temperature.
- the physical properties (especially the transport properties, such as permeability and resistivity) of rock samples from these formationsmay not vary substantially between surface conditions and in-situ (e.g., in the subsurface or reservoir) conditions.
- the physical properties of the rock samplemay vary substantially between surface conditions and in-situ conditions for other formation types, such as (a) unconsolidated oil sands, where some pore space portions appearing at room conditions may be artifacts of the pore fluid expansion, and (b) tight sandstone and drill cuttings, where some of the fracturing appearing at room conditions may be an artifact of cracking due to stress release, drying, and handling.
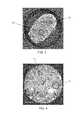
- FIGS. 3-5images of rock samples at surface conditions are shown in FIGS. 3-5 .
- FIG. 3an image of an unconsolidated oil sand is shown.
- the rock grainsare relatively light, while the pores are relatively dark. Domains, highlighted by circles 80 , with unnaturally large spaces between the grains can be observed in the image. The unnaturally large spaces may have been generated by oil expansion as external pressure was reduced as the sample was transported from in-situ to surface conditions.
- FIG. 4an image of a “tight” (low permeability) gas-bearing sandstone is shown. In the image of FIG. 4 , thin cracks, which are highlighted by circles 85 , can be observed.
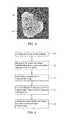
- FIG. 5an image is shown of a drill cutting which has been altered while it traveled in the mud and then was collected and dried.
- thin crackshighlighted by circles 90 , can be observed. These thin cracks appear to be due to handling, including drying, of the drill cutting.
- the inventionincludes a method of determining relationships between physical properties of a porous medium, e.g., rock sample, existing at in-situ conditions from a 3D image of the porous medium obtained at conditions other than in-situ conditions, e.g., surface conditions.
- the methoduses subsampling and/or artifact healing of the 3D image to minimize or reduce the effects of artifacts on the properties of the porous medium where the artifacts are due to change in environmental conditions affecting the porous medium, e.g., movement from in-situ conditions to surface conditions.
- FIG. 6is a flow chart of an example process for determining in-situ relationship between one or more physical properties of a rock sample and porosity in accordance with one embodiment of the invention.
- a high-resolution 3D image of a rock sampleis acquired at 100 .
- the rock samplemay be, for example, a small fragment or fragments of a formation from core, sidewall plug, or a drill cutting.
- This stepmay include obtaining the rock sample through any appropriate means, such as by drilling or coring.
- the high-resolution 3D imagemay be a 3D tomographic image generated by CT-scanning.
- the CT scanner30 in FIG. 1
- the CT scanner30 in FIG. 1
- the 3D imagecan be stored on a suitable media, which may be associated with, for example, a computer ( 32 in FIG. 1 ).
- the 3D imagemay be rendered as pixels on a screen.
- the 3D image acquired at 100serves as a computer model for the rock sample and can be used for various computation tasks.
- the imageis segmented into image portions (i.e., pixels) representing pore space and image portions (i.e., pixels) representing rock grain or mineral matrix at 102 .
- An image segmentation techniquesuch as described with reference to FIG. 2 may be used.
- porosityis calculated at 104 .
- the porosity of the segmented imageis obtained by dividing the number of pixels allocated to the pore space by the total number of pixels in the segmented image.
- a simulatione.g., a numerical simulation
- One of the inputs to the simulationmay be the porosity calculated at 104 .
- Different digital simulationsmay be conducted to obtain different physical properties of the rock sample.
- digital simulations of physical experimentsinclude one or more of the following: (a) single-phase fluid flow using the Lattice-Boltzmann numerical method (LBM) to obtain the absolute permeability of the rock sample, (b) elastic deformation using the finite-element method (FEM) to obtain the elastic moduli and elastic-wave velocity of the rock sample, and (c) electrical current flow using FEM to obtain the electrical resistivity and formation factor of the rock sample.
- LBMLattice-Boltzmann numerical method
- FEMfinite-element method
- Other digital simulationsbesides those listed above may also be conducted depending on the desired physical properties of the rock sample.
- permeability modeled with the porosity determined at 106is determined. Formation factor and elastic moduli are also determined. Shear modulus and bulk modulus may also be determined.
- Lattice-Boltzmann methodcan be used to determine permeability.
- the Lattice-Boltzmann methodmathematically mimics the Navier-Stokes equations of viscous flow and enables simulation of the viscous flow required for permeability estimates in real pore space.
- LBMis a robust tool for flow simulation, particularly in media with complex pore geometry. See, for example. Ladd, Numerical Simulations of Particulate Suspensions via a discretized Boltzmann Equation, Part 1: Theoretical Foundation , J. Fluid Mech., v271, 1994, pp.
- the Lattice-Boltzmann methodsimulates fluid motion as collisions of imaginary particles, which are much larger than actual fluid molecules, but wherein such particles show almost the same behavior at a macroscopic scale.
- the algorithm used in the Lattice-Boltzmann methodrepeats collisions of these imaginary particles until steady state is reached, and provides a distribution of local mass flux.
- the Lattice-Boltzmann methodis applied successfully for many pore structures, including cylindrical tubes, random densely packed spheres, and 3D rock samples digitized by CT scanning as explained above. See, for example, U.S. Pat. No. 6,516,080 issued to Nur. Other methods of determining physical properties of rock samples, such as described in, for example, U.S. Pat. No. 7,277,795 issued to Boitnott, may also be used.
- the final step in the processincludes determining relationships between porosity and other physical properties of the rock sample at 108 .
- FIG. 7one example starts with selection of an in-situ porosity (target in-situ porosity) or range of in-situ porosities (range of target in-situ porosities) for the rock sample at 110 .
- Selection of the target in-situ porosity or range of target in-situ porositiescan be accomplished in a variety of ways.
- the target in-situ porosityis calculated by reducing the surface-condition porosity calculated at 104 of FIG. 6 according to the oil expansion factor.
- the target in-situ porosityis obtained from direct measurements of a formation under examination in the well or in the physical laboratory.
- a range of possible in-situ porosities and the corresponding range of rock propertiesare provided from known sources.
- the target in-situ porosityis simply assumed.
- a plurality of sub-volumesare next selected from the segmented image at 112 .
- the sub-volumeslike the segmented image, are also 3D images having pixels allocated to pore space and pixels allocated to mineral matrix or rock grain. Each sub-volume represents a subsample of the original rock sample.
- the process element at 112may include evenly subdividing the segmented image into sub-volumes.
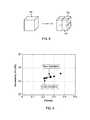
- FIG. 8where a segmented image 113 is modeled as a cube.
- the cube 113may be evenly sub-divided into sub-cubes 115 , as desired in step 112 of FIG. 7 .
- the segmented image 113may be subdivided into as many sub-volumes as desired, e.g., 8, 27, 64, or 125 sub-volumes.
- at 112 in FIG. 7may involve randomly selecting sub-volumes from the segmented image. In this case, overlaps between sub-volumes may be allowed.
- porosityis calculated for each of the sub-volumes at 114 . Porosity of each sub-volume can be expressed as the number of pixels in the sub-volume corresponding to pore space divided by the total number of pixels in the sub-volume.
- simulations of physical experimentsare conducted to obtain one or more physical properties for the sub-volumes at 116 .
- the digital simulationsare as described previously with respect to FIG. 6 and will not be repeated here again.
- the simulations for each sub-volumemay receive the selected in-situ porosity or range in-situ porosities as at 110 as input rather than the surface-condition porosity determined at 104 in FIG. 6 .
- permeability modeled with in-situ porosityis determined by digital simulation.
- One or more of formation factor, elastic moduli, shear modulus, and bulk modulimay also be determined by such simulation(s). Any or all of the foregoing physical properties obtained from such simulations and calculated porosities may be stored and/or displayed in the computer (e.g., 32 in FIG. 1 ) for later use.
- the estimated physical properties of the subsamples obtained at step 116more closely approximate in-situ conditions because the global effects of artifacts such as unnaturally large pore space are reduced or minimized at the local level of the subsamples.
- a set of porosities for the subsamples calculated at 114is known.
- At least one corresponding set of physical property, e.g., permeability, calculated at 116is also known.
- Additional corresponding sets of physical properties, e.g., formation factor and elastic moduli, calculated in step 116may also be known.
- the next element in the processis to generate a physical property versus porosity plot using the known data sets as shown at 118 .
- a permeability versus porosity plotmay be generated using data calculated at 114 and 116 .
- this plotmay also include permeability from 108 of FIG. 6 and porosity from 104 of FIG. 6 .
- Similar plotscan be made for all the other physical properties, e.g., formation factor and elastic moduli, computed at 114 , 116 in FIG. 7 and 104 , 108 in FIG. 6 .
- FIG. 9shows an example of a permeability versus porosity plot.
- the square data pointindicates the permeability-porosity data point computed using the segmented image, as in FIG. 6 .
- the circle data pointsindicate the permeability-porosity data points computed using the subsamples, as in FIG. 7 .
- the relationship between a physical property and porositymay be expressed as a function in addition to providing it as a plot.
- the plotted dataare analyzed to determine a best-fit curve to the plotted data. Any suitable technique, such as least squares regression, may be used to determine the best-fit curve.
- Such determinationmay include a specification of the range of porosities for which the curve is valid.
- the surface-condition data(determined in FIG. 6 ) may or may not be included in the analysis to determine the best-fit curve. From the best-fit curve, the value of a physical property corresponding to the in-situ porosity or range of in-situ porosities selected at 110 in FIG. 6 may be easily determined, as shown at 122 . It is also possible to determine values of physical properties corresponding to in-situ porosity or range of in-situ porosities by visual inspection of the plots made at 120 .
- FIG. 10Another example process determining in-situ relationships between physical properties of the rock sample at in-situ conditions is detailed in FIG. 10 .
- the present example approachalso starts by selection of an in-situ porosity (target in-situ porosity) or range of in-situ porosities (range of target in-situ porosities) for the rock sample (e.g., at 110 ).
- Element 110has been described above with reference to FIG. 7 .
- the next element of the procedureis to generate one or more healed images by selectively removing artifacts from the segmented image obtained at 102 of FIG. 6 (i.e., at 124 ). A procedure for healing the segmented image will be described later.
- FIG. 10Another example process determining in-situ relationships between physical properties of the rock sample at in-situ conditions is detailed in FIG. 10 .
- the present example approachalso starts by selection of an in-situ porosity (target in-situ porosity
- a porosityis calculated at 126 . This is similar to calculating porosity for a segmented image or sub-volume, as previously described.
- simulations of physical experimentsare conducted to obtain one or more physical properties for the healed images at 128 .
- the foregoingis similar to 108 in FIG. 6 and 116 in FIG. 7 , except that it is conducted on healed images rather than the original segmented image ( FIG. 6 ) or sub-volumes ( FIG. 7 ) thereof. Any description related to 108 in FIG. 6 and 116 in FIG. 7 also applies to 128 in FIG. 10 .
- physical propertiessuch as permeability, formation factor, and elastic moduli can be determined by simulations such as numerical simulations.
- the data sets acquired at 128 and the porosities acquired at 126are used to create one or more physical property versus porosity plots at 130 . Again, the foregoing is similar to 120 in FIG. 7 except that it applies to healed images instead of sub-volumes (or subsamples). In the interest of conciseness, procedures already explained adequately with respect to FIG. 7 will not be repeated here.
- examples of plots that may be producedinclude, but are not limited to, permeability versus porosity plot, formation factor versus porosity plot, and elastic moduli versus porosity plot.
- the plotsinclude data computed at 128 and 126 in FIG. 10 and may include data computed at 104 and 106 in FIG. 6 .
- FIG. 11shows an example permeability versus porosity plot obtained by healing cracks in two digital samples.
- surface conditionsindicate the data points computed according to 104 , 106 in FIG. 6
- in-situ conditionsindicate the data points computed according to 126 , 128 in FIG. 10 .
- FIG. 12Agraphically depicts a segmented image including pore space 140 and rock grain or mineral matrix 142 .
- the segmented imageis healed by adding layers of pixels, starting with one pixel, to the solid part (rock grain) of the image, along the entire internal surface of the pore space. This is illustrated in FIG. 12B , where the shaded pixels 144 represent the added layer of pixels.
- FIG. 12Cthe shadings have been removed to illustrate that the pixels ( 144 in FIG. 12B ) have become part of the solid part (rock grain) of the image.
- the pore space 140is now smaller than the original size in FIG.
- FIG. 12Athe thin portions of the pore space, indicated at 141 in FIG. 12A , no longer exists in FIG. 12C .
- adding layers of pixels to the solid part of the imagehas the effect of closing thin portions of the pore space and, simultaneously, reducing the size of larger pores.
- the next stepis to take the numerical object thus rendered and uniformly subtract a number of pixels from the solid part along the internal surface of the pore space.
- FIG. 12DThe end result of such a procedure is illustrated in FIG. 12D .
- the foregoing actiondoes not reopen the healed thin pore space but restores the larger pores 140 to their original size.
- Each pass of addition and subtraction of pixelscreates a healed image with additional artifacts removed. This procedure allows removal of thin cracks, which may have been the result of damage to the rock sample from the drill bit, inelastic stress release and drying.
- subsampling as described in FIG. 7 and artifact healing as described in FIG. 10may be combined to determine in-situ rock physics relationships. For example, it is possible to first heal the image, as described at 124 in FIG. 10 , and then use the healed image as the segmented image for the subsampling procedure described in FIG. 7 .
- Methods according to the various aspects of the inventionmay provide more precise estimates of fluid transport properties and other above-mentioned properties of subsurface rock formations obtained using rock samples analyzed at surface conditions.
Landscapes
- Engineering & Computer Science (AREA)
- Physics & Mathematics (AREA)
- Remote Sensing (AREA)
- Life Sciences & Earth Sciences (AREA)
- General Physics & Mathematics (AREA)
- Geology (AREA)
- Environmental & Geological Engineering (AREA)
- General Life Sciences & Earth Sciences (AREA)
- Acoustics & Sound (AREA)
- Geophysics (AREA)
- Quality & Reliability (AREA)
- Computer Vision & Pattern Recognition (AREA)
- Theoretical Computer Science (AREA)
- Analysing Materials By The Use Of Radiation (AREA)
Abstract
Description
Claims (18)
Priority Applications (2)
| Application Number | Priority Date | Filing Date | Title |
|---|---|---|---|
| US12/276,431US8170799B2 (en) | 2008-11-24 | 2008-11-24 | Method for determining in-situ relationships between physical properties of a porous medium from a sample thereof |
| PCT/US2009/065246WO2010059890A2 (en) | 2008-11-24 | 2009-11-20 | Method for determining in-situ relationships between physical properties of a porous medium from a sample thereof |
Applications Claiming Priority (1)
| Application Number | Priority Date | Filing Date | Title |
|---|---|---|---|
| US12/276,431US8170799B2 (en) | 2008-11-24 | 2008-11-24 | Method for determining in-situ relationships between physical properties of a porous medium from a sample thereof |
Publications (2)
| Publication Number | Publication Date |
|---|---|
| US20100131204A1 US20100131204A1 (en) | 2010-05-27 |
| US8170799B2true US8170799B2 (en) | 2012-05-01 |
Family
ID=42197088
Family Applications (1)
| Application Number | Title | Priority Date | Filing Date |
|---|---|---|---|
| US12/276,431Active2030-12-06US8170799B2 (en) | 2008-11-24 | 2008-11-24 | Method for determining in-situ relationships between physical properties of a porous medium from a sample thereof |
Country Status (2)
| Country | Link |
|---|---|
| US (1) | US8170799B2 (en) |
| WO (1) | WO2010059890A2 (en) |
Cited By (29)
| Publication number | Priority date | Publication date | Assignee | Title |
|---|---|---|---|---|
| US20090288880A1 (en)* | 2008-05-21 | 2009-11-26 | Wojcik Zbigniew M | Method for estimating material properties of porous media using computer tomograpic images thereof |
| US20110090758A1 (en)* | 2009-10-21 | 2011-04-21 | Patrick Rasolofosaon | Method for interpreting repetitive seismic data considering seismic frequency band in the evaluation of pore pressures |
| US20120304763A1 (en)* | 2011-06-06 | 2012-12-06 | Troxler Electronic Laboratories, Inc. | Optical method and apparatus for determining a characteristic such as volume and density of an excavated void in a construction material |
| WO2013147995A1 (en) | 2012-03-30 | 2013-10-03 | Ingrain, Inc. | An efficient method for selecting representative elementary volume in digital representations of porous media |
| US20130301794A1 (en)* | 2012-05-11 | 2013-11-14 | Ingrain, Inc. | Method And System For Multi-Energy Computer Tomographic Cuttings Analysis |
| US20140019053A1 (en)* | 2012-07-13 | 2014-01-16 | Ingrain, Inc. | Method For Evaluating Relative Permeability For Fractional Multi-Phase, Multi-Component Fluid Flow Through Porous Media |
| US20140052420A1 (en)* | 2012-08-20 | 2014-02-20 | Ingrain Inc. | Digital Rock Analysis Systems and Methods that Estimate a Maturity Level |
| US9047513B2 (en) | 2012-08-10 | 2015-06-02 | Ingrain, Inc. | Method for improving the accuracy of rock property values derived from digital images |
| US9127529B2 (en) | 2012-11-01 | 2015-09-08 | Ingrain, Inc. | Process and system for preparation of X-ray scannable sample-embedded sliver for characterization of rock and other samples |
| CN105068141A (en)* | 2015-06-11 | 2015-11-18 | 中国石油天然气股份有限公司 | Method and device for determining karst reservoir distribution of fracture system |
| US20160131793A1 (en)* | 2014-11-07 | 2016-05-12 | Ge Energy Oilfield Technology, Inc. | System and Method For Wellsite Core Sample Analysis |
| US9348056B2 (en) | 2013-08-06 | 2016-05-24 | Bp Corporation North America Inc. | Image-based direct numerical simulation of petrophysical properties under simulated stress and strain conditions |
| WO2016085833A1 (en) | 2014-11-25 | 2016-06-02 | Ingrain, Inc. | Fluid characterization of porous materials libs |
| RU2621371C1 (en)* | 2016-07-13 | 2017-06-02 | Федеральное государственное бюджетное образовательное учреждение высшего образования "Российский государственный университет нефти и газа (национальный исследовательский университет) имени И.М. Губкина" | Method of investigation of filtration-capacitive properties of mineral rocks |
| US10001446B2 (en) | 2014-11-07 | 2018-06-19 | Ge Energy Oilfield Technology, Inc. | Core sample analysis |
| US10031148B2 (en) | 2014-12-31 | 2018-07-24 | Ge Energy Oilfield Technology, Inc. | System for handling a core sample |
| US10054577B2 (en) | 2014-08-19 | 2018-08-21 | Ingrain, Inc. | Method and system for obtaining geochemistry information from pyrolysis induced by laser induced breakdown spectroscopy |
| US10113952B2 (en) | 2015-06-01 | 2018-10-30 | Ingrain, Inc. | Combined vibrational spectroscopy and laser induced breakdown spectroscopy for improved mineralogical and geochemical characterization of petroleum source or reservoir rocks |
| US10139347B2 (en) | 2015-09-23 | 2018-11-27 | Halliburton Energy Services, Inc. | Measurement of noble gas adsorption via laser-induced breakdown spectroscopy for wettability determination |
| US10261204B2 (en) | 2014-12-31 | 2019-04-16 | Ge Energy Oilfield Technology, Inc. | Methods and systems for scan analysis of a core sample |
| US10480311B2 (en) | 2017-06-30 | 2019-11-19 | Baker Hughes, A Ge Company, Llc | Downhole intervention operation optimization |
| US10891462B2 (en) | 2018-06-29 | 2021-01-12 | Saudi Arabian Oil Company | Identifying geometrical properties of rock structure through digital imaging |
| US10983237B2 (en) | 2018-04-13 | 2021-04-20 | Saudi Arabian Oil Company | Enhancing seismic images |
| US10991078B2 (en) | 2017-09-15 | 2021-04-27 | Saudi Arabian Oil Company | Inferring petrophysical properties of hydrocarbon reservoirs using a neural network |
| US11009497B2 (en) | 2018-06-22 | 2021-05-18 | Bp Corporation North America Inc. | Systems and methods for estimating mechanical properties of rocks using grain contact models |
| US11668847B2 (en) | 2021-01-04 | 2023-06-06 | Saudi Arabian Oil Company | Generating synthetic geological formation images based on rock fragment images |
| US12123299B2 (en) | 2021-08-31 | 2024-10-22 | Saudi Arabian Oil Company | Quantitative hydraulic fracturing surveillance from fiber optic sensing using machine learning |
| US12315137B2 (en) | 2020-08-06 | 2025-05-27 | Schlumberger Technology Corporation | Cuttings imaging for determining geological properties |
| US12422588B2 (en) | 2022-07-21 | 2025-09-23 | Schlumberger Technology Corporation | Formation porosity estimation from digital images |
Families Citing this family (20)
| Publication number | Priority date | Publication date | Assignee | Title |
|---|---|---|---|---|
| FI120164B2 (en)* | 2008-02-15 | 2012-07-13 | Mine On Line Service Oy | Procedure and equipment to make ore exploration more efficient |
| US8583410B2 (en)* | 2010-05-28 | 2013-11-12 | Ingrain, Inc. | Method for obtaining consistent and integrated physical properties of porous media |
| US9507047B1 (en)* | 2011-05-10 | 2016-11-29 | Ingrain, Inc. | Method and system for integrating logging tool data and digital rock physics to estimate rock formation properties |
| US9222350B2 (en) | 2011-06-21 | 2015-12-29 | Diamond Innovations, Inc. | Cutter tool insert having sensing device |
| US9372162B2 (en)* | 2011-09-16 | 2016-06-21 | Ingrain, Inc. | Characterization of subterranean formation properties derived from quantitative X-Ray CT scans of drill cuttings |
| WO2013169137A1 (en)* | 2012-05-10 | 2013-11-14 | Siemens Aktiengesellschaft | Method and apparatus for analyzing a drill core sample |
| US9098889B2 (en)* | 2013-01-29 | 2015-08-04 | Schlumberger Technology Corporation | Method for quantitative prediction of matrix acidizing treatment outcomes |
| US20150062300A1 (en)* | 2013-08-30 | 2015-03-05 | Halliburton Energy Services, Inc. | Wormhole Structure Digital Characterization and Stimulation |
| US10294785B2 (en)* | 2014-12-30 | 2019-05-21 | Schlumberger Technology Corporation | Data extraction for OBM contamination monitoring |
| CN106383078B (en)* | 2016-09-20 | 2019-05-07 | 中国石油天然气股份有限公司 | Method and device for determining water drive efficiency of rock |
| RU2650706C1 (en)* | 2017-03-13 | 2018-04-17 | Федеральное государственное бюджетное образовательное учреждение высшего образования "Российский государственный университет нефти и газа (национальный исследовательский университет) имени И.М. Губкина" | Method for determining a coefficient of residual water saturation of rocks |
| US10739326B2 (en)* | 2017-05-15 | 2020-08-11 | Saudi Arabian Oil Company | Analyzing a rock sample |
| CN108320307B (en)* | 2018-01-19 | 2020-09-08 | 中国石油天然气股份有限公司 | Method and device for determining effective unit volume of reservoir rock sample |
| CN109345625B (en)* | 2018-08-27 | 2022-05-03 | 四川大学 | Rock core image self-adaptive partition three-dimensional reconstruction method |
| US11649723B2 (en)* | 2019-04-24 | 2023-05-16 | Cgg Services Sas | Method and system for estimating in-situ porosity using machine learning applied to cutting analysis |
| CN111624147B (en)* | 2020-04-16 | 2023-04-07 | 中国石油天然气股份有限公司 | Relative permeability measuring method and device for rock core |
| US11315228B2 (en)* | 2020-05-18 | 2022-04-26 | Accenture Global Solutions Limited | System and method for mineral exploration |
| CN113029899B (en)* | 2021-02-24 | 2022-07-01 | 西南石油大学 | Sandstone permeability calculation method based on microscopic image processing |
| CN113029911B (en)* | 2021-03-31 | 2022-12-20 | 中国科学院武汉岩土力学研究所 | A Calculation Method of Rock Porosity |
| US20230229827A1 (en)* | 2022-01-14 | 2023-07-20 | Saudi Arabian Oil Company | System and method for modeling a rock sample |
Citations (10)
| Publication number | Priority date | Publication date | Assignee | Title |
|---|---|---|---|---|
| US4253327A (en)* | 1979-09-17 | 1981-03-03 | Phillips Petroleum Company | Method and apparatus for measuring rock permeability at elevated pressures and temperature |
| US6516080B1 (en)* | 2000-04-05 | 2003-02-04 | The Board Of Trustees Of The Leland Stanford Junior University | Numerical method of estimating physical properties of three-dimensional porous media |
| US20040046690A1 (en)* | 2000-12-04 | 2004-03-11 | Brian Reeves | Slope monitoring system |
| US7120541B2 (en)* | 2004-05-18 | 2006-10-10 | Schlumberger Technology Corporation | Sonic well logging methods and apparatus utilizing parametric inversion dispersive wave processing |
| US7277795B2 (en)* | 2004-04-07 | 2007-10-02 | New England Research, Inc. | Method for estimating pore structure of porous materials and its application to determining physical properties of the materials |
| US7286939B2 (en)* | 2003-10-28 | 2007-10-23 | Westerngeco, L.L.C. | Method for estimating porosity and saturation in a subsurface reservoir |
| US20080025605A1 (en)* | 2006-07-31 | 2008-01-31 | Tooru Suino | Image display apparatus, image display method, and image display program |
| US20080037843A1 (en)* | 2006-08-11 | 2008-02-14 | Accuray Incorporated | Image segmentation for DRR generation and image registration |
| US20090288880A1 (en)* | 2008-05-21 | 2009-11-26 | Wojcik Zbigniew M | Method for estimating material properties of porous media using computer tomograpic images thereof |
| US20100128932A1 (en)* | 2008-11-24 | 2010-05-27 | Jack Dvorkin | Method for determining rock physics relationships using computer tomograpic images thereof |
- 2008
- 2008-11-24USUS12/276,431patent/US8170799B2/enactiveActive
- 2009
- 2009-11-20WOPCT/US2009/065246patent/WO2010059890A2/enactiveApplication Filing
Patent Citations (10)
| Publication number | Priority date | Publication date | Assignee | Title |
|---|---|---|---|---|
| US4253327A (en)* | 1979-09-17 | 1981-03-03 | Phillips Petroleum Company | Method and apparatus for measuring rock permeability at elevated pressures and temperature |
| US6516080B1 (en)* | 2000-04-05 | 2003-02-04 | The Board Of Trustees Of The Leland Stanford Junior University | Numerical method of estimating physical properties of three-dimensional porous media |
| US20040046690A1 (en)* | 2000-12-04 | 2004-03-11 | Brian Reeves | Slope monitoring system |
| US7286939B2 (en)* | 2003-10-28 | 2007-10-23 | Westerngeco, L.L.C. | Method for estimating porosity and saturation in a subsurface reservoir |
| US7277795B2 (en)* | 2004-04-07 | 2007-10-02 | New England Research, Inc. | Method for estimating pore structure of porous materials and its application to determining physical properties of the materials |
| US7120541B2 (en)* | 2004-05-18 | 2006-10-10 | Schlumberger Technology Corporation | Sonic well logging methods and apparatus utilizing parametric inversion dispersive wave processing |
| US20080025605A1 (en)* | 2006-07-31 | 2008-01-31 | Tooru Suino | Image display apparatus, image display method, and image display program |
| US20080037843A1 (en)* | 2006-08-11 | 2008-02-14 | Accuray Incorporated | Image segmentation for DRR generation and image registration |
| US20090288880A1 (en)* | 2008-05-21 | 2009-11-26 | Wojcik Zbigniew M | Method for estimating material properties of porous media using computer tomograpic images thereof |
| US20100128932A1 (en)* | 2008-11-24 | 2010-05-27 | Jack Dvorkin | Method for determining rock physics relationships using computer tomograpic images thereof |
Non-Patent Citations (14)
| Title |
|---|
| Adams et al., "Seeded Region Growing", IEEE Transactions on Pattern Analysis and Machine Intelligence, vol. 16 No. 6, Jun. 1994, pp. 641-647.* |
| Adams et al., "Seeded Region Growing," IEEE Transactions on Pattern Analysis and Machine Intelligence, vol. 16, No. 6, Jun. 1994, pp. 641-647 (7 pages). |
| Bugani et al, "Investigating morpholgical changes in treated vs. untreated stone building materials by x-ray micro-CT", Anal Boiannal. Chem (2008); 391.1343-1350. |
| De Graef et al, "A sensititvity study for the visualization of bacterial weathering of concrete and stone . . ." Science of the Total Environment 341 (2005) 173-183. |
| E. Galluci et al., "3D experimental investogation of the microstructure of cement pastes . . .", Cement and Concrete Research 37 (2007) 360-368. |
| Felipuissi et al, Measuring Statistical Geometric Properties of Tomographic Images of Soils, IEEE Trnasactions on Instrumentation and Measurement v. 57, No. 11, 2008. |
| International Search Report and Written Opinion of the International Searching Authority issued in corresponding International Patent Application No. PCT/US2009/065246 dated May 4, 2011 (12 pages). |
| Jones et al., "Chracterization of methane hydrate host sediments using synchrotron-computer miccrtotomography," J. Petr. Sci. and Eng. 56 (2007) 136-145. |
| Knackstedt et al., "Digital Core Laboratory: Properties of reservoir core derived from 3D images," Society of Petroleum Engineers Asia Pacific Conference on Integrated Modelling for Asset Management, SPE No. 87009, Mar. 29, 2004, pp. 1-14 (14 pages). |
| Oh et al., "Image Thresholding by Indicator Kriging," IEEE Transactions on Pattern Analysis and Machine Intelligence, vol. 21, No. 7, Jul. 1999, pp. 590-602 (13 pages). |
| Sakellariou et al., "Developing a Virtual Materials Laboratory," Materials Today, vol. 10, No. 12, Dec. 2007, pp. 44-51 (8 pages). |
| Sakellariou et al., "Developing a Virtual Materials Laboratory," Materials Today, vol. 10, No. 12, Dec. 2007, pp. 44-51.* |
| Sandberg, "Methods for Image Segmentation in Cellular Tomography," Methods in Cell Biology, vol. 79, Jan. 1, 2007, pp. 769-798 (32 pages). |
| Youssef et al., "High Resolution CT and Pore-Network Models to Assess Petrophysical Properties of Homogeneous and Heterogeneous Carbonates," Society of Petroleum Engineers/EAGE Reservoir Characterization and Simulation Conference, SPE No. 111427, Oct. 29, 2007, pp. 1-12 (12 pages). |
Cited By (38)
| Publication number | Priority date | Publication date | Assignee | Title |
|---|---|---|---|---|
| US8331626B2 (en)* | 2008-05-21 | 2012-12-11 | Ingrain, Inc. | Method for estimating material properties of porous media using computer tomographic images thereof |
| US20090288880A1 (en)* | 2008-05-21 | 2009-11-26 | Wojcik Zbigniew M | Method for estimating material properties of porous media using computer tomograpic images thereof |
| US8614929B2 (en)* | 2009-10-21 | 2013-12-24 | IFP Energies Nouvelles | Method for interpreting repetitive seismic data considering seismic frequency band in the evaluation of pore pressures |
| US20110090758A1 (en)* | 2009-10-21 | 2011-04-21 | Patrick Rasolofosaon | Method for interpreting repetitive seismic data considering seismic frequency band in the evaluation of pore pressures |
| US20120304763A1 (en)* | 2011-06-06 | 2012-12-06 | Troxler Electronic Laboratories, Inc. | Optical method and apparatus for determining a characteristic such as volume and density of an excavated void in a construction material |
| US9273951B2 (en)* | 2011-06-06 | 2016-03-01 | Troxler Electronic Laboratories, Inc. | Optical method and apparatus for determining a characteristic such as volume and density of an excavated void in a construction material |
| WO2013147995A1 (en) | 2012-03-30 | 2013-10-03 | Ingrain, Inc. | An efficient method for selecting representative elementary volume in digital representations of porous media |
| US20130301794A1 (en)* | 2012-05-11 | 2013-11-14 | Ingrain, Inc. | Method And System For Multi-Energy Computer Tomographic Cuttings Analysis |
| US9746431B2 (en)* | 2012-05-11 | 2017-08-29 | Ingrain, Inc. | Method and system for multi-energy computer tomographic cuttings analysis |
| US20140019053A1 (en)* | 2012-07-13 | 2014-01-16 | Ingrain, Inc. | Method For Evaluating Relative Permeability For Fractional Multi-Phase, Multi-Component Fluid Flow Through Porous Media |
| US9140117B2 (en)* | 2012-07-13 | 2015-09-22 | Ingrain, Inc. | Method for evaluating relative permeability for fractional multi-phase, multi-component fluid flow through porous media |
| US9396547B2 (en) | 2012-08-10 | 2016-07-19 | Ingrain, Inc. | Output display for segmented digital volume representing porous media |
| US9047513B2 (en) | 2012-08-10 | 2015-06-02 | Ingrain, Inc. | Method for improving the accuracy of rock property values derived from digital images |
| US20140052420A1 (en)* | 2012-08-20 | 2014-02-20 | Ingrain Inc. | Digital Rock Analysis Systems and Methods that Estimate a Maturity Level |
| US9127529B2 (en) | 2012-11-01 | 2015-09-08 | Ingrain, Inc. | Process and system for preparation of X-ray scannable sample-embedded sliver for characterization of rock and other samples |
| US9348056B2 (en) | 2013-08-06 | 2016-05-24 | Bp Corporation North America Inc. | Image-based direct numerical simulation of petrophysical properties under simulated stress and strain conditions |
| US10054577B2 (en) | 2014-08-19 | 2018-08-21 | Ingrain, Inc. | Method and system for obtaining geochemistry information from pyrolysis induced by laser induced breakdown spectroscopy |
| US20160131793A1 (en)* | 2014-11-07 | 2016-05-12 | Ge Energy Oilfield Technology, Inc. | System and Method For Wellsite Core Sample Analysis |
| US10001446B2 (en) | 2014-11-07 | 2018-06-19 | Ge Energy Oilfield Technology, Inc. | Core sample analysis |
| US9970888B2 (en)* | 2014-11-07 | 2018-05-15 | Ge Energy Oilfield Technology, Inc. | System and method for wellsite core sample analysis |
| WO2016085833A1 (en) | 2014-11-25 | 2016-06-02 | Ingrain, Inc. | Fluid characterization of porous materials libs |
| US10324039B2 (en) | 2014-11-25 | 2019-06-18 | Halliburton Energy Services, Inc. | Fluid characterization of porous materials LIBS |
| US10261204B2 (en) | 2014-12-31 | 2019-04-16 | Ge Energy Oilfield Technology, Inc. | Methods and systems for scan analysis of a core sample |
| US10031148B2 (en) | 2014-12-31 | 2018-07-24 | Ge Energy Oilfield Technology, Inc. | System for handling a core sample |
| US10113952B2 (en) | 2015-06-01 | 2018-10-30 | Ingrain, Inc. | Combined vibrational spectroscopy and laser induced breakdown spectroscopy for improved mineralogical and geochemical characterization of petroleum source or reservoir rocks |
| CN105068141B (en)* | 2015-06-11 | 2017-05-10 | 中国石油天然气股份有限公司 | Method and device for determining karst reservoir distribution of fracture system |
| CN105068141A (en)* | 2015-06-11 | 2015-11-18 | 中国石油天然气股份有限公司 | Method and device for determining karst reservoir distribution of fracture system |
| US10139347B2 (en) | 2015-09-23 | 2018-11-27 | Halliburton Energy Services, Inc. | Measurement of noble gas adsorption via laser-induced breakdown spectroscopy for wettability determination |
| RU2621371C1 (en)* | 2016-07-13 | 2017-06-02 | Федеральное государственное бюджетное образовательное учреждение высшего образования "Российский государственный университет нефти и газа (национальный исследовательский университет) имени И.М. Губкина" | Method of investigation of filtration-capacitive properties of mineral rocks |
| US10480311B2 (en) | 2017-06-30 | 2019-11-19 | Baker Hughes, A Ge Company, Llc | Downhole intervention operation optimization |
| US10991078B2 (en) | 2017-09-15 | 2021-04-27 | Saudi Arabian Oil Company | Inferring petrophysical properties of hydrocarbon reservoirs using a neural network |
| US10983237B2 (en) | 2018-04-13 | 2021-04-20 | Saudi Arabian Oil Company | Enhancing seismic images |
| US11009497B2 (en) | 2018-06-22 | 2021-05-18 | Bp Corporation North America Inc. | Systems and methods for estimating mechanical properties of rocks using grain contact models |
| US10891462B2 (en) | 2018-06-29 | 2021-01-12 | Saudi Arabian Oil Company | Identifying geometrical properties of rock structure through digital imaging |
| US12315137B2 (en) | 2020-08-06 | 2025-05-27 | Schlumberger Technology Corporation | Cuttings imaging for determining geological properties |
| US11668847B2 (en) | 2021-01-04 | 2023-06-06 | Saudi Arabian Oil Company | Generating synthetic geological formation images based on rock fragment images |
| US12123299B2 (en) | 2021-08-31 | 2024-10-22 | Saudi Arabian Oil Company | Quantitative hydraulic fracturing surveillance from fiber optic sensing using machine learning |
| US12422588B2 (en) | 2022-07-21 | 2025-09-23 | Schlumberger Technology Corporation | Formation porosity estimation from digital images |
Also Published As
| Publication number | Publication date |
|---|---|
| US20100131204A1 (en) | 2010-05-27 |
| WO2010059890A3 (en) | 2011-06-16 |
| WO2010059890A2 (en) | 2010-05-27 |
Similar Documents
| Publication | Publication Date | Title |
|---|---|---|
| US8170799B2 (en) | Method for determining in-situ relationships between physical properties of a porous medium from a sample thereof | |
| US8155377B2 (en) | Method for determining rock physics relationships using computer tomographic images thereof | |
| US8081802B2 (en) | Method for determining permeability of rock formation using computer tomograpic images thereof | |
| CA2646857C (en) | Method for estimating material properties of porous media using computer tomographic images thereof | |
| US8081796B2 (en) | Method for determining properties of fractured rock formations using computer tomograpic images thereof | |
| EP2359311B1 (en) | Method for determining elastic-wave attenuation of rock formations using computer tomograpic images thereof | |
| US8583410B2 (en) | Method for obtaining consistent and integrated physical properties of porous media | |
| EP3350413B1 (en) | Method and system for determining porosity associated with organic matter in a well or formation | |
| Njiekak et al. | Pore systems in carbonate formations, Weyburn field, Saskatchewan, Canada: Micro-tomography, helium porosimetry and mercury intrusion porosimetry characterization | |
| Siddiqui et al. | Trends in CT‐Scanning of Reservoir Rocks: Medical CT to Micro CT | |
| Rahim et al. | Coal Adsorption: Comparison Between the 3D Imaging of Gas Sorption Isotherms by X-rays Computed Tomography–A Review | |
| Lakshtanov et al. | Innovations in low UCS core acquisition and quality assessment using digital rock physics | |
| Diaz et al. | Digital Rock Physics–From Pore to Core |
Legal Events
| Date | Code | Title | Description |
|---|---|---|---|
| AS | Assignment | Owner name:INGRAIN, INC., TEXAS Free format text:ASSIGNMENT OF ASSIGNORS INTEREST;ASSIGNORS:DERZHI, NAUM;DVORKIN, JACK;ARMBRUSTER, MEGHAN;AND OTHERS;REEL/FRAME:021879/0795 Effective date:20081120 | |
| AS | Assignment | Owner name:INGRAIN, INC., TEXAS Free format text:CORRECTIVE ASSIGNMENT TO CORRECT THE NAME OF THE ASSIGNOR, PREVIOUSLY RECORDED ON REEL 021879 FRAME 0795;ASSIGNORS:DVORKIN, JACK;DERZHI, NAUM;ARMBRUSTER, MEGHAN;AND OTHERS;REEL/FRAME:023334/0607 Effective date:20081120 | |
| STCF | Information on status: patent grant | Free format text:PATENTED CASE | |
| AS | Assignment | Owner name:COMERICA BANK, MICHIGAN Free format text:SECURITY INTEREST;ASSIGNOR:INGRAIN, INC.;REEL/FRAME:034797/0255 Effective date:20141222 | |
| FPAY | Fee payment | Year of fee payment:4 | |
| AS | Assignment | Owner name:GEMCAP LENDING I, LLC, CALIFORNIA Free format text:SECURITY INTEREST;ASSIGNOR:INGRAIN, INC.;REEL/FRAME:039973/0886 Effective date:20160831 | |
| FEPP | Fee payment procedure | Free format text:PAT HOLDER NO LONGER CLAIMS SMALL ENTITY STATUS, ENTITY STATUS SET TO UNDISCOUNTED (ORIGINAL EVENT CODE: STOL); ENTITY STATUS OF PATENT OWNER: LARGE ENTITY | |
| AS | Assignment | Owner name:INGRAIN, INC., TEXAS Free format text:RELEASE BY SECURED PARTY;ASSIGNOR:COMERICA BANK;REEL/FRAME:042900/0176 Effective date:20170629 Owner name:INGRAIN, INC., TEXAS Free format text:RELEASE BY SECURED PARTY;ASSIGNOR:GEMCAP LENDING I, LLC;REEL/FRAME:043090/0263 Effective date:20170705 | |
| AS | Assignment | Owner name:HALLIBURTON ENERGY SERVICES, INC., TEXAS Free format text:ASSIGNMENT OF ASSIGNORS INTEREST;ASSIGNOR:INGRAIN, INC.;REEL/FRAME:047024/0084 Effective date:20180301 | |
| MAFP | Maintenance fee payment | Free format text:PAYMENT OF MAINTENANCE FEE, 8TH YEAR, LARGE ENTITY (ORIGINAL EVENT CODE: M1552); ENTITY STATUS OF PATENT OWNER: LARGE ENTITY Year of fee payment:8 | |
| MAFP | Maintenance fee payment | Free format text:PAYMENT OF MAINTENANCE FEE, 12TH YEAR, LARGE ENTITY (ORIGINAL EVENT CODE: M1553); ENTITY STATUS OF PATENT OWNER: LARGE ENTITY Year of fee payment:12 |