US8128871B2 - Lateral flow assay systems and methods - Google Patents
Lateral flow assay systems and methodsDownload PDFInfo
- Publication number
- US8128871B2 US8128871B2US11/112,807US11280705AUS8128871B2US 8128871 B2US8128871 B2US 8128871B2US 11280705 AUS11280705 AUS 11280705AUS 8128871 B2US8128871 B2US 8128871B2
- Authority
- US
- United States
- Prior art keywords
- light
- intensity measurements
- light intensity
- detection zone
- operable
- Prior art date
- Legal status (The legal status is an assumption and is not a legal conclusion. Google has not performed a legal analysis and makes no representation as to the accuracy of the status listed.)
- Active, expires
Links
Images


Classifications
- G—PHYSICS
- G01—MEASURING; TESTING
- G01N—INVESTIGATING OR ANALYSING MATERIALS BY DETERMINING THEIR CHEMICAL OR PHYSICAL PROPERTIES
- G01N33/00—Investigating or analysing materials by specific methods not covered by groups G01N1/00 - G01N31/00
- G01N33/48—Biological material, e.g. blood, urine; Haemocytometers
- G01N33/50—Chemical analysis of biological material, e.g. blood, urine; Testing involving biospecific ligand binding methods; Immunological testing
- G01N33/53—Immunoassay; Biospecific binding assay; Materials therefor
- G01N33/543—Immunoassay; Biospecific binding assay; Materials therefor with an insoluble carrier for immobilising immunochemicals
- G01N33/54366—Apparatus specially adapted for solid-phase testing
- G01N33/54386—Analytical elements
- G01N33/54387—Immunochromatographic test strips
- G01N33/54388—Immunochromatographic test strips based on lateral flow
- G—PHYSICS
- G01—MEASURING; TESTING
- G01N—INVESTIGATING OR ANALYSING MATERIALS BY DETERMINING THEIR CHEMICAL OR PHYSICAL PROPERTIES
- G01N21/00—Investigating or analysing materials by the use of optical means, i.e. using sub-millimetre waves, infrared, visible or ultraviolet light
- G01N21/17—Systems in which incident light is modified in accordance with the properties of the material investigated
- G01N21/25—Colour; Spectral properties, i.e. comparison of effect of material on the light at two or more different wavelengths or wavelength bands
- G01N21/27—Colour; Spectral properties, i.e. comparison of effect of material on the light at two or more different wavelengths or wavelength bands using photo-electric detection ; circuits for computing concentration
- G01N21/274—Calibration, base line adjustment, drift correction
- G—PHYSICS
- G01—MEASURING; TESTING
- G01N—INVESTIGATING OR ANALYSING MATERIALS BY DETERMINING THEIR CHEMICAL OR PHYSICAL PROPERTIES
- G01N21/00—Investigating or analysing materials by the use of optical means, i.e. using sub-millimetre waves, infrared, visible or ultraviolet light
- G01N21/62—Systems in which the material investigated is excited whereby it emits light or causes a change in wavelength of the incident light
- G01N21/63—Systems in which the material investigated is excited whereby it emits light or causes a change in wavelength of the incident light optically excited
- G01N21/64—Fluorescence; Phosphorescence
- G01N21/6428—Measuring fluorescence of fluorescent products of reactions or of fluorochrome labelled reactive substances, e.g. measuring quenching effects, using measuring "optrodes"
- G—PHYSICS
- G01—MEASURING; TESTING
- G01N—INVESTIGATING OR ANALYSING MATERIALS BY DETERMINING THEIR CHEMICAL OR PHYSICAL PROPERTIES
- G01N21/00—Investigating or analysing materials by the use of optical means, i.e. using sub-millimetre waves, infrared, visible or ultraviolet light
- G01N21/84—Systems specially adapted for particular applications
- G01N21/8483—Investigating reagent band
- G—PHYSICS
- G01—MEASURING; TESTING
- G01N—INVESTIGATING OR ANALYSING MATERIALS BY DETERMINING THEIR CHEMICAL OR PHYSICAL PROPERTIES
- G01N33/00—Investigating or analysing materials by specific methods not covered by groups G01N1/00 - G01N31/00
- G01N33/48—Biological material, e.g. blood, urine; Haemocytometers
- G01N33/50—Chemical analysis of biological material, e.g. blood, urine; Testing involving biospecific ligand binding methods; Immunological testing
- G01N33/53—Immunoassay; Biospecific binding assay; Materials therefor
- G01N33/543—Immunoassay; Biospecific binding assay; Materials therefor with an insoluble carrier for immobilising immunochemicals
- G01N33/54393—Improving reaction conditions or stability, e.g. by coating or irradiation of surface, by reduction of non-specific binding, by promotion of specific binding
- G—PHYSICS
- G01—MEASURING; TESTING
- G01N—INVESTIGATING OR ANALYSING MATERIALS BY DETERMINING THEIR CHEMICAL OR PHYSICAL PROPERTIES
- G01N33/00—Investigating or analysing materials by specific methods not covered by groups G01N1/00 - G01N31/00
- G01N33/48—Biological material, e.g. blood, urine; Haemocytometers
- G01N33/50—Chemical analysis of biological material, e.g. blood, urine; Testing involving biospecific ligand binding methods; Immunological testing
- G01N33/58—Chemical analysis of biological material, e.g. blood, urine; Testing involving biospecific ligand binding methods; Immunological testing involving labelled substances
- G—PHYSICS
- G01—MEASURING; TESTING
- G01N—INVESTIGATING OR ANALYSING MATERIALS BY DETERMINING THEIR CHEMICAL OR PHYSICAL PROPERTIES
- G01N21/00—Investigating or analysing materials by the use of optical means, i.e. using sub-millimetre waves, infrared, visible or ultraviolet light
- G01N21/62—Systems in which the material investigated is excited whereby it emits light or causes a change in wavelength of the incident light
- G01N21/63—Systems in which the material investigated is excited whereby it emits light or causes a change in wavelength of the incident light optically excited
- G01N21/64—Fluorescence; Phosphorescence
- G01N21/6428—Measuring fluorescence of fluorescent products of reactions or of fluorochrome labelled reactive substances, e.g. measuring quenching effects, using measuring "optrodes"
- G01N2021/6439—Measuring fluorescence of fluorescent products of reactions or of fluorochrome labelled reactive substances, e.g. measuring quenching effects, using measuring "optrodes" with indicators, stains, dyes, tags, labels, marks
- G—PHYSICS
- G01—MEASURING; TESTING
- G01N—INVESTIGATING OR ANALYSING MATERIALS BY DETERMINING THEIR CHEMICAL OR PHYSICAL PROPERTIES
- G01N2201/00—Features of devices classified in G01N21/00
- G01N2201/06—Illumination; Optics
- G01N2201/062—LED's
- G—PHYSICS
- G01—MEASURING; TESTING
- G01N—INVESTIGATING OR ANALYSING MATERIALS BY DETERMINING THEIR CHEMICAL OR PHYSICAL PROPERTIES
- G01N2201/00—Features of devices classified in G01N21/00
- G01N2201/06—Illumination; Optics
- G01N2201/067—Electro-optic, magneto-optic, acousto-optic elements
- Y—GENERAL TAGGING OF NEW TECHNOLOGICAL DEVELOPMENTS; GENERAL TAGGING OF CROSS-SECTIONAL TECHNOLOGIES SPANNING OVER SEVERAL SECTIONS OF THE IPC; TECHNICAL SUBJECTS COVERED BY FORMER USPC CROSS-REFERENCE ART COLLECTIONS [XRACs] AND DIGESTS
- Y10—TECHNICAL SUBJECTS COVERED BY FORMER USPC
- Y10S—TECHNICAL SUBJECTS COVERED BY FORMER USPC CROSS-REFERENCE ART COLLECTIONS [XRACs] AND DIGESTS
- Y10S435/00—Chemistry: molecular biology and microbiology
- Y10S435/805—Test papers
- Y—GENERAL TAGGING OF NEW TECHNOLOGICAL DEVELOPMENTS; GENERAL TAGGING OF CROSS-SECTIONAL TECHNOLOGIES SPANNING OVER SEVERAL SECTIONS OF THE IPC; TECHNICAL SUBJECTS COVERED BY FORMER USPC CROSS-REFERENCE ART COLLECTIONS [XRACs] AND DIGESTS
- Y10—TECHNICAL SUBJECTS COVERED BY FORMER USPC
- Y10S—TECHNICAL SUBJECTS COVERED BY FORMER USPC CROSS-REFERENCE ART COLLECTIONS [XRACs] AND DIGESTS
- Y10S435/00—Chemistry: molecular biology and microbiology
- Y10S435/8215—Microorganisms
- Y10S435/822—Microorganisms using bacteria or actinomycetales
- Y10S435/823—Acetobacter
- Y—GENERAL TAGGING OF NEW TECHNOLOGICAL DEVELOPMENTS; GENERAL TAGGING OF CROSS-SECTIONAL TECHNOLOGIES SPANNING OVER SEVERAL SECTIONS OF THE IPC; TECHNICAL SUBJECTS COVERED BY FORMER USPC CROSS-REFERENCE ART COLLECTIONS [XRACs] AND DIGESTS
- Y10—TECHNICAL SUBJECTS COVERED BY FORMER USPC
- Y10S—TECHNICAL SUBJECTS COVERED BY FORMER USPC CROSS-REFERENCE ART COLLECTIONS [XRACs] AND DIGESTS
- Y10S436/00—Chemistry: analytical and immunological testing
- Y10S436/807—Apparatus included in process claim, e.g. physical support structures
- Y10S436/809—Multifield plates or multicontainer arrays
- Y—GENERAL TAGGING OF NEW TECHNOLOGICAL DEVELOPMENTS; GENERAL TAGGING OF CROSS-SECTIONAL TECHNOLOGIES SPANNING OVER SEVERAL SECTIONS OF THE IPC; TECHNICAL SUBJECTS COVERED BY FORMER USPC CROSS-REFERENCE ART COLLECTIONS [XRACs] AND DIGESTS
- Y10—TECHNICAL SUBJECTS COVERED BY FORMER USPC
- Y10S—TECHNICAL SUBJECTS COVERED BY FORMER USPC CROSS-REFERENCE ART COLLECTIONS [XRACs] AND DIGESTS
- Y10S436/00—Chemistry: analytical and immunological testing
- Y10S436/807—Apparatus included in process claim, e.g. physical support structures
- Y10S436/81—Tube, bottle, or dipstick
- Y—GENERAL TAGGING OF NEW TECHNOLOGICAL DEVELOPMENTS; GENERAL TAGGING OF CROSS-SECTIONAL TECHNOLOGIES SPANNING OVER SEVERAL SECTIONS OF THE IPC; TECHNICAL SUBJECTS COVERED BY FORMER USPC CROSS-REFERENCE ART COLLECTIONS [XRACs] AND DIGESTS
- Y10—TECHNICAL SUBJECTS COVERED BY FORMER USPC
- Y10S—TECHNICAL SUBJECTS COVERED BY FORMER USPC CROSS-REFERENCE ART COLLECTIONS [XRACs] AND DIGESTS
- Y10S436/00—Chemistry: analytical and immunological testing
- Y10S436/823—Immunogenic carrier or carrier per se
- Y—GENERAL TAGGING OF NEW TECHNOLOGICAL DEVELOPMENTS; GENERAL TAGGING OF CROSS-SECTIONAL TECHNOLOGIES SPANNING OVER SEVERAL SECTIONS OF THE IPC; TECHNICAL SUBJECTS COVERED BY FORMER USPC CROSS-REFERENCE ART COLLECTIONS [XRACs] AND DIGESTS
- Y10—TECHNICAL SUBJECTS COVERED BY FORMER USPC
- Y10T—TECHNICAL SUBJECTS COVERED BY FORMER US CLASSIFICATION
- Y10T436/00—Chemistry: analytical and immunological testing
- Y10T436/25—Chemistry: analytical and immunological testing including sample preparation
- Y10T436/25125—Digestion or removing interfering materials
Definitions
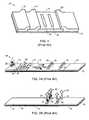
- FIG. 1shows a typical lateral flow test strip 10 that includes a sample receiving zone 12 , a labeling zone 14 , a detection zone 15 , and an absorbent zone 20 on a common substrate 22 .
- These zones 12 - 20typically are made of a material (e.g., chemically-treated nitrocellulose) that allows fluid to flow from the sample receiving zone 12 to the absorbent zone 220 by capillary action.
- the detection zone 15includes a test region 16 for detecting the presence of a target analyte in a fluid sample and a control region 18 for indicating the completion of an assay test.
- FIGS. 2A and 2Bshow an assay performed by an exemplary implementation of the test strip 10 .
- a fluid sample 24e.g., blood, urine, or saliva
- the fluid sample 24includes a target analyte 26 (i.e., a molecule or compound that can be assayed by the test strip 10 ).
- Capillary actiondraws the liquid sample 24 downstream into the labeling zone 14 , which contains a substance 28 for indirect labeling of the target analyte 16 .
- the labeling substance 28consists of an immunoglobulin 30 with an attached dye molecule 32 .
- the immunoglobulin 30specifically binds the target analyte 26 to form a labeled target analyte complex.
- the labeling substance 28is a non-immunoglobulin labeled compound that specifically binds the target analyte 26 to form a labeled target analyte complex.
- the labeled target analyte complexes, along with excess quantities of the labeling substance,are carried along the lateral flow path into the test region 16 , which contains immobilized compounds 34 that are capable of specifically binding the target analyte 26 .
- the immobilized compounds 34are immunoglobulins that specifically bind the labeled target analyte complexes and thereby retain the labeled target analyte complexes in the test region 16 .
- the presence of the labeled analyte in the sampletypically is evidenced by a visually detectable coloring of the test region 16 that appears as a result of the accumulation of the labeling substance in the test region 16 .
- the control region 18typically is designed to indicate that an assay has been performed to completion. Compounds 35 in the control region 18 bind and retain the labeling substance 28 .
- the labeling substance 28typically becomes visible in the control region 18 after a sufficient quantity of the labeling substance 28 has accumulated.
- the test region 16will not be colored, whereas the control region 18 will be colored to indicate that assay has been performed.
- the absorbent zone 20captures excess quantities of the fluid sample 24 .
- a portable lateral flow assay readerperforms assays on bodily fluids to detect the presence of certain hormones, glucose, or other bodily fluids of interest.
- Membrane test strips containing a fluid sampleare inserted directly into a receiving port of a reader.
- the receiving portis shielded to improve sensitivity and reduce the entry of stray or ambient light into the reader.
- the readerincludes a light source and one or more sensors that detect the intensity of light reflected from the detection zones of the test strips that are inserted into the receiving port.
- a readerdetects an intensity of a detection signal arising in one or more measurement zones in a detection zone of a lateral flow assay test strip as a result of the presence of an immobilized labeled target analyte complex.
- the readergenerates a baseline of signal intensity from the measurement zones by interpolating between values of the detection signal outside of the measurement zones and inside of the detection zone.
- the readerquantifies a value of signal intensity representative of the immobilized labeled target analyte complex with respect to the baseline.
- the readerlocates a beginning boundary and an ending boundary for the one or more measurement zones on the test strip, allowing an automatic or semi-automatic analytical instrument, or a human reader, to determine certain results of the lateral flow assay.
- the signals from the measurement zonesare quantified or compared with respect to the baseline. Quantified values corresponding to the respective concentration of compounds in different measurement zones may then be compared with one another to detect the presence of antigens in the sample.
- the measurements that are made by the above-described lateral flow assay readersare based on signals from regions of the test strips that typically are significantly larger than the regions of interest. As a result, these measurements tend to have high noise levels and, consequently, these measurements may yield inaccurate or incorrect results when low concentrations of analytes are involved.
- the inventionfeatures a diagnostic test system that includes a housing, a reader, and a data analyzer.
- the housingincludes a port for receiving a test strip.
- the test stripsupports lateral flow of a fluid sample along a lateral flow direction and includes a labeling zone containing a labeling substance that binds a label to a target analyte and a detection zone comprising at least one test region containing an immobilized substance that binds the target analyte.
- the detection zoneincludes an area that is exposed for optical inspection and is characterized by a first dimension transverse to the lateral flow direction and a second dimension parallel to the lateral flow direction.
- the readeris configured to obtain separable light intensity measurements from localized regions of the exposed area of the detection zone when the test strip is loaded in the port, wherein each of the localized regions is characterized by at least one surface dimension smaller than the first dimension.
- the data analyzeris operable to identify ones of the light intensity measurements obtained from the at least one test region and to compute at least one parameter from the identified ones of the light intensity measurements.
- the inventionfeatures a diagnostic test system that includes a housing, a reader, and a data analyzer.
- the housingincludes a port for receiving a test strip.
- the test stripsupports lateral flow of a fluid sample along a lateral flow direction and includes a labeling zone containing a labeling substance that binds a label to a target analyte and a detection zone comprising at least one test region containing an immobilized substance that binds the target analyte and an area that is exposed for optical inspection.
- the readeris configured to obtain a respective set of light intensity measurements from each of multiple corresponding regions of the exposed surface area of the detection zone when the test strip is loaded in the port.
- the data analyzeris operable to compute at least one parameter from at least one of the sets of light intensity measurements.
- the inventionfeatures a diagnostic test method.
- a test stripis received.
- the test stripsupports lateral flow of a fluid sample along a lateral flow direction and includes a labeling zone containing a labeling substance that binds a label to a target analyte and a detection zone comprising at least one test region containing an immobilized substance that binds the target analyte.
- the detection zoneincludes an area that is exposed for optical inspection and is characterized by a first dimension transverse to the lateral flow direction and a second dimension parallel to the lateral flow direction.
- Separable light intensity measurementsare obtained from localized regions of the exposed area of the detection zone, wherein each of the localized regions is characterized by at least one surface dimension smaller than the first dimension.
- Ones of the light intensity measurements obtained from the at least one test regionare identified.
- At least one parameteris computed from the identified ones of the light intensity measurements.
- the inventionfeatures a diagnostic test method.
- a test stripis received.
- the test stripsupports lateral flow of a fluid sample along a lateral flow direction and includes a labeling zone containing a labeling substance that binds a label to a target analyte and a detection zone comprising at least one test region containing an immobilized substance that binds the target analyte and an area that is exposed for optical inspection.
- a respective set of light intensity measurementsis obtained from each of multiple corresponding regions of the exposed surface area of the detection zone when the test strip is loaded in the port.
- At least one parameteris computed from at least one of the sets of light intensity measurements.
- FIG. 1is a diagrammatic view of a prior art implementation of a lateral flow assay test strip.
- FIG. 2Ais a diagrammatic view of a fluid sample being applied to an application zone of the lateral flow assay test strip shown in FIG. 1 .
- FIG. 2Bis a diagrammatic view of the lateral flow assay test strip shown in FIG. 2A after the fluid sample has flowed across the test strip to an absorption zone.
- FIG. 3is a block diagram of a test strip that is loaded into an embodiment of a diagnostic test system.
- FIG. 4is a flow diagram of an embodiment of a diagnostic test method.
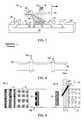
- FIG. 5Ais a diagrammatic side view of an implementation of the diagnostic test system shown in FIG. 3 that includes a two-dimensional light detector array obtaining light intensity measurements from regions of a test strip.
- FIG. 5Bis a diagrammatic view of the two-dimensional light detector array shown in FIG. 5A in which ones of the light detectors that are positioned to obtain light intensity measurements from the test region and the control region are highlighted.
- FIG. 6is an exemplary graph of light intensity plotted as a function of position in the two-dimensional light detector array shown in FIGS. 5A and 5B .
- FIG. 7is a diagrammatic view of an implementation of the diagnostic test system shown in FIG. 3 that includes a linear light detector array obtaining light intensity measurements from regions of a test strip.
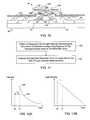
- FIG. 8is an exemplary graph of aggregate light intensity obtained by the linear light detector array shown in FIG. 7 plotted as a function of time.
- FIG. 9is a diagrammatic top view of an implementation of the diagnostic test system shown in FIG. 3 that includes a light source scanning a light beam over regions of a test strip.
- FIG. 10is a diagrammatic side view of an implementation of the diagnostic test system shown in FIG. 3 that includes an aperture plate allowing selective detection of light from the test region and the control region of a test strip.
- FIG. 11is a flow diagram of an embodiment of a method of a diagnostic test method.
- FIG. 12Ais a graph of intensity plotted as a function of time.
- FIG. 12Bis a graph of the logarithm of the intensity values shown in FIG. 12A plotted as a function of time.
- FIGS. 13A and 13Bshow respective graphs of the logarithms of two sets of light intensity measurements plotted as functions of time.
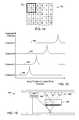
- FIG. 14is a diagrammatic view of a portion of an embodiment of a color filter array.
- FIG. 15is a graph of aggregate intensity for four different color channels plotted as a function of position along the lateral flow direction in a two-dimensional light detector array.
- FIG. 16is a diagrammatic side view of an implementation of the diagnostic test system shown in FIG. 3
- Some of the embodiments that are described in detail belowreduce levels of noise (e.g., noise caused by reflection of light or intrinsic fluorescence from materials in the test strip) in lateral flow assay measurements by restricting the measurements to the regions of interest on the test strip from which the desired quantitative information may be derived.
- these embodimentsincrease the signal-to-noise levels of these measurements and, thereby, increase measurement sensitivity and reduce the incidence of erroneous results for low concentrations of analytes.
- Some of these embodimentsalso increase the accuracy of the lateral flow assay results by obtaining respective sets of measurements from localized regions of the test strip from which additional analytical information about these regions may be obtained. This additional information may be used to isolate target measurements from background noise and to derive more accurate estimates of target parameter values.
- Some embodimentsalso are capable of accurately reading multiple analytes from the same test strip.
- FIG. 3shows an embodiment of a diagnostic test system 40 that includes a housing 42 , a reader 44 , a data analyzer 46 , and a memory 47 .
- the housing 42includes a port 48 for receiving a test strip 50 .
- the reader 44obtains light intensity measurements from the test strip 50 .
- the light intensity measurementsmay be unfiltered or they may be filtered in terms of at least one of wavelength and polarization.
- the data analyzer 46computes at least one parameter from one or more of the light intensity measurements.
- a results indicator 52provides an indication of one or more of the results of an assay of the test strip 50 .
- the diagnostic test system 40is fabricated from relatively inexpensive components enabling it to be used for disposable or single-use applications.
- the housing 42may be made of any one of a wide variety of materials, including plastic and metal.
- the housing 42forms a protective enclosure for the reader 44 , the data analyzer 46 , the power supply 54 , and other components of the diagnostic test system 40 .
- the housing 42also defines a receptacle that mechanically registers the test strip 50 with respect to the reader 44 .
- the receptaclemay be designed to receive any one of a wide variety of different types of test strips 50 , including test strips of the type shown in FIG. 1 .
- each of the test strips 50supports lateral flow of a fluid sample along a lateral flow direction 51 and includes a labeling zone containing a labeling substance that binds a label to a target analyte and a detection zone that includes at least one test region containing an immobilized substance that binds the target analyte.
- One or more areas of the detection zone, including at least a portion of the test region,are exposed for optical inspection by the reader 44 .
- the exposed areas of the detection zonemay or may not be covered by an optically transparent window.
- the reader 44includes one or more optoelectronic components for optically inspecting the exposed areas of the detection zone of the test strip 50 .
- the reader 44includes at least one light source and at least one light detector.
- the light sourcemay include a semiconductor light-emitting diode and the light detector may include a semiconductor photodiode.
- the light sourcemay be designed to emit light within a particular wavelength range or light with a particular polarization. For example, if the label is a fluorescent label, such as a quantum dot, the light source would be designed to illuminate the exposed areas of the detection zone of the test strip 50 with light in a wavelength range that induces fluorescence from the label.
- the light detectormay be designed to selectively capture light from the exposed areas of the detection zone.
- the labelis a fluorescent label
- the light detectorwould be designed to selectively capture light within the wavelength range of the fluorescent light emitted by the label or with light of a particular polarization.
- the labelis a reflective-type label
- the light detectorwould be designed to selectively capture light within the wavelength range of the light emitted by the light source.
- the light detectormay include one or more optical filters that define the wavelength ranges or polarizations axes of the captured light.
- the data analyzer 46processes the light intensity measurements that are obtained by the reader 44 .
- the data analyzer 46may be implemented in any computing or processing environment, including in digital electronic circuitry or in computer hardware, firmware, or software.
- the data analyzer 46includes a processor (e.g., a microcontroller, a microprocessor, or ASIC) and an analog-to-digital converter.
- the data analyzer 46is incorporated within the housing 42 of the diagnostic test system 40 .
- the data analyzer 46is located in a separate device, such as a computer, that may communicate with the diagnostic test system 40 over a wired or wireless connection.
- the results indicator 52may include any one of a wide variety of different mechanisms for indicating one or more results of an assay test.
- the results indicator 52includes one or more lights (e.g., light-emitting diodes) that are activated to indicate, for example, a positive test result and the completion of the assay test (i.e., when sufficient quantity of labeling substance 28 has accumulated in the control region).
- the results indicator 52includes an alphanumeric display (e.g., a two or three character light-emitting diode array) for presenting assay test results.
- a power supply 54supplies power to the active components of the diagnostic test system 40 , including the reader 44 , the data analyzer 46 , and the results indicator 52 .
- the power supply 54may be implemented by, for example, a replaceable battery or a rechargeable battery.
- noisee.g., noise caused by intrinsic fluorescence from materials in the test strip
- these embodimentsincrease the signal-to-noise levels of these measurements and, thereby, improve measurement sensitivity and reduce the incidence of erroneous results.
- FIG. 4shows an embodiment of a diagnostic test method that is executable by the implementations of the diagnostic test system 40 described below.
- the reader 44obtains separable localized light intensity measurements from regions of the exposed area of the detection zone of the test strip 50 when the test strip 50 is loaded in the port 48 of the diagnostic test system 40 (block 60 ).
- the term “separable localized light intensity measurements”refers to the ability of the reader to 44 to transmit or record the light intensity measurements from respective localized regions of the test strip in a way that allows the data analyzer 46 to individually analyze each of the light intensity measurements.
- each of the separable localized regions from which the light intensity measurements are obtained by the reader 44is characterized by at least one surface dimension that is smaller than the dimension of the exposed area of the detection zone that is transverse to the lateral flow direction.
- each of these localized regionshas a surface dimension that is approximately the same size or smaller than the narrowest dimension of a region of interest in the detection zone (e.g., the test region, the control region, or a region of an immobilized labeled or unlabeled complex).
- the data analyzer 46identifies ones of the light intensity measurements obtained from the regions of interest (block 62 ). In this process, the data analyzer 46 isolates the measurements corresponding to regions of interest from the measurements corresponding to other regions of the test strip 50 . The isolated measurements have higher signal-to-noise ratios than aggregated measurements that include measurements from regions outside of the regions of interest.
- the data analyzer 46can then compute at least one parameter from ones of the identified light intensity measurements (block 64 ).
- Exemplary parametersinclude peak intensity and aggregate intensity values. Since the measurements that are used to compute these parameters have higher signal-to-noise ratios, they characterize the region of interest with greater accuracy and, thereby, improve the results of the lateral flow assay.
- FIG. 5Ashows an implementation of the diagnostic test system 40 that includes a light source 66 , a two-dimensional array 68 of light detectors 70 , and a lens 72 .
- the test strip 50is substantially the same as the test strip 10 , which is shown in FIG. 1 .
- the test strip 50includes the sample receiving zone 12 , the labeling zone 14 , the detection zone 15 , and the absorbent zone 20 on the common substrate 22 .
- a substantial portion of the detection zone 15is exposed for optical inspection.
- the light source 66illuminates with light 76 the exposed portion of the detection zone 15 , including the test region 16 and the control region 18 of the test strip 50 .
- the illuminating lightmay be broadband or narrowband and may be polarized or non-polarized.
- the light detector array 68obtains separable localized light intensity measurements from the illuminated regions of the detection zone 15 . In general, the light intensity measurements may be unfiltered or they may be filtered in terms of at least one of wavelength and polarization.
- the light detector array 68may be synchronized with the light source 66 . In general, the light detector array 68 may measure light intensity while the detection zone 15 is being illuminated or after the light source 66 has illuminated the detection zone 15 .
- each of the light detectors 70receives light from a respective localized region of the detection zone 15 . That is, each light detector 70 is able to resolve or separably image a respective localized region of the detection zone 15 .
- the localized regionsare characterized by a surface dimension that is at most as large as the narrowest dimension of the test and control regions 16 , 18 (i.e., the dimensions of regions 16 , 18 that are along the lateral flow direction).
- the localized regionsare characterized by square dimensions that are approximately equal to one-third of the size of the test and control regions 16 , 18 along the lateral flow direction.
- the light detectors 70produce signals representative of the amount of light received from the respective localized regions. These signals may be stored in a memory or they may be transmitted to the data analyzer 46 for processing.
- the reflected or fluorescing light from the test region 16is received by only a subset 80 of the light detectors 70 in the array 68 .
- the reflected or fluorescing light from the control region 18is received by only a subset 82 of the light detectors 70 in the array 68 .
- the signals from the light detectors in the subsets 80 , 82provide relatively low noise light intensity measurements of the light reflected or fluorescing from the test region 16 and the control region 18 , respectively.
- the data analyzer 46is operable to process the signals that are generated by the individual light detectors 70 to identify the ones of the light intensity measurements that are obtained from the regions of interest (e.g., the test region 16 and the control region 18 ).
- the light detector array 68produces a set of light intensity signals that are represented by a three-dimensional surface 84 .
- the surface 84includes higher intensity measurements 86 , 88 obtained by the light detectors 70 in the subsets 80 , 82 of the light detector array 68 .
- the data analyzer 46may identify the light intensity measurements that are obtained from the test region 16 and the control region 18 by thresholding the surface 84 at an intensity threshold level 90 .
- the threshold that is used in the thresholding processis constant across the strip or region of interest.
- the thresholdmay be slanted or have local variations to account for variations in illumination or diffusion of the analytes.
- the ones of the light intensity measurements that are above the threshold level 90are identified as having come from the test region 16 and the control region 18 . Additional information, such as the relative positions of the light detector array 68 from which the identified ones of the light intensity measurements were obtained, may be used by the data analyzer 46 to correlate the identified light intensity measurements with the test region 16 and the control region 18 .
- FIG. 7shows an implementation of the test strip 50 that is the same as the implementation shown in FIG. 5A and an implementation of the diagnostic test system 40 that is the same as the implementation shown in FIG. 5A except that this implementation includes a linear light detector array 92 instead of the two-dimensional array 68 of light detectors 70 .
- the diagnostic test system 40additionally includes a mechanism (not shown) for imparting relative motion between the optical inspection components 94 (i.e., the light source 66 , the lens 72 , and the linear light detector array 92 ) and the test strip 50 .
- the motion-imparting mechanismmay be any one of a wide variety of different mechanisms, including a motorized carriage that moves the optical inspection components relative to the test strip 50 on a pair of rails, and one or more motorized drive wheels that move the test strip 50 relative to the optical inspection components.
- the optical inspection components 94are shown moving relative to the test strip 50 in the direction of arrow 96 (i.e., in the lateral flow direction).
- the linear light detector array 92is oriented in a direction transverse to the direction of motion of the optical inspection components 94 .
- the light source 66illuminates a region of the exposed portion of the detection zone 15 with light 76 as the optical inspection components 94 are moved relative to the test strip 50 .
- the illuminating lightmay be broadband or narrowband and may be polarized or non-polarized.
- the linear light detector array 92obtains separable localized light intensity measurements from a narrow portion of the illuminated region of the detection zone 15 . In general, the light intensity measurements may be unfiltered or they may be filtered in terms of wavelength or polarization.
- the light detector array 68may be synchronized with the light source 66 . In general, the light detector array 68 may measure light intensity while the detection zone 15 is being illuminated or after the light source 66 has illuminated the detection zone 15 .
- Light reflected or fluorescing from the detection zone 15is focused by the lens 72 onto the individual light detectors 70 of the light detector array 92 .
- Each of the light detectors 70receives light from a respective localized region of the detection zone 15 . That is, each light detector 70 is able to resolve or separably image a respective localized region of the detection zone 15 .
- the light detectors 70produce signals representative of the amount of light received from the respective localized regions. These signals may be stored in a memory or they may be transmitted to the data analyzer 46 for processing.
- the data analyzer 46is operable to process the signals that are generated by the individual light detectors 70 to identify the ones of the light intensity measurements that are obtained from the regions of interest (e.g., the test region 16 and the control region 18 ).
- the surface of the detection zone 15is substantially homogeneous in the direction transverse to the lateral flow direction.
- the signals from the light detectors in the linear array 92may be aggregated without substantial loss of information.
- FIG. 8shows an exemplary graph 98 of the aggregated intensity measurements that are produced by the linear light detector array 92 plotted as a function of time.
- the graph 98includes higher intensity aggregate intensities 100 , 102 when the light detectors 70 in the array 92 are positioned over the test region 16 and the control region 18 .
- the data analyzer 46may identify the light intensity measurements that are obtained from the test region 16 and the control region 18 by thresholding the graph 98 at an intensity threshold level 104 .
- the ones of the light intensity measurements that are above the threshold level 104are identified as having come from the test region 16 and the control region 18 . Additional information, such as the relative times the identified ones of the light intensity measurements were obtained, may be used by the data analyzer 46 to correlate the identified light intensity measurements with the test region 16 and the control region 18 .
- FIG. 9shows an implementation of the test strip 50 that is the same as the test strip 10 shown in FIG. 1 and an implementation of the diagnostic test system 40 that includes a light source 110 that is operable to scan a light beam 112 across the exposed area of the detection zone 15 .
- the light beam 112may be broadband or narrowband and may be polarized or non-polarized.
- the light source 110may scan the light beam 112 across the exposed area of the detection zone 15 along any path that includes the test region 16 and the control region 18 , including in a direction transverse to the lateral flow direction and a direction parallel to the lateral flow direction.
- the light source 110scans the light beam 112 along a circuitous zigzag path across the exposed area of the detection zone 15 .
- the light source 110includes a light emitter, such as a light-emitting diode or a laser, and one or more optical components (e.g., one or more lenses and a rotating mirror) for shaping and scanning the emitted light to produce the beam 112 .
- a light emittersuch as a light-emitting diode or a laser
- optical componentse.g., one or more lenses and a rotating mirror
- the diagnostic test system 40may obtain separable localized light intensity measurements using any type of single-element or multi-element light detector that has a field of view that encompasses the path of the light beam 112 across the exposed area of the detection zone 15 or that tracks the localized regions of the detection zone 15 as they are illuminated by the light beam 112 .
- the light intensity measurementsmay be unfiltered or they may be filtered in terms of wavelength or polarization.
- the light detector arraymay be synchronized with the light source. In general, the light detector array may measure light intensity while the detection zone 15 is being illuminated or after the light source has illuminated the detection zone 15 .
- the light obtained by the light detectorcorresponds to the light reflected or fluorescing from the illuminated localized region. Therefore, each data point of the signal that is generated by the light detector correlates with a respective localized region and has a higher signal-to-noise ratio than comparable measurements obtained from larger regions of the detection zone 15 .
- the data analyzer 46is operable to process the signals that are generated by the light detectors to identify the ones of the light intensity measurements that are obtained from the regions of interest (e.g., the test region 16 and the control region 18 ). For example, in some implementations, the data analyzer 46 may identify the light intensity measurements that are obtained from the test region 16 and the control region 18 by thresholding the time-varying light intensity measurement signal that is generated by the light detector. The ones of the light intensity measurements that are above the threshold level are identified as having come from the test region 16 and the control region 18 . Additional information, such as the relative times the identified ones of the light intensity measurements were obtained, may be used by the data analyzer 46 to correlate the identified light intensity measurements with the test region 16 and the control region 18 .
- FIG. 10shows an implementation of the test strip 50 that is the same as the implementation shown in FIG. 5A and an implementation of the diagnostic test system 40 that includes a light source 120 and a pair of light detectors 122 , 124 .
- the light source 120may be implemented by one or more light-emitting diodes that generate a relatively broad beam of light that illuminates the regions of interest in the detection zone 15 .
- the light detectors 122 , 124may be implemented by single-element light detectors or multi-element light detectors.
- An aperture plate 126defines a pair of apertures 128 , 130 through which light intensity measurements are obtained by the light detectors 122 , 124 .
- the apertures 128 , 130are positioned over the test region 16 and the control region 18 when the test strip 50 is loaded in the port 48 of the diagnostic test system 40 .
- the apertures 128 , 130are designed to selectively allow light reflected or fluorescing from the regions of interest in the detection zone to reach the detectors 122 , 124 .
- the apertures 128 , 130also allow the regions of interest in the detection zone 15 to be illuminated by the light source 120 .
- the apertures 128 , 130typically are positioned as close as practical to the regions of interest.
- the apertures 128 , 130substantially match the test region 16 and the control region 18 in size, shape, and orientation.
- the light source 120illuminates the test region 16 and the control region 18 with light 132 , 134 that is transmitted through the apertures 128 , 130 .
- the illuminating lightmay be broadband or narrowband and may be polarized or non-polarized.
- the light detectors 122 , 124obtain separable localized light intensity measurements from the illuminated regions of the detection zone 15 . In general, the light intensity measurements may be unfiltered or they may be filtered in terms of wavelength or polarization.
- the detectors 122 , 124may be synchronized with the light source 120 . In general, the light detectors 122 , 124 may measure light intensity while the detection zone 15 is being illuminated or after the light source 120 has illuminated the detection zone 15 .
- Light reflected or fluorescing from the test region 16 and the control region 18is focused by the lenses 136 , 138 onto the light detectors 122 , 124 , respectively.
- the light detectors 122 , 124are able to resolve or separably image the test region 16 and the control region 18 .
- the light detectors 122 , 124produce signals representative of the amount of light received from the test region 16 and the control region 18 . If the light detectors 122 , 124 are implemented by single-element detectors, the signals represent total or aggregate amounts of light received from the test region 16 or the control region 18 .
- the signalsrepresent the amounts of light received from localized areas of the test region 16 and the control region 18 .
- the signals that are generated by the light detectors 122 , 124may be stored in a memory or they may be transmitted to the data analyzer 46 for processing.
- the light reflected or fluorescing from the test region 16 and the control region 18is preferentially transmitted through the apertures 128 , 130 , whereas light from other regions of the test strip 50 are substantially blocked by the aperture plate 126 .
- the signals that are generated by the light detectors 122 , 124have higher signal-to-noise ratios than comparable measurements obtained from larger regions of the detection zone 15 .
- the light obtained by the light detectors 122 , 124substantially corresponds to the light reflected or fluorescing from the test region 16 and the control region 18 , respectively.
- the signals that are generated by the light detectors 122 , 124correlate with the test region 16 and the control region 18 , respectively, and the data analyzer 46 can identify the ones of the light intensity measurements that are obtained from the test region 16 and the control region 18 directly. That is, the light intensity measurements generated by the light detector 122 are obtained from the test region 16 and the light intensity measurements generated by the light detector 124 are obtained from the control region 18 .
- the data analyzer 46is operable to identify ones of the light intensity measurements obtained from regions of interest in the detection zone 15 based on intensity measurements obtained from at least one position marker on the test strip.
- the implementation of the test strip 50 shown in FIG. 9includes an exemplary set of position markers 138 .
- the position markers 138are spaced regularly along the edge of the test strip 50 .
- the position markers 138include features that have a different reflectivity characteristic than the surface of the test strip 50 .
- the measurements obtained near the edge of the test strip 50vary in intensity in accordance with the patter of the position markers 138 . In this way, the position markers encode the position along the test strip 50 in the lateral flow direction.
- the data analyzer 46correlates the light intensity measurements with the position along the test strip 50 in the lateral flow direction. Based on this information and predetermined information correlating the locations of the regions of interest with the pattern of position markers 138 , the data analyzer 46 can identify the ones of the light intensity measurements corresponding to the regions of interest.
- the embodiments that are described in detail belowincrease the accuracy of the lateral flow assay results by obtaining respective sets of measurements from localized regions of the test strip from which additional analytical information about these regions may be obtained. This additional information is used to separate target measurements from background noise and to derive more accurate estimates of target parameter values.
- FIG. 11shows an embodiment of a diagnostic test method that is executable by the implementations of the diagnostic test system 40 described above.
- the reader 44obtains a respective set of light intensity measurements from each of multiple corresponding regions of the exposed area of the detection zone (block 140 ).
- the illuminating lightmay be broadband or narrowband and may be polarized or non-polarized.
- the reader 44may obtain the sets of light intensity measurements from each of the corresponding regions using a single-element detector or a multi-element light detector.
- the light intensity measurementsmay be unfiltered or they may be filtered in terms of wavelength or polarization.
- the light detectormay be synchronized with the light source. In general, the light detector may measure light intensity while the detection zone 15 is being illuminated or after the light source has illuminated the detection zone 15 .
- each of the localized regions from which the light intensity measurements are obtained by the reader 44may or may not be characterized by at least one surface dimension that is smaller than the dimension of the exposed area of the detection zone that is transverse to the lateral flow direction. In some implementations, however, each of these localized regions has a surface dimension that is approximately the same size or smaller than the narrowest dimension of a region of interest in the detection zone (e.g., the test region, the control region, or a region of an immobilized labeled or unlabeled complex).
- the data analyzer 46computes at least one parameter from at least one of the sets of light intensity measurements (block 142 ). In this process, the data analyzer 46 may use the sets of light intensity measurements to derive more accurate estimates of target parameter values. Alternatively, the data analyzer 46 may use the sets of light intensity measurements to isolate the measurements corresponding to regions of interest (e.g., the test region 16 and the control region 18 ) from the measurements corresponding to other regions of the test strip 50 . These isolated measurements have higher signal-to-noise ratios than aggregate measurements that include measurements from regions outside of the regions of interest.
- regions of intereste.g., the test region 16 and the control region 18
- the reader 44obtains 30 sets of light intensity measurements that represent changes in the fluorescence response of the regions of interest in the detection zone 15 over time.
- the light sourceis pulsed and the light detector obtains a series of light intensity measurements from the corresponding regions after each light pulse.
- FIG. 12Ashows one exemplary graph 144 representing a series of light intensity measurements that are obtained by the reader 44 .
- the light sourceis pulsed at a time t 0 and the light intensity measurements are obtained beginning at a time t 1 , which follows the time to by a delay period ⁇ t.
- the peak intensity measurement 146does not represent the true peak intensity of the fluorescence emitted from the region of interest.
- the data analyzer 46derives a more accurate estimate of the peak fluorescence by computing a decay parameter ⁇ from the graph in accordance with an exponential decay model (Intensity ⁇ e ⁇ t/ ⁇ ) and extrapolating the intensity value back to the time t 0 to obtain an estimate of the peak intensity, as shown in FIG. 12B . Because this estimate of the peak intensity value is closer to the onset of the actual fluorescence from the region of interest, this estimate provides a more accurate measure of the peak fluorescence value than the actual measured peak intensity 146 .
- the data analyzer 46computes a parameter value from respective ones of the peak intensity parameter values corresponding to multiple regions of interest in the detection zone 15 .
- the data analyzer 46may compute the ratio of peak intensity values estimated for first and second test regions in order to obtain a measure of the relative concentration of two target analytes in a sample.
- FIG. 13Ashows two log intensity plots 148 , 150 that are derived two sets of light intensity measurements. Because these plots 148 , 150 exhibit the same decay parameters (i.e., they have the same slope), the data analyzer 46 can infer that the fluorescent sources from which these sets of measurements are obtained are the same fluorescent species.
- FIG. 13Balso shows two log intensity plots 152 , 154 that are derived two sets of light intensity measurements. Because these plots 152 , 154 exhibit different decay parameters (i.e., they have different slopes), the data analyzer 46 can infer that the fluorescent sources from which these sets of measurements are obtained are different fluorescent species.
- the wavelength responses of the localized regions from which the intensity measurements are obtainedare used to associate these measurements with different fluorescent sources.
- each of the light intensity measurements that is obtained for a given one of the localized regionscorresponds to a different wavelength profile (or color channel) that encompasses one or more wavelengths.
- the detection zone 15may be illuminated with a broadband light source and the light detector may be configured to obtain multiple measurements from each of the corresponding regions corresponding to different target wavelength ranges of interest.
- the reader 44illuminates each of the corresponding regions of the detection zone 15 with light having different wavelength profiles each of which encompasses one or more wavelengths.
- the reader 44may include multiple light sources capable of generating light with different wavelength profiles or a single wavelength-tunable light source.
- the target wavelength rangestypically are selected to elicit different responses from various regions of interest in the detection zone.
- the target wavelength rangesare selected to induce fluorescence in different respective fluorescent labels.
- the reader 44includes one or more light detectors that are configured to discriminate the different target wavelength responses of the regions of interest in the detection zone 15 .
- FIG. 14shows a portion of an exemplary embodiment of a color filter array 150 that includes identical sets 152 of four color filters (A, B, C, and D), each of which intercepts light that is directed toward a respective light detector of a two-dimensional light detector array (not shown).
- the color filtersdefine the color channels for the light intensity measurements obtained by the light detectors.
- the light detectors corresponding to a give set 152 of color filtersimage substantially the same localized region of the detection zone 15 . Therefore, the light signals that are generated by the light detectors corresponding to a given set 152 substantially correspond to the wavelength response of the imaged region in terms of the color channels A, B, C, and D.
- FIG. 15shows exemplary graphs 160 , 162 , 164 , 166 of the aggregate intensity profiles obtained from an implementation of the reader 44 that obtained light intensity measurements with a two-dimensional light detector array and the color filter array shown in FIG. 14 .
- Each of graphs 160 - 166corresponds to a respective one of the color channels A, B, C, and D that is defined by the color filter array 150 .
- the aggregate intensity valuesare plotted as functions of the position in the two-dimensional light detector array along the lateral flow direction.
- the graphs 160 - 166include peak intensity values at different respective locations in the two-dimensional light detector array.
- the data analyzer 46may infer that different label species are present at these different locations in the detection zone 15 . This information may be used by the data analyzer 46 to isolate the light intensity measurements corresponding to different labels from one another.
- the reader 44illuminates each of the corresponding regions of the detection zone 15 with light of a different respective polarization.
- the reader 44includes one or more light detectors that are configured to discriminate the different polarization responses of the regions of interest in the detection zone 15 . From these measurements the data analyzer 46 determines polarization response profile across the illuminated regions of the detection zone 15 . This information may be used by the data analyzer 46 to isolate the light intensity measurements corresponding to different labels from one another (e.g., by thresholding or detecting peak intensities).
- Some of the embodiments that are described abovereduce levels of noise (e.g., noise caused by reflection of light or intrinsic fluorescence from materials in the test strip) in lateral flow assay measurements by restricting the measurements to the regions of interest on the test strip from which the desired quantitative information may be derived. In this way, these embodiments increase the signal-to-noise levels of these measurements and, thereby, improve measurement sensitivity and reduce the incidence of erroneous results. Some of these embodiments also increase the accuracy of the lateral flow assay results by obtaining respective sets of measurements from localized regions of the test strip from which additional analytical information about these regions may be obtained. This additional information may be used to isolate target measurements from background noise and to derive more accurate estimates of target parameter values. Some embodiments also are capable of accurately reading multiple analytes from the same test strip and differentiating between spatially separated labels and spectrally separated labels.
- noisee.g., noise caused by reflection of light or intrinsic fluorescence from materials in the test strip
- FIG. 16shows a diagnostic test system 180 that obtains separable localized light intensity measurements using a two-dimensional light detector array 182 .
- each individual detector element 184 in any individual transverse row of the detector array 182can be the target of a specific wavelength of light that is separated and steered by a diffractive lens 186 .
Landscapes
- Health & Medical Sciences (AREA)
- Life Sciences & Earth Sciences (AREA)
- Immunology (AREA)
- Chemical & Material Sciences (AREA)
- Engineering & Computer Science (AREA)
- Physics & Mathematics (AREA)
- Molecular Biology (AREA)
- Analytical Chemistry (AREA)
- Pathology (AREA)
- General Physics & Mathematics (AREA)
- General Health & Medical Sciences (AREA)
- Biochemistry (AREA)
- Urology & Nephrology (AREA)
- Hematology (AREA)
- Biomedical Technology (AREA)
- Biotechnology (AREA)
- Medicinal Chemistry (AREA)
- Food Science & Technology (AREA)
- Microbiology (AREA)
- Cell Biology (AREA)
- Chemical Kinetics & Catalysis (AREA)
- Nuclear Medicine, Radiotherapy & Molecular Imaging (AREA)
- Optics & Photonics (AREA)
- Mathematical Physics (AREA)
- Theoretical Computer Science (AREA)
- Spectroscopy & Molecular Physics (AREA)
- Investigating Or Analysing Materials By Optical Means (AREA)
- Investigating, Analyzing Materials By Fluorescence Or Luminescence (AREA)
- Investigating Or Analysing Materials By The Use Of Chemical Reactions (AREA)
Abstract
Description
Claims (27)
Priority Applications (21)
| Application Number | Priority Date | Filing Date | Title |
|---|---|---|---|
| US11/112,807US8128871B2 (en) | 2005-04-22 | 2005-04-22 | Lateral flow assay systems and methods |
| US11/236,152US7521259B2 (en) | 2004-04-01 | 2005-09-26 | Assay test strips with multiple labels and reading same |
| US11/280,640US7521260B2 (en) | 2005-04-22 | 2005-11-16 | Assay test strips and reading same |
| DE102005056695ADE102005056695B4 (en) | 2005-04-22 | 2005-11-28 | Lateral flow examination systems and methods |
| DE102006003380ADE102006003380B4 (en) | 2005-01-26 | 2006-01-24 | Examination test strip with several markings and reading of same |
| JP2006017098AJP2006208386A (en) | 2005-01-26 | 2006-01-26 | Assay test strip with multiple labels and method for reading the same |
| CNA2006100073421ACN1851458A (en) | 2005-04-22 | 2006-02-09 | Lateral flow assay systems and methods |
| JP2006115552AJP2006300950A (en) | 2005-04-22 | 2006-04-19 | Lateral flow assay system and method |
| US11/567,156US20070185679A1 (en) | 2004-04-01 | 2006-12-05 | Indicating status of a diagnostic test system |
| US12/409,877US20090180927A1 (en) | 2005-04-22 | 2009-03-24 | Assay test strips and reading same |
| US12/410,178US10041941B2 (en) | 2005-04-22 | 2009-03-24 | Assay test strips with multiple labels and reading same |
| US12/410,167US9891217B2 (en) | 2005-04-22 | 2009-03-24 | Assay test strips with multiple labels and reading same |
| US12/409,861US20090180925A1 (en) | 2005-04-22 | 2009-03-24 | Assay test strips and reading same |
| US12/409,871US8043867B2 (en) | 2005-04-22 | 2009-03-24 | Assay test strips and reading same |
| US12/410,182US10753931B2 (en) | 2005-04-22 | 2009-03-24 | Assay test strips with multiple labels and reading same |
| US13/360,081US9091631B2 (en) | 2004-04-01 | 2012-01-27 | Lateral flow assay systems and methods |
| US14/019,166US9243997B2 (en) | 2004-04-01 | 2013-09-05 | Lateral flow assay systems and methods |
| US15/005,776US9989527B2 (en) | 2004-04-01 | 2016-01-25 | Lateral flow assay systems and methods |
| US15/296,872US10191043B2 (en) | 2005-04-22 | 2016-10-18 | Methods and systems for calibrating illumination source of diagnostic test system |
| US16/257,537US11782058B2 (en) | 2005-04-22 | 2019-01-25 | Diagnostic test system using measurement obtained from reference feature to modify operational parameter of reader |
| US17/000,707US20200393460A1 (en) | 2005-04-22 | 2020-08-24 | Assay test strips with multiple labels and reading same |
Applications Claiming Priority (1)
| Application Number | Priority Date | Filing Date | Title |
|---|---|---|---|
| US11/112,807US8128871B2 (en) | 2005-04-22 | 2005-04-22 | Lateral flow assay systems and methods |
Related Parent Applications (1)
| Application Number | Title | Priority Date | Filing Date |
|---|---|---|---|
| US11/044,394Continuation-In-PartUS20050221505A1 (en) | 2004-04-01 | 2005-01-26 | Optoelectronic rapid diagnostic test system |
Related Child Applications (4)
| Application Number | Title | Priority Date | Filing Date |
|---|---|---|---|
| US11/236,152Continuation-In-PartUS7521259B2 (en) | 2004-04-01 | 2005-09-26 | Assay test strips with multiple labels and reading same |
| US11/280,640Continuation-In-PartUS7521260B2 (en) | 2005-04-22 | 2005-11-16 | Assay test strips and reading same |
| US11/312,951Continuation-In-PartUS20070143035A1 (en) | 2004-04-01 | 2005-12-19 | Diagnostic test reader with disabling unit |
| US13/360,081DivisionUS9091631B2 (en) | 2004-04-01 | 2012-01-27 | Lateral flow assay systems and methods |
Publications (2)
| Publication Number | Publication Date |
|---|---|
| US20060240541A1 US20060240541A1 (en) | 2006-10-26 |
| US8128871B2true US8128871B2 (en) | 2012-03-06 |
Family
ID=37085180
Family Applications (10)
| Application Number | Title | Priority Date | Filing Date |
|---|---|---|---|
| US11/112,807Active2027-08-19US8128871B2 (en) | 2004-04-01 | 2005-04-22 | Lateral flow assay systems and methods |
| US11/280,640Active2026-05-22US7521260B2 (en) | 2005-04-22 | 2005-11-16 | Assay test strips and reading same |
| US12/409,877AbandonedUS20090180927A1 (en) | 2005-04-22 | 2009-03-24 | Assay test strips and reading same |
| US12/409,861AbandonedUS20090180925A1 (en) | 2005-04-22 | 2009-03-24 | Assay test strips and reading same |
| US12/409,871Expired - LifetimeUS8043867B2 (en) | 2005-04-22 | 2009-03-24 | Assay test strips and reading same |
| US13/360,081Expired - LifetimeUS9091631B2 (en) | 2004-04-01 | 2012-01-27 | Lateral flow assay systems and methods |
| US14/019,166Expired - LifetimeUS9243997B2 (en) | 2004-04-01 | 2013-09-05 | Lateral flow assay systems and methods |
| US15/005,776Expired - LifetimeUS9989527B2 (en) | 2004-04-01 | 2016-01-25 | Lateral flow assay systems and methods |
| US15/296,872Expired - LifetimeUS10191043B2 (en) | 2005-04-22 | 2016-10-18 | Methods and systems for calibrating illumination source of diagnostic test system |
| US16/257,537Active2026-12-17US11782058B2 (en) | 2005-04-22 | 2019-01-25 | Diagnostic test system using measurement obtained from reference feature to modify operational parameter of reader |
Family Applications After (9)
| Application Number | Title | Priority Date | Filing Date |
|---|---|---|---|
| US11/280,640Active2026-05-22US7521260B2 (en) | 2005-04-22 | 2005-11-16 | Assay test strips and reading same |
| US12/409,877AbandonedUS20090180927A1 (en) | 2005-04-22 | 2009-03-24 | Assay test strips and reading same |
| US12/409,861AbandonedUS20090180925A1 (en) | 2005-04-22 | 2009-03-24 | Assay test strips and reading same |
| US12/409,871Expired - LifetimeUS8043867B2 (en) | 2005-04-22 | 2009-03-24 | Assay test strips and reading same |
| US13/360,081Expired - LifetimeUS9091631B2 (en) | 2004-04-01 | 2012-01-27 | Lateral flow assay systems and methods |
| US14/019,166Expired - LifetimeUS9243997B2 (en) | 2004-04-01 | 2013-09-05 | Lateral flow assay systems and methods |
| US15/005,776Expired - LifetimeUS9989527B2 (en) | 2004-04-01 | 2016-01-25 | Lateral flow assay systems and methods |
| US15/296,872Expired - LifetimeUS10191043B2 (en) | 2005-04-22 | 2016-10-18 | Methods and systems for calibrating illumination source of diagnostic test system |
| US16/257,537Active2026-12-17US11782058B2 (en) | 2005-04-22 | 2019-01-25 | Diagnostic test system using measurement obtained from reference feature to modify operational parameter of reader |
Country Status (4)
| Country | Link |
|---|---|
| US (10) | US8128871B2 (en) |
| JP (1) | JP2006300950A (en) |
| CN (1) | CN1851458A (en) |
| DE (1) | DE102005056695B4 (en) |
Cited By (28)
| Publication number | Priority date | Publication date | Assignee | Title |
|---|---|---|---|---|
| US20090180928A1 (en)* | 2005-04-22 | 2009-07-16 | Alverix, Inc. | Assay test strips with multiple labels and reading same |
| US8486717B2 (en) | 2011-01-18 | 2013-07-16 | Symbolics, Llc | Lateral flow assays using two dimensional features |
| US20140004624A1 (en)* | 2004-04-01 | 2014-01-02 | Alverix, Inc. | Lateral flow assay systems and methods |
| WO2014043247A1 (en) | 2012-09-12 | 2014-03-20 | Force Diagnostics, Inc | Rapid tests for insurance underwriting |
| US9207181B2 (en) | 2012-03-01 | 2015-12-08 | Quidel Corporation | System and apparatus for point-of-care diagnostics |
| US9599615B2 (en) | 2013-03-13 | 2017-03-21 | Symbolics, Llc | Lateral flow assays using two dimensional test and control signal readout patterns |
| US9651508B2 (en) | 2012-01-31 | 2017-05-16 | Regents Of The University Of Minnesota | Thermal contrast assay and reader |
| US9874556B2 (en) | 2012-07-18 | 2018-01-23 | Symbolics, Llc | Lateral flow assays using two dimensional features |
| US9877672B2 (en) | 2010-01-28 | 2018-01-30 | Ellume Pty Ltd | Sampling and testing device for the human or animal body |
| US9989466B2 (en) | 2013-12-06 | 2018-06-05 | Quidel Corporation | Method for reducing analyzer variability using a normalization target |
| US10031085B2 (en) | 2014-07-24 | 2018-07-24 | Ortho-Clinical Diagnostics, Inc. | Point of care analytical processing system |
| US10101342B2 (en) | 2014-02-12 | 2018-10-16 | Church & Dwight Co., Inc. | Devices and methods for electronic analyte assaying |
| US20190086431A1 (en)* | 2017-09-21 | 2019-03-21 | Becton, Dickinson And Company | High dynamic range assays in hazardous contaminant testing |
| US10725033B2 (en) | 2012-01-31 | 2020-07-28 | Regents Of The University Of Minnesota | Lateral flow assays with thermal contrast readers |
| WO2020160040A1 (en) | 2019-01-31 | 2020-08-06 | Fresenius Medical Care Holdings, Inc. | Rapid diagnosis of peritonitis in peritoneal dialysis patients |
| US10786229B2 (en) | 2015-01-22 | 2020-09-29 | Ellume Limited | Diagnostic devices and methods for mitigating hook effect and use thereof |
| US10816492B2 (en) | 2012-01-31 | 2020-10-27 | Regents Of The University Of Minnesota | Lateral flow assays with thermal contrast readers |
| US10890590B2 (en) | 2012-09-27 | 2021-01-12 | Ellume Limited | Diagnostic devices and methods |
| US10916058B2 (en) | 2017-09-21 | 2021-02-09 | Becton, Dickinson And Company | Augmented reality devices for hazardous contaminant testing |
| US11002642B2 (en) | 2017-09-21 | 2021-05-11 | Becton, Dickinson And Company | Demarcation template for hazardous contaminant testing |
| USD923195S1 (en) | 2017-09-21 | 2021-06-22 | Becton, Dickinson And Company | Collection device |
| US11061020B2 (en) | 2012-03-01 | 2021-07-13 | Quidel Corporation | Interactive test device and apparatus with timing mechanism |
| US11199529B2 (en) | 2017-09-21 | 2021-12-14 | Becton, Dickinson And Company | Hazardous contaminant collection kit and rapid testing |
| WO2022020760A1 (en) | 2020-07-23 | 2022-01-27 | Fresenius Medical Care Holdings, Inc. | System for determining peritonitis using homodimer neutrophil gelatinase-associated lipocalin |
| US11280801B2 (en) | 2019-01-28 | 2022-03-22 | Becton, Dickinson And Company | Hazardous contaminant collection device with integrated swab and test device |
| US11360001B2 (en) | 2017-09-21 | 2022-06-14 | Becton, Dickinson And Company | Reactive demarcation template for hazardous contaminant testing |
| US11385146B2 (en) | 2017-09-21 | 2022-07-12 | Becton, Dickinson And Company | Sampling systems and techniques to collect hazardous contaminants with high pickup and shedding efficiencies |
| US11585733B2 (en) | 2017-09-21 | 2023-02-21 | Becton, Dickinson And Company | Hazardous contaminant collection kit and rapid testing |
Families Citing this family (107)
| Publication number | Priority date | Publication date | Assignee | Title |
|---|---|---|---|---|
| US20070143035A1 (en)* | 2005-12-19 | 2007-06-21 | Petruno Patrick T | Diagnostic test reader with disabling unit |
| US20070185679A1 (en)* | 2004-04-01 | 2007-08-09 | Petruno Patrick T | Indicating status of a diagnostic test system |
| US20060275920A1 (en)* | 2005-06-01 | 2006-12-07 | Petrilla John F | Apparatus and method for discriminating among lateral flow assay test indicators |
| US8359187B2 (en) | 2005-06-24 | 2013-01-22 | Google Inc. | Simulating a different number of memory circuit devices |
| US8327104B2 (en) | 2006-07-31 | 2012-12-04 | Google Inc. | Adjusting the timing of signals associated with a memory system |
| US8089795B2 (en) | 2006-02-09 | 2012-01-03 | Google Inc. | Memory module with memory stack and interface with enhanced capabilities |
| US20080082763A1 (en) | 2006-10-02 | 2008-04-03 | Metaram, Inc. | Apparatus and method for power management of memory circuits by a system or component thereof |
| US8130560B1 (en) | 2006-11-13 | 2012-03-06 | Google Inc. | Multi-rank partial width memory modules |
| US10013371B2 (en) | 2005-06-24 | 2018-07-03 | Google Llc | Configurable memory circuit system and method |
| US9171585B2 (en) | 2005-06-24 | 2015-10-27 | Google Inc. | Configurable memory circuit system and method |
| US8335894B1 (en) | 2008-07-25 | 2012-12-18 | Google Inc. | Configurable memory system with interface circuit |
| US8041881B2 (en) | 2006-07-31 | 2011-10-18 | Google Inc. | Memory device with emulated characteristics |
| US8077535B2 (en) | 2006-07-31 | 2011-12-13 | Google Inc. | Memory refresh apparatus and method |
| US9507739B2 (en) | 2005-06-24 | 2016-11-29 | Google Inc. | Configurable memory circuit system and method |
| US8244971B2 (en) | 2006-07-31 | 2012-08-14 | Google Inc. | Memory circuit system and method |
| US8060774B2 (en) | 2005-06-24 | 2011-11-15 | Google Inc. | Memory systems and memory modules |
| US8055833B2 (en) | 2006-10-05 | 2011-11-08 | Google Inc. | System and method for increasing capacity, performance, and flexibility of flash storage |
| US8397013B1 (en) | 2006-10-05 | 2013-03-12 | Google Inc. | Hybrid memory module |
| US8081474B1 (en)* | 2007-12-18 | 2011-12-20 | Google Inc. | Embossed heat spreader |
| US8438328B2 (en) | 2008-02-21 | 2013-05-07 | Google Inc. | Emulation of abstracted DIMMs using abstracted DRAMs |
| US8386722B1 (en) | 2008-06-23 | 2013-02-26 | Google Inc. | Stacked DIMM memory interface |
| US7609567B2 (en) | 2005-06-24 | 2009-10-27 | Metaram, Inc. | System and method for simulating an aspect of a memory circuit |
| US7386656B2 (en) | 2006-07-31 | 2008-06-10 | Metaram, Inc. | Interface circuit system and method for performing power management operations in conjunction with only a portion of a memory circuit |
| US8796830B1 (en) | 2006-09-01 | 2014-08-05 | Google Inc. | Stackable low-profile lead frame package |
| WO2007028109A2 (en) | 2005-09-02 | 2007-03-08 | Metaram, Inc. | Methods and apparatus of stacking drams |
| US9632929B2 (en) | 2006-02-09 | 2017-04-25 | Google Inc. | Translating an address associated with a command communicated between a system and memory circuits |
| US20070188736A1 (en)* | 2006-02-16 | 2007-08-16 | Fouquet Julie E | Obtaining measurement and baseline signals for evaluating assay test strips |
| US7532128B2 (en)* | 2006-10-25 | 2009-05-12 | Alverix, Inc. | Position sensitive indicator detection |
| CN101595388A (en)* | 2006-12-12 | 2009-12-02 | 反应生物医学公司 | Multi-analyte immunoassay |
| US9945789B2 (en)* | 2007-01-16 | 2018-04-17 | Alverix, Inc. | Multiple analyte detection systems and methods of detecting multiple analytes |
| WO2008106021A1 (en)* | 2007-02-26 | 2008-09-04 | Response Biomedical Corporation | Comparative multiple analyte assay |
| EP2140265B1 (en)* | 2007-03-22 | 2012-10-31 | Scandinavian Micro Biodevices A/S | A flow through system, flow through device and a method of performing a test |
| JP5410292B2 (en)* | 2007-10-26 | 2014-02-05 | アークレイ株式会社 | SAMPLE DETECTING DEVICE AND MEASURING DEVICE HAVING THE SAME |
| DE502007005368D1 (en)* | 2007-10-29 | 2010-11-25 | Roche Diagnostics Gmbh | Method of making tape with diagnostic aids |
| JP4812742B2 (en)* | 2007-12-27 | 2011-11-09 | パナソニック株式会社 | Solution measuring method and solution measuring apparatus |
| JP5213952B2 (en)* | 2008-04-18 | 2013-06-19 | パナソニック株式会社 | Liquid sample analysis method |
| US8394637B2 (en)* | 2008-06-02 | 2013-03-12 | Roche Diagnostics Operations, Inc. | Handheld analyzer for testing a sample |
| DE102008030277B4 (en)* | 2008-06-25 | 2014-05-28 | Lre Medical Gmbh | Method and device for determining the concentration of a substance in a liquid |
| DE102008058132A1 (en) | 2008-11-14 | 2010-05-20 | opTricon GmbH Entwicklungsesellschaft für optische Technologien | Apparatus and method for evaluating and evaluating a test strip |
| EP2370797A4 (en)* | 2008-11-19 | 2013-03-06 | Siemens Healthcare Diagnostics | POLARIZED OPTICAL FOR OPTICAL DIAGNOSTIC DEVICE |
| EP2194381B1 (en)* | 2008-12-03 | 2015-12-02 | Roche Diagnostics GmbH | Testing element with combined control and calibration zone |
| DE102009010563A1 (en) | 2009-02-16 | 2010-08-26 | Matthias W. Engel | Device for the detection of analytes in body fluids |
| JP4676539B2 (en)* | 2009-02-25 | 2011-04-27 | 古河電気工業株式会社 | Apparatus and method for quantitatively detecting a target substance for lateral flow type fluorescent immunochromatography |
| US8638441B2 (en)* | 2009-04-07 | 2014-01-28 | Nexus Dx, Inc. | Hand-held scanner systems and methods for reading point of care test results |
| AU2010236424B2 (en)* | 2009-04-15 | 2016-03-10 | Relia Biotechnologies (Shenzhen) Ltd. | Diagnostic devices and related methods |
| DE202010017690U1 (en) | 2009-06-09 | 2012-05-29 | Google, Inc. | Programming dimming terminating resistor values |
| KR20130028929A (en)* | 2010-04-28 | 2013-03-20 | 파나소닉 주식회사 | Chemical sensor |
| US10295472B2 (en)* | 2010-05-05 | 2019-05-21 | Alverix, Inc. | Assay reader operable to scan a test strip |
| US20120038820A1 (en)* | 2010-08-16 | 2012-02-16 | Gangaswamy Kempahonnaiah | Rapid Test Quantitative Reader |
| JP6012052B2 (en) | 2010-10-01 | 2016-10-25 | ホロジック, インコーポレイテッドHologic, Inc. | Immunoassay test strips for use in diagnostic systems |
| US8520209B2 (en)* | 2010-10-14 | 2013-08-27 | Hewlett-Packard Development Company, L.P. | Article, system, and method for color measurement |
| CN102128830B (en)* | 2010-12-16 | 2013-03-13 | 中国检验检疫科学研究院 | Immunochromatographic test paper strip color signal quantitative detector |
| US20120229808A1 (en)* | 2011-03-11 | 2012-09-13 | Electronics And Telecommunications Research Institute | Biochip identification apparatus, biochip and method of identifying biochip using the same |
| JP5554289B2 (en)* | 2011-06-13 | 2014-07-23 | 古河電気工業株式会社 | Detection apparatus for immunochromatography and detection method thereof |
| US9715579B2 (en)* | 2011-09-09 | 2017-07-25 | Alverix, Inc. | Distributed network of in-vitro diagnostic devices |
| EP2812675B1 (en)* | 2012-02-06 | 2021-07-07 | The Regents of the University of California | Portable rapid diagnostic test reader |
| DE102012201843A1 (en) | 2012-02-08 | 2013-08-08 | Siemens Aktiengesellschaft | Arrangement and method for the electrical detection of liquid samples with lateral flow assays |
| WO2013142003A1 (en)* | 2012-03-23 | 2013-09-26 | Laboratory Corporation Of America Holdings | Biologic machines for the detection of biomolecules |
| KR101371384B1 (en)* | 2013-01-10 | 2014-03-07 | 경북대학교 산학협력단 | Tracking system and method for tracking using the same |
| US10408828B2 (en) | 2013-02-26 | 2019-09-10 | Astute Medical, Inc. | Lateral flow assay with test strip retainer |
| EP2781919A1 (en) | 2013-03-19 | 2014-09-24 | Roche Diagniostics GmbH | Method / device for generating a corrected value of an analyte concentration in a sample of a body fluid |
| US9939431B2 (en) | 2013-03-29 | 2018-04-10 | Nima Labs, Inc. | Portable device for detection of harmful substances |
| US10254279B2 (en) | 2013-03-29 | 2019-04-09 | Nima Labs, Inc. | System and method for detection of target substances |
| US10466236B2 (en) | 2013-03-29 | 2019-11-05 | Nima Labs, Inc. | System and method for detecting target substances |
| EP3036531B1 (en) | 2013-08-20 | 2023-06-07 | Chembio Diagnostics GmbH | Device for digitally reading rapid tests |
| JP6308353B2 (en)* | 2013-11-20 | 2018-04-11 | セイコーエプソン株式会社 | Liquid ejection device |
| FI126484B (en)* | 2013-12-03 | 2017-01-13 | Goodwiller Oy | Disposable test strip device for detecting analyte in a body fluid sample |
| CN103760339B (en)* | 2014-01-28 | 2016-01-13 | 上海原科实业发展有限公司 | Immuno-chromatography detection device and method |
| WO2016023010A1 (en) | 2014-08-08 | 2016-02-11 | Quantum-Si Incorporated | Optical system and assay chip for probing, detecting, and analyzing molecules |
| WO2016057786A1 (en)* | 2014-10-10 | 2016-04-14 | Detekt Biomedical, Llc | Wireless remote optical monitoring system |
| KR101621050B1 (en)* | 2014-10-23 | 2016-05-13 | 주식회사 이뮨메드 | Fluorescence reader of medical diagnostic kits |
| CN104535768B (en)* | 2014-11-25 | 2016-06-22 | 东莞市莞信企业管理咨询有限公司 | A kind of microdose urine protein detecting device |
| SG11201706332RA (en)* | 2015-02-06 | 2017-09-28 | Life Technologies Corp | Methods and systems for biological instrument calibration |
| JP2018513983A (en) | 2015-04-06 | 2018-05-31 | ブルーダイアグノスティックス・インコーポレイテッドBludiagnostics, Inc. | Test apparatus and method of use for detecting an analyte in a saliva sample |
| WO2017059103A1 (en)* | 2015-09-30 | 2017-04-06 | Nima Labs, Inc. | System and method for detecting target substances |
| US10436773B2 (en) | 2016-01-18 | 2019-10-08 | Jana Care, Inc. | Mobile device based multi-analyte testing analyzer for use in medical diagnostic monitoring and screening |
| US10132743B2 (en)* | 2016-01-25 | 2018-11-20 | General Electric Company | Fixed optics photo-thermal spectroscopy reader and method of use |
| FR3048369B1 (en)* | 2016-03-01 | 2018-03-02 | Pellenc Selective Technologies | MACHINE AND METHOD FOR INSPECTING FLOWING OBJECTS |
| GB2550603A (en)* | 2016-05-24 | 2017-11-29 | Molecular Vision Ltd | Assay device |
| GB2550602B (en) | 2016-05-24 | 2020-04-29 | Molecular Vision Ltd | Optical device |
| EP3475409A4 (en) | 2016-06-22 | 2020-03-04 | Becton, Dickinson and Company | MODULAR TEST READER |
| US10519487B2 (en) | 2016-08-18 | 2019-12-31 | City University Of Hong Kong | Kit and a method for determining the presence or amount of a target nucleic acid sequence in a sample |
| US20210278403A1 (en) | 2016-08-23 | 2021-09-09 | Qoolabs, Inc. | Lateral flow assay for assessing recombinant protein expression or reporter gene expression |
| CN109923421B (en)* | 2016-09-02 | 2022-11-11 | 艾克雷泽私人有限公司 | Substance testing system and method |
| US10852242B2 (en) | 2016-11-30 | 2020-12-01 | Idexx Laboratories, Inc. | Lateral flow assay reader based on human perception and method relating thereto |
| MX2019010854A (en)* | 2017-03-13 | 2019-10-30 | Zoetis Services Llc | SIDE FLOW TEST SYSTEM. |
| US10751032B2 (en)* | 2017-03-28 | 2020-08-25 | Transderm, Inc. | Moisture-responsive films |
| GB2563449A (en)* | 2017-06-16 | 2018-12-19 | Sumitomo Chemical Co | Device |
| ES2938645T3 (en)* | 2017-06-28 | 2023-04-13 | Becton Dickinson Co | Sandwich assays that use decreasing signal portions of the dose response curve to measure analytes, including high concentration analytes |
| TR201716609A2 (en)* | 2017-10-27 | 2019-05-21 | Tuerkiye Bilimsel Ve Teknolojik Arastirma Kurumu Tuebitak | AN IMMUNOCHROMETOGRAPHY TEST STRIP |
| CN107643260B (en)* | 2017-11-06 | 2024-05-03 | 汉威科技集团股份有限公司 | Wide-spectrum multi-parameter water quality monitoring system |
| CN111684280B (en)* | 2017-12-05 | 2024-12-17 | 贝克顿·迪金森公司 | Lateral flow assay and method for detecting high concentration analytes |
| EP3724659A4 (en)* | 2017-12-15 | 2022-04-06 | Jana Care Inc. | BIOMEDICAL DEVICES, SYSTEMS AND METHODS FOR MEASURING THE CONCENTRATION OF PEPTIDES TO MONITOR A CONDITION |
| EP3818355A4 (en)* | 2018-07-02 | 2022-03-23 | Ortho-Clinical Diagnostics, Inc. | Dry slide assay using reduced reading window |
| US20210349023A1 (en)* | 2018-09-04 | 2021-11-11 | Ams Ag | Biomarker reader |
| US11648562B2 (en) | 2019-11-01 | 2023-05-16 | International Business Machines Corporation | Anonymized diagnosis via lateral flow assays |
| US12372516B2 (en)* | 2019-11-19 | 2025-07-29 | Ivd Vision, Llc | Methods and compositions for lateral flow analyte assays |
| CN213148721U (en)* | 2019-11-22 | 2021-05-07 | 京东方科技集团股份有限公司 | Analyzers and Detection Systems |
| US11536732B2 (en) | 2020-03-13 | 2022-12-27 | Jana Care, Inc. | Devices, systems, and methods for measuring biomarkers in biological fluids |
| WO2021202420A1 (en)* | 2020-03-30 | 2021-10-07 | Miller Agustin Ruiz | Universal home testing system for infectious diseases |
| GB2595305A (en)* | 2020-05-22 | 2021-11-24 | Ams Ag | Optical detector |
| US10823746B1 (en) | 2020-05-22 | 2020-11-03 | Thermogenesis Holdings, Inc. | Lateral flow immunoassay test reader and method of use |
| US20220020481A1 (en) | 2020-07-20 | 2022-01-20 | Abbott Laboratories | Digital pass verification systems and methods |
| WO2022106537A1 (en) | 2020-11-20 | 2022-05-27 | Ams-Osram Ag | Test strip cassette, monitoring device and method for fabricating a test strip cassette |
| WO2022193028A1 (en)* | 2021-03-19 | 2022-09-22 | Kenota Inc. | Assay membrane test region localization |
| GB2609419A (en)* | 2021-07-29 | 2023-02-08 | Ams Int Ag | Lateral flow test |
| WO2024033027A1 (en)* | 2022-08-11 | 2024-02-15 | Ams-Osram Ag | Reader system for a lateral flow test and according method |
Citations (37)
| Publication number | Priority date | Publication date | Assignee | Title |
|---|---|---|---|---|
| US5132097A (en) | 1987-02-11 | 1992-07-21 | G.D. Research | Apparatus for analysis of specific binding complexes |
| US5304813A (en) | 1991-10-14 | 1994-04-19 | Landis & Gyr Betriebs Ag | Apparatus for the optical recognition of documents |
| WO1995013531A1 (en) | 1993-11-12 | 1995-05-18 | Unipath Limited | Reading devices for teststrips |
| US5442169A (en) | 1991-04-26 | 1995-08-15 | Paul Scherrer Institut | Method and apparatus for determining a measuring variable by means of an integrated optical sensor module |
| US5580794A (en) | 1993-08-24 | 1996-12-03 | Metrika Laboratories, Inc. | Disposable electronic assay device |
| CA2210559A1 (en) | 1996-07-16 | 1998-01-16 | Boehringer Mannheim Gmbh | Analytical system with means for detecting too small sample volumes |
| US5837546A (en) | 1993-08-24 | 1998-11-17 | Metrika, Inc. | Electronic assay device and method |
| US5861256A (en) | 1996-03-05 | 1999-01-19 | Gull Laboratories | Methods and apparatus for detection and discrimination of multiple analytes using flourescent technology |
| WO1999041596A1 (en) | 1998-02-11 | 1999-08-19 | 77 Elektronika Műszeripari Kft. | Automatic test strip analyser apparatus |
| US5961451A (en) | 1997-04-07 | 1999-10-05 | Motorola, Inc. | Noninvasive apparatus having a retaining member to retain a removable biosensor |
| US6136610A (en) | 1998-11-23 | 2000-10-24 | Praxsys Biosystems, Inc. | Method and apparatus for performing a lateral flow assay |
| US6217744B1 (en) | 1998-12-18 | 2001-04-17 | Peter Crosby | Devices for testing fluid |
| US6268162B1 (en) | 1986-08-13 | 2001-07-31 | Lifescan, Inc. | Reflectance measurement of analyte concentration with automatic initiation of timing |
| WO2001057502A1 (en) | 2000-02-02 | 2001-08-09 | Otsuka Pharmaceutical Co., Ltd. | Test strip measuring method and device |
| US6274323B1 (en) | 1999-05-07 | 2001-08-14 | Quantum Dot Corporation | Method of detecting an analyte in a sample using semiconductor nanocrystals as a detectable label |
| US6300141B1 (en) | 1999-03-02 | 2001-10-09 | Helix Biopharma Corporation | Card-based biosensor device |
| US20010035990A1 (en) | 1998-04-13 | 2001-11-01 | Fai H Mok | Multiplexed hologram copying system and method |
| US20020004246A1 (en) | 2000-02-07 | 2002-01-10 | Daniels Robert H. | Immunochromatographic methods for detecting an analyte in a sample which employ semiconductor nanocrystals as detectable labels |
| US6379622B1 (en) | 2001-04-11 | 2002-04-30 | Motorola, Inc. | Sensor incorporating a quantum dot as a reference |
| US6394952B1 (en) | 1998-02-03 | 2002-05-28 | Adeza Biomedical Corporation | Point of care diagnostic systems |
| US20020146844A1 (en) | 1995-08-09 | 2002-10-10 | Karen B. Dow Morrison And Foerster Llp | One-step lateral flow assays |
| US6483582B2 (en) | 1998-07-27 | 2002-11-19 | Ljl Biosystems, Inc. | Apparatus and methods for time-resolved spectroscopic measurements |
| US20020176927A1 (en) | 2001-03-29 | 2002-11-28 | Kodas Toivo T. | Combinatorial synthesis of material systems |
| US20030082516A1 (en) | 2001-09-06 | 2003-05-01 | Don Straus | Rapid detection of replicating cells |
| US6561643B1 (en) | 1997-06-30 | 2003-05-13 | Hewlett-Packard Co. | Advanced media determination system for inkjet printing |
| US20030119202A1 (en) | 2001-12-24 | 2003-06-26 | Kimberly-Clark Worldwide, Inc. | Reading device, method, and system for conducting lateral flow assays |
| US20030119203A1 (en) | 2001-12-24 | 2003-06-26 | Kimberly-Clark Worldwide, Inc. | Lateral flow assay devices and methods for conducting assays |
| US6585341B1 (en) | 1997-06-30 | 2003-07-01 | Hewlett-Packard Company | Back-branding media determination system for inkjet printing |
| WO2003065009A2 (en) | 2002-02-01 | 2003-08-07 | California Institute Of Technology | Methods and apparatus for assays of bacterial spores |
| US20030207454A1 (en) | 2002-05-01 | 2003-11-06 | Eyster Curt R. | Devices and methods for analyte concentration determination |
| US20030222198A1 (en) | 2002-05-30 | 2003-12-04 | Olszak Artur G. | Imaging system with an integrated source and detector array |
| US6671428B1 (en) | 2000-12-01 | 2003-12-30 | Bayspec, Inc. | Wavelength selective optical cross switch and optical add/drop multiplexer using volume phase grating and array of micro electro mechanical mirrors |
| US6673622B1 (en) | 1997-06-27 | 2004-01-06 | Hemosense, Inc. | Coagulation or lysis assays by measuring impedance |
| US20040014202A1 (en) | 2001-11-29 | 2004-01-22 | King Howard G. | Apparatus and method for differentiating multiple fluorescence signals by excitation wavelength |
| US20040043502A1 (en) | 2002-08-27 | 2004-03-04 | Kimberly-Clark Worldwide, Inc. | Membrane-based assay devices that utilize time-resolved fluorescence |
| US6750963B2 (en) | 2002-05-21 | 2004-06-15 | Agilent Technologies, Inc. | Imaging systems for signals on a surface |
| US20040151632A1 (en) | 2002-06-27 | 2004-08-05 | Badley Robert Andrew | Luminescence assays and assay readers |
Family Cites Families (75)
| Publication number | Priority date | Publication date | Assignee | Title |
|---|---|---|---|---|
| US207454A (en)* | 1878-08-27 | Improvement in sewing-machines | ||
| US151632A (en)* | 1874-06-02 | Improvement in machines for dressing the joints of hinges | ||
| US119203A (en)* | 1871-09-19 | Improvement in floor-clamps | ||
| US18637A (en)* | 1857-11-17 | Flour-distributing bolt for grinding-mills | ||
| US119202A (en)* | 1871-09-19 | Improvement in alarm-locscs for tills | ||
| US43502A (en)* | 1864-07-12 | Improvement in pumps | ||
| US4849338A (en) | 1982-07-16 | 1989-07-18 | Syntex (U.S.A.) Inc. | Simultaneous calibration heterogeneous immunoassay |
| US4647981A (en)* | 1984-10-25 | 1987-03-03 | Xerox Corporation | Automatic white level control for a RIS |
| US4916056A (en) | 1986-02-18 | 1990-04-10 | Abbott Laboratories | Solid-phase analytical device and method for using same |
| US5514602A (en) | 1986-06-09 | 1996-05-07 | Ortho Diagnostic Systems, Inc. | Method of producing a metal sol reagent containing colloidal metal particles |
| US4960691A (en) | 1986-09-29 | 1990-10-02 | Abbott Laboratories | Chromatographic test strip for determining ligands or receptors |
| US5030558A (en) | 1986-11-07 | 1991-07-09 | Syntex (U.S.A.) Inc. | Qualitative immunochromatographic method and device |
| US4902278A (en) | 1987-02-18 | 1990-02-20 | Ivac Corporation | Fluid delivery micropump |
| ES2150428T3 (en) | 1987-04-27 | 2000-12-01 | Unilever Nv | SPECIFIC UNION TESTS. |
| US5252496A (en) | 1989-12-18 | 1993-10-12 | Princeton Biomeditech Corporation | Carbon black immunochemical label |
| DE4041905A1 (en) | 1990-12-27 | 1992-07-02 | Boehringer Mannheim Gmbh | TEST CARRIER ANALYSIS SYSTEM |
| US5998220A (en) | 1991-05-29 | 1999-12-07 | Beckman Coulter, Inc. | Opposable-element assay devices, kits, and methods employing them |
| US5217832A (en) | 1992-01-23 | 1993-06-08 | The Walt Disney Company | Permanent color transparencies on single substrates and methods for making the same |
| DE4202850A1 (en) | 1992-01-31 | 1993-08-05 | Boehringer Mannheim Gmbh | ANALYSIS ELEMENT FOR IMMUNOASSAYS |
| US5550362A (en) | 1992-11-20 | 1996-08-27 | Intermec Corporation | Method and apparatus for calibrating a bar code scanner |
| US5371687A (en) | 1992-11-20 | 1994-12-06 | Boehringer Mannheim Corporation | Glucose test data acquisition and management system |
| US5519210A (en)* | 1993-05-13 | 1996-05-21 | Gretag Aktiengesellschaft | Apparatus and a process for recording photometric data that is positioned in succession or in adjacent fashion on a page-like or strip-like print |
| GB9325718D0 (en)* | 1993-12-16 | 1994-02-16 | Ars Holding 89 Nv | Sensor device for sandwich assay |
| US6686170B1 (en) | 1994-08-17 | 2004-02-03 | Abbott Laboratories | Assay devices with mobile control reagents |
| US6611634B2 (en) | 1996-03-19 | 2003-08-26 | University Of Utah Research Foundation | Lens and associatable flow cell |
| JPH09297832A (en) | 1996-05-02 | 1997-11-18 | Omron Corp | Biochemical measuring instrument |
| WO1998042454A1 (en) | 1997-03-21 | 1998-10-01 | Sanyo Electric Co., Ltd. | Vibration generator for notification and portable communication device using the vibration generator |
| JPH11108927A (en) | 1997-10-01 | 1999-04-23 | Sekisui Chem Co Ltd | Immune chromatography apparatus |
| US6267722B1 (en)* | 1998-02-03 | 2001-07-31 | Adeza Biomedical Corporation | Point of care diagnostic systems |
| EP1062510A2 (en) | 1998-03-10 | 2000-12-27 | Strategic Diagnostics Inc. | Integrated assay device and methods of production and use |
| GB2339615B (en) | 1998-07-14 | 2001-02-07 | Cozart Bioscience Ltd | Screening device and method of screening an immunoassay test |
| US6326144B1 (en) | 1998-09-18 | 2001-12-04 | Massachusetts Institute Of Technology | Biological applications of quantum dots |
| US6180409B1 (en)* | 1998-10-13 | 2001-01-30 | Bayer Corporation | Spectrophotometric apparatus with multiple readheads |
| WO2000031538A1 (en) | 1998-11-23 | 2000-06-02 | Praxsys Biosystems, Inc. | Improved lateral flow assays |
| CA2351398A1 (en) | 1998-11-30 | 2000-06-08 | Abbott Laboratories | Analyte test instrument having improved calibration and communication processes |
| JP2001033454A (en) | 1999-07-15 | 2001-02-09 | Internatl Reagents Corp | Quantitative method and apparatus for test substance on porous solid phase ligand measurement specimen |
| JP2001066277A (en) | 1999-08-27 | 2001-03-16 | Toto Ltd | Detection device and urine-analyzing device |
| EP1291645A1 (en)* | 1999-10-11 | 2003-03-12 | Gretag-Macbeth AG | Apparatus for automatic measurement of test fields |
| US6136549A (en)* | 1999-10-15 | 2000-10-24 | Feistel; Christopher C. | systems and methods for performing magnetic chromatography assays |
| US6629057B2 (en) | 1999-11-05 | 2003-09-30 | Beckman Coulter, Inc. | Comprehensive verification systems and methods for analyzer-read clinical assays |
| US6403037B1 (en) | 2000-02-04 | 2002-06-11 | Cepheid | Reaction vessel and temperature control system |
| US6673630B2 (en)* | 2000-02-23 | 2004-01-06 | Bayer Corporation | Method and apparatus for producing visual results using colorimetric strips |
| US6607922B2 (en)* | 2000-03-17 | 2003-08-19 | Quantum Design, Inc. | Immunochromatographic assay method and apparatus |
| CN1287140C (en) | 2000-09-25 | 2006-11-29 | 松下电器产业株式会社 | Chromatographic analysis quantitative measurement device |
| JP4523143B2 (en) | 2000-11-10 | 2010-08-11 | シチズンホールディングス株式会社 | Concentration measuring device and sugar content measuring device |
| US20040096169A1 (en) | 2001-01-12 | 2004-05-20 | Saburo Sone | Selectively hybridizable substance immobilization fiber, fiber array comprising bundle of such fibers, selective hybridizing method, device therefor, and base |
| GB0103755D0 (en)* | 2001-02-15 | 2001-04-04 | Genosis Ltd | Urine assay |
| EP1381408A4 (en) | 2001-02-22 | 2007-06-13 | Insulet Corp | Modular infusion device and method |
| US6572745B2 (en) | 2001-03-23 | 2003-06-03 | Virotek, L.L.C. | Electrochemical sensor and method thereof |
| US20030003601A1 (en) | 2001-07-02 | 2003-01-02 | Fuji Photo Film Co., Ltd. | Biochemical analysis system and biochemical analysis unit |
| US6855561B2 (en)* | 2001-09-10 | 2005-02-15 | Quidel Corporation | Method for adding an apparent non-signal line to a lateral flow assay |
| US6966880B2 (en) | 2001-10-16 | 2005-11-22 | Agilent Technologies, Inc. | Universal diagnostic platform |
| IL146776A (en) | 2001-11-27 | 2010-11-30 | Yoram Alroy | Device for blood sampling under vacuum conditions |
| US20030155012A1 (en) | 2001-12-04 | 2003-08-21 | Dave Smith | Rotary valve with compliant lining |
| US6717967B2 (en) | 2002-03-18 | 2004-04-06 | Dicos Technologies Inc. | Absolutely calibrated periodic filters and sources |
| WO2003083474A1 (en) | 2002-03-28 | 2003-10-09 | Olympus Corporation | Test piece for analyzing substance with biological origin, process for producing the same and method of examining test piece for substance with biological origin |
| ATE537438T1 (en) | 2002-05-17 | 2011-12-15 | Life Technologies Corp | DEVICE AND METHOD FOR DISTINGUISHING SEVERAL FLUORESCENCE SIGNALS BASED ON THEIR EXCITATION WAVELENGTH |
| US7323139B2 (en) | 2002-07-26 | 2008-01-29 | Quantum Design, Inc. | Accessible assay and method of use |
| US6875185B2 (en) | 2002-07-29 | 2005-04-05 | Branan Medical Corporation | Integrated confirmation sample in a body fluid test device and method of using |
| DE10253154A1 (en) | 2002-11-14 | 2004-05-27 | Siemens Ag | Biosensor, used to identify analyte in liquid sample, has test field with detector, where detector registers field changes as electrical signals for evaluation |
| US7220597B2 (en) | 2003-01-30 | 2007-05-22 | Zin Benedict L | Assay test device and method of making same |
| US7239394B2 (en) | 2003-06-04 | 2007-07-03 | Inverness Medical Switzerland Gmbh | Early determination of assay results |
| JP4933258B2 (en)* | 2003-09-22 | 2012-05-16 | クイデル コーポレーション | Device for detecting multiple analytes in a sample |
| US20050112703A1 (en)* | 2003-11-21 | 2005-05-26 | Kimberly-Clark Worldwide, Inc. | Membrane-based lateral flow assay devices that utilize phosphorescent detection |
| US7521259B2 (en) | 2004-04-01 | 2009-04-21 | Alverix, Inc. | Assay test strips with multiple labels and reading same |
| US20070143035A1 (en) | 2005-12-19 | 2007-06-21 | Petruno Patrick T | Diagnostic test reader with disabling unit |
| US20050221504A1 (en) | 2004-04-01 | 2005-10-06 | Petruno Patrick T | Optoelectronic rapid diagnostic test system |
| US8128871B2 (en) | 2005-04-22 | 2012-03-06 | Alverix, Inc. | Lateral flow assay systems and methods |
| US20070185679A1 (en) | 2004-04-01 | 2007-08-09 | Petruno Patrick T | Indicating status of a diagnostic test system |
| US20060216696A1 (en) | 2004-08-23 | 2006-09-28 | Goguen Jon D | Rapid plague detection system |
| US7925445B2 (en) | 2004-12-03 | 2011-04-12 | Alverix, Inc. | Read-write assay system |
| US7330255B2 (en) | 2004-12-09 | 2008-02-12 | University Of Chicago | Total internal reflection fluorescence apparatus |
| WO2006094388A1 (en) | 2005-03-07 | 2006-09-14 | Novx Systems Inc. | Automated analyzer |
| US10041941B2 (en) | 2005-04-22 | 2018-08-07 | Alverix, Inc. | Assay test strips with multiple labels and reading same |
| US20070081920A1 (en) | 2005-10-12 | 2007-04-12 | Murphy R S | Semi-disposable optoelectronic rapid diagnostic test system |
- 2005
- 2005-04-22USUS11/112,807patent/US8128871B2/enactiveActive
- 2005-11-16USUS11/280,640patent/US7521260B2/enactiveActive
- 2005-11-28DEDE102005056695Apatent/DE102005056695B4/enactiveActive
- 2006
- 2006-02-09CNCNA2006100073421Apatent/CN1851458A/enactivePending
- 2006-04-19JPJP2006115552Apatent/JP2006300950A/enactivePending
- 2009
- 2009-03-24USUS12/409,877patent/US20090180927A1/ennot_activeAbandoned
- 2009-03-24USUS12/409,861patent/US20090180925A1/ennot_activeAbandoned
- 2009-03-24USUS12/409,871patent/US8043867B2/ennot_activeExpired - Lifetime
- 2012
- 2012-01-27USUS13/360,081patent/US9091631B2/ennot_activeExpired - Lifetime
- 2013
- 2013-09-05USUS14/019,166patent/US9243997B2/ennot_activeExpired - Lifetime
- 2016
- 2016-01-25USUS15/005,776patent/US9989527B2/ennot_activeExpired - Lifetime
- 2016-10-18USUS15/296,872patent/US10191043B2/ennot_activeExpired - Lifetime
- 2019
- 2019-01-25USUS16/257,537patent/US11782058B2/enactiveActive
Patent Citations (41)
| Publication number | Priority date | Publication date | Assignee | Title |
|---|---|---|---|---|
| US6268162B1 (en) | 1986-08-13 | 2001-07-31 | Lifescan, Inc. | Reflectance measurement of analyte concentration with automatic initiation of timing |
| US5132097A (en) | 1987-02-11 | 1992-07-21 | G.D. Research | Apparatus for analysis of specific binding complexes |
| US5442169A (en) | 1991-04-26 | 1995-08-15 | Paul Scherrer Institut | Method and apparatus for determining a measuring variable by means of an integrated optical sensor module |
| US5304813A (en) | 1991-10-14 | 1994-04-19 | Landis & Gyr Betriebs Ag | Apparatus for the optical recognition of documents |
| US5580794A (en) | 1993-08-24 | 1996-12-03 | Metrika Laboratories, Inc. | Disposable electronic assay device |
| US5837546A (en) | 1993-08-24 | 1998-11-17 | Metrika, Inc. | Electronic assay device and method |
| WO1995013531A1 (en) | 1993-11-12 | 1995-05-18 | Unipath Limited | Reading devices for teststrips |
| US6656744B2 (en) | 1995-08-09 | 2003-12-02 | Quidel Corporation | One-step lateral flow assays |
| US20020146844A1 (en) | 1995-08-09 | 2002-10-10 | Karen B. Dow Morrison And Foerster Llp | One-step lateral flow assays |
| US5861256A (en) | 1996-03-05 | 1999-01-19 | Gull Laboratories | Methods and apparatus for detection and discrimination of multiple analytes using flourescent technology |
| CA2210559A1 (en) | 1996-07-16 | 1998-01-16 | Boehringer Mannheim Gmbh | Analytical system with means for detecting too small sample volumes |
| US5961451A (en) | 1997-04-07 | 1999-10-05 | Motorola, Inc. | Noninvasive apparatus having a retaining member to retain a removable biosensor |
| US6673622B1 (en) | 1997-06-27 | 2004-01-06 | Hemosense, Inc. | Coagulation or lysis assays by measuring impedance |
| US6585341B1 (en) | 1997-06-30 | 2003-07-01 | Hewlett-Packard Company | Back-branding media determination system for inkjet printing |
| US6561643B1 (en) | 1997-06-30 | 2003-05-13 | Hewlett-Packard Co. | Advanced media determination system for inkjet printing |
| US6394952B1 (en) | 1998-02-03 | 2002-05-28 | Adeza Biomedical Corporation | Point of care diagnostic systems |
| WO1999041596A1 (en) | 1998-02-11 | 1999-08-19 | 77 Elektronika Műszeripari Kft. | Automatic test strip analyser apparatus |
| US20010035990A1 (en) | 1998-04-13 | 2001-11-01 | Fai H Mok | Multiplexed hologram copying system and method |
| US6483582B2 (en) | 1998-07-27 | 2002-11-19 | Ljl Biosystems, Inc. | Apparatus and methods for time-resolved spectroscopic measurements |
| US6136610A (en) | 1998-11-23 | 2000-10-24 | Praxsys Biosystems, Inc. | Method and apparatus for performing a lateral flow assay |
| US20040018637A1 (en) | 1998-11-23 | 2004-01-29 | Polito Alan J. | Method and apparatus for performing a lateral flow assay |
| US6217744B1 (en) | 1998-12-18 | 2001-04-17 | Peter Crosby | Devices for testing fluid |
| US6300141B1 (en) | 1999-03-02 | 2001-10-09 | Helix Biopharma Corporation | Card-based biosensor device |
| US6630307B2 (en) | 1999-05-07 | 2003-10-07 | Quantum Dot Corporation | Method of detecting an analyte in a sample using semiconductor nanocrystals as a detectable label |
| US6274323B1 (en) | 1999-05-07 | 2001-08-14 | Quantum Dot Corporation | Method of detecting an analyte in a sample using semiconductor nanocrystals as a detectable label |
| WO2001057502A1 (en) | 2000-02-02 | 2001-08-09 | Otsuka Pharmaceutical Co., Ltd. | Test strip measuring method and device |
| US20020004246A1 (en) | 2000-02-07 | 2002-01-10 | Daniels Robert H. | Immunochromatographic methods for detecting an analyte in a sample which employ semiconductor nanocrystals as detectable labels |
| US6671428B1 (en) | 2000-12-01 | 2003-12-30 | Bayspec, Inc. | Wavelength selective optical cross switch and optical add/drop multiplexer using volume phase grating and array of micro electro mechanical mirrors |
| US20020176927A1 (en) | 2001-03-29 | 2002-11-28 | Kodas Toivo T. | Combinatorial synthesis of material systems |
| US6379622B1 (en) | 2001-04-11 | 2002-04-30 | Motorola, Inc. | Sensor incorporating a quantum dot as a reference |
| US20030143580A1 (en) | 2001-09-06 | 2003-07-31 | Don Straus | Rapid and sensitive detection of molecules |
| US20030082516A1 (en) | 2001-09-06 | 2003-05-01 | Don Straus | Rapid detection of replicating cells |
| US20040014202A1 (en) | 2001-11-29 | 2004-01-22 | King Howard G. | Apparatus and method for differentiating multiple fluorescence signals by excitation wavelength |
| US20030119203A1 (en) | 2001-12-24 | 2003-06-26 | Kimberly-Clark Worldwide, Inc. | Lateral flow assay devices and methods for conducting assays |
| US20030119202A1 (en) | 2001-12-24 | 2003-06-26 | Kimberly-Clark Worldwide, Inc. | Reading device, method, and system for conducting lateral flow assays |
| WO2003065009A2 (en) | 2002-02-01 | 2003-08-07 | California Institute Of Technology | Methods and apparatus for assays of bacterial spores |
| US20030207454A1 (en) | 2002-05-01 | 2003-11-06 | Eyster Curt R. | Devices and methods for analyte concentration determination |
| US6750963B2 (en) | 2002-05-21 | 2004-06-15 | Agilent Technologies, Inc. | Imaging systems for signals on a surface |
| US20030222198A1 (en) | 2002-05-30 | 2003-12-04 | Olszak Artur G. | Imaging system with an integrated source and detector array |
| US20040151632A1 (en) | 2002-06-27 | 2004-08-05 | Badley Robert Andrew | Luminescence assays and assay readers |
| US20040043502A1 (en) | 2002-08-27 | 2004-03-04 | Kimberly-Clark Worldwide, Inc. | Membrane-based assay devices that utilize time-resolved fluorescence |
Cited By (54)
| Publication number | Priority date | Publication date | Assignee | Title |
|---|---|---|---|---|
| US9243997B2 (en)* | 2004-04-01 | 2016-01-26 | Alverix, Inc. | Lateral flow assay systems and methods |
| US20140004624A1 (en)* | 2004-04-01 | 2014-01-02 | Alverix, Inc. | Lateral flow assay systems and methods |
| US9989527B2 (en) | 2004-04-01 | 2018-06-05 | Alverix, Inc. | Lateral flow assay systems and methods |
| US20090180928A1 (en)* | 2005-04-22 | 2009-07-16 | Alverix, Inc. | Assay test strips with multiple labels and reading same |
| US11782058B2 (en) | 2005-04-22 | 2023-10-10 | Alverix, Inc. | Diagnostic test system using measurement obtained from reference feature to modify operational parameter of reader |
| US20090214383A1 (en)* | 2005-04-22 | 2009-08-27 | Alverix, Inc. | Assay test strips with multiple labels and reading same |
| US10753931B2 (en) | 2005-04-22 | 2020-08-25 | Alverix, Inc. | Assay test strips with multiple labels and reading same |
| US10191043B2 (en) | 2005-04-22 | 2019-01-29 | Alverix, Inc. | Methods and systems for calibrating illumination source of diagnostic test system |
| US9891217B2 (en)* | 2005-04-22 | 2018-02-13 | Alverix, Inc. | Assay test strips with multiple labels and reading same |
| US10041941B2 (en)* | 2005-04-22 | 2018-08-07 | Alverix, Inc. | Assay test strips with multiple labels and reading same |
| US9877672B2 (en) | 2010-01-28 | 2018-01-30 | Ellume Pty Ltd | Sampling and testing device for the human or animal body |
| US11016090B2 (en) | 2011-01-18 | 2021-05-25 | Symbolics, Llc | Lateral flow assays using two dimensional features |
| US9874576B2 (en) | 2011-01-18 | 2018-01-23 | Symbolics, Llc | Lateral flow assays using two dimensional features |
| US8486717B2 (en) | 2011-01-18 | 2013-07-16 | Symbolics, Llc | Lateral flow assays using two dimensional features |
| US9851366B2 (en) | 2011-01-18 | 2017-12-26 | Symbolics, Llc | Lateral flow assays using two dimensional features |
| US10816492B2 (en) | 2012-01-31 | 2020-10-27 | Regents Of The University Of Minnesota | Lateral flow assays with thermal contrast readers |
| US10725033B2 (en) | 2012-01-31 | 2020-07-28 | Regents Of The University Of Minnesota | Lateral flow assays with thermal contrast readers |
| US9651508B2 (en) | 2012-01-31 | 2017-05-16 | Regents Of The University Of Minnesota | Thermal contrast assay and reader |
| US11061020B2 (en) | 2012-03-01 | 2021-07-13 | Quidel Corporation | Interactive test device and apparatus with timing mechanism |
| US10281462B2 (en) | 2012-03-01 | 2019-05-07 | Quidel Corporation | System and apparatus for point-of-care diagnostics |
| US11131666B2 (en) | 2012-03-01 | 2021-09-28 | Quidel Corporation | System and apparatus for point-of-care diagnostics |
| US9207181B2 (en) | 2012-03-01 | 2015-12-08 | Quidel Corporation | System and apparatus for point-of-care diagnostics |
| US9874556B2 (en) | 2012-07-18 | 2018-01-23 | Symbolics, Llc | Lateral flow assays using two dimensional features |
| WO2014043247A1 (en) | 2012-09-12 | 2014-03-20 | Force Diagnostics, Inc | Rapid tests for insurance underwriting |
| US10890590B2 (en) | 2012-09-27 | 2021-01-12 | Ellume Limited | Diagnostic devices and methods |
| US9599615B2 (en) | 2013-03-13 | 2017-03-21 | Symbolics, Llc | Lateral flow assays using two dimensional test and control signal readout patterns |
| US10845300B2 (en) | 2013-12-06 | 2020-11-24 | Quidel Corporation | Method for reducing analyzer variability using a normalization target |
| US9989466B2 (en) | 2013-12-06 | 2018-06-05 | Quidel Corporation | Method for reducing analyzer variability using a normalization target |
| US11953428B2 (en) | 2013-12-06 | 2024-04-09 | Quidel Corporation | Method for reducing analyzer variability using a normalization target |
| US10495574B2 (en) | 2013-12-06 | 2019-12-03 | Quidel Corporation | Method for reducing analyzer variability using a normalization target |
| US10101342B2 (en) | 2014-02-12 | 2018-10-16 | Church & Dwight Co., Inc. | Devices and methods for electronic analyte assaying |
| US10031085B2 (en) | 2014-07-24 | 2018-07-24 | Ortho-Clinical Diagnostics, Inc. | Point of care analytical processing system |
| US10786229B2 (en) | 2015-01-22 | 2020-09-29 | Ellume Limited | Diagnostic devices and methods for mitigating hook effect and use thereof |
| US11360001B2 (en) | 2017-09-21 | 2022-06-14 | Becton, Dickinson And Company | Reactive demarcation template for hazardous contaminant testing |
| US11002642B2 (en) | 2017-09-21 | 2021-05-11 | Becton, Dickinson And Company | Demarcation template for hazardous contaminant testing |
| US12436158B2 (en) | 2017-09-21 | 2025-10-07 | Becton, Dickinson And Company | High dynamic range assays in hazardous contaminant testing |
| US11782042B2 (en) | 2017-09-21 | 2023-10-10 | Becton, Dickinson And Company | Hazardous contaminant collection kit and rapid testing |
| US12399088B2 (en) | 2017-09-21 | 2025-08-26 | Becton, Dickinson And Company | Demarcation template for hazardous contaminant testing |
| USD1066729S1 (en) | 2017-09-21 | 2025-03-11 | Becton, Dickinson And Company | Collection device |
| USD923195S1 (en) | 2017-09-21 | 2021-06-22 | Becton, Dickinson And Company | Collection device |
| US10916058B2 (en) | 2017-09-21 | 2021-02-09 | Becton, Dickinson And Company | Augmented reality devices for hazardous contaminant testing |
| US11380074B2 (en) | 2017-09-21 | 2022-07-05 | Becton, Dickinson And Company | Augmented reality devices for hazardous contaminant testing |
| US11385146B2 (en) | 2017-09-21 | 2022-07-12 | Becton, Dickinson And Company | Sampling systems and techniques to collect hazardous contaminants with high pickup and shedding efficiencies |
| US11391748B2 (en)* | 2017-09-21 | 2022-07-19 | Becton, Dickinson And Company | High dynamic range assays in hazardous contaminant testing |
| USD976437S1 (en) | 2017-09-21 | 2023-01-24 | Becton, Dickinson And Company | Collection device |
| US11585733B2 (en) | 2017-09-21 | 2023-02-21 | Becton, Dickinson And Company | Hazardous contaminant collection kit and rapid testing |
| US11199529B2 (en) | 2017-09-21 | 2021-12-14 | Becton, Dickinson And Company | Hazardous contaminant collection kit and rapid testing |
| US20190086431A1 (en)* | 2017-09-21 | 2019-03-21 | Becton, Dickinson And Company | High dynamic range assays in hazardous contaminant testing |
| US11821819B2 (en) | 2017-09-21 | 2023-11-21 | Becton, Dickinson And Company | Demarcation template for hazardous contaminant testing |
| US11280801B2 (en) | 2019-01-28 | 2022-03-22 | Becton, Dickinson And Company | Hazardous contaminant collection device with integrated swab and test device |
| US11860173B2 (en) | 2019-01-28 | 2024-01-02 | Becton, Dickinson And Company | Hazardous contaminant collection device with integrated swab and test device |
| US11280788B2 (en) | 2019-01-31 | 2022-03-22 | Fresenius Medical Care Holdings, Inc. | Rapid diagnosis of peritonitis in peritoneal dialysis patients |
| WO2020160040A1 (en) | 2019-01-31 | 2020-08-06 | Fresenius Medical Care Holdings, Inc. | Rapid diagnosis of peritonitis in peritoneal dialysis patients |
| WO2022020760A1 (en) | 2020-07-23 | 2022-01-27 | Fresenius Medical Care Holdings, Inc. | System for determining peritonitis using homodimer neutrophil gelatinase-associated lipocalin |
Also Published As
| Publication number | Publication date |
|---|---|
| US20060240568A1 (en) | 2006-10-26 |
| US20160313254A1 (en) | 2016-10-27 |
| DE102005056695B4 (en) | 2013-07-04 |
| US20090180925A1 (en) | 2009-07-16 |
| DE102005056695A1 (en) | 2006-11-02 |
| US9243997B2 (en) | 2016-01-26 |
| US20170199183A1 (en) | 2017-07-13 |
| JP2006300950A (en) | 2006-11-02 |
| US20140004624A1 (en) | 2014-01-02 |
| US20090180927A1 (en) | 2009-07-16 |
| US20120129272A1 (en) | 2012-05-24 |
| US11782058B2 (en) | 2023-10-10 |
| US20190154681A1 (en) | 2019-05-23 |
| US7521260B2 (en) | 2009-04-21 |
| US8043867B2 (en) | 2011-10-25 |
| CN1851458A (en) | 2006-10-25 |
| US9091631B2 (en) | 2015-07-28 |
| US20090180926A1 (en) | 2009-07-16 |
| US9989527B2 (en) | 2018-06-05 |
| US10191043B2 (en) | 2019-01-29 |
| US20060240541A1 (en) | 2006-10-26 |
Similar Documents
| Publication | Publication Date | Title |
|---|---|---|
| US9989527B2 (en) | Lateral flow assay systems and methods | |
| US20200393460A1 (en) | Assay test strips with multiple labels and reading same | |
| US7521259B2 (en) | Assay test strips with multiple labels and reading same | |
| JP2006208386A (en) | Assay test strip with multiple labels and method for reading the same | |
| US11733169B2 (en) | Multiple analyte detection systems and methods of detecting multiple analytes | |
| JP3559975B2 (en) | Analysis method using test pieces | |
| EP4099002A1 (en) | Chromatographic inspection apparatus and control method thereof | |
| US20070188736A1 (en) | Obtaining measurement and baseline signals for evaluating assay test strips | |
| JP2008544212A (en) | Compact optical read head for optical diagnostic equipment | |
| US20070122914A1 (en) | Obtaining measurements of light transmitted through an assay test strip | |
| JPS59109844A (en) | Reflected light measuring device | |
| KR20150029290A (en) | Reading device of diagnostic strip | |
| EP4558273A2 (en) | Analyzer having a transparent shield for protecting an imaging system | |
| WO2022193028A1 (en) | Assay membrane test region localization |
Legal Events
| Date | Code | Title | Description |
|---|---|---|---|
| AS | Assignment | Owner name:AGILENT TECHNOLOGIES, INC., COLORADO Free format text:ASSIGNMENT OF ASSIGNORS INTEREST;ASSIGNORS:TRUTNA, JR., WILLIAM RICHARD;ROSENAU, STEVEN;REEL/FRAME:016091/0618 Effective date:20050428 | |
| AS | Assignment | Owner name:AGILENT TECHNOLOGIES, INC., COLORADO Free format text:ASSIGNMENT OF ASSIGNORS INTEREST;ASSIGNORS:PETRUNO, PATRICK T.;PETRILLA, JOHN F.;BRONSAN, MICHAEL J.;AND OTHERS;SIGNING DATES FROM 20050419 TO 20050422;REEL/FRAME:016333/0296 Owner name:AGILENT TECHNOLOGIES, INC., COLORADO Free format text:ASSIGNMENT OF ASSIGNORS INTEREST;ASSIGNORS:PETRUNO, PATRICK T.;PETRILLA, JOHN F.;BRONSAN, MICHAEL J.;AND OTHERS;REEL/FRAME:016333/0296;SIGNING DATES FROM 20050419 TO 20050422 | |
| AS | Assignment | Owner name:AVAGO TECHNOLOGIES GENERAL IP PTE. LTD.,SINGAPORE Free format text:ASSIGNMENT OF ASSIGNORS INTEREST;ASSIGNOR:AGILENT TECHNOLOGIES, INC.;REEL/FRAME:017206/0666 Effective date:20051201 Owner name:AVAGO TECHNOLOGIES GENERAL IP PTE. LTD., SINGAPORE Free format text:ASSIGNMENT OF ASSIGNORS INTEREST;ASSIGNOR:AGILENT TECHNOLOGIES, INC.;REEL/FRAME:017206/0666 Effective date:20051201 | |
| AS | Assignment | Owner name:AGILENT TECHNOLOGIES, INC., COLORADO Free format text:CORRECTIVE ASSIGNMENT TO CORRECT THE 3RD ASSIGNOR'S NAME PREVIOUSLY RECORDED AT REEL 016333 FRAME 0296;ASSIGNORS:PETRUNO, PATRICK T.;PETRILLA, JOHN F.;BROSNAN, MICHAEL J.;AND OTHERS;REEL/FRAME:018949/0432;SIGNING DATES FROM 20050419 TO 20050422 Owner name:AGILENT TECHNOLOGIES, INC., COLORADO Free format text:CORRECTIVE ASSIGNMENT TO CORRECT THE 3RD ASSIGNOR'S NAME PREVIOUSLY RECORDED AT REEL 016333 FRAME 0296. ASSIGNOR CONFIRMS THE ASSIGNMENT;ASSIGNORS:PETRUNO, PATRICK T.;PETRILLA, JOHN F.;BROSNAN, MICHAEL J.;AND OTHERS;SIGNING DATES FROM 20050419 TO 20050422;REEL/FRAME:018949/0432 | |
| AS | Assignment | Owner name:AVAGO TECHNOLOGIES GENERAL IP (SINGAPORE) PTE. LTD Free format text:CORRECTIVE ASSIGNMENT TO CORRECT THE ASSIGNEE NAME AND ADDRESS ON A DOCUMENT PREVIOUSLY RECORDED ON REEL 017206 FRAME 0666;ASSIGNORS:PETRUNO, PATRICK T.;PETRILLA, JOHN F.;BROSNAN, MICHAEL J.;AND OTHERS;REEL/FRAME:019107/0379;SIGNING DATES FROM 20050419 TO 20050422 Owner name:AVAGO TECHNOLOGIES GENERAL IP (SINGAPORE) PTE. LTD Free format text:CORRECTIVE ASSIGNMENT TO CORRECT THE ASSIGNEE NAME AND ADDRESS ON A DOCUMENT PREVIOUSLY RECORDED ON REEL 017206 FRAME 0666. ASSIGNOR(S) HEREBY CONFIRMS THE ASSIGNMENT OF ASSIGNOR'S INTEREST;ASSIGNORS:PETRUNO, PATRICK T.;PETRILLA, JOHN F.;BROSNAN, MICHAEL J.;AND OTHERS;SIGNING DATES FROM 20050419 TO 20050422;REEL/FRAME:019107/0379 | |
| AS | Assignment | Owner name:ALVERIX, INC., CALIFORNIA Free format text:ASSIGNMENT OF ASSIGNORS INTEREST;ASSIGNOR:AVAGO TECHNOLOGIES GENERAL IP (SINGAPORE) PTE. LTD.;REEL/FRAME:020948/0582 Effective date:20080214 Owner name:ALVERIX, INC.,CALIFORNIA Free format text:ASSIGNMENT OF ASSIGNORS INTEREST;ASSIGNOR:AVAGO TECHNOLOGIES GENERAL IP (SINGAPORE) PTE. LTD.;REEL/FRAME:020948/0582 Effective date:20080214 | |
| STCF | Information on status: patent grant | Free format text:PATENTED CASE | |
| FEPP | Fee payment procedure | Free format text:PAT HOLDER NO LONGER CLAIMS SMALL ENTITY STATUS, ENTITY STATUS SET TO UNDISCOUNTED (ORIGINAL EVENT CODE: STOL); ENTITY STATUS OF PATENT OWNER: LARGE ENTITY | |
| FPAY | Fee payment | Year of fee payment:4 | |
| AS | Assignment | Owner name:AVAGO TECHNOLOGIES GENERAL IP (SINGAPORE) PTE. LTD Free format text:CORRECTIVE ASSIGNMENT TO CORRECT THE ASSIGNEE NAME PREVIOUSLY RECORDED AT REEL: 017206 FRAME: 0666. ASSIGNOR(S) HEREBY CONFIRMS THE ASSIGNMENT;ASSIGNOR:AGILENT TECHNOLOGIES, INC.;REEL/FRAME:038632/0662 Effective date:20051201 | |
| MAFP | Maintenance fee payment | Free format text:PAYMENT OF MAINTENANCE FEE, 8TH YEAR, LARGE ENTITY (ORIGINAL EVENT CODE: M1552); ENTITY STATUS OF PATENT OWNER: LARGE ENTITY Year of fee payment:8 | |
| MAFP | Maintenance fee payment | Free format text:PAYMENT OF MAINTENANCE FEE, 12TH YEAR, LARGE ENTITY (ORIGINAL EVENT CODE: M1553); ENTITY STATUS OF PATENT OWNER: LARGE ENTITY Year of fee payment:12 |