US8079955B2 - Method and apparatus for managing glucose control - Google Patents
Method and apparatus for managing glucose controlDownload PDFInfo
- Publication number
- US8079955B2 US8079955B2US11/689,745US68974507AUS8079955B2US 8079955 B2US8079955 B2US 8079955B2US 68974507 AUS68974507 AUS 68974507AUS 8079955 B2US8079955 B2US 8079955B2
- Authority
- US
- United States
- Prior art keywords
- hypoglycemia
- hyperglycemia
- glucose
- normoglycemia
- integrated
- Prior art date
- Legal status (The legal status is an assumption and is not a legal conclusion. Google has not performed a legal analysis and makes no representation as to the accuracy of the status listed.)
- Active, expires
Links
- WQZGKKKJIJFFOK-GASJEMHNSA-NGlucoseNatural productsOC[C@H]1OC(O)[C@H](O)[C@@H](O)[C@@H]1OWQZGKKKJIJFFOK-GASJEMHNSA-N0.000titleclaimsabstractdescription122
- 239000008103glucoseSubstances0.000titleclaimsabstractdescription122
- 238000000034methodMethods0.000titleclaimsabstractdescription28
- 230000002218hypoglycaemic effectEffects0.000claimsdescription57
- 208000013016HypoglycemiaDiseases0.000claimsdescription55
- 201000001421hyperglycemiaDiseases0.000claimsdescription45
- 238000012544monitoring processMethods0.000claimsdescription23
- 230000036541healthEffects0.000claimsdescription8
- 230000000007visual effectEffects0.000claimsdescription4
- 239000003086colorantSubstances0.000claimsdescription2
- 238000005259measurementMethods0.000description7
- NOESYZHRGYRDHS-UHFFFAOYSA-NinsulinChemical compoundN1C(=O)C(NC(=O)C(CCC(N)=O)NC(=O)C(CCC(O)=O)NC(=O)C(C(C)C)NC(=O)C(NC(=O)CN)C(C)CC)CSSCC(C(NC(CO)C(=O)NC(CC(C)C)C(=O)NC(CC=2C=CC(O)=CC=2)C(=O)NC(CCC(N)=O)C(=O)NC(CC(C)C)C(=O)NC(CCC(O)=O)C(=O)NC(CC(N)=O)C(=O)NC(CC=2C=CC(O)=CC=2)C(=O)NC(CSSCC(NC(=O)C(C(C)C)NC(=O)C(CC(C)C)NC(=O)C(CC=2C=CC(O)=CC=2)NC(=O)C(CC(C)C)NC(=O)C(C)NC(=O)C(CCC(O)=O)NC(=O)C(C(C)C)NC(=O)C(CC(C)C)NC(=O)C(CC=2NC=NC=2)NC(=O)C(CO)NC(=O)CNC2=O)C(=O)NCC(=O)NC(CCC(O)=O)C(=O)NC(CCCNC(N)=N)C(=O)NCC(=O)NC(CC=3C=CC=CC=3)C(=O)NC(CC=3C=CC=CC=3)C(=O)NC(CC=3C=CC(O)=CC=3)C(=O)NC(C(C)O)C(=O)N3C(CCC3)C(=O)NC(CCCCN)C(=O)NC(C)C(O)=O)C(=O)NC(CC(N)=O)C(O)=O)=O)NC(=O)C(C(C)CC)NC(=O)C(CO)NC(=O)C(C(C)O)NC(=O)C1CSSCC2NC(=O)C(CC(C)C)NC(=O)C(NC(=O)C(CCC(N)=O)NC(=O)C(CC(N)=O)NC(=O)C(NC(=O)C(N)CC=1C=CC=CC=1)C(C)C)CC1=CN=CN1NOESYZHRGYRDHS-UHFFFAOYSA-N0.000description6
- 230000036252glycationEffects0.000description5
- 102000001554HemoglobinsHuman genes0.000description4
- 108010054147HemoglobinsProteins0.000description4
- 239000008280bloodSubstances0.000description4
- 210000004369bloodAnatomy0.000description4
- 238000004364calculation methodMethods0.000description4
- 206010012601diabetes mellitusDiseases0.000description4
- 230000007774longtermEffects0.000description4
- 102000004877InsulinHuman genes0.000description3
- 108090001061InsulinProteins0.000description3
- 230000008859changeEffects0.000description3
- 229940125396insulinDrugs0.000description3
- 235000011888snacksNutrition0.000description3
- 206010010071ComaDiseases0.000description2
- 206010010904ConvulsionDiseases0.000description2
- 208000010513StuporDiseases0.000description2
- 230000009471actionEffects0.000description2
- 150000001720carbohydratesChemical class0.000description2
- 235000014633carbohydratesNutrition0.000description2
- 210000005036nerveAnatomy0.000description2
- 102000004169proteins and genesHuman genes0.000description2
- 108090000623proteins and genesProteins0.000description2
- 238000012360testing methodMethods0.000description2
- 238000012935AveragingMethods0.000description1
- 208000002249Diabetes ComplicationsDiseases0.000description1
- 206010023379KetoacidosisDiseases0.000description1
- 208000007976KetosisDiseases0.000description1
- 102000016261Long-Acting InsulinHuman genes0.000description1
- 108010092217Long-Acting InsulinProteins0.000description1
- 229940100066Long-acting insulinDrugs0.000description1
- 206010039203Road traffic accidentDiseases0.000description1
- 206010042434Sudden deathDiseases0.000description1
- 206010067584Type 1 diabetes mellitusDiseases0.000description1
- 230000006978adaptationEffects0.000description1
- 238000013459approachMethods0.000description1
- 210000004204blood vesselAnatomy0.000description1
- 235000021074carbohydrate intakeNutrition0.000description1
- 210000000748cardiovascular systemAnatomy0.000description1
- 239000003795chemical substances by applicationSubstances0.000description1
- 230000003930cognitive abilityEffects0.000description1
- 230000001419dependent effectEffects0.000description1
- 238000009795derivationMethods0.000description1
- 238000001514detection methodMethods0.000description1
- 235000005911dietNutrition0.000description1
- 230000000378dietary effectEffects0.000description1
- 201000010099diseaseDiseases0.000description1
- 208000037265diseases, disorders, signs and symptomsDiseases0.000description1
- 229940079593drugDrugs0.000description1
- 239000003814drugSubstances0.000description1
- 230000000694effectsEffects0.000description1
- 210000003722extracellular fluidAnatomy0.000description1
- 229940047135glycateDrugs0.000description1
- 230000002641glycemic effectEffects0.000description1
- 230000002727hyperosmolarEffects0.000description1
- 230000006872improvementEffects0.000description1
- 238000002347injectionMethods0.000description1
- 239000007924injectionSubstances0.000description1
- 230000010354integrationEffects0.000description1
- 210000003734kidneyAnatomy0.000description1
- 230000007246mechanismEffects0.000description1
- 238000012806monitoring deviceMethods0.000description1
- 230000000422nocturnal effectEffects0.000description1
- 210000000056organAnatomy0.000description1
- 206010033675panniculitisDiseases0.000description1
- 210000001525retinaAnatomy0.000description1
- 210000004304subcutaneous tissueAnatomy0.000description1
- 208000011580syndromic diseaseDiseases0.000description1
Images


Classifications
- A—HUMAN NECESSITIES
- A61—MEDICAL OR VETERINARY SCIENCE; HYGIENE
- A61B—DIAGNOSIS; SURGERY; IDENTIFICATION
- A61B5/00—Measuring for diagnostic purposes; Identification of persons
- A61B5/48—Other medical applications
- A61B5/4833—Assessment of subject's compliance to treatment
- A—HUMAN NECESSITIES
- A61—MEDICAL OR VETERINARY SCIENCE; HYGIENE
- A61B—DIAGNOSIS; SURGERY; IDENTIFICATION
- A61B5/00—Measuring for diagnostic purposes; Identification of persons
- A61B5/145—Measuring characteristics of blood in vivo, e.g. gas concentration or pH-value ; Measuring characteristics of body fluids or tissues, e.g. interstitial fluid or cerebral tissue
- A61B5/14532—Measuring characteristics of blood in vivo, e.g. gas concentration or pH-value ; Measuring characteristics of body fluids or tissues, e.g. interstitial fluid or cerebral tissue for measuring glucose, e.g. by tissue impedance measurement
- A—HUMAN NECESSITIES
- A61—MEDICAL OR VETERINARY SCIENCE; HYGIENE
- A61B—DIAGNOSIS; SURGERY; IDENTIFICATION
- A61B5/00—Measuring for diagnostic purposes; Identification of persons
- A61B5/74—Details of notification to user or communication with user or patient; User input means
- A61B5/7475—User input or interface means, e.g. keyboard, pointing device, joystick
- A—HUMAN NECESSITIES
- A61—MEDICAL OR VETERINARY SCIENCE; HYGIENE
- A61B—DIAGNOSIS; SURGERY; IDENTIFICATION
- A61B5/00—Measuring for diagnostic purposes; Identification of persons
- A61B5/145—Measuring characteristics of blood in vivo, e.g. gas concentration or pH-value ; Measuring characteristics of body fluids or tissues, e.g. interstitial fluid or cerebral tissue
- A61B5/14503—Measuring characteristics of blood in vivo, e.g. gas concentration or pH-value ; Measuring characteristics of body fluids or tissues, e.g. interstitial fluid or cerebral tissue invasive, e.g. introduced into the body by a catheter or needle or using implanted sensors
Definitions
- Embodiments of the inventionrelate generally to the field of medical devices and, specifically, to methods, apparatuses, and systems associated with detecting, analyzing, and/or displaying historical glucose levels and/or trends in a body.
- hypoglycemialow blood sugar
- hypoglycemiamay lead to loss of cognitive abilities, seizures, stupor or coma.
- embarrassmentleaching one's train of thought in a meeting
- detection of hypoglycemiais one of the most important benefits of continuous glucose sensing.
- Hyperglycemiaelevated blood sugar
- FIG. 1illustrates a graphical and numeric representation of a glucose control index and exemplary associated values in accordance with various embodiments of the present invention
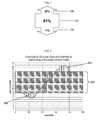
- FIG. 2illustrates a graphical plot and exemplary representation of glucose data for calculation of a glucose control index in accordance with various embodiments of the present invention
- FIG. 3illustrates a graphical and numeric representation of a glucose control index and exemplary associated values in accordance with various embodiments of the present invention
- FIG. 4illustrates an exemplary electronic monitoring unit showing various display features in accordance with various embodiments of the present invention.
- FIGS. 5A , 5 B, and 5 Cillustrate exemplary displays for an electronic monitoring unit in accordance with an embodiment of the present invention
- Coupledmay mean that two or more elements are in direct physical or electrical contact. However, “coupled” may also mean that two or more elements are not in direct contact with each other, but yet still cooperate or interact with each other.
- a phrase in the form “A/B”means A or B.
- a phrase in the form “A and/or B”means “(A), (B), or (A and B)”.
- a phrase in the form “at least one of A, B, and C”means “(A), (B), (C), (A and B), (A and C), (B and C), or (A, B and C)”.
- a phrase in the form “(A)B”means “(B) or (AB)” that is, A is an optional element.
- a computing systemmay be endowed with one or more components of the disclosed apparatuses and/or systems and may be employed to perform one or more methods as disclosed herein.
- Embodiments of the present inventionprovide methods, apparatuses, and systems associated with detecting, analyzing, and/or displaying historical glucose levels and/or trends in a body.
- Embodiments of the present inventionprovide glucose control indices and methods for monitoring and/or displaying glucose control characteristics.
- a methodcomprising measuring with a glucose sensing device a plurality of glucose values of an individual for a plurality of points of time over a defined time period; determining for the plurality of points of time over the defined time period the relative integrated percentages of hyperglycemia, hypoglycemia, and normoglycemia; identifying a glucose level condition of the individual based on the relative integrated percentages of hyperglycemia, hypoglycemia, and normoglycemia; and providing a notification of the glucose level condition to the individual.
- the term “integrated percentage”refers to the area between a curve and a line and is indicative of the magnitude and extent of the difference(s) between the line and the curve expressed as a percent area of the total area encompassed over a period of time.
- glucose level conditioncomprises a current and/or historical status of the glucose level of an individual, and may, in an embodiment, be displayed in textual form (stating the current status with indicators such as “moderately hypoglycemic” or “125 mg/dl” etc.) or graphical form (showing boxes, arrows, etc. in conjunction with or separate from numeric values).
- multiple measurementsmay be viewed or utilized in combination to provide an indication of the success of control measures taken by an individual.
- one or more valuesmay be used to determine an individual's success at controlling glucose levels in his/her body, and may further be used to provide information or recommendations to ensure better control in the future.
- such valuesmay include (1) the average glucose level (may be provided from A1C and/or average sensed values), (2) the deviation of glucose values (for example, the coefficient of variation or the standard deviation—may come from the continuously sensed values), and (3) the number and severity of hypoglycemia and/or hyperglycemia spells (the degree and duration of hypoglycemia and/or hyperglycemia).
- the one or more metrics used to evaluate an individual's glucose level controlmay be weighted equally or differently as desired.
- the hemoglobin A1Chas been a valuable tool for persons with diabetes. It provides an average of glucose values over a measured period, such as a 2-3 month period. For example, if a person's A1C value is 14%, then he/she knows that their average level of glycemia is extremely high. Typically this would mean that more insulin, more exercise, or less ingested carbohydrate (or some combination of the three) would be recommended.
- glucose valuesare quite variable and vary from 35 mg/dl (dangerously low) to 250 mg/dl (quite high).
- Such an individualmay be at high risk for stupor, coma, seizures, automobile accidents, and sudden death from severe hypoglycemia (and/or potentially hyperglycemia) but may have little indication from the A1C value.
- such an index of glucose controlmay have three parts, a normoglycemia value, a hypoglycemia value, and a hyperglycemia value.
- the determination of which glucose levels fall within which classificationmay be made by one of ordinary skill in the art in light of the teachings herein and in conjunction with the knowledge in the art.
- a normoglycemia number(for example centrally displayed and/or in a larger font) is the area (glucose values over time providing an integrated percentage) within the normal range (lower than the hyperglycemia boundary and higher than the hypoglycemia boundary).
- a hyperglycemia numberis the area at or above the hyperglycemia boundary and the hypoglycemia number is the area at or below the hypoglycemia boundary.
- the numbersmay be displayed, for example, as shown in FIG. 1 , with the normoglycemia number shown in 102 , the hyperglycemia number shown in 104 , and the hypoglycemia number shown in 106 .
- the upper (hyperglycemia) and lower (hypoglycemia) numbers 104 , 106may be in a smaller font from that of the normoglycemia number 102 .
- the font sizemay be variable and may match with the value of the raw numbers.
- a large hypoglycemia valuemay be displayed with a large font.
- one or more of the numbers or portions of the displaymay be color coded.
- the normoglycemia regionmay be displayed in green, the hypoglycemia region in red, and the hyperglycemia region in blue or yellow.
- the colorsmay be dynamic and change with the values being displayed to provide further emphasis.
- the upper and lower regionsmay be shown with arrows, or some other graphical symbol.
- the length and/or width of the arrows(as well as the size of the central normoglycemia region) may be dynamic and may correspond to the relative percentages/magnitudes of each region.
- the percentages for each regionindicate the percent area of the total area for the selected duration. Thus, in such an embodiment, all three values add up to a total of 100%.
- a glucose control indexmay be provided over any duration, from a few hours up to many weeks or months. Note, for example, that if a person is concerned about the hours between 1 AM and 6 AM, then he/she may calculate his/her glucose control index over that time period for one night only or over many nights. Thus, for example, an index may be determined for a continuous time period of 4 weeks, or an index may be determined for the time period of 1 AM to 6 AM for a period of 4 weeks, etc.
- the upper boundaryis 180 mg/dl and the lower boundary is 70 mg/dl (the upper/lower boundaries refer to the boundaries of the normoglycemia area, and, in embodiments, may or may not include one or both end points of the region).
- the individualIn the case of an individual whose control is good, the individual might have an upper value of 9%, a middle value of 90%, and a lower value of 1%. In an embodiment, such values may be abbreviated as 9/90/1. This would indicate that the individual rarely has low values and only occasionally has high values.
- the boundariesmay be set as desired by an individual or health professional.
- an individualhas an upper value of 30%, a middle value of 50%, and a lower value of 20%, abbreviated, for example, as 30/50/20.
- the individualhas frequent hypoglycemia and frequent hyperglycemia and may be at risk for serious consequences of hypoglycemia.
- the individualis probably not at risk for long term complications, however, since the individual's average glucose is good and the average glucose is the primary determinant of long term disease of the retina, kidney, nerves and cardiovascular system.
- index values as described aboveindicate areas, not percentages of time in given regions.
- hypoglycemia cutoff/boundaryof 70 mg/dl
- 4 valuesare obtained (once per minute) for the purpose of comparison.
- the valuesare each 60 mg/dl. Therefore the area below the cutoff is 10 mg/dl ⁇ 4 minutes, yielding an area of 40.
- the valuesare each 40 mg/dl, yielding a comparable area of 120.
- the individualis relatively well-controlled from 0601-1200, with some hyperglycemia, but little hypoglycemia.
- the individual's glucose control indexis the same as his overall value, indicating good control.
- hemay then, for example, institute a program in which he reduces his long acting insulin at bedtime and starts having a bedtime snack.
- his 0001-0600 glucose control index valuemay be, for example, 10/87/5, which is improved and now nearly the same as his overall glucose control index value.
- the specific time periods measuredmay be selected by a user, and may be in periods of minutes, hours, days, weeks and/or months, and may, in an embodiment, be unequal in duration across a series of measured time periods.
- An embodiment of the present inventionmay be provided to incorporate goal setting into a device and/or method.
- a devicemay be provided in which a particular goal for the glucose control index may be established by the individual and/or a physician and set in the device.
- theremay then be visual and/or audible indicators of how the individual is doing as compared to the goal that was established.
- an exemplary goalmay be set to reduce the individual's hypoglycemia values by 5% over a one-month period, and a display may be provided that shows, for example, after two weeks that the values have dropped by 3% indicating the individual is on track to achieve the goal.
- the uppermost hatched barsindicate hyperglycemia area 204
- the central barsindicate normoglycemia area 202
- the lowermost barsindicate hypoglycemia area 206 .
- the specific calculations of a glucose control indexmay be made by using integration or more simple mathematical estimates in order to measure the areas in each region and then express the values for each region as a percent of the total, so that all three values add to 100%.
- One value of using a percentageis that almost everyone is familiar with using percentages.
- the time duration in each regionmay be used, rather than the areas.
- FIG. 3illustrates a graphical display of a glucose index control value 302 which is a sum of the index values for the hyperglycemia region 304 and the hypoglycemia region 306 .
- the present embodimentdoes not show a normoglycemia value. Instead, this simplified representation shows the duration of time or area (mg/dl ⁇ time) outside a defined normoglycemia region.
- the valuesindicate relative concerns for hypoglycemia and hyperglycemia, and, in addition, provide an overall indication of how well the individual's glucose values are being managed.
- the upper (hyperglycemia) and lower (hypoglycemia) numbers 304 , 306may be in a smaller font from that of the overall glucose control index value 302 .
- one or more of the numbers or portions of the displaymay be color coded.
- the hypoglycemia regionmay be shown in red and the hyperglycemia region in blue or yellow.
- the upper and lower regionsmay be shown with arrows, or some other graphical symbol. In embodiments, the length and/or width of the arrows may correspond to the relative percentages/magnitudes of each region.
- glucose control index valuesmay be set as benchmarks to strive for in managing glucose levels.
- a real-time glucose averagemay be provided. Unlike the A1C whose value comes from a measurement of hemoglobin, a real-time glucose average comes from the averaging in real-time of all the sensor values collected (such as 1440 data points per day (one per minute) in one embodiment) over however many days the glucose sensor has been worn (for example, 3, 5, 7, 14, 30, 60, 90, or more days). In an embodiment, a real-time glucose average may be calculated from glucose as contained within interstitial fluid as collected from subcutaneous tissue.
- the real-time glucose average valuemay be a similar number to the A1C, and as such the user may correlate the real-time glucose average value to his/her A1C value.
- the A1C valuemay serve as a starting point and the combination of the real-time glucose average and the next A1C value may provide a benchmark for an individual to manage his/her glucose values.
- the real-time glucose average valuemay be recalculated from the current time backward (for whatever defined period is desired and every time the user uses that feature) to arrive at a shifting real-time average.
- a glucose averagemay be calculated from a plurality of glucose values, and the values may, in an embodiment, be weighted. In an embodiment, the most recently measured glucose value may be weighted more heavily than a more distant glucose value.
- the real-time glucose averagemay be reported as a metric that correlates to an A1C value and as such calculates and provides an average of all the data points per day over the number of days the person with diabetes wears the device.
- an A1C valuemay be derived from a real-time glucose average, and, in an embodiment, a real-time glucose average may be derived from an A1C value.
- a devicemay have the ability to receive and/or obtain both an A1C value and a real-time glucose average (both, for example, over the same or similar time period).
- the derivation calculationsmay be used to perform a “cross-check” of the values and to verify the validity of the measurements.
- a devicemay be provided with at least two integrated ports, one for obtaining an A1C value and one for obtaining a real-time glucose value, for example using a standard test strip.
- a devicemay allow for the physical entry of data indicative of the A1C value and/or the current glucose value having been measured using a separate device.
- a glucose averageis unrelated to the glycation of hemoglobin or any other protein. For this reason, it is a better (more true) measure of average glycemia. It is also likely to be a better indicator of long term risk of diabetes complications, since it is not perturbed by vagaries of protein glycation.
- one or more metricsmay be utilized to form a “toolbox” for the management and control of an individual's glucose levels.
- such metricsmay include (1) A1C, discrete blood glucose test strip values, continuous glucose monitor values, including a discrete continuous glucose monitor snap-shot in time of a single glucose value from the continuous glucose monitor, 2) a graphical representation of glucose values over time, 3) a glucose control index value, and 4) a real-time average which is a real-time average over the duration the individual has worn a continuous glucose monitoring device (for example, a 7 day average, or a 90 day average, etc.), or a subset of such a duration.
- a display of various metrics mentioned abovemay be provided, for example showing the person's excursions next to an average, next to the percentage the individual was in the various normoglycemia, hypoglycemia and hyperglycemia regions, next to a discrete glucose value with an arrow showing the slope up or down (or some other graphical representation of the trends).
- Embodiments of the present inventionmay be utilized with a variety of known and later developed glucose sensors or monitors.
- the glucose sensormay be a small diameter wire-based device that may be inserted under the skin for 3-7 days.
- a suitable sensormay be provided in a device that is fully implantable under the skin and that may remain inserted for 3-12 months.
- the biosensor(s)may be coupled in various ways to implantable or on-skin electrical components and/or external monitoring units that are capable of performing various calculations and analysis and display of data.
- the various metrics described hereinmay be displayed on the screen of an electronic monitoring unit that may be, for example, worn on the belt or waistband, or in a table-top unit, to which data may be sent by a wired or wireless connection.
- the displaymay provide textual or numeric readouts and/or may show a simple graphical representation of the data.
- the various metrics described hereinmay be displayed on the patient's personal computer or other computing device, and/or may be displayed on reports prepared by or sent to a health professional, and/or may be displayed on the health professional's computer.
- various types of alarms or notificationsmay be used to indicate the current condition, especially a condition of concern, such as an audible (alarm or electronic voice prompt), visual (for example colored or flashing lights or a symbol on the display), and/or vibratory notification.
- a notificationmay provide an indication of the degree of risk or the condition of concern.
- a notificationmay also provide an indication or suggestion of an action to be taken as a result of the condition of concern. For example, if it is determined that there is a moderate risk of hypoglycemia developing in the tested individual, or if the data indicates a troubling hypoglycemia trend, the sensing system may provide a suggestion to eat a snack in the next 30-60 minutes.
- these suggestionsmay be customized based on the specific medication, exercise, and dietary parameters of an individual.
- an extreme condition of hyperglycemiathere may be provided a notification to contact a health care professional to address the situation.
- a condition of concernmay be communicated further to a medical professional as desired or as programmed into the system, whether communicated manually or automatically.
- an exemplary electronic monitoring unit 402provides various notification and display features.
- a graphical representation 404 of a glucose control indexmay be provided.
- a textual description 406 of the trendmay be provided.
- a descriptionmay be provided of the relative direction/levels indicated by the data.
- a glucose control index of 20/50/30hyperglycemia/normoglycemia/hypoglycemia
- Other suitable descriptorsmay be utilized as desired.
- various audible or visual displays of various degrees of concernmay be provided, such as a meter 408 , or other lights, flashing or colored (such as a series of green, yellow, and red lights).
- electronic monitoring unit 402may provide an indication of an action to be taken based on the condition or degree of concern using various recommendation buttons or lights 410 , providing exemplary recommendation options of an injection, a snack (symbolized by an apple), or exercise.
- An additional recommendation buttonmay, in an embodiment, provide an indication to contact a medical professional.
- FIGS. 5A , 5 B, and 5 Cillustrate exemplary displays for an electronic monitoring unit in accordance with an embodiment of the present invention.
- FIG. 5Aillustrates a current glucose value 502 is being displayed in mg/dl as per the selected type of display 504 shown highlighted.
- Current glucose value 502is also shown with a direction arrow 506 indicating the current glucose trend for the individual.
- the displayincludes a signal meter 508 , a battery power meter 510 , and a current date/time indication 512 .
- FIG. 5Bshows the change in the display when the selection of the type of display is shifted to type 514 (shown highlighted).
- Display type 514provides a graphical representation 516 of the historical glucose values over a defined period of time.
- Display type 5Cshows the change in the display when the selection of the type of display is shifted to type 524 (shown highlighted).
- Display type 524provides a combination graphical and textual representation 518 of a glucose control index, as well as an indication of the relevant time period for which the values were measured.
- FIG. 5Cillustrates that different metrics may be combined in a single display, as a real time glucose average 526 is also provided.
Landscapes
- Health & Medical Sciences (AREA)
- Life Sciences & Earth Sciences (AREA)
- Physics & Mathematics (AREA)
- Surgery (AREA)
- General Health & Medical Sciences (AREA)
- Engineering & Computer Science (AREA)
- Biomedical Technology (AREA)
- Heart & Thoracic Surgery (AREA)
- Medical Informatics (AREA)
- Molecular Biology (AREA)
- Biophysics (AREA)
- Animal Behavior & Ethology (AREA)
- Pathology (AREA)
- Public Health (AREA)
- Veterinary Medicine (AREA)
- Emergency Medicine (AREA)
- Optics & Photonics (AREA)
- Measurement Of The Respiration, Hearing Ability, Form, And Blood Characteristics Of Living Organisms (AREA)
- Investigating Or Analysing Biological Materials (AREA)
- Automatic Analysis And Handling Materials Therefor (AREA)
Abstract
Description
| TIME | Glucose Control Index | |
| 0601-1200 | 12/87/1 | |
| 1201-1800 | 10/86/4 | |
| 1801-2400 | 10/86/4 | |
| 0001-0600 | 8/85/7 | |
| OVERALL: | 10/86/4 | |
Claims (18)
Priority Applications (5)
| Application Number | Priority Date | Filing Date | Title |
|---|---|---|---|
| US11/689,745US8079955B2 (en) | 2006-11-28 | 2007-03-22 | Method and apparatus for managing glucose control |
| JP2009539439AJP2010510866A (en) | 2006-11-28 | 2007-11-27 | Method and apparatus for managing glucose control |
| CA002670414ACA2670414A1 (en) | 2006-11-28 | 2007-11-27 | Method and apparatus for managing glucose control |
| EP07868857.9AEP2087356A4 (en) | 2006-11-28 | 2007-11-27 | Method and apparatus for managing glucose control |
| PCT/US2007/085605WO2008067291A2 (en) | 2006-11-28 | 2007-11-27 | Method and apparatus for managing glucose control |
Applications Claiming Priority (2)
| Application Number | Priority Date | Filing Date | Title |
|---|---|---|---|
| US86750706P | 2006-11-28 | 2006-11-28 | |
| US11/689,745US8079955B2 (en) | 2006-11-28 | 2007-03-22 | Method and apparatus for managing glucose control |
Publications (2)
| Publication Number | Publication Date |
|---|---|
| US20080125636A1 US20080125636A1 (en) | 2008-05-29 |
| US8079955B2true US8079955B2 (en) | 2011-12-20 |
Family
ID=39464546
Family Applications (1)
| Application Number | Title | Priority Date | Filing Date |
|---|---|---|---|
| US11/689,745Active2030-08-23US8079955B2 (en) | 2006-11-28 | 2007-03-22 | Method and apparatus for managing glucose control |
Country Status (5)
| Country | Link |
|---|---|
| US (1) | US8079955B2 (en) |
| EP (1) | EP2087356A4 (en) |
| JP (1) | JP2010510866A (en) |
| CA (1) | CA2670414A1 (en) |
| WO (1) | WO2008067291A2 (en) |
Cited By (3)
| Publication number | Priority date | Publication date | Assignee | Title |
|---|---|---|---|---|
| US10583249B2 (en) | 2016-02-05 | 2020-03-10 | Lifescan Ip Holdings, Llc | Visualization and analysis tool for drug delivery system |
| US20230352126A1 (en)* | 2008-05-30 | 2023-11-02 | Abbott Diabetes Care Inc. | Method and apparatus for providing glycemic control |
| US12023180B1 (en)* | 2020-03-25 | 2024-07-02 | Miller Ip Law, Llc | Device and system user interfaces for chronic health condition management |
Families Citing this family (47)
| Publication number | Priority date | Publication date | Assignee | Title |
|---|---|---|---|---|
| EP1810185A4 (en) | 2004-06-04 | 2010-01-06 | Therasense Inc | Diabetes care host-client architecture and data management system |
| US8029441B2 (en) | 2006-02-28 | 2011-10-04 | Abbott Diabetes Care Inc. | Analyte sensor transmitter unit configuration for a data monitoring and management system |
| US9788771B2 (en) | 2006-10-23 | 2017-10-17 | Abbott Diabetes Care Inc. | Variable speed sensor insertion devices and methods of use |
| US7736310B2 (en) | 2006-01-30 | 2010-06-15 | Abbott Diabetes Care Inc. | On-body medical device securement |
| US8160900B2 (en) | 2007-06-29 | 2012-04-17 | Abbott Diabetes Care Inc. | Analyte monitoring and management device and method to analyze the frequency of user interaction with the device |
| EP2252196A4 (en) | 2008-02-21 | 2013-05-15 | Dexcom Inc | Systems and methods for processing, transmitting and displaying sensor data |
| WO2009146445A1 (en)* | 2008-05-30 | 2009-12-03 | Abbott Diabetes Care Inc. | Method and system for providing glycemic control |
| US8591410B2 (en)* | 2008-05-30 | 2013-11-26 | Abbott Diabetes Care Inc. | Method and apparatus for providing glycemic control |
| EP3984454A1 (en)* | 2008-06-06 | 2022-04-20 | Intuity Medical, Inc. | Medical diagnostic devices and methods |
| US8876755B2 (en) | 2008-07-14 | 2014-11-04 | Abbott Diabetes Care Inc. | Closed loop control system interface and methods |
| US9918635B2 (en) | 2008-12-23 | 2018-03-20 | Roche Diabetes Care, Inc. | Systems and methods for optimizing insulin dosage |
| US10456036B2 (en) | 2008-12-23 | 2019-10-29 | Roche Diabetes Care, Inc. | Structured tailoring |
| US8849458B2 (en)* | 2008-12-23 | 2014-09-30 | Roche Diagnostics Operations, Inc. | Collection device with selective display of test results, method and computer program product thereof |
| US10437962B2 (en) | 2008-12-23 | 2019-10-08 | Roche Diabetes Care Inc | Status reporting of a structured collection procedure |
| US20120011125A1 (en) | 2008-12-23 | 2012-01-12 | Roche Diagnostics Operations, Inc. | Management method and system for implementation, execution, data collection, and data analysis of a structured collection procedure which runs on a collection device |
| US9117015B2 (en) | 2008-12-23 | 2015-08-25 | Roche Diagnostics Operations, Inc. | Management method and system for implementation, execution, data collection, and data analysis of a structured collection procedure which runs on a collection device |
| CA2747309C (en)* | 2008-12-23 | 2023-09-26 | F. Hoffmann-La Roche Ag | Structured testing method for diagnostic or therapy support of a patient with a chronic disease and devices thereof |
| US20100168539A1 (en)* | 2008-12-31 | 2010-07-01 | Palerm Cesar C | Method and/or system for estimating glycation of hemoglobin |
| US9446194B2 (en)* | 2009-03-27 | 2016-09-20 | Dexcom, Inc. | Methods and systems for promoting glucose management |
| EP2425209A4 (en) | 2009-04-29 | 2013-01-09 | Abbott Diabetes Care Inc | METHOD AND SYSTEM FOR PROVIDING REAL-TIME ANALYTE SENSOR CALIBRATION WITH RETROSPECTIVE FILLING |
| US20110196213A1 (en)* | 2009-06-26 | 2011-08-11 | Roche Diagnostics Operations, Inc. | Display For Biological Values |
| RU2012103000A (en)* | 2009-06-30 | 2013-08-10 | Лайфскен, Инк. | METHOD AND SYSTEM FOR ANALYTES TESTING |
| EP2455875A3 (en)* | 2009-06-30 | 2013-01-16 | Lifescan Scotland Limited | System and method for diabetes management |
| EP3973855A1 (en)* | 2009-06-30 | 2022-03-30 | Lifescan, Inc. | Analyte testing methods and device for calculating basal insulin therapy |
| EP2644088B1 (en)* | 2009-09-29 | 2017-01-18 | Lifescan Scotland Limited | Analyte testing method and device for diabetes management |
| WO2011041531A1 (en) | 2009-09-30 | 2011-04-07 | Abbott Diabetes Care Inc. | Interconnect for on-body analyte monitoring device |
| WO2011084208A1 (en)* | 2009-12-21 | 2011-07-14 | Stc.Unm | System and methods for estimating hba1c, treatment response, and hypoglycemia risk using self-monitoring of blood glucose data |
| BR112012021572A2 (en)* | 2010-02-25 | 2016-10-25 | Lifescan Scotland Ltd | analyte testing method and system with notification of high and low blood glucose trends. |
| US8532933B2 (en) | 2010-06-18 | 2013-09-10 | Roche Diagnostics Operations, Inc. | Insulin optimization systems and testing methods with adjusted exit criterion accounting for system noise associated with biomarkers |
| US20120173151A1 (en) | 2010-12-29 | 2012-07-05 | Roche Diagnostics Operations, Inc. | Methods of assessing diabetes treatment protocols based on protocol complexity levels and patient proficiency levels |
| PL2486851T3 (en)* | 2011-01-31 | 2024-02-19 | F. Hoffmann-La Roche Ag | Display for biological values |
| US10136845B2 (en) | 2011-02-28 | 2018-11-27 | Abbott Diabetes Care Inc. | Devices, systems, and methods associated with analyte monitoring devices and devices incorporating the same |
| US8755938B2 (en) | 2011-05-13 | 2014-06-17 | Roche Diagnostics Operations, Inc. | Systems and methods for handling unacceptable values in structured collection protocols |
| US8766803B2 (en) | 2011-05-13 | 2014-07-01 | Roche Diagnostics Operations, Inc. | Dynamic data collection |
| CA2848737A1 (en)* | 2011-09-15 | 2013-03-21 | The Trustees Of Columbia University In The City Of New York | Measurement of a fluorescent analyte using tissue excitation |
| US9317656B2 (en) | 2011-11-23 | 2016-04-19 | Abbott Diabetes Care Inc. | Compatibility mechanisms for devices in a continuous analyte monitoring system and methods thereof |
| US9351670B2 (en)* | 2012-12-31 | 2016-05-31 | Abbott Diabetes Care Inc. | Glycemic risk determination based on variability of glucose levels |
| US10383580B2 (en) | 2012-12-31 | 2019-08-20 | Abbott Diabetes Care Inc. | Analysis of glucose median, variability, and hypoglycemia risk for therapy guidance |
| US12419547B2 (en) | 2016-04-08 | 2025-09-23 | Medtronic Minimed, Inc. | Sensor and transmitter product |
| US10765369B2 (en) | 2016-04-08 | 2020-09-08 | Medtronic Minimed, Inc. | Analyte sensor |
| WO2018031803A1 (en)* | 2016-08-12 | 2018-02-15 | Dexcom, Inc. | Systems and methods for health data visualization and user support tools for continuous glucose monitoring |
| US11071478B2 (en) | 2017-01-23 | 2021-07-27 | Abbott Diabetes Care Inc. | Systems, devices and methods for analyte sensor insertion |
| JP6773602B2 (en)* | 2017-05-09 | 2020-10-21 | サニーヘルス株式会社 | Diet support system |
| WO2019094908A1 (en)* | 2017-11-13 | 2019-05-16 | Senseonics, Incorporated | Analyte monitoring system and method for determining system usage |
| CN112040841A (en)* | 2018-04-18 | 2020-12-04 | 赞思健康科技有限公司 | Metabolism monitoring system |
| AU2021236742B2 (en)* | 2020-03-20 | 2024-11-14 | WellDoc, Inc. | Systems and methods for analyzing, interpreting, and acting on continuous glucose monitoring data |
| CA3188510A1 (en) | 2020-08-31 | 2022-03-03 | Vivek S. RAO | Systems, devices, and methods for analyte sensor insertion |
Citations (11)
| Publication number | Priority date | Publication date | Assignee | Title |
|---|---|---|---|---|
| US5822715A (en) | 1997-01-10 | 1998-10-13 | Health Hero Network | Diabetes management system and method for controlling blood glucose |
| US6175752B1 (en) | 1998-04-30 | 2001-01-16 | Therasense, Inc. | Analyte monitoring device and methods of use |
| US6233471B1 (en) | 1998-05-13 | 2001-05-15 | Cygnus, Inc. | Signal processing for measurement of physiological analysis |
| US6294062B1 (en)* | 1998-06-01 | 2001-09-25 | Roche Diagnostics Corporation | Method and device for electrochemical immunoassay of multiple analytes |
| US20030060765A1 (en)* | 2000-02-16 | 2003-03-27 | Arthur Campbell | Infusion device menu structure and method of using the same |
| US6572542B1 (en) | 2000-03-03 | 2003-06-03 | Medtronic, Inc. | System and method for monitoring and controlling the glycemic state of a patient |
| US6585644B2 (en)* | 2000-01-21 | 2003-07-01 | Medtronic Minimed, Inc. | Ambulatory medical apparatus and method using a telemetry system with predefined reception listening periods |
| US20050059895A1 (en)* | 1995-06-07 | 2005-03-17 | Brown Stephen J. | System and methods for monitoring a patient's heart condition |
| US7022072B2 (en)* | 2001-12-27 | 2006-04-04 | Medtronic Minimed, Inc. | System for monitoring physiological characteristics |
| US20060094947A1 (en) | 2000-03-29 | 2006-05-04 | Kovatchev Boris P | Method, system, and computer program product for the evaluation of glycemic control in diabetes from self-monitoring data |
| US20080133146A1 (en) | 2004-12-17 | 2008-06-05 | Chang Kc Shu Kun | Device Having a Trend-Indicating Display |
Family Cites Families (1)
| Publication number | Priority date | Publication date | Assignee | Title |
|---|---|---|---|---|
| JP2000060803A (en)* | 1998-08-21 | 2000-02-29 | Terumo Corp | Blood sugar level information processing system |
- 2007
- 2007-03-22USUS11/689,745patent/US8079955B2/enactiveActive
- 2007-11-27WOPCT/US2007/085605patent/WO2008067291A2/enactiveApplication Filing
- 2007-11-27CACA002670414Apatent/CA2670414A1/ennot_activeAbandoned
- 2007-11-27EPEP07868857.9Apatent/EP2087356A4/ennot_activeWithdrawn
- 2007-11-27JPJP2009539439Apatent/JP2010510866A/enactivePending
Patent Citations (11)
| Publication number | Priority date | Publication date | Assignee | Title |
|---|---|---|---|---|
| US20050059895A1 (en)* | 1995-06-07 | 2005-03-17 | Brown Stephen J. | System and methods for monitoring a patient's heart condition |
| US5822715A (en) | 1997-01-10 | 1998-10-13 | Health Hero Network | Diabetes management system and method for controlling blood glucose |
| US6175752B1 (en) | 1998-04-30 | 2001-01-16 | Therasense, Inc. | Analyte monitoring device and methods of use |
| US6233471B1 (en) | 1998-05-13 | 2001-05-15 | Cygnus, Inc. | Signal processing for measurement of physiological analysis |
| US6294062B1 (en)* | 1998-06-01 | 2001-09-25 | Roche Diagnostics Corporation | Method and device for electrochemical immunoassay of multiple analytes |
| US6585644B2 (en)* | 2000-01-21 | 2003-07-01 | Medtronic Minimed, Inc. | Ambulatory medical apparatus and method using a telemetry system with predefined reception listening periods |
| US20030060765A1 (en)* | 2000-02-16 | 2003-03-27 | Arthur Campbell | Infusion device menu structure and method of using the same |
| US6572542B1 (en) | 2000-03-03 | 2003-06-03 | Medtronic, Inc. | System and method for monitoring and controlling the glycemic state of a patient |
| US20060094947A1 (en) | 2000-03-29 | 2006-05-04 | Kovatchev Boris P | Method, system, and computer program product for the evaluation of glycemic control in diabetes from self-monitoring data |
| US7022072B2 (en)* | 2001-12-27 | 2006-04-04 | Medtronic Minimed, Inc. | System for monitoring physiological characteristics |
| US20080133146A1 (en) | 2004-12-17 | 2008-06-05 | Chang Kc Shu Kun | Device Having a Trend-Indicating Display |
Cited By (4)
| Publication number | Priority date | Publication date | Assignee | Title |
|---|---|---|---|---|
| US20230352126A1 (en)* | 2008-05-30 | 2023-11-02 | Abbott Diabetes Care Inc. | Method and apparatus for providing glycemic control |
| US12165751B2 (en)* | 2008-05-30 | 2024-12-10 | Abbott Diabetes Care Inc. | Method and apparatus for providing glycemic control |
| US10583249B2 (en) | 2016-02-05 | 2020-03-10 | Lifescan Ip Holdings, Llc | Visualization and analysis tool for drug delivery system |
| US12023180B1 (en)* | 2020-03-25 | 2024-07-02 | Miller Ip Law, Llc | Device and system user interfaces for chronic health condition management |
Also Published As
| Publication number | Publication date |
|---|---|
| US20080125636A1 (en) | 2008-05-29 |
| JP2010510866A (en) | 2010-04-08 |
| EP2087356A4 (en) | 2013-09-25 |
| EP2087356A2 (en) | 2009-08-12 |
| WO2008067291A3 (en) | 2008-07-24 |
| WO2008067291A2 (en) | 2008-06-05 |
| CA2670414A1 (en) | 2008-06-05 |
Similar Documents
| Publication | Publication Date | Title |
|---|---|---|
| US8079955B2 (en) | Method and apparatus for managing glucose control | |
| EP2677931B1 (en) | Device and method for determining blood glucose characteristics | |
| US20080287755A1 (en) | Method and apparatus for trend alert calculation and display | |
| RU2749187C2 (en) | Computer-implemented method and portable apparatus for analysis of glucose control data indicating glucose level in bodily fluid | |
| EP1913383B1 (en) | Meter having multi-level user interface | |
| EP1845465B1 (en) | Diabetes management methods and systems | |
| US20050096511A1 (en) | System for monitoring physiological characteristics | |
| US20040142403A1 (en) | Method of screening for disorders of glucose metabolism | |
| US20150190100A1 (en) | System for monitoring physiological characteristics | |
| JP2023517017A (en) | How to Calculate Calibration Sensitivity for Internal Sensors | |
| US20080114215A1 (en) | Shape recognition of hypoglycemia and hyperglycemia | |
| Keren et al. | Limited reproducibility of 24-h ambulatory blood pressure monitoring | |
| US20150073754A1 (en) | Method and system for calculating indices for diabetes control | |
| KR102326690B1 (en) | Blood glucose management method using non-invasive device | |
| Unick et al. | Validity of ratings of perceived exertion in patients with type 2 diabetes | |
| CN117918832A (en) | Real-time blood glucose hexagonal model and propeller model evaluation algorithm based on subcutaneous glucose continuous monitoring data acquisition | |
| KR102418340B1 (en) | Apparatus for predicting rimpaired glucose metabolism using the blood glucose change pattern of standard foods method thereof | |
| KR102418341B1 (en) | Apparatus for managing glucose using continuous blood glucose data and method thereof | |
| Öztop et al. | DETERMINING THE IMPORTANCE OF GLYCEMIC VARIABILITY IN GESTATIONAL DIABETES MELLITUS USING VARIOUS TECHNIQUES | |
| CN109215784B (en) | Method for analyzing physiological parameter values | |
| HK1186368B (en) | Device and method for determining blood glucose characteristics | |
| CN117398066A (en) | Health data fluctuation monitoring method based on normal distribution variance | |
| HK1144366B (en) | Method and apparatus for trend alert calculation and display | |
| HK1120305A (en) | Meter having multi-level user interface |
Legal Events
| Date | Code | Title | Description |
|---|---|---|---|
| AS | Assignment | Owner name:ISENSE CORPORATION, OREGON Free format text:ASSIGNMENT OF ASSIGNORS INTEREST;ASSIGNORS:WARD, W. KENNETH;SASS, RICHARD;BRUCE, ROBERT;REEL/FRAME:019051/0256;SIGNING DATES FROM 20070321 TO 20070322 Owner name:ISENSE CORPORATION, OREGON Free format text:ASSIGNMENT OF ASSIGNORS INTEREST;ASSIGNORS:WARD, W. KENNETH;SASS, RICHARD;BRUCE, ROBERT;SIGNING DATES FROM 20070321 TO 20070322;REEL/FRAME:019051/0256 | |
| STCF | Information on status: patent grant | Free format text:PATENTED CASE | |
| AS | Assignment | Owner name:BAYER HEALTHCARE, LLC, NEW YORK Free format text:ASSIGNMENT OF ASSIGNORS INTEREST;ASSIGNOR:ISENSE CORPORATION;REEL/FRAME:034515/0626 Effective date:20131106 Owner name:ISENSE ACQUISITION, LLC, OREGON Free format text:ASSIGNMENT OF ASSIGNORS INTEREST;ASSIGNOR:BAYER HEALTHCARE, LLC;REEL/FRAME:034517/0785 Effective date:20131112 | |
| REMI | Maintenance fee reminder mailed | ||
| FPAY | Fee payment | Year of fee payment:4 | |
| SULP | Surcharge for late payment | ||
| AS | Assignment | Owner name:AGAMATRIX, INC., NEW HAMPSHIRE Free format text:ASSIGNMENT OF ASSIGNORS INTEREST;ASSIGNOR:ISENSE ACQUISITION, LLC;REEL/FRAME:037996/0401 Effective date:20160113 | |
| AS | Assignment | Owner name:WAVEFORM TECHNOLOGIES, INC., NEW HAMPSHIRE Free format text:ASSIGNMENT OF ASSIGNORS INTEREST;ASSIGNOR:AGAMATRIX, INC.;REEL/FRAME:041394/0955 Effective date:20170113 | |
| AS | Assignment | Owner name:MIDCAP FINANCIAL TRUST, AS AGENT, MARYLAND Free format text:SECURITY INTEREST;ASSIGNOR:WAVEFORM TECHNOLOGIES, INC.;REEL/FRAME:041517/0950 Effective date:20170125 | |
| MAFP | Maintenance fee payment | Free format text:PAYMENT OF MAINTENANCE FEE, 8TH YEAR, LARGE ENTITY (ORIGINAL EVENT CODE: M1552); ENTITY STATUS OF PATENT OWNER: LARGE ENTITY Year of fee payment:8 | |
| FEPP | Fee payment procedure | Free format text:MAINTENANCE FEE REMINDER MAILED (ORIGINAL EVENT CODE: REM.); ENTITY STATUS OF PATENT OWNER: LARGE ENTITY | |
| FEPP | Fee payment procedure | Free format text:11.5 YR SURCHARGE- LATE PMT W/IN 6 MO, LARGE ENTITY (ORIGINAL EVENT CODE: M1556); ENTITY STATUS OF PATENT OWNER: LARGE ENTITY | |
| MAFP | Maintenance fee payment | Free format text:PAYMENT OF MAINTENANCE FEE, 12TH YEAR, LARGE ENTITY (ORIGINAL EVENT CODE: M1553); ENTITY STATUS OF PATENT OWNER: LARGE ENTITY Year of fee payment:12 | |
| AS | Assignment | Owner name:KONAMITE LIMITED, IRELAND Free format text:ASSIGNMENT OF ASSIGNORS INTEREST;ASSIGNORS:WAVEFORM TECHNOLOGIES, INC.;WAVEFORM HOLDINGS, LLC;REEL/FRAME:067073/0813 Effective date:20240130 | |
| AS | Assignment | Owner name:PERCEPTIVE CREDIT HOLDINGS III, LP, NEW YORK Free format text:SECURITY AGREEMENT;ASSIGNOR:KONAMITE LIMITED;REEL/FRAME:068422/0473 Effective date:20240717 |