US8046385B2 - Data quality tracking - Google Patents
Data quality trackingDownload PDFInfo
- Publication number
- US8046385B2 US8046385B2US12/143,362US14336208AUS8046385B2US 8046385 B2US8046385 B2US 8046385B2US 14336208 AUS14336208 AUS 14336208AUS 8046385 B2US8046385 B2US 8046385B2
- Authority
- US
- United States
- Prior art keywords
- metric
- child nodes
- parent node
- data
- metric values
- Prior art date
- Legal status (The legal status is an assumption and is not a legal conclusion. Google has not performed a legal analysis and makes no representation as to the accuracy of the status listed.)
- Active, expires
Links
Images


Classifications
- G—PHYSICS
- G06—COMPUTING OR CALCULATING; COUNTING
- G06F—ELECTRIC DIGITAL DATA PROCESSING
- G06F16/00—Information retrieval; Database structures therefor; File system structures therefor
- G06F16/20—Information retrieval; Database structures therefor; File system structures therefor of structured data, e.g. relational data
- G06F16/21—Design, administration or maintenance of databases
- G06F16/215—Improving data quality; Data cleansing, e.g. de-duplication, removing invalid entries or correcting typographical errors
- G—PHYSICS
- G06—COMPUTING OR CALCULATING; COUNTING
- G06F—ELECTRIC DIGITAL DATA PROCESSING
- G06F16/00—Information retrieval; Database structures therefor; File system structures therefor
- G06F16/90—Details of database functions independent of the retrieved data types
- G06F16/901—Indexing; Data structures therefor; Storage structures
- G06F16/9024—Graphs; Linked lists
Definitions
- This descriptionrelates to data quality tracking.
- the one or more child nodes used in determining the metric value for the parent nodehave no child nodes.
- Profiling informationis generated that represents characteristics of data represented by the child and parent nodes.
- the metric values for the child nodesare based on the profiling information.
- the arrangement of the hierarchyis specified by a user.
- a userspecifies which data fields within the profiling information will affect the determination of the metric values.
- a userselects one or more previously-constructed factors to affect the determination of the metric values.
- the metric values and the metric valueare represented as a number from 0 to 100.
- a computer-readable mediumstores executable instructions for use in obtaining a value from a device signal, the instructions for causing a computer to determine metric values for one or more child nodes.
- a metric valueis determined for a parent node based on the metric values of at least some of the child nodes, wherein relationships between one or more parent nodes and one or more child nodes define a hierarchy. The determination of the metric value is repeated for the parent node for multiple instances.
- FIG. 5is a flowchart that shows a process for generating a value representative of profiling information.
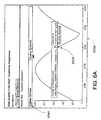
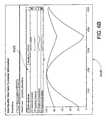
- FIG. 6Ais a chart based on metric values vs. time.
- Data sources 112in general include a variety of individual data sources, each of which may have unique storage formats and interfaces (for example, database tables, spreadsheet files, flat text files, or a native format used by a mainframe).
- the individual data sourcesmay be local to the system, for example, being hosted on the same computer system, or may be remote to the system, for example, being hosted on a remote computer that is accessed over a local or wide area data network.
- Object data store 102can be used to store initial information about a data set in data sources 112 to be profiled, as well as information obtained about such a data set. Field profiles derived from that data set by the profiling process may also be stored in object data store 102 .
- the system 100includes a profiler engine 104 , which reads data from the object data store 102 .
- the profiler engine 104When first reading data from data sources 112 , the profiler engine 104 typically starts with some initial format information about records in that data source. (Note that in some circumstances, even the record structure of the data source may not be known).
- This information about records of a data sourceis specified in a data manipulation language (DML) file that is stored in object data store 102 .
- DMLdata manipulation language
- the profiler engine 104reads records from a data source, it computes statistics and other descriptive information that reflect the contents of the data set. The profiler engine 104 then writes those statistics and descriptive information in the form of a “profile” into the object data store 102 which can then be examined through the user interface 106 or any other module with access to the object data store 102 .
- the statistics in the profileinclude a histogram of values in each field, maximum, minimum, and mean values, and samples of the least common and most common values, for example.
- the object data store 102is able to store validation information associated with each profiled field, for example as a validation specification that encodes the validation information.
- the validation informationcan be stored in an external storage location and retrieved by the profiler engine 104 .
- the validation informationmay specify a valid data type for each field. For example, if a field is a person's “title”, a default valid value may be any value that is a “string” data type. A user may also supply valid values such as “Mr.”, “Mrs.” and “Dr.” prior to profiling the data source so that any other value read by the profiler engine 104 would be identified as invalid.
- Information obtained from a profiling runcan also be used by a user to specify valid values for a particular field. For example, the user may find that after profiling a data set the values “Ms.” and “Msr.” appear as common values. The user may add “Ms.” as a valid value, and map the value “Msr.” to the value “Mrs.” as a data cleaning option.
- the validation informationcan include valid values and mapping information to permit cleaning of invalid values by mapping them onto valid values.
- the profiling of a data sourcemay be undertaken in an iterative manner as more information about the data source is discovered through successive profiling runs.
- the profiler engine 104can also generate executable code to implement other modules that can access the profiled data systems.
- An example of such codemight map a value “Msr.” to “Mrs.” as part of the access procedure to the data source.
- the profiler engine 104uses the object data store 102 to organize and store various metadata and profiling preferences and results in data objects.
- the object data store 102may store a group of profile setup objects, each for information related to a profiling job, a group of data set objects, each for information related to a data set, and a group of DML files, each describing a particular data format.
- a profile setup objectcontains preferences for a profiling run executed by the profiler engine 104 .
- a user 110can enter information used to create a new profile setup object or select a pre-stored profile setup object.
- the profile setup objectcontains a reference to a data set object.
- a data set setup objectcontains a data set locator which enables the profiler engine 104 to locate data to be profiled on one or more data systems accessible within the runtime environment.
- the data set locatoris typically a path/filename, URL, table name, SQL select statement, or a list of path/filenames and/or URLs for a data set spread over multiple locations.
- the data set objectcan optionally contain a reference to one or more DML files.
- the data set objectcontains a reference to a set of field objects. There is one field object for each field within the records of the data set to be profiled.
- a data set profileis associated with the data set object corresponding to the data set that was profiled.
- the data set profilecontains statistics that relate to the data set, such as total number of records and total number of valid/invalid records, as well as the time and data at which the data set was profiled, and versions of validation objects used in profiling.
- a field objectcan optionally contain validation information that can be used by the profiler engine 104 to determine valid values for the corresponding field, and specify rules for cleaning invalid values (i.e., mapping invalid values onto valid values).
- the field objectis also associated with a field profile, stored by the profiler engine upon completion of a profiling run, which contains statistics that relate to the corresponding field, such as numbers of distinct values, null values, and valid/invalid values.
- the field profilecan also include sample values such as maximum, minimum, most common, and least common values.
- a complete “profile”includes the data set profile and field profiles for all of the profiled fields.
- Other user preferences for a profiler runcan be collected and stored in the profile setup object, or in the data set object.
- the usercan select a filter expression which can be used to limit the fields or number of values profiled, including profiling a random sample of the values (e.g., 1%).
- This quality testcould be applied to a value in a series of data sets that is known to occur consistently (within 10%).
- the procedure 200determines 210 the results of the quality test, and uses a data quality metric (also called a “data quality measure”) to generate a data quality metric value that represents the quality of the tested data.
- the procedurecan then repeat by identifying 202 another data set or the same data set at a different time.
- the procedure 200can be applied to data objects whose metric values are related according to a hierarchy, as described in more detail below.
- the systemcalculates a single value (e.g., in the range of 0-100) that indicates some measure of data quality.
- the calculation of the data quality metricis based on a function that is applied to the field profile for the data object.
- data quality metricscan be viewed and arranged by a user 110 ( FIG. 1 ) through a user interface 106 ( FIG. 1 ).
- data elementscan be added and deleted through a special interface, as well as “dragged and dropped” from one location in the hierarchy to another.
- the arrangement of a hierarchymay correspond to any hierarchical structure, such as the hierarchy of responsibility within an organization.
- Data quality historieswhich track data quality metric values over time, as described in more detail below, can be calculated based on stored historical data quality metric values for a given data object (or based on stored historical profiling information from which data quality metric values can be calculated).
- the calculation of data quality histories given a hierarchy of nodes and their associated metricscan be performed as views and reports are requested; on demand or a combination of the two.
- hierarchiesmay be used in the calculation of data quality metrics. For instance, to calculate a data quality metric value (or “metric value”) for a parent node, a procedure 500 determines 502 metric values for one or more child nodes. The hierarchy contains at least one child node and at least one parent node. The process 500 determines 504 a metric value for a parent node based on the metric values of at least some of the child nodes. The relationships between the parent nodes and the child nodes define a hierarchy. This hierarchy may resemble the example of FIG. 4 , and may be customizable by a user. In some examples, the hierarchy may be determined before any data quality metrics are calculated; that is, step 504 may precede step 502 in some implementations. The process 500 repeats 506 determining the metric value for the parent node for multiple instances.
- FIG. 6AAn example of a chart plotting a data quality metric value vs. time is shown in FIG. 6A .
- the chart 600 Ashows the time series of computed metric values for the metric “Customer Happiness.” If a user moves a cursor over a point 602 A in the chart 600 A, the date and computed quality value are displayed for that point. Points at which the validation specification changed from its previous value are marked by dark points on the chart, and moving a cursor over those will show the change in the validation specification. Points on the chart may also show instances where the metric values for the child nodes used in the calculation have changed; that is, when different child node metric values are used in the determination, the chart would identify the point at which the change occurred.
- the chartcan also identify points at which other elements of the metric value computation have changed, such as the definition of the metric used to compute the values.
- a colored dot 604 Asummarizing the latest data quality as “good,” “needs attention,” or “bad” (green, yellow, or red respectively).
- a summary reportincludes a rule for summarizing multiple data quality metric values as a single value, such as the method described above relating to hierarchies.
- Example rulesinclude “maximum”, “minimum” and “average”.
- a summary reporttherefore can also be used to produce a data quality history with values that are, for example, the average of those for all of the data quality metrics contained within the report.
- Field profile resultsdepend in part on Validation Specifications which can be changed over time. Therefore each metric value is also annotated with the version of the validation spec that applied to the corresponding field profile.
- the softwaremay be provided on a medium or device readable by a general or special purpose programmable computer or delivered (encoded in a propagated signal) over a network to the computer where it is executed. All of the functions may be performed on a special purpose computer, or using special-purpose hardware, such as coprocessors.
- the softwaremay be implemented in a distributed manner in which different parts of the computation specified by the software are performed by different computers. Each such computer program is preferably stored on or downloaded to a storage media or device (e.g., solid state memory or media, or magnetic or optical media) readable by a general or special purpose programmable computer, for configuring and operating the computer when the storage media or device is read by the computer system to perform the procedures described herein.
- the inventive systemmay also be considered to be implemented as a computer-readable storage medium, configured with a computer program, where the storage medium so configured causes a computer system to operate in a specific and predefined manner to perform the functions described herein.
Landscapes
- Engineering & Computer Science (AREA)
- Theoretical Computer Science (AREA)
- Databases & Information Systems (AREA)
- General Physics & Mathematics (AREA)
- Physics & Mathematics (AREA)
- General Engineering & Computer Science (AREA)
- Data Mining & Analysis (AREA)
- Software Systems (AREA)
- Quality & Reliability (AREA)
- Stored Programmes (AREA)
- Information Retrieval, Db Structures And Fs Structures Therefor (AREA)
- Debugging And Monitoring (AREA)
- Computer And Data Communications (AREA)
Abstract
Description
Claims (25)
Priority Applications (8)
| Application Number | Priority Date | Filing Date | Title |
|---|---|---|---|
| US12/143,362US8046385B2 (en) | 2008-06-20 | 2008-06-20 | Data quality tracking |
| EP09767701AEP2291764A4 (en) | 2008-06-20 | 2009-06-18 | TRACKING DATA QUALITY BY DETERMINING METRIC VALUES FOR CHILD NODES AND A PARENT NODE |
| JP2011514796AJP5535203B2 (en) | 2008-06-20 | 2009-06-18 | Data quality tracking by identifying metric values for child nodes and parent nodes |
| PCT/US2009/047735WO2009155392A1 (en) | 2008-06-20 | 2009-06-18 | Data quality tracking by determining metric values for child nodes and a parent node |
| KR1020107028563AKR101513110B1 (en) | 2008-06-20 | 2009-06-18 | Data quality tracking by determining metric values for child nodes and a parent node |
| CN200980123317.1ACN102067106B (en) | 2008-06-20 | 2009-06-18 | Data quality tracking by determining metric values for child nodes and a parent node |
| CA2728132ACA2728132C (en) | 2008-06-20 | 2009-06-18 | Data quality tracking by determining metric values for child nodes and a parent node |
| AU2009260050AAU2009260050C1 (en) | 2008-06-20 | 2009-06-18 | Data quality tracking by determining metric values for child nodes and a parent node |
Applications Claiming Priority (1)
| Application Number | Priority Date | Filing Date | Title |
|---|---|---|---|
| US12/143,362US8046385B2 (en) | 2008-06-20 | 2008-06-20 | Data quality tracking |
Publications (2)
| Publication Number | Publication Date |
|---|---|
| US20090319566A1 US20090319566A1 (en) | 2009-12-24 |
| US8046385B2true US8046385B2 (en) | 2011-10-25 |
Family
ID=41432336
Family Applications (1)
| Application Number | Title | Priority Date | Filing Date |
|---|---|---|---|
| US12/143,362Active2029-09-21US8046385B2 (en) | 2008-06-20 | 2008-06-20 | Data quality tracking |
Country Status (8)
| Country | Link |
|---|---|
| US (1) | US8046385B2 (en) |
| EP (1) | EP2291764A4 (en) |
| JP (1) | JP5535203B2 (en) |
| KR (1) | KR101513110B1 (en) |
| CN (1) | CN102067106B (en) |
| AU (1) | AU2009260050C1 (en) |
| CA (1) | CA2728132C (en) |
| WO (1) | WO2009155392A1 (en) |
Cited By (8)
| Publication number | Priority date | Publication date | Assignee | Title |
|---|---|---|---|---|
| WO2014160813A1 (en)* | 2013-03-26 | 2014-10-02 | Staples, Inc. | On-site and in-store content personalization and optimization |
| US9542462B1 (en)* | 2012-06-14 | 2017-01-10 | Google Inc. | Scaling high-level statistical languages to large, distributed datasets |
| US9558230B2 (en) | 2013-02-12 | 2017-01-31 | International Business Machines Corporation | Data quality assessment |
| US9576036B2 (en) | 2013-03-15 | 2017-02-21 | International Business Machines Corporation | Self-analyzing data processing job to determine data quality issues |
| US9613322B2 (en) | 2013-04-02 | 2017-04-04 | Orbis Technologies, Inc. | Data center analytics and dashboard |
| US10147040B2 (en) | 2017-01-20 | 2018-12-04 | Alchemy IoT | Device data quality evaluator |
| US10860635B2 (en) | 2008-12-02 | 2020-12-08 | Ab Initio Technology Llc | Visualizing relationships between data elements |
| US11461671B2 (en) | 2019-06-03 | 2022-10-04 | Bank Of America Corporation | Data quality tool |
Families Citing this family (82)
| Publication number | Priority date | Publication date | Assignee | Title |
|---|---|---|---|---|
| US10693415B2 (en) | 2007-12-05 | 2020-06-23 | Solaredge Technologies Ltd. | Testing of a photovoltaic panel |
| US11881814B2 (en) | 2005-12-05 | 2024-01-23 | Solaredge Technologies Ltd. | Testing of a photovoltaic panel |
| US8618692B2 (en) | 2007-12-04 | 2013-12-31 | Solaredge Technologies Ltd. | Distributed power system using direct current power sources |
| US11855231B2 (en) | 2006-12-06 | 2023-12-26 | Solaredge Technologies Ltd. | Distributed power harvesting systems using DC power sources |
| US8319483B2 (en) | 2007-08-06 | 2012-11-27 | Solaredge Technologies Ltd. | Digital average input current control in power converter |
| US9130401B2 (en) | 2006-12-06 | 2015-09-08 | Solaredge Technologies Ltd. | Distributed power harvesting systems using DC power sources |
| US11888387B2 (en) | 2006-12-06 | 2024-01-30 | Solaredge Technologies Ltd. | Safety mechanisms, wake up and shutdown methods in distributed power installations |
| US11296650B2 (en) | 2006-12-06 | 2022-04-05 | Solaredge Technologies Ltd. | System and method for protection during inverter shutdown in distributed power installations |
| US12316274B2 (en) | 2006-12-06 | 2025-05-27 | Solaredge Technologies Ltd. | Pairing of components in a direct current distributed power generation system |
| US11687112B2 (en) | 2006-12-06 | 2023-06-27 | Solaredge Technologies Ltd. | Distributed power harvesting systems using DC power sources |
| US9112379B2 (en) | 2006-12-06 | 2015-08-18 | Solaredge Technologies Ltd. | Pairing of components in a direct current distributed power generation system |
| US8963369B2 (en) | 2007-12-04 | 2015-02-24 | Solaredge Technologies Ltd. | Distributed power harvesting systems using DC power sources |
| US8947194B2 (en) | 2009-05-26 | 2015-02-03 | Solaredge Technologies Ltd. | Theft detection and prevention in a power generation system |
| US11309832B2 (en) | 2006-12-06 | 2022-04-19 | Solaredge Technologies Ltd. | Distributed power harvesting systems using DC power sources |
| US8384243B2 (en) | 2007-12-04 | 2013-02-26 | Solaredge Technologies Ltd. | Distributed power harvesting systems using DC power sources |
| US8319471B2 (en) | 2006-12-06 | 2012-11-27 | Solaredge, Ltd. | Battery power delivery module |
| US11569659B2 (en) | 2006-12-06 | 2023-01-31 | Solaredge Technologies Ltd. | Distributed power harvesting systems using DC power sources |
| US9088178B2 (en) | 2006-12-06 | 2015-07-21 | Solaredge Technologies Ltd | Distributed power harvesting systems using DC power sources |
| US8816535B2 (en) | 2007-10-10 | 2014-08-26 | Solaredge Technologies, Ltd. | System and method for protection during inverter shutdown in distributed power installations |
| US8013472B2 (en) | 2006-12-06 | 2011-09-06 | Solaredge, Ltd. | Method for distributed power harvesting using DC power sources |
| US8473250B2 (en) | 2006-12-06 | 2013-06-25 | Solaredge, Ltd. | Monitoring of distributed power harvesting systems using DC power sources |
| US11735910B2 (en) | 2006-12-06 | 2023-08-22 | Solaredge Technologies Ltd. | Distributed power system using direct current power sources |
| US9291696B2 (en) | 2007-12-05 | 2016-03-22 | Solaredge Technologies Ltd. | Photovoltaic system power tracking method |
| CN105244905B (en) | 2007-12-05 | 2019-05-21 | 太阳能安吉有限公司 | Release mechanism in distributed power device is waken up and method for closing |
| WO2009072076A2 (en) | 2007-12-05 | 2009-06-11 | Solaredge Technologies Ltd. | Current sensing on a mosfet |
| WO2009073867A1 (en) | 2007-12-05 | 2009-06-11 | Solaredge, Ltd. | Parallel connected inverters |
| US11264947B2 (en) | 2007-12-05 | 2022-03-01 | Solaredge Technologies Ltd. | Testing of a photovoltaic panel |
| US8111052B2 (en) | 2008-03-24 | 2012-02-07 | Solaredge Technologies Ltd. | Zero voltage switching |
| EP2294669B8 (en) | 2008-05-05 | 2016-12-07 | Solaredge Technologies Ltd. | Direct current power combiner |
| US12418177B2 (en) | 2009-10-24 | 2025-09-16 | Solaredge Technologies Ltd. | Distributed power system using direct current power sources |
| US10230310B2 (en) | 2016-04-05 | 2019-03-12 | Solaredge Technologies Ltd | Safety switch for photovoltaic systems |
| GB2485527B (en) | 2010-11-09 | 2012-12-19 | Solaredge Technologies Ltd | Arc detection and prevention in a power generation system |
| US10673222B2 (en) | 2010-11-09 | 2020-06-02 | Solaredge Technologies Ltd. | Arc detection and prevention in a power generation system |
| US10673229B2 (en) | 2010-11-09 | 2020-06-02 | Solaredge Technologies Ltd. | Arc detection and prevention in a power generation system |
| GB2486408A (en) | 2010-12-09 | 2012-06-20 | Solaredge Technologies Ltd | Disconnection of a string carrying direct current |
| GB2483317B (en) | 2011-01-12 | 2012-08-22 | Solaredge Technologies Ltd | Serially connected inverters |
| US8570005B2 (en) | 2011-09-12 | 2013-10-29 | Solaredge Technologies Ltd. | Direct current link circuit |
| GB2498365A (en) | 2012-01-11 | 2013-07-17 | Solaredge Technologies Ltd | Photovoltaic module |
| US9853565B2 (en) | 2012-01-30 | 2017-12-26 | Solaredge Technologies Ltd. | Maximized power in a photovoltaic distributed power system |
| GB2498790A (en) | 2012-01-30 | 2013-07-31 | Solaredge Technologies Ltd | Maximising power in a photovoltaic distributed power system |
| GB2498791A (en) | 2012-01-30 | 2013-07-31 | Solaredge Technologies Ltd | Photovoltaic panel circuitry |
| GB2499991A (en) | 2012-03-05 | 2013-09-11 | Solaredge Technologies Ltd | DC link circuit for photovoltaic array |
| US10115841B2 (en) | 2012-06-04 | 2018-10-30 | Solaredge Technologies Ltd. | Integrated photovoltaic panel circuitry |
| US9548619B2 (en) | 2013-03-14 | 2017-01-17 | Solaredge Technologies Ltd. | Method and apparatus for storing and depleting energy |
| US9941813B2 (en) | 2013-03-14 | 2018-04-10 | Solaredge Technologies Ltd. | High frequency multi-level inverter |
| EP3506370B1 (en) | 2013-03-15 | 2023-12-20 | Solaredge Technologies Ltd. | Bypass mechanism |
| US9318974B2 (en) | 2014-03-26 | 2016-04-19 | Solaredge Technologies Ltd. | Multi-level inverter with flying capacitor topology |
| US10459892B2 (en) | 2014-04-23 | 2019-10-29 | Qumulo, Inc. | Filesystem hierarchical aggregate metrics |
| US9600504B2 (en) | 2014-09-08 | 2017-03-21 | International Business Machines Corporation | Data quality analysis and cleansing of source data with respect to a target system |
| US11132336B2 (en)* | 2015-01-12 | 2021-09-28 | Qumulo, Inc. | Filesystem hierarchical capacity quantity and aggregate metrics |
| US9836480B2 (en) | 2015-01-12 | 2017-12-05 | Qumulo, Inc. | Filesystem capacity and performance metrics and visualizations |
| US11177663B2 (en) | 2016-04-05 | 2021-11-16 | Solaredge Technologies Ltd. | Chain of power devices |
| US11018623B2 (en) | 2016-04-05 | 2021-05-25 | Solaredge Technologies Ltd. | Safety switch for photovoltaic systems |
| US12057807B2 (en) | 2016-04-05 | 2024-08-06 | Solaredge Technologies Ltd. | Chain of power devices |
| US10095729B2 (en) | 2016-12-09 | 2018-10-09 | Qumulo, Inc. | Managing storage quotas in a shared storage system |
| US10318401B2 (en) | 2017-04-20 | 2019-06-11 | Qumulo, Inc. | Triggering the increased collection and distribution of monitoring information in a distributed processing system |
| US11360936B2 (en) | 2018-06-08 | 2022-06-14 | Qumulo, Inc. | Managing per object snapshot coverage in filesystems |
| US10534758B1 (en) | 2018-12-20 | 2020-01-14 | Qumulo, Inc. | File system cache tiers |
| US11151092B2 (en) | 2019-01-30 | 2021-10-19 | Qumulo, Inc. | Data replication in distributed file systems |
| US10860372B1 (en) | 2020-01-24 | 2020-12-08 | Qumulo, Inc. | Managing throughput fairness and quality of service in file systems |
| US10795796B1 (en) | 2020-01-24 | 2020-10-06 | Qumulo, Inc. | Predictive performance analysis for file systems |
| US11151001B2 (en) | 2020-01-28 | 2021-10-19 | Qumulo, Inc. | Recovery checkpoints for distributed file systems |
| US10936538B1 (en) | 2020-03-30 | 2021-03-02 | Qumulo, Inc. | Fair sampling of alternate data stream metrics for file systems |
| US10936551B1 (en) | 2020-03-30 | 2021-03-02 | Qumulo, Inc. | Aggregating alternate data stream metrics for file systems |
| US11775481B2 (en) | 2020-09-30 | 2023-10-03 | Qumulo, Inc. | User interfaces for managing distributed file systems |
| US11157458B1 (en) | 2021-01-28 | 2021-10-26 | Qumulo, Inc. | Replicating files in distributed file systems using object-based data storage |
| US11461241B2 (en) | 2021-03-03 | 2022-10-04 | Qumulo, Inc. | Storage tier management for file systems |
| US11132126B1 (en) | 2021-03-16 | 2021-09-28 | Qumulo, Inc. | Backup services for distributed file systems in cloud computing environments |
| US11567660B2 (en) | 2021-03-16 | 2023-01-31 | Qumulo, Inc. | Managing cloud storage for distributed file systems |
| US11669255B2 (en) | 2021-06-30 | 2023-06-06 | Qumulo, Inc. | Distributed resource caching by reallocation of storage caching using tokens and agents with non-depleted cache allocations |
| US11294604B1 (en) | 2021-10-22 | 2022-04-05 | Qumulo, Inc. | Serverless disk drives based on cloud storage |
| US11354273B1 (en) | 2021-11-18 | 2022-06-07 | Qumulo, Inc. | Managing usable storage space in distributed file systems |
| US11599508B1 (en) | 2022-01-31 | 2023-03-07 | Qumulo, Inc. | Integrating distributed file systems with object stores |
| US12346290B2 (en) | 2022-07-13 | 2025-07-01 | Qumulo, Inc. | Workload allocation for file system maintenance |
| US11722150B1 (en) | 2022-09-28 | 2023-08-08 | Qumulo, Inc. | Error resistant write-ahead log |
| US11729269B1 (en) | 2022-10-26 | 2023-08-15 | Qumulo, Inc. | Bandwidth management in distributed file systems |
| US11966592B1 (en) | 2022-11-29 | 2024-04-23 | Qumulo, Inc. | In-place erasure code transcoding for distributed file systems |
| US12292853B1 (en) | 2023-11-06 | 2025-05-06 | Qumulo, Inc. | Object-based storage with garbage collection and data consolidation |
| US11921677B1 (en) | 2023-11-07 | 2024-03-05 | Qumulo, Inc. | Sharing namespaces across file system clusters |
| US11934660B1 (en) | 2023-11-07 | 2024-03-19 | Qumulo, Inc. | Tiered data storage with ephemeral and persistent tiers |
| CN118964340A (en)* | 2024-07-18 | 2024-11-15 | 中国移动通信集团设计院有限公司 | A network resource data quality assessment method, device, medium and product |
| US12222903B1 (en) | 2024-08-09 | 2025-02-11 | Qumulo, Inc. | Global namespaces for distributed file systems |
Citations (12)
| Publication number | Priority date | Publication date | Assignee | Title |
|---|---|---|---|---|
| US6725227B1 (en) | 1998-10-02 | 2004-04-20 | Nec Corporation | Advanced web bookmark database system |
| US20040181554A1 (en)* | 1998-06-25 | 2004-09-16 | Heckerman David E. | Apparatus and accompanying methods for visualizing clusters of data and hierarchical cluster classifications |
| US20050246352A1 (en) | 2004-04-30 | 2005-11-03 | Microsoft Corporation | Property tree for metadata navigation and assignment |
| US20060106847A1 (en) | 2004-05-04 | 2006-05-18 | Boston Consulting Group, Inc. | Method and apparatus for selecting, analyzing, and visualizing related database records as a network |
| US20060218159A1 (en) | 2005-03-24 | 2006-09-28 | Microsoft Corporation | Method and system for user alteration of the configuration of a data warehouse |
| US20070033220A1 (en) | 2003-04-22 | 2007-02-08 | Microsoft Corporation | Relationship view |
| US20070112875A1 (en)* | 2004-07-15 | 2007-05-17 | Hitachi, Ltd. | Method and apparatus for hierarchical storage management based on data value and user interest |
| US20070150496A1 (en) | 2004-02-18 | 2007-06-28 | Feinsmith Jason B | Machine-implemented activity management system using asynchronously shared activity data objects and journal data items |
| US20070255741A1 (en) | 2006-04-28 | 2007-11-01 | Business Objects, S.A. | Apparatus and method for merging metadata within a repository |
| US20080163124A1 (en) | 2006-12-29 | 2008-07-03 | Sap Ag | Graphical user interface system and method for presenting objects |
| US20080172629A1 (en) | 2007-01-17 | 2008-07-17 | Microsoft Corporation | Geometric Performance Metric Data Rendering |
| US7456840B2 (en) | 2004-08-31 | 2008-11-25 | Oracle International Corporation | Displaying information using nodes in a graph |
Family Cites Families (4)
| Publication number | Priority date | Publication date | Assignee | Title |
|---|---|---|---|---|
| JPH11307412A (en)* | 1998-04-20 | 1999-11-05 | Matsushita Electron Corp | Semiconductor manufacture data processing method |
| JP2002288403A (en)* | 2001-03-27 | 2002-10-04 | Ntt Comware Corp | Project management system, project management method, and project management program |
| EP1258814A1 (en)* | 2001-05-17 | 2002-11-20 | Requisite Technology Inc. | Method and apparatus for analyzing the quality of the content of a database |
| CA2655731C (en)* | 2003-09-15 | 2012-04-10 | Ab Initio Software Corporation | Functional dependency data profiling |
- 2008
- 2008-06-20USUS12/143,362patent/US8046385B2/enactiveActive
- 2009
- 2009-06-18JPJP2011514796Apatent/JP5535203B2/enactiveActive
- 2009-06-18KRKR1020107028563Apatent/KR101513110B1/enactiveActive
- 2009-06-18CNCN200980123317.1Apatent/CN102067106B/enactiveActive
- 2009-06-18WOPCT/US2009/047735patent/WO2009155392A1/enactiveApplication Filing
- 2009-06-18EPEP09767701Apatent/EP2291764A4/ennot_activeCeased
- 2009-06-18AUAU2009260050Apatent/AU2009260050C1/enactiveActive
- 2009-06-18CACA2728132Apatent/CA2728132C/enactiveActive
Patent Citations (12)
| Publication number | Priority date | Publication date | Assignee | Title |
|---|---|---|---|---|
| US20040181554A1 (en)* | 1998-06-25 | 2004-09-16 | Heckerman David E. | Apparatus and accompanying methods for visualizing clusters of data and hierarchical cluster classifications |
| US6725227B1 (en) | 1998-10-02 | 2004-04-20 | Nec Corporation | Advanced web bookmark database system |
| US20070033220A1 (en) | 2003-04-22 | 2007-02-08 | Microsoft Corporation | Relationship view |
| US20070150496A1 (en) | 2004-02-18 | 2007-06-28 | Feinsmith Jason B | Machine-implemented activity management system using asynchronously shared activity data objects and journal data items |
| US20050246352A1 (en) | 2004-04-30 | 2005-11-03 | Microsoft Corporation | Property tree for metadata navigation and assignment |
| US20060106847A1 (en) | 2004-05-04 | 2006-05-18 | Boston Consulting Group, Inc. | Method and apparatus for selecting, analyzing, and visualizing related database records as a network |
| US20070112875A1 (en)* | 2004-07-15 | 2007-05-17 | Hitachi, Ltd. | Method and apparatus for hierarchical storage management based on data value and user interest |
| US7456840B2 (en) | 2004-08-31 | 2008-11-25 | Oracle International Corporation | Displaying information using nodes in a graph |
| US20060218159A1 (en) | 2005-03-24 | 2006-09-28 | Microsoft Corporation | Method and system for user alteration of the configuration of a data warehouse |
| US20070255741A1 (en) | 2006-04-28 | 2007-11-01 | Business Objects, S.A. | Apparatus and method for merging metadata within a repository |
| US20080163124A1 (en) | 2006-12-29 | 2008-07-03 | Sap Ag | Graphical user interface system and method for presenting objects |
| US20080172629A1 (en) | 2007-01-17 | 2008-07-17 | Microsoft Corporation | Geometric Performance Metric Data Rendering |
Non-Patent Citations (3)
| Title |
|---|
| International Search Report & Written Opinion issued in PCT application No. PCT/US09/66390, dated Jan. 20, 2010, 7 pages. |
| International Search Report & Written Opinion issued in PCT application No. PCT/US09/66394, dated Jan. 20, 2010, 6 pages. |
| Notification of Transmittal of the International Search Report and the Written Opinion of the International Searching Authority, or the Declaration, for Application No. PCT/US09/47735, dated Jul. 23, 2009, 6 pages. |
Cited By (14)
| Publication number | Priority date | Publication date | Assignee | Title |
|---|---|---|---|---|
| US11354346B2 (en) | 2008-12-02 | 2022-06-07 | Ab Initio Technology Llc | Visualizing relationships between data elements and graphical representations of data element attributes |
| US10860635B2 (en) | 2008-12-02 | 2020-12-08 | Ab Initio Technology Llc | Visualizing relationships between data elements |
| US10203936B1 (en) | 2012-06-14 | 2019-02-12 | Google Llc | Scaling high-level statistical languages to large, distributed datasets |
| US11861331B1 (en) | 2012-06-14 | 2024-01-02 | Google Llc | Scaling high-level statistical languages to large, distributed datasets |
| US9542462B1 (en)* | 2012-06-14 | 2017-01-10 | Google Inc. | Scaling high-level statistical languages to large, distributed datasets |
| US9558230B2 (en) | 2013-02-12 | 2017-01-31 | International Business Machines Corporation | Data quality assessment |
| US9594797B2 (en) | 2013-02-12 | 2017-03-14 | International Business Machines Corporation | Data quality assessment |
| US9576037B2 (en) | 2013-03-15 | 2017-02-21 | International Business Machines Corporation | Self-analyzing data processing job to determine data quality issues |
| US9576036B2 (en) | 2013-03-15 | 2017-02-21 | International Business Machines Corporation | Self-analyzing data processing job to determine data quality issues |
| WO2014160813A1 (en)* | 2013-03-26 | 2014-10-02 | Staples, Inc. | On-site and in-store content personalization and optimization |
| US20140297363A1 (en)* | 2013-03-26 | 2014-10-02 | Staples, Inc. | On-Site and In-Store Content Personalization and Optimization |
| US9613322B2 (en) | 2013-04-02 | 2017-04-04 | Orbis Technologies, Inc. | Data center analytics and dashboard |
| US10147040B2 (en) | 2017-01-20 | 2018-12-04 | Alchemy IoT | Device data quality evaluator |
| US11461671B2 (en) | 2019-06-03 | 2022-10-04 | Bank Of America Corporation | Data quality tool |
Also Published As
| Publication number | Publication date |
|---|---|
| CN102067106B (en) | 2015-03-04 |
| JP2011525282A (en) | 2011-09-15 |
| CA2728132A1 (en) | 2009-12-23 |
| KR20110031921A (en) | 2011-03-29 |
| CA2728132C (en) | 2017-02-21 |
| CN102067106A (en) | 2011-05-18 |
| AU2009260050A1 (en) | 2009-12-23 |
| EP2291764A1 (en) | 2011-03-09 |
| EP2291764A4 (en) | 2012-10-31 |
| JP5535203B2 (en) | 2014-07-02 |
| AU2009260050B2 (en) | 2013-07-04 |
| WO2009155392A1 (en) | 2009-12-23 |
| US20090319566A1 (en) | 2009-12-24 |
| AU2009260050C1 (en) | 2014-03-06 |
| KR101513110B1 (en) | 2015-04-17 |
Similar Documents
| Publication | Publication Date | Title |
|---|---|---|
| US8046385B2 (en) | Data quality tracking | |
| KR101889120B1 (en) | Generating data pattern information | |
| AU2014233672B2 (en) | System for metadata management | |
| JP2011503681A (en) | Method and system for analysis of systems for matching data records | |
| WO2007127956A2 (en) | Apparatus and method for merging metadata within a repository | |
| US11947567B2 (en) | System and method for computing and managing datasets using hierarchical analytics | |
| US12229171B2 (en) | Intelligent annotation of entity-relationship data models | |
| CN115994718A (en) | General training evaluation system | |
| US20200012643A1 (en) | Method for managing and executing decoders and transformations using linked data and a service layer | |
| CA3210343A1 (en) | Dataset multiplexer for data processing system | |
| EP2019362A2 (en) | Spatial data validation systems | |
| JP2017532652A (en) | Managing calculations for hierarchical entities | |
| CN114780443A (en) | Micro-service application automatic test method and device, electronic equipment and storage medium | |
| US20250181652A1 (en) | Dataset multiplexer with dataset resolver for data processing system | |
| Völker et al. | Measuring Complexity of Bot Models | |
| CN117312774A (en) | Intelligent aggregation visualization and management and control system for big data | |
| CN118093733A (en) | Data query processing method and device based on Cube and computer equipment | |
| CN117015769A (en) | Data set multiplexer for data processing system | |
| HK40009607A (en) | System for metadata management | |
| Euler et al. | The MiningMart User Guide | |
| Watson | Formal languages for expressing data consistency rules and implications for reporting of quality metadata | |
| Sileika | Statistics Gathering and Reporting | |
| Carvajal-Rodríguez | QInfoMating Manual v. 1.2. 2 |
Legal Events
| Date | Code | Title | Description |
|---|---|---|---|
| AS | Assignment | Owner name:AB INITIO SOFTWARE CORPORATION, MASSACHUSETTS Free format text:ASSIGNMENT OF ASSIGNORS INTEREST;ASSIGNORS:WALD, DAVID;WAKELING, TIM;KHAN, MUHAMMAD ARSHAD;REEL/FRAME:021657/0341 Effective date:20080822 | |
| AS | Assignment | Owner name:AB INITIO SOFTWARE LLC, MASSACHUSETTS Free format text:CHANGE OF NAME;ASSIGNOR:AB INITIO SOFTWARE CORPORATION;REEL/FRAME:022288/0828 Effective date:20080716 Owner name:AB INITIO SOFTWARE LLC,MASSACHUSETTS Free format text:CHANGE OF NAME;ASSIGNOR:AB INITIO SOFTWARE CORPORATION;REEL/FRAME:022288/0828 Effective date:20080716 | |
| AS | Assignment | Owner name:AB INITIO TECHNOLOGY LLC,MASSACHUSETTS Free format text:ASSIGNMENT OF ASSIGNORS INTEREST;ASSIGNOR:AB INITIO ORIGINAL WORKS LLC;REEL/FRAME:024548/0950 Effective date:20100511 Owner name:AB INITIO ORIGINAL WORKS LLC,MASSACHUSETTS Free format text:ASSIGNMENT OF ASSIGNORS INTEREST;ASSIGNOR:AB INITIO SOFTWARE LLC;REEL/FRAME:024549/0099 Effective date:20100511 Owner name:AB INITIO TECHNOLOGY LLC, MASSACHUSETTS Free format text:ASSIGNMENT OF ASSIGNORS INTEREST;ASSIGNOR:AB INITIO ORIGINAL WORKS LLC;REEL/FRAME:024548/0950 Effective date:20100511 Owner name:AB INITIO ORIGINAL WORKS LLC, MASSACHUSETTS Free format text:ASSIGNMENT OF ASSIGNORS INTEREST;ASSIGNOR:AB INITIO SOFTWARE LLC;REEL/FRAME:024549/0099 Effective date:20100511 | |
| STCF | Information on status: patent grant | Free format text:PATENTED CASE | |
| FEPP | Fee payment procedure | Free format text:PAT HOLDER NO LONGER CLAIMS SMALL ENTITY STATUS, ENTITY STATUS SET TO UNDISCOUNTED (ORIGINAL EVENT CODE: STOL); ENTITY STATUS OF PATENT OWNER: LARGE ENTITY | |
| FEPP | Fee payment procedure | Free format text:PAYOR NUMBER ASSIGNED (ORIGINAL EVENT CODE: ASPN); ENTITY STATUS OF PATENT OWNER: LARGE ENTITY | |
| FPAY | Fee payment | Year of fee payment:4 | |
| MAFP | Maintenance fee payment | Free format text:PAYMENT OF MAINTENANCE FEE, 8TH YEAR, LARGE ENTITY (ORIGINAL EVENT CODE: M1552); ENTITY STATUS OF PATENT OWNER: LARGE ENTITY Year of fee payment:8 | |
| MAFP | Maintenance fee payment | Free format text:PAYMENT OF MAINTENANCE FEE, 12TH YEAR, LARGE ENTITY (ORIGINAL EVENT CODE: M1553); ENTITY STATUS OF PATENT OWNER: LARGE ENTITY Year of fee payment:12 |