US8005314B2 - Extended depth of field imaging for high speed object analysis - Google Patents
Extended depth of field imaging for high speed object analysisDownload PDFInfo
- Publication number
- US8005314B2 US8005314B2US11/609,269US60926906AUS8005314B2US 8005314 B2US8005314 B2US 8005314B2US 60926906 AUS60926906 AUS 60926906AUS 8005314 B2US8005314 B2US 8005314B2
- Authority
- US
- United States
- Prior art keywords
- light
- image
- imaging
- optical
- wave front
- Prior art date
- Legal status (The legal status is an assumption and is not a legal conclusion. Google has not performed a legal analysis and makes no representation as to the accuracy of the status listed.)
- Active, expires
Links
- 238000003384imaging methodMethods0.000titleclaimsabstractdescription276
- 238000004458analytical methodMethods0.000titledescription29
- 230000003287optical effectEffects0.000claimsabstractdescription177
- 238000012545processingMethods0.000claimsabstractdescription43
- 238000000034methodMethods0.000claimsdescription154
- 230000004075alterationEffects0.000claimsdescription45
- 230000033001locomotionEffects0.000claimsdescription11
- 230000010354integrationEffects0.000claimsdescription10
- 238000004519manufacturing processMethods0.000claimsdescription7
- 239000012530fluidSubstances0.000claimsdescription4
- 210000004027cellAnatomy0.000description159
- 239000000523sampleSubstances0.000description52
- 239000011324beadSubstances0.000description23
- 230000008569processEffects0.000description21
- 230000000694effectsEffects0.000description18
- 230000001413cellular effectEffects0.000description17
- 230000011218segmentationEffects0.000description15
- 210000000349chromosomeAnatomy0.000description14
- 238000001514detection methodMethods0.000description14
- 239000011521glassSubstances0.000description14
- 230000006870functionEffects0.000description13
- 230000001965increasing effectEffects0.000description13
- 208000030454monosomyDiseases0.000description13
- 230000035945sensitivityEffects0.000description13
- 230000000670limiting effectEffects0.000description11
- 229920013655poly(bisphenol-A sulfone)Polymers0.000description11
- 230000003595spectral effectEffects0.000description11
- 230000008901benefitEffects0.000description9
- 238000004422calculation algorithmMethods0.000description9
- 238000004624confocal microscopyMethods0.000description9
- 238000004088simulationMethods0.000description8
- 230000009871nonspecific bindingEffects0.000description7
- 210000004940nucleusAnatomy0.000description7
- 238000012360testing methodMethods0.000description7
- OKKJLVBELUTLKV-UHFFFAOYSA-NMethanolChemical compoundOCOKKJLVBELUTLKV-UHFFFAOYSA-N0.000description6
- 230000008859changeEffects0.000description6
- 230000008045co-localizationEffects0.000description6
- 238000012937correctionMethods0.000description6
- 238000000684flow cytometryMethods0.000description6
- 230000006872improvementEffects0.000description6
- 201000009310astigmatismDiseases0.000description5
- 239000002131composite materialSubstances0.000description5
- 238000012805post-processingMethods0.000description5
- 206010010071ComaDiseases0.000description4
- 230000009286beneficial effectEffects0.000description4
- 238000004061bleachingMethods0.000description4
- 210000003850cellular structureAnatomy0.000description4
- 238000000354decomposition reactionMethods0.000description4
- 230000003247decreasing effectEffects0.000description4
- 238000010586diagramMethods0.000description4
- 238000011156evaluationMethods0.000description4
- 230000002068genetic effectEffects0.000description4
- 238000009396hybridizationMethods0.000description4
- 238000005259measurementMethods0.000description4
- 238000012986modificationMethods0.000description4
- 230000004048modificationEffects0.000description4
- 238000005457optimizationMethods0.000description4
- 239000002245particleSubstances0.000description4
- 238000005070samplingMethods0.000description4
- 239000000725suspensionSubstances0.000description4
- 238000012546transferMethods0.000description4
- QTBSBXVTEAMEQO-UHFFFAOYSA-NAcetic acidChemical compoundCC(O)=OQTBSBXVTEAMEQO-UHFFFAOYSA-N0.000description3
- 108020004414DNAProteins0.000description3
- 238000013459approachMethods0.000description3
- 230000006399behaviorEffects0.000description3
- 230000015556catabolic processEffects0.000description3
- 238000006731degradation reactionMethods0.000description3
- LOKCTEFSRHRXRJ-UHFFFAOYSA-Idipotassium trisodium dihydrogen phosphate hydrogen phosphate dichlorideChemical compoundP(=O)(O)(O)[O-].[K+].P(=O)(O)([O-])[O-].[Na+].[Na+].[Cl-].[K+].[Cl-].[Na+]LOKCTEFSRHRXRJ-UHFFFAOYSA-I0.000description3
- 238000002474experimental methodMethods0.000description3
- 238000002073fluorescence micrographMethods0.000description3
- 238000000799fluorescence microscopyMethods0.000description3
- 230000007246mechanismEffects0.000description3
- 230000000877morphologic effectEffects0.000description3
- 239000002953phosphate buffered salineSubstances0.000description3
- 238000004445quantitative analysisMethods0.000description3
- 238000013139quantizationMethods0.000description3
- 230000002829reductive effectEffects0.000description3
- 238000009877renderingMethods0.000description3
- 238000012552reviewMethods0.000description3
- 239000007787solidSubstances0.000description3
- 230000001360synchronised effectEffects0.000description3
- 238000012800visualizationMethods0.000description3
- NCGICGYLBXGBGN-UHFFFAOYSA-N3-morpholin-4-yl-1-oxa-3-azonia-2-azanidacyclopent-3-en-5-imine;hydrochlorideChemical compoundCl.[N-]1OC(=N)C=[N+]1N1CCOCC1NCGICGYLBXGBGN-UHFFFAOYSA-N0.000description2
- 201000010374Down SyndromeDiseases0.000description2
- 206010025323LymphomasDiseases0.000description2
- 206010028980NeoplasmDiseases0.000description2
- FAPWRFPIFSIZLT-UHFFFAOYSA-MSodium chlorideChemical compound[Na+].[Cl-]FAPWRFPIFSIZLT-UHFFFAOYSA-M0.000description2
- 230000006907apoptotic processEffects0.000description2
- 239000000872bufferSubstances0.000description2
- 201000011510cancerDiseases0.000description2
- 238000005119centrifugationMethods0.000description2
- 238000000701chemical imagingMethods0.000description2
- 238000006243chemical reactionMethods0.000description2
- 230000002759chromosomal effectEffects0.000description2
- 239000006059cover glassSubstances0.000description2
- 238000013461designMethods0.000description2
- 238000011161developmentMethods0.000description2
- 230000018109developmental processEffects0.000description2
- 239000006185dispersionSubstances0.000description2
- 238000006073displacement reactionMethods0.000description2
- 230000008030eliminationEffects0.000description2
- 238000003379elimination reactionMethods0.000description2
- 238000005516engineering processMethods0.000description2
- 239000007850fluorescent dyeSubstances0.000description2
- 239000012634fragmentSubstances0.000description2
- 238000005286illuminationMethods0.000description2
- 238000007901in situ hybridizationMethods0.000description2
- 230000000873masking effectEffects0.000description2
- 239000011159matrix materialSubstances0.000description2
- 230000005055memory storageEffects0.000description2
- 238000000386microscopyMethods0.000description2
- 210000003463organelleAnatomy0.000description2
- 102000004169proteins and genesHuman genes0.000description2
- 108090000623proteins and genesProteins0.000description2
- 239000000243solutionSubstances0.000description2
- 241000894007speciesSpecies0.000description2
- 238000007619statistical methodMethods0.000description2
- 230000005945translocationEffects0.000description2
- 239000003981vehicleSubstances0.000description2
- XLYOFNOQVPJJNP-UHFFFAOYSA-NwaterSubstancesOXLYOFNOQVPJJNP-UHFFFAOYSA-N0.000description2
- FWBHETKCLVMNFS-UHFFFAOYSA-N4',6-Diamino-2-phenylindolChemical compoundC1=CC(C(=N)N)=CC=C1C1=CC2=CC=C(C(N)=N)C=C2N1FWBHETKCLVMNFS-UHFFFAOYSA-N0.000description1
- 102000007469ActinsHuman genes0.000description1
- 108010085238ActinsProteins0.000description1
- 206010006187Breast cancerDiseases0.000description1
- 208000026310Breast neoplasmDiseases0.000description1
- LFQSCWFLJHTTHZ-UHFFFAOYSA-NEthanolChemical compoundCCOLFQSCWFLJHTTHZ-UHFFFAOYSA-N0.000description1
- 108010043121Green Fluorescent ProteinsProteins0.000description1
- 102000029749MicrotubuleHuman genes0.000description1
- 108091022875MicrotubuleProteins0.000description1
- 206010073261Ovarian theca cell tumourDiseases0.000description1
- 229930040373ParaformaldehydeNatural products0.000description1
- 206010057249PhagocytosisDiseases0.000description1
- 210000001744T-lymphocyteAnatomy0.000description1
- 108091023040Transcription factorProteins0.000description1
- 102000040945Transcription factorHuman genes0.000description1
- 206010044688Trisomy 21Diseases0.000description1
- 210000002593Y chromosomeAnatomy0.000description1
- 230000005856abnormalityEffects0.000description1
- 238000010521absorption reactionMethods0.000description1
- 230000009471actionEffects0.000description1
- 230000003321amplificationEffects0.000description1
- 238000012443analytical studyMethods0.000description1
- 210000000612antigen-presenting cellAnatomy0.000description1
- 238000003556assayMethods0.000description1
- 230000002238attenuated effectEffects0.000description1
- 230000005540biological transmissionEffects0.000description1
- 239000000090biomarkerSubstances0.000description1
- 230000015572biosynthetic processEffects0.000description1
- 239000008280bloodSubstances0.000description1
- 210000004369bloodAnatomy0.000description1
- 210000001185bone marrowAnatomy0.000description1
- 238000004364calculation methodMethods0.000description1
- 230000020411cell activationEffects0.000description1
- 230000022131cell cycleEffects0.000description1
- 230000006727cell lossEffects0.000description1
- 210000003855cell nucleusAnatomy0.000description1
- 230000005754cellular signalingEffects0.000description1
- 239000003086colorantSubstances0.000description1
- 230000001010compromised effectEffects0.000description1
- 230000008878couplingEffects0.000description1
- 238000010168coupling processMethods0.000description1
- 238000005859coupling reactionMethods0.000description1
- 238000004163cytometryMethods0.000description1
- 210000000805cytoplasmAnatomy0.000description1
- 230000001086cytosolic effectEffects0.000description1
- 230000007547defectEffects0.000description1
- 230000001419dependent effectEffects0.000description1
- 238000010790dilutionMethods0.000description1
- 239000012895dilutionSubstances0.000description1
- 230000003292diminished effectEffects0.000description1
- NJDNXYGOVLYJHP-UHFFFAOYSA-Ldisodium;2-(3-oxido-6-oxoxanthen-9-yl)benzoateChemical compound[Na+].[Na+].[O-]C(=O)C1=CC=CC=C1C1=C2C=CC(=O)C=C2OC2=CC([O-])=CC=C21NJDNXYGOVLYJHP-UHFFFAOYSA-L0.000description1
- 238000009826distributionMethods0.000description1
- 230000002708enhancing effectEffects0.000description1
- 210000003527eukaryotic cellAnatomy0.000description1
- MHMNJMPURVTYEJ-UHFFFAOYSA-Nfluorescein-5-isothiocyanateChemical compoundO1C(=O)C2=CC(N=C=S)=CC=C2C21C1=CC=C(O)C=C1OC1=CC(O)=CC=C21MHMNJMPURVTYEJ-UHFFFAOYSA-N0.000description1
- 238000002509fluorescent in situ hybridizationMethods0.000description1
- 230000036541healthEffects0.000description1
- 239000008241heterogeneous mixtureSubstances0.000description1
- 238000003703image analysis methodMethods0.000description1
- 238000011065in-situ storageMethods0.000description1
- 238000011534incubationMethods0.000description1
- 238000003780insertionMethods0.000description1
- 230000037431insertionEffects0.000description1
- 208000032839leukemiaDiseases0.000description1
- 230000031700light absorptionEffects0.000description1
- 150000002632lipidsChemical class0.000description1
- 238000002714localization assayMethods0.000description1
- 210000002540macrophageAnatomy0.000description1
- 238000012423maintenanceMethods0.000description1
- 238000013507mappingMethods0.000description1
- 239000003550markerSubstances0.000description1
- 239000012528membraneSubstances0.000description1
- 239000004005microsphereSubstances0.000description1
- 210000004688microtubuleAnatomy0.000description1
- 210000003470mitochondriaAnatomy0.000description1
- 230000011278mitosisEffects0.000description1
- 229940125645monoclonal antibody drugDrugs0.000description1
- 230000006740morphological transformationEffects0.000description1
- 230000005937nuclear translocationEffects0.000description1
- 238000003199nucleic acid amplification methodMethods0.000description1
- 238000004091panningMethods0.000description1
- 229920002866paraformaldehydePolymers0.000description1
- 230000036961partial effectEffects0.000description1
- 239000008188pelletSubstances0.000description1
- 230000008782phagocytosisEffects0.000description1
- 239000003495polar organic solventSubstances0.000description1
- 238000002360preparation methodMethods0.000description1
- 210000001236prokaryotic cellAnatomy0.000description1
- 238000011002quantificationMethods0.000description1
- 238000011160researchMethods0.000description1
- 230000004044responseEffects0.000description1
- 230000000717retained effectEffects0.000description1
- 230000002441reversible effectEffects0.000description1
- 230000000630rising effectEffects0.000description1
- 239000004065semiconductorSubstances0.000description1
- 238000000926separation methodMethods0.000description1
- 230000019491signal transductionEffects0.000description1
- 230000011664signalingEffects0.000description1
- 239000011780sodium chlorideSubstances0.000description1
- 238000004611spectroscopical analysisMethods0.000description1
- 238000001228spectrumMethods0.000description1
- 238000010183spectrum analysisMethods0.000description1
- 230000007480spreadingEffects0.000description1
- 238000003892spreadingMethods0.000description1
- 210000000130stem cellAnatomy0.000description1
- 238000003860storageMethods0.000description1
- 239000000758substrateSubstances0.000description1
- 238000004114suspension cultureMethods0.000description1
- 230000002194synthesizing effectEffects0.000description1
- 208000001644thecomaDiseases0.000description1
- 239000012780transparent materialSubstances0.000description1
- 238000010200validation analysisMethods0.000description1
- 238000001429visible spectrumMethods0.000description1
- 230000016776visual perceptionEffects0.000description1
Images


Classifications
- G—PHYSICS
- G02—OPTICS
- G02B—OPTICAL ELEMENTS, SYSTEMS OR APPARATUS
- G02B27/00—Optical systems or apparatus not provided for by any of the groups G02B1/00 - G02B26/00, G02B30/00
- G02B27/0075—Optical systems or apparatus not provided for by any of the groups G02B1/00 - G02B26/00, G02B30/00 with means for altering, e.g. increasing, the depth of field or depth of focus
- G—PHYSICS
- G01—MEASURING; TESTING
- G01N—INVESTIGATING OR ANALYSING MATERIALS BY DETERMINING THEIR CHEMICAL OR PHYSICAL PROPERTIES
- G01N21/00—Investigating or analysing materials by the use of optical means, i.e. using sub-millimetre waves, infrared, visible or ultraviolet light
- G01N21/62—Systems in which the material investigated is excited whereby it emits light or causes a change in wavelength of the incident light
- G01N21/63—Systems in which the material investigated is excited whereby it emits light or causes a change in wavelength of the incident light optically excited
- G01N21/64—Fluorescence; Phosphorescence
- G01N21/645—Specially adapted constructive features of fluorimeters
- G01N21/6456—Spatial resolved fluorescence measurements; Imaging
- G01N21/6458—Fluorescence microscopy
- G—PHYSICS
- G02—OPTICS
- G02B—OPTICAL ELEMENTS, SYSTEMS OR APPARATUS
- G02B21/00—Microscopes
- G02B21/36—Microscopes arranged for photographic purposes or projection purposes or digital imaging or video purposes including associated control and data processing arrangements
- G02B21/365—Control or image processing arrangements for digital or video microscopes
- G—PHYSICS
- G02—OPTICS
- G02B—OPTICAL ELEMENTS, SYSTEMS OR APPARATUS
- G02B27/00—Optical systems or apparatus not provided for by any of the groups G02B1/00 - G02B26/00, G02B30/00
- G02B27/0012—Optical design, e.g. procedures, algorithms, optimisation routines
- G—PHYSICS
- G01—MEASURING; TESTING
- G01N—INVESTIGATING OR ANALYSING MATERIALS BY DETERMINING THEIR CHEMICAL OR PHYSICAL PROPERTIES
- G01N15/00—Investigating characteristics of particles; Investigating permeability, pore-volume or surface-area of porous materials
- G01N15/10—Investigating individual particles
- G01N15/14—Optical investigation techniques, e.g. flow cytometry
- G01N15/1429—Signal processing
- G01N15/1433—Signal processing using image recognition
- G—PHYSICS
- G01—MEASURING; TESTING
- G01N—INVESTIGATING OR ANALYSING MATERIALS BY DETERMINING THEIR CHEMICAL OR PHYSICAL PROPERTIES
- G01N15/00—Investigating characteristics of particles; Investigating permeability, pore-volume or surface-area of porous materials
- G01N15/10—Investigating individual particles
- G01N15/14—Optical investigation techniques, e.g. flow cytometry
- G01N15/1468—Optical investigation techniques, e.g. flow cytometry with spatial resolution of the texture or inner structure of the particle
- G01N15/147—Optical investigation techniques, e.g. flow cytometry with spatial resolution of the texture or inner structure of the particle the analysis being performed on a sample stream
- G—PHYSICS
- G01—MEASURING; TESTING
- G01N—INVESTIGATING OR ANALYSING MATERIALS BY DETERMINING THEIR CHEMICAL OR PHYSICAL PROPERTIES
- G01N15/00—Investigating characteristics of particles; Investigating permeability, pore-volume or surface-area of porous materials
- G01N15/10—Investigating individual particles
- G01N15/14—Optical investigation techniques, e.g. flow cytometry
- G01N15/1434—Optical arrangements
- G01N2015/1452—Adjustment of focus; Alignment
Definitions
- NAnumeric aperture
- Confocal microscopyprovides the ability to image cross sections of a cell (“optical sectioning”) for the purpose of generating a three-dimensional map of cellular structures, or to synthesize a single two-dimensional image in which all cellular structures are in focus. These capabilities are desirable for a wide range of cell analysis applications, including co-localization studies, quantifying the translocation of molecules between cellular compartments, and the enumeration of fluorescence in situ hybridization probes randomly located in a nucleus. Although confocal microscopy provides a highly detailed view of the cell, the repeated scanning required significantly reduces image acquisition rates, and can in some cases, induce photo-bleaching of fluorescent probes.
- confocal microscopyis limited by the length of time required to capture imagery, the types of signals that can be collected simultaneously, and the limitation that the cells be immobilized on a solid support.
- the relatively slow speed of confocal microscopycan be a limiting factor for many applications.
- Commonly-studied cellular phenomenaincluding signaling, internalization of surface-bound factors, chromosomal defects, and various morphological transformations, can be subject to high cell-to-cell variation, occur over a wide and continuous range of values, or occur at low frequencies within a heterogeneous mixture of cells. Therefore, the study of such phenomena can require the observation and analysis of thousands of cells, and the application of statistical analysis in order to reach robust and repeatable scientific conclusions. In such cases, it is often impractical to employ confocal microscopy, due to the low throughput of the technique, despite the wealth of information it can provide for each cell.
- conventional fluorescence imagingis generally much faster than confocal image stacking and can provide good spatial resolution and fluorescence sensitivity, when employing high NA objectives.
- conventional fluorescence microscopyis subject to a tradeoff between NA and depth of field. As the NA is increased to improve light collection and increase spatial resolution, the depth of field is reduced by the square of the NA change. Therefore, images of weakly fluorescent signals and cellular structures located outside the ideal plane of focus can be compromised. This effect is most readily observed in experiments employing Fluorescence In Situ Hybridization (FISH) probes that are typically under one micron in size and are comprised of a limited number of fluorescent molecules, which can be distributed throughout the nucleus or cytoplasm of a cell.
- FISHFluorescence In Situ Hybridization
- a slight defocusmay preclude the detection of dim probes, or cause multiple probes located in close proximity to blur into each other. Larger amounts of defocus can cause substantial blur, rendering a FISH spot unrecognizable in an image.
- the ImageStreamTM flow imaging systemwas developed in part to address the gap between the slow, but detailed information obtained by confocal microscopy and the fast, but limited cellular information gleaned by flow cytometry.
- the ImageStreamTM systemcollects six simultaneous multi-mode images (brightfield, darkfield, and up to four different fluorescence colors) from cells in flow. High fluorescence sensitivity and resolution are achieved by using 0.75 NA optics and a 0.5 micron pixel size.
- U.S. Pat. No. 6,583,865(the disclosure and drawings of which are hereby specifically incorporated herein by reference) describes the use of a flow imaging system having a tilted detector (or a sample flow path that is tilted relative to the detector) that effectively increases the depth of field for a more accurate enumeration of structures and probes within a cell.
- the techniquecan be used in connection with a pulsed light source to produce multiple images of a moving object at different focal planes, or it can employ a continuous light source to produce a single composite image incorporating information from the object at multiple focal planes.
- the pulsed light source variantis limited in fluorescence sensitivity because each image has a relatively short signal integration time.
- the continuous light source variantis limited in image quality because the composite image contains both in-focus and out-of-focus information at every location in the cell. Hence, there is a need for a high speed imaging system having an extended depth of field as well as both high fluorescence sensitivity and excellent image quality.
- U.S. Pat. No. 7,009,651(the disclosure and drawings of which are hereby also specifically incorporated herein by reference) describes a flow imaging system in which light from an object is split into a plurality of optical paths, and one or more of the optical paths are defocused relative to the default focal plane of the system, to similarly increase the depth of field.
- U.S. Pat. No. 6,211,955(the disclosure and drawings of which are hereby also specifically incorporated herein by reference) describes the use of a stereoscopic imaging apparatus to view cells from multiple angles, for the reconstruction of a three-dimensional (3-D) map of the cell and accurate enumeration of FISH spots in images. The effectiveness of this technique is limited by the depth of field that can be achieved with the imaging system.
- the spatial resolution of the three-dimensional map produced by the techniquewill vary across the cell, and neighboring FISH spots in the image will blur into each other and be unresolved.
- ImageStreamTM flow imaging systemrepresents a significant advance over conventional flow cytometry and standard microscopy, demanding applications, such as the quantization of FISH probed cells, require imaging capabilities closer to those achieved by confocal image stacking.
- the concepts disclosed hereinenable the depth of field of an imaging system to be increased. Such techniques are particularly well suited for enabling flow imaging systems suitable for high-resolution imagery (0.75 NA and 0.5 micron pixel size) to achieve extended depth of field cellular images similar to those obtained using confocal image stacking. Because flow imaging systems can acquire image data much more rapidly than confocal microscopy, these techniques will facilitate the analysis of large cellular populations. The concepts disclosed herein further encompass imaging systems configured to achieve such extended depth of field imaging.
- the known PSFcan be used to improve the spatial resolution of imagery acquired with the imaging system by mathematically de-convolving the PSF from the imagery.
- object being imagedlies entirely within the focal plane, only a single image of the object need be acquired.
- multiple images of the objectmust be acquired in different focal planes order to produce the resolution enhancement, due to uncertainty about the focal plane of origin of any given feature within a single image of an extended object.
- a single image of an extended objectcan be combined with PSF de-convolution to enhance focus quality (rather than resolution) if the PSF is intentionally modified such that it is invariant to focal position.
- the techniques disclosed hereinare therefore based on manipulating an imaging system such that a point spread function (PSF) of the imaging system is substantially invariant over an extended depth of field.
- PSFpoint spread function
- an unmodified high-resolution imaging systemmight exhibit a depth of field of about 1 micron
- a modified version of the same imaging systemmight be characterized as having a PSF that is substantially invariant across a depth of field of about 10 microns.
- Such a substantially invariant PSFenables the imaging system to integrate light from different focal positions in object space, making the modified imaging system relatively insensitive to defocus.
- a key aspect of the concepts presented in the examples discussed hereinis that a wave front of light from the object is deformed, such that light from different focal positions is collected.
- processing of the imaging data collected from the deformed lightcan correct for errors introduced into the image data by the deformation process, while enabling the information corresponding to the different focal positions to be retained.
- an image with an extended depth of fieldis obtained.
- the following stepscan be considered to be an overview of an exemplary process disclosed herein: providing an imaging system having a substantially invariant PSF (or modifying an imaging system to achieve a substantially invariant PSF), collecting image data from an object, and processing that image data to achieve an extended depth of field image. De-convolving the image (taking into account the modified PSF) enhances image contrast and reduces spatial broadening, thereby improving image quality.
- U.S. Pat. No. 6,583,865describes a flow imaging system having a tilted image plane (either the detector being tilted or the flow path of the object relative to the detector is tilted).
- Several improvements to that configurationare disclosed herein, including the use of a flow cell having a tilted flow path.
- such an approachdoes not simultaneously collect data from a plurality of different focal positions. Instead, as the object moves relative to the tilted image plane, the focal point of the imaging system moves to different focal planes in the object.
- a detector synchronized to the motion of the objectmust be employed (i.e., a time delay integration (TDI) detector), such that images of the object obtained at different positions (and at different times) are combined to achieve an extended depth of field image of the object.
- TDItime delay integration
- an optical element configured to deform the optical wave front of light from the imagecan be introduced into the imaging system between the object and the detector.
- One advantage to using an optical element to deform the optical wave frontis that light is simultaneously collected from an EDF in the object.
- a synchronized detectoris not required (although it may still be desirable to employ such a detector).
- Another advantage to using an optical element to deform the optical wave frontis that the element may be conveniently inserted into or removed from the optical system.
- a phase plate(an exemplary phase plate can be obtained from CDM Optics of Boulder Colo., marketed as a Wavefront CodedTM element) represents one type of optical element that can be used to deform the optical wave front. Yet another type of optical element will deform the wave front by introducing a spherical aberration into light from the object.
- a separate optical element(such as a cover slip) can be used to introduce spherical aberration, or an existing element in the flow imaging system (such as a flow cell or cuvette, or an objective lens with a correction collar) can be modified to introduce the spherical aberration.
- the optical elementis a phase plate or wave front coded (WFC) element
- WFCwave front coded
- an optical elementwill be disposed in infinite space, otherwise known as aperture space (i.e., behind the objective lens).
- aperture spacei.e., behind the objective lens.
- the optical elementintroduces spherical aberration, such aberration is preferably induced before light is collected by the aperture of the imaging system (i.e., between the object or cell being imaged and the objective lens).
- the unmodified imaging systemi.e., the imaging system without the distortion element
- the imaging systemis configured to acquire an image of the object with a relatively narrow depth of field (for example, about 1 micron, understanding that such a value is intended to be exemplary, and not limiting).
- the distortion elementWhen the distortion element is introduced into the imaging system, the distortion element induces defocus in the light from the object, such that the relatively narrow depth of field is expanded (in an exemplary, but not limiting embodiment, the defocus extends about +/ ⁇ 7 microns beyond the original depth of field); however, such defocus “blurs” the extended depth of field (such blur generally includes both spatial broadening and a loss of contrast).
- Post image acquisition processingcan minimize the blurring effects of the defocus induced by the distortion element, enabling an EDF image to be generated. Note that the PSF of the imaging system with the distortion element in place is used to facilitate the post image acquisition processing employed to reduce the effects of the defocus induced by the distortion element.
- a flow imaging systemconfigured to provide the above-described extended depth of field images.
- a flow imaging systemwill include an optical element to deform the wave front of light from the object while providing a substantially invariant PSF, a collection element to direct light from the object along an light path, an imaging lens configured to form an image from the collected light, a detector configured to detect the image and generate image data, and a processor configured to process the image data (i.e., to de-convolve the image data based on the invariant PSF) to produce an extended depth of field image of an object.
- the imaging systemincludes a dispersion element that disperses the collected light before imaging, and in some exemplary embodiments, the detector is a TDI detector, configured to output image data based on a plurality of images of the object detected over time.
- An ImageStreamTM system modified for extended depth of field (EDF) image collectioncan provide for the collection of high-resolution imagery (0.75 NA and 0.5 micron pixel size) without the defocus associated with high NA optics.
- Such imagerywill have a greatly extended depth of field (a proposed EDF ImageStreamTM will achieve a depth of field of ten microns, which is approximately five times the current operating single focal plane depth of less than two microns), allowing for all image features within a 10 micron EDF to be clearly in focus.
- This technologywill enable imaging of cellular components having fine structures that are in different focal planes (e.g., cytoplasmic proteins, such as actin, microtubules, and sub-cellular organelles (such as mitochondria), cellular micro-domains (e.g., membrane caps, lipid rafts, protein co-localization, and signal transduction), and fluorescent in-situ hybridization spot counting.
- focal planese.g., cytoplasmic proteins, such as actin, microtubules, and sub-cellular organelles (such as mitochondria), cellular micro-domains (e.g., membrane caps, lipid rafts, protein co-localization, and signal transduction), and fluorescent in-situ hybridization spot counting.
- cytoplasmic proteinssuch as actin
- microtubulessuch as mitochondria
- sub-cellular organellessuch as mitochondria
- cellular micro-domainse.g., membrane caps, lipid rafts, protein co-localization, and signal transduction
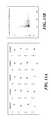
- FIG. 1Ais a schematic illustration of an exemplary flow imaging system for implementing the concepts disclosed herein;
- FIG. 1Bis a schematic illustration of an exemplary imaging system for implementing the concepts disclosed herein, wherein the objected to be imaged are disposed on a plate or slide;
- FIG. 1Cis a schematic illustration of a readout provided by a TDI detector employed in an exemplary flow imaging system used in accord with the concepts disclosed herein;
- FIG. 2is a schematic illustration of an exemplary stereoscopic flow imaging system used in accord with the concepts disclosed herein;
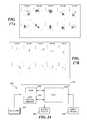
- FIG. 3is a block diagram schematically illustrating the basic components of an exemplary flow imaging system suitable for implementing the concepts disclosed herein;
- FIG. 4is a block diagram schematically illustrating a method of providing extended depth of field imagery for an object
- FIG. 5schematically illustrates a filter wheel for selectively positioning an wave front distortion element in a light path of a flow imaging system, such that the imaging system can be used for both EDF imaging and normal imaging, depending on the position of the filter wheel relative to the light path;
- FIG. 6illustrates a three-dimensional (3-D) contour of an exemplary optical element configured to deform the optical wave front of light from an object
- FIG. 7graphically illustrates the fractional focal offset as a function of transmission angle due to a glass parallel plate, representing another type of optical element that can be used to intentionally deform light from the object;
- FIG. 8schematically illustrates how the PSF of an imaging system affects the quality of an image generated by the imaging system
- FIG. 9schematically illustrates the effect that varying degrees of defocus have on an image acquired using a standard non-extended depth of field imaging method
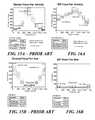
- FIG. 10Agraphically illustrates an absolute comparison of through focus modulation transfer functions, at half the Nyquist frequency, of a standard non-extended depth of field imaging method and a plurality of extended depth of field (EDF) imaging methods, as disclosed herein, the EDF methods including an exemplary Wave Front Coded (WFC) EDF method, an exemplary Spherical Aberration EDF method, and an exemplary Tilted Object Plane Time Delay Integration (TOPTDI) EDF method;
- WFCWave Front Coded
- TOPTDITilted Object Plane Time Delay Integration
- FIG. 10Bgraphically illustrates a normalized comparison of modulation transfer functions of a standard non-extended depth of field imaging method (diffraction limited) and the WFC EDF method, the Spherical Aberration EDF method, and the TOPTDI EDF method;
- FIG. 11Aillustrates the best focus imagery obtained using the exemplary imaging system of FIG. 1A , for both standard imaging and EDF imaging, before processing the image data to correct for errors introduced by the wave front deformation;
- FIG. 1Billustrates the best focus imagery obtained using the exemplary imaging system of FIG. 1A , for various EDF techniques, after de-convolution;
- FIG. 12Aillustrates the imagery 5 microns away from the best focus obtained using the exemplary imaging system of FIG. 1A , for both standard imaging and EDF imaging, before processing the image data to correct for errors introduced by the wave front deformation;
- FIG. 12Billustrates the imagery 5 microns away from the best focus obtained using the exemplary imaging system of FIG. 1A , for various EDF techniques, after de-convolution;
- FIG. 13Aillustrates a sampling of PSF imagery collected using the exemplary imaging system of FIG. 1A , modified to implement WFC EDF imaging (modified by introducing a phase plate in infinite space);
- FIG. 13Billustrates an exemplary de-convolution kernel
- FIG. 14Aillustrates the imagery collected using the exemplary imaging system of FIG. 1A over a 16 micron focus pan for standard imaging (i.e., not EDF imaging);
- FIG. 14Billustrates the imagery collected using the exemplary imaging system of FIG. 1A modified for WFC EDF over a 16 micron focus pan;
- FIG. 15Aillustrates peak pixel intensity versus object number for image data collected by the exemplary imaging system of FIG. 1A operating in a standard mode (i.e., not EDF imaging)) during a step-wise focus pan in which approximately 200 objects were imaged at each of nine focus positions;
- a standard modei.e., not EDF imaging
- FIG. 15Billustrates area versus object number for image data collected by the exemplary imaging system of FIG. 1A operating in a standard mode (i.e., not EDF imaging) during a step-wise focus pan in which approximately 200 objects were imaged at each of nine focus positions;
- a standard modei.e., not EDF imaging
- FIG. 16Aillustrates peak pixel intensity versus object number for image data collected by the exemplary imaging system of FIG. 1A operating in an EDF mode) during a step-wise focus pan in which approximately 200 objects were imaged at each of nine focus positions;
- FIG. 16Billustrates area versus object number for image data collected by the exemplary imaging system of FIG. 1A operating in an EDF mode) during a step-wise focus pan in which approximately 200 objects were imaged at each of nine focus positions;
- FIG. 17Aillustrates FISH imagery of cells with disomy for chromosome Y collected by the exemplary imaging system of FIG. 1A operating in a standard mode (i.e., not EDF imaging);
- FIG. 17Billustrates FISH imagery of cells with disomy for chromosome Y collected by the exemplary imaging system of FIG. 1A operating in an EDF mode;
- FIG. 18graphically illustrates how EDF data collected using the exemplary imaging system of FIG. 1A operating in EDF mode can be used to discriminate single cells from debris or cell clusters prior to classifying and enumerating chromosomes;
- FIG. 19Agraphically illustrates a gray-scale fluorescence image prior to segmentation
- FIG. 19Bgraphically illustrates a segmentation mask to isolate areas of local maxima after initial segmentation
- FIG. 19Cgraphically illustrates a segmentation mask to isolate areas of local maxima after morphology segmentation
- FIG. 20graphically illustrates an analysis of cellular images obtained using the exemplary imaging system of FIG. 1A operating in a standard mode (i.e., not EDF imaging);
- FIG. 21graphically illustrates an analysis of cellular images obtained using the exemplary imaging system of FIG. 1A operating in an EDF mode
- FIGS. 22A-22Dillustrate randomly selected cell imagery obtained using the exemplary imaging system of FIG. 1A operating in a standard mode (i.e., not EDF imaging) and corresponding to “Monosomy Refinement” gates ( FIG. 22A ), Monosomy false positive events ( FIG. 22B ), “Disomy Refinement” gates ( FIG. 22C ), and “Disomy false positive events ( FIG. 22D );
- FIGS. 23A-23Dillustrate randomly selected cell imagery obtained using the exemplary imaging system of FIG. 1A operating in an EDF mode and corresponding to “Monosomy Refinement” gates ( FIG. 23A ), “Monosomy false positive events” ( FIG. 23B ), “Disomy Refinement” gates ( FIG. 23C ), and “Disomy false positive events” ( FIG. 23D ); and
- FIG. 24schematically illustrates an exemplary computing system suitable for use in implementing the method of FIG. 4 .
- the concepts disclosed hereinencompass a method of adding extended depth of field capability to a flow imaging system configured for high-resolution imagery (exemplary, but not limiting parameters include 0.75 NA and 0.5 micron pixel size).
- exemplary, but not limiting parametersinclude 0.75 NA and 0.5 micron pixel size.
- standard imageor “standard imaging” refers to use of an exemplary flow imaging system (described in detail below) that has not been modified for EDF imaging.
- Such a flow imaging systemcan combine the speed, sample handling, and cell sorting capabilities of flow cytometry with the imagery, sensitivity, and resolution of multimode imagery with an extended depth of field in order to provide a comprehensive feature set to more effectively eliminate artifacts and allow for the complex analysis of the location, distribution, and translocation of biomarkers.
- Standard, non-confocal methods of image collectionare hindered by extended depth of field limitations.
- the EDF capability described hereinis a result of modifying an exemplary flow imaging system with an element in aperture space to alter the wave front in a deterministic way.
- the combination of a modified wave front and post-processing of the imageryhelps to mitigate the spatial resolution loss and blurring associated with defocus.
- the resultis a 2-D projection of the 3-D cell for each of six multimode images (it being understood that the use of six images are exemplary, and not limiting on the technique) acquired at rates 100 to 1000 times faster than confocal image stacking techniques.
- micron-level spatial resolutioncan be maintained over the entire cell so that cellular structures and probes lying outside the plane of best focus can be analyzed with greater accuracy, as demonstrated with empirical FISH probe image data discussed in detail below.
- EDF imagery from flow imaging systemscan be beneficially employed, including: (1) Cell Activation, such as transcription factor NF-eB nuclear translocation; (2) Mechanisms of Monoclonal Antibody Drug Action, co-localization and compartmentalization; (3) Apoptosis Analysis: differential rates of apoptosis in heterogeneous cell samples; and, (4) Morphologic cell classification, the identification of cells in blood and bone marrow.
- Cell Activationsuch as transcription factor NF-eB nuclear translocation
- Mechanisms of Monoclonal Antibody Drug Actionco-localization and compartmentalization
- Apoptosis Analysisdifferential rates of apoptosis in heterogeneous cell samples
- Morphologic cell classificationthe identification of cells in blood and bone marrow.
- FIG. 1Aillustrates the key components of an optical system employed to project light from objects in flow onto a detector that employs an exemplary readout for any type of small object (although imaging cells represent an exemplary application).
- Objectsare hydrodynamically focused into a single-file line in a fluidic system (not separately shown), forming a tall but narrow field of view. This method enables the lateral dimension of the detector to be used for signal decomposition.
- FIG. 3is a block diagram showing the major components of exemplary flow imaging system 150 .
- a key componentis a distortion element 152 , which is used to distort the wave front of the light collected from an object, in a predictable and largely reversible fashion, while expanding the field of view.
- the major components of a multi-mode EDF flow imaging systeminclude a flow cell or cuvette 151 into which object (such as cells) to be imaged are directed, an optical distortion element 152 to introduce a well-characterized distortion of light received from the object (such that the PSF of the imaging system is substantially invariant over a range of focal planes), collection, dispersing, and imaging optical elements 153 (to enable the multi-mode imaging such as shown in FIG.
- a detector 154 for generating raw image datapreferably, a TDI detector, although other imaging detectors can alternatively be employed, i.e., non-TDI imaging detectors can also be used
- a processor 155 for processing the image datato enhance the image data and at least partially correct for the distortions introduced by the distortion element.
- processingcan comprise a de-convolution that reduces spatial broadening and enhances contrast. It should be recognized that such processing can be implemented using hardware (e.g., a custom processing circuit or an application specific integrated circuit (ASIC)), or a combination of hardware and software (e.g., a software-driven processor, such as is typically used in a computing device, a personal computer being one well-known example thereof).
- ASICapplication specific integrated circuit
- the distortion elementmay be physically located outside of the aperture of the imaging system (i.e. between the flow cell and the imaging objective in the case of the spherical aberration technique), in aperture space after the imaging objective (in the case of the WFC technique), or may be effected within the imaging objective itself by adjustment of an aberration correction collar.
- object(s) 99are hydrodynamically focused in a flow of fluid directed into a flow cuvette 116 and illuminated from one or more sides using light sources 98 and 100 .
- Lightis collected from the objects with a high NA objective 102 , and the light that is collected is directed along a light path including lenses 103 A and 103 B, and a slit 105 .
- a fraction of this collected lightis transmitted to an auto-focus subsystem 104 and to a velocity detection system 106 .
- the objectsare fluorescently labeled beads or fluorescently labeled cells.
- the extended depth of field capability afforded by the present exemplary technique disclosed hereinis particularly useful in automated chromosome enumeration via FISH probing of Jurkat cells, although such use is intended to be exemplary, rather than limiting on the application of this technique.
- an optical distortion element 5 Ais disposed between the objects being imaged and the collection lens, or an optical distortion element 5 B is disposed in infinite space (that is, at the objective aperture or at a conjugate image of the aperture at a subsequent location in the optical system, but before the detector).
- optical distortionmay be introduced via adjustment of a correction collar on an adjustable implementation of objective lens 102 . Only one means of introducing optical distortion is required.
- the function of the optical distortionis to change the light from the object to achieve a PSF that is substantially invariant across an EDF, such that negative effects of the distortion produced by the element can subsequently be removed by signal processing, to yield an EDF image.
- Yet another technique that can be used to introduce optical distortion into light from the objectis to use a cuvette/flow cell having different optical thicknesses at different locations, such that imaging through the different locations of the cuvette induces different degrees of wave front deformation.
- different faces of the cuvettecan induce different levels of distortion, with one or more faces introducing no intentional distortion/deformation, with other faces configured to intentionally deform the optical wave front of light from the object. Moving the cuvette relative to the imaging optical enables the deformation to be selectively induced.
- An optional cuvette manipulator 9 for manipulating the position of the cuvette relative to the optical systemis shown in FIG. 1A . Where different faces of the cuvette induce different levels of deformation, such means will generally rotate the cuvette.
- manipulator 9will be configured to translate the cuvette linearly.
- manipulator 9many different structural configurations can be used to implement manipulator 9 , such as stepper motors, linear actuators, hydraulics, powered hinges, powered linkages, and others. The specific configuration is not critical, so long as manipulation of the cuvette does not introduce additional optical errors beyond the intentional deformation, thus the specified structures for manipulator 9 should be considered exemplary, rather than limiting.
- a spectral decomposition element 108which employs a fan-configuration of dichroic mirrors 110 to direct different spectral bands laterally onto different regions of a TDI detector 114 .
- the imaging systemis able to decompose the image of a single object 118 into multiple sub-images 120 across detector 114 , each sub-image corresponding to a different spectral component.
- detector 114has been enlarged and is shown separately to highlight its elements.
- FIG. 1Aillustrates an exemplary flow-based embodiment of flow imaging system 150 .
- an imaging systemcan be configured to collect images of objects on a plate or slide 7 , where the plate/slide moves relative to the imaging system, instead of the flow-based embodiment, as indicated in FIG. 1B .
- Flow imaging system 150can employ a prism (not shown) or a grating oriented to disperse light laterally with regard to the axis of flow prior to the final focusing optics, for spectral analysis of each object's intrinsic fluorescence.
- a cylindrical final focusing lenscan be employed to image a Fourier plane on the detector in the cross-flow axis, enabling analysis of the light scatter angle.
- ⁇ imaging, flow spectroscopy, and Fourier plane scatter angle analysiscan be employed simultaneously by splitting the collected light into separate collection paths, with appropriate optics in each light path.
- a second imaging objective and collection traincan be used to image the particles through an orthogonal facet of the flow cuvette 116 , thereby viewing the objects in stereoscopic perspective with no loss of speed or sensitivity.
- IDEASTMimage analysis software
- the IDEASTM software packageevaluates over 200 quantitative features for every cell, including multiple morphologic and fluorescence intensity measurements, which can be used to define and characterize cell populations.
- the IDEASTM software packageenables the user to define biologically relevant cell subpopulations, and analyze subpopulations using standard cytometry analyses, such as gating and backgating.
- detector 114 of the exemplary flow imaging system shown in FIG. 1Ais implemented using a TDI that performs high throughput imaging with high sensitivity.
- an exemplary readout 138the image on the TDI detector is read out one row of pixels at a time from the bottom of the detector. After each row is read out, the signals in the remaining detector pixels are shifted down by one row. The readout/shift process repeats continuously, causing latent image 142 to translate down the detector during readout (note the movement of latent image 142 through frames T 1 -T 6 ). If the readout rate of the TDI detector is matched to the velocity of the object being imaged, the image does not blur as it moves down the TDI detector.
- the TDI detectorelectronically “pans” the rate at which rows are read out to track the motion of an object being imaged. To provide optimum results for this technique, it is important to accurately measure the velocity of the objects being imaged and to employ that measurement in feedback control of the TDI readout rate. Thus, accurate velocity detection for objects moving in flow enables the TDI imaging to be implemented properly.
- An exemplary flow imaging system used in connection with the present inventionincludes a TDI detector that has 512 rows of pixels, provides a commensurate 512 ⁇ increase in signal integration time. This increase enables the detection of even faint fluorescent probes within cell images and intrinsic auto fluorescence of cells acquired at a high-throughput.
- TDI detectorincreases measured signal intensities up to a thousand fold, representing over a 30 fold improvement in the signal-to-noise ratio compared to other methods disclosed in the prior art.
- This increased signal intensityenables individual particles to be optically addressed, providing high-resolution measurement of either scattered spectral intensity of white light or scattered angular analysis of monochromatic light of selected wavelengths.
- Exemplary flow imaging system 150can be configured for multi-spectral imaging and can operate with, for example, six spectral channels: DAPI fluorescence (400-460 nm), Darkfield (460-500 nm), FITC fluorescence (500-560 nm), PE fluorescence (560-595 nm), Brightfield (595-650 nm), and Deep Red (650-700 nm).
- the TDI detectorcan provide 10 bit digital resolution per pixel.
- the NA of the exemplary imaging systemis typically about 0.75, with a pixel size of approximately 0.5 microns. However, those skilled in the art will recognize that this flow imaging system is neither limited to six spectral channels nor limited to either the stated NA, or pixel size and resolution.
- Another exemplary flow imaging system embodimentis a stereoscopic arrangement, as illustrated in a flow imaging system 70 of FIG. 2 , wherein fluid flow 22 entrains object 99 (such as a cell, but alternatively, a small particle) and carries the object through flow imaging system 70 .
- object 99such as a cell, but alternatively, a small particle
- Light 30 from object 99passes through collection lens 32 that collects the light, producing collected light 34 , which is approximately focused at infinity, i.e., the rays of collected light from collection lens 32 originating at the same location in the object are generally parallel.
- Collected light 34enters a prism 36 , which disperses the light, producing dispersed light 38 .
- optical distortion element 5 A or 5 B or adjustable objective lens 102or a cuvette/flow cell configured to introduce optical distortion
- the use of two different optical legsenables the object to be imaged from two different directions, in order to distinguish features that would otherwise overlap when viewed from a single direction. While this embodiment can also be employed for objects on moving substrates, such as microscope slides, it is particularly useful for analyzing multi-component objects in solution flowing through the system, such as cells containing FISH probes. Such probes appear as point sources of light anywhere within the cell's 3-D nucleus. In some cases, two or more FISH probes may appear in an overlapping relationship along the optical axis of the imaging system. In such cases, one of the FISH probes may obscure the others, making it difficult to determine the number of probes present in the cell. This factor is important in the determination of genetic abnormalities such as trisomy 21 , otherwise known as Down syndrome.
- the stereoscopic imaging system 70 in FIG. 2includes two TDI detectors 114 a and 114 b , and their associated optical components, as discussed above, in connection with flow imaging system 150 .
- the optical axes of collection lenses 32 for the two TDI detectorsso that they are disposed at an angle to each other, for example, about 90 degrees, it is possible to separately resolve the FISH spots imaged from two or more FISH probes on at least one of TDI detectors 114 a or 114 b . If two or more FISH probes overlap in regard to the image produced on one of the detectors, they will be separately resolved in the spectrally dispersed images produced on the other TDI detector.
- TDI detectors in flow imaging system 70in what might be referred to as a “stereo or three-dimensional configuration” provides flexibility in the configuration of each leg of the system, including parameters such as the relative TDI readout rates, axial orientations, inclinations, focal plane positions, and magnification. Multiple cells or other objects may be imaged onto each detector simultaneously in the vertical direction. Since the objects move in synchronicity with the signal on the TDI, no gate or shutter is required to prevent blurring of the image. A pulsed or CW light source (without the need for a trigger mechanism to time a pulse coincident with particle arrival in the field of view) is employed.
- the extended field of view in the axis of motion associated with TDI detectionenables the cell or object in motion to be illuminated by multiple light pulses during its traversal through the imaging system.
- a TDI systemcan produce a single un-blurred image of the object that integrates the signal from multiple light pulses.
- the signal generated by the objectwill be collected throughout the entire traversal of the object through the field of view, rather than only a small segment in time when a shutter is open. Therefore, the amount of signal collected and imaged on the detector in this exemplary embodiment is substantially greater than that of the prior art frame-based imaging systems. Consequently, the present approach can operate at very high throughput rates with excellent signal-to-noise ratio.
- optical system shown in FIG. 1A in an orthogonal configuration as shown in FIG. 2provides the ability to determine the location of a source of light within the cell in three dimensions.
- a single axis EDF systemprojects light from the cell onto a two dimensional plane without the blur associated with defocus. Therefore, in X-Y-Z Cartesian space, one can readily determine, for example, the location of light coming from the cell in the X and Z axes, assuming the optic axis is parallel to the Y axis. In the Y axis no positional information is available.
- a second EDF optical systemis positioned orthogonal to the Y axis and parallel to the X axis, one can further determine the location of light coming from the cell in the Y axis.
- a point of light coming from a cellwill be imaged onto two detectors simultaneously. Since both detectors collect light from the same Z axis, the Z location of the light on the detectors provides a reference with which to correlate the position of light in all three axes.
- the techniques disclosed hereinmay be used to unambiguously count spots from the cell.
- the same methodologycan be applied. However, in this case each molecular species is tagged with a different color marker. Therefore, the same process is applied in two channels of the detector. Since each channel is spatially registered with the other, one can compare the location of light in each channel to assess co-localization of two different molecular species.
- the concepts disclosed hereincan also be used to reconstruct 3-D models of solid bodies and surfaces within the cell. This can be accomplished by dividing the volume of the cell into a set of voxels with a dimension is each axis equal to the pixel size in each axis on the detectors. The intensity of each voxel in the volume can be determined in stepwise fashion. On a given detector, a single pixel, in the X-Z plane for example, represents the sum of voxel intensities for all voxels at that X-Z location along the Y axis.
- the total signal from the X-Z pixelwould be apportioned into each voxel along the Y axis in accordance with relative proportion of signal present in each pixel along the corresponding row on the Y-Z detector.
- the signal for an arbitrary set of voxels, X3Z5Y1, X 3 Z 5 Y 2 , X 3 Z 5 Y 3 , X 3 Z 5 Y . . . , X3Z5Y100could be determined as follows.
- the signal for pixel X 3 Z 5 in the third column and fifth row on detector X-Zwould contain the sum of the signal for all voxels listed above. If this sum were 1000 counts and all 100 pixels on the fifth row of the Y-Z detector contained the same value, than the 1000 count signal would be distributed evenly among all voxels listed. If for example, only the 10 th and 11 th pixels contained signal, then all voxel signal levels would be set to zero except for voxels X 3 Z 5 Y 10 and X 3 Z 5 Y 11 . The 1000 count signal would then be distributed into those voxels accordance with the relative signal levels in pixels 10 and 11 on the fifth row of detector Y-Z.
- Light sourcesare disposed so that light 58 emitted from the source travels toward the object in a direction that is generally aligned with the optical axis of collection lens 32 , and the image formed on the TDI detectors thus will not include light absorbed by object 99 .
- Light absorption characteristics of the objectcan be determined by illuminating the object using these light sources. More specifically, in connection with TDI detector 114 a , light source 62 provides illumination of object 99 from a direction so that absorption characteristics of the object can be determined from the image produced on the TDI detector.
- light provided by light source 62 that is scattered from object 99can be used to produce a scatter image, and spectrally dispersed images on TDI detector 114 b .
- Light source 74can be employed to produce spectrally dispersed and scattered images on both TDI detectors 114 a and 114 b . If light sources 62 and 72 are of different wavelengths and an appropriate filter is provided to block the wavelength from the light source aligned with the optical axis of respective collections lenses 32 , these two light sources can be used for producing scattered light from the object. For example, suppose light source 72 produces light of a wavelength A that scatters from object 99 and is directed toward TDI detector 114 a .
- the light at wavelength Bwill not directly affect the images produced on TDI detector 114 a .
- the light from light source 72would be blocked with an appropriate filter (not shown) so that it does not interfere with the imaging of light produced by light source 62 that is scattered from object 99 onto TDI detector 114 b.
- Epi light source 66is also illustrated for use in producing images on TDI detector 114 a in connection with partial reflector 68 .
- Light source 64can be used to generate reflected light to produce images on TDI detector 114 a , while scattered light from this source is directed toward TDI detector 114 b .
- These and other possible locations of light sourceswill be apparent to those of ordinary skill in the art, as appropriate for providing the incident light on the object needed to achieve imaging, depending upon the particular application and information about the object that is desired.
- the WFC EDF methodthat is described below in detail is applied to both legs of flow imaging system 70 , an accurate 3-D map of the cell can be reconstructed.
- FIG. 2can be employed to acquire non-EDF images (i.e., it can be used without optical distortion elements 5 A or 5 B, or adjustable objective 102 or cuvette or cover slip configured to introduce optical distortion), the use of such elements and the post-image processing to partially correct for such distortion enables stereoscopic high definition EDF imaging to be acquired from objects in flow, thereby enabling a large amount of image data to be acquired for a large number of objects much more rapidly than is possible using confocal microscopy.
- EDFrefers to the capability of imaging more parts of an object in focus than could be imaged using an unmodified imaging system (i.e., an imaging system not modified to achieve the EDF imaging).
- EDF imagingcan enable all cellular components within a ten micron or greater depth of field to be imaged in focus.
- EDF cellular imagingoffers an alternative method to developing a confocal-like image projection with the entire cell in focus simultaneously.
- One of the issues raised by single-plane image capture of microscopic objectsis the effect of focus variations on the quality of captured imagery.
- the object to be imagedhas fine structures, which are intrinsically in different focal planes, it is not possible to resolve all of the corresponding fine detail in a single planar image.
- EDF imagingcan be accomplished at very high speed and eliminates the photo bleaching effects associated with repeated acquisitions of the cell imagery at different planes of focus.
- EDF imagingcan be accomplished in several ways. However, the underlying principal involves the formation of a PSF that is invariant over an expected range of focal positions. For most cell imaging applications, this range is approximately 15 microns. The process of achieving a PSF invariant to focal position increases the size and changes the character of the PSF when compared to the classical best focus point spread.
- the increased sizereduces the ability of the optical system to generate contrast and resolve image detail.
- the contrastcan be largely restored with the benefit of providing “best-focus-like” resolution over a greatly enhanced focal range.
- the end resultis a high-resolution image of the cell with all features simultaneously in focus.
- the concepts disclosed hereinencompass at least three methods to achieve focus invariant PSFs: (1) a WFC EDF method using a phase plate, for example, a WAVE FRONT CODEDTM element provided by CDM Optics, Inc. of Boulder, Colo.; (2) a Spherical Aberration EDF method; and, (3) a Tilted Object Plane Time Delay Integration (TOPTDI) EDF method.
- a WFC EDF method using a phase platefor example, a WAVE FRONT CODEDTM element provided by CDM Optics, Inc. of Boulder, Colo.
- a Spherical Aberration EDF methodand, (3) a Tilted Object Plane Time Delay Integration (TOPTDI) EDF method.
- TOPTDI EDF methodBasic principles relating to the TOPTDI EDF method are described in U.S. Pat. No. 6,583,865. The present discussion briefly covers improvements to the TOPTDI method.
- the WFC EDF technique and the Spherical Aberration EDF techniquecan be distinguished from the TOPTDI EDF technique, in that the TOPTDI EDF technique acquires data from different focal planes at different times, and thus requires a TDI detector.
- the WFC EDF technique and the Spherical Aberration EDF techniqueacquire EDF data simultaneously, and a TDI detector is not required.
- TDI detectorin implementing the WFC EDF technique and the Spherical Aberration EDF technique is desirable, because the TDI detector increases the amount of light (and therefore data) that can be collected from any object, thereby improving the signal-to-noise ratio of the image; however, each different image acquired by the TDI detector includes an EDF before the integrated image is provided by the detector, in contrast to the TOPTDI implementation.
- FIG. 4is a block diagram illustrating the method of providing multi-mode extended depth of field imagery for an object.
- the methodbegins with deformation of the optical wave front of light from an object as shown in a step 162 .
- the optical wave frontmay be deformed by one of a phase plate configured to induce a phase change to light passing through the phase plate, an optical element configured to induce a phase change or distortion to light passing through the optical element, an adjustable objective lens, or a cuvette having different thicknesses at different locations through which the object can be imaged (in at least one embodiment, the cuvette/flow cell includes a face configured to induce distortion, and a face that does not induce distortion, such that rotating the cuvette relative to the imaging optics enables the distortion to be selectively induced).
- This deformationis performed in such a way that a PSF does not vary substantially across an extended depth of field.
- Some cellular objectshave fine structures that are in different focal planes, and the application of the deformation of the wave front enables all image features within the extended depth of field across the different focal planes to be clearly in focus (at least after image processing has reversed the distortion effects), because the deformation defocuses and expands the depth of field, thereby enabling light from the different focal planes to be simultaneously collected.
- the methodcontinues in a step 163 , wherein the deformed or modified light is dispersed into a plurality of different light beams.
- Such spectral dispersionenables a dispersed image (or a plurality of spectrally distinct images) of the object to be acquired, generally as indicated in FIG. 1A .
- An imaging lensis used to generate a dispersed image (or a plurality of images) of the object in a step 164 , and the dispersed image is detected in a step 166 .
- the detector of FIG. 1Acan thus generate either a plurality of different spectral images (one image per channel), or a single dispersed image (comprising a plurality of spectrally dispersed images).
- Optional step 168indicates that the next step is to determine the PSF of the imaging system that produced the deformed optical wave front. While this step is required to process the raw image data to generate the best quality EDF image, it should be recognized that such a step may not be implemented by a user in some imaging systems, since it could be implemented by a manufacturer of the imaging system, and stored as a known parameter (thus the arrow from step 168 to start).
- the PSF of the imaging system including the optical distortion elementneed only be determined once, as long as the configuration of the imaging system remains unchanged. Once a change is made to the optical configuration of the imaging system that changes the imaging system's inherent PSF, the PSF for the modified system would need to again be determined.
- the image datacan be de-convolved using the PSF to reduce negative effects of the wave front distortion. Then, the extended depth of field image for the object can be produced in a step 172 , and the method is complete as shown in a step 174 .
- the WFC EDF methodinvolves imparting a deformation in the optical wave front of the object via the addition of an optical or distortion element such as a phase plate (or preferably the WAVE FRONT CODEDTM element provided by CDM Optics, Inc. of Boulder, Colo.) in the aperture plane of the optical system.
- the deformationcauses light from different focal planes corresponding to a single lateral position in object space to be imaged on the detector plane simultaneously.
- a significant advantage of the WFC EDF method over the TOPTDI EDF methodis the ease with which the system can be converted from standard imaging to EDF imaging. The conversion requires the insertion of the WFC element in the aperture space of the system.
- the exemplary flow imaging systemwas designed to place an external image of the aperture in an easily accessible location.
- a six-position software controlled aperture wheel 157is shown in FIG. 5 , which can be readily disposed in the exemplary imaging system between the objective and the detector.
- the position of the filter wheelcan be controlled remotely, so that the internal components of the imaging system do not need to be accessed to selectively switch the imaging system between a standard imaging mode and an EDF imaging mode.
- the image processing required in standard mode and EDF modewill be different.
- phase plateIn order to simulate the WFC EDF method, a phase plate was modeled and consists of an optically clear element having a two-axis cubic waveform, where the axes cross orthogonally.
- a phase plateis an optical component of transparent material placed in the aperture space of an optical system.
- the phase plateis optically clear and has slight variations in its thickness in order to retard or advance the phase of the wave front relative to the un-deviated wave front.
- CDM Optics, Inc.has developed the ability to construct phase plates with arbitrary surface shapes and micron-level fabrication tolerances. These phase plates can be used to induce deformations in the optical wave front to potentially provide a more consistent PSF through an extended focal range. Thus, the slight variations in thickness across the plate's surface serve to retard or advance the phase of the wave front.
- the element shown as a 3-D rendering in FIG. 6contains about 6.6 microns of total sag.
- the elementwas modeled at an exposed aperture stop in the exemplary flow imaging system to generate the PSFs used in the subsequent analysis as described below. The results are summarized in FIGS. 10A and 10B , described in detail below.
- the spherical aberration EDF methodinvolves imparting spherical aberration in the wave front by inserting a distortion element between the object and the objective lens in order to induce spherical aberration into the collected imagery.
- Useful distortion elementsinclude a cover slip (or parallel plate), a custom objective with a correction collar, a custom cuvette having different optical properties in different parts of the cuvette, and switchable optical elements in the image collection path.
- Spherical aberrationcauses different regions in the aperture to focus at different points along the optical axis so that points from multiple focal planes in object space are imaged onto one detector plane.
- ⁇sin - 1 ( sin ⁇ ⁇ ⁇ n ) ( 2 ) where n is the refractive index (approximately 1.5) inside the glass.
- Equation 4shows that the focal displacement z′ due to the presence of the glass plate is:
- the spherical aberration of the optical systemis caused by the fact that z′ does not remain constant as ⁇ ranges from zero up to the NA of the microscope objective, which represents the largest angle ray the objective will accept.
- the objective used in the exemplary flow imaging systemhas an NA of 0.75.
- FIG. 7shows the fractional focal offset z′/t as a function of ⁇ , assuming a nominal glass refractive index n of 1.5.
- z′/tis about 0.33, while at the maximal angle for an NA of 0.75 (the NA of the exemplary flow imaging system), z′/t is about 0.49.
- the difference between these two fractional focal displacementsis approximately 0.16.
- a commercially available 110 micron thick cover slipwas used.
- the focal offsets introduced by this cover slipvaried over a range of 17 microns, which is larger than ideal for covering the depth of a cell nucleus, but still well in the useful range for experimentation.
- a desirable feature of the Spherical Aberration EDF method capabilityis selectability, where the spherical aberration can be introduced or not, depending upon the requirements of the particular assay that is being run.
- the EDF algorithmcan then be applied only to imagery collected with the EDF hardware in place.
- a selectable EDFcan be achieved in a number of ways in hardware.
- an insertable cover slipcan be disposed between the objective and the cuvette.
- the cover glasswas held in place on the face of the cuvette by a drop of alcohol to form a temporary rigid optical contact.
- the introduction of the cover glasscreates a known aberration in the optical system, known as spherical aberration.
- spherical aberrationcauses light rays departing a single source at different angles relative to the optic axis to focus at different positions along the optic axis.
- imagerybecomes more fuzzy.
- a more subtle effectis that the imagery is less dependent on the exact focal position of the lens relative to the source.
- an instrument with enhanced depth of fieldis achieved, at the cost of losing some of the signal-to-noise ratio characteristic of in-focus data from the original instrument. Issues include precision motion requirements and the need to establish and maintain precise angular alignment of the cover slip surfaces orthogonal to the optical axis in the very limited working distance (0.5 mm) between the cuvette and objective available in the exemplary imaging system.
- a custom objective with a motorized spherical aberration correction collarcan be utilized.
- Potential problems with such an embodimentinclude the need to provide a custom optical design, and development of the objective lens and the mechanical interface to drive the correction collar.
- a custom cuvette with different optical thicknessesmay be presented to the image collection optical path. Issues with such an embodiment include tight fabrication tolerances on the cuvette wall thicknesses and face perpendicularity, precision motion control within the optical alignment requirements, as well as maintenance of the interface to the fluidic system in the flow cell/cuvette assembly.
- switchable optical elements in the image collection optical pathmay include the final focus lens to the camera/detector, which can be designed with residual spherical aberration and disposed in place of the standard focusing lens during EDF imaging. Issues include the optical design and fabrication of the spherically aberrated lens to maintain parfocality with the standard lens and the motion control system for swapping the lenses in the optical path.
- Varying degrees of spherical aberrationwere modeled to determine the best trade off between contrast loss and depth of field expansion. Evaluation of the PSFs at various focal positions provides a qualitative understanding of the limitations of the Spherical Aberration method. Ideally, the PSF would remain fairly consistent over the focal range of interest.
- the exemplary flow imaging systemwas modeled with a decreased flow cuvette thickness to add 1.8 waves of peak-to-peak spherical aberration after refocusing. This optical configuration was then used to model the PSF at the various focus locations required for subsequent analysis. The results are summarized in FIGS. 10A and 10B , described in detail below.
- the TOPTDI EDF methodcan be employed in concert with the TDI detection methods used in the exemplary flow imaging system described in U.S. Pat. No. 6,583,765, the drawings and specification of which are hereby specifically incorporated herein by reference.
- the object planeor detector plane
- the focal planeis tilted relative to the axial flow of the cells such that light from multiple focal planes in object space is integrated during image collection.
- Either the detectorcan be tilted relative to a non-tilted flow path for objects being imaged, or a cuvette with a tilted flow path and means for optically correcting for the coma and astigmatism that will be introduced by the tilted reflective surface of the cuvette wall and air interface can be used.
- a custom-designed cuvette that has a tilted channelcan be employed, thereby eliminating the concern with respect to the astigmatism and coma by ensuring that the cuvette is orthogonal to the collected light. Only the water/glass cuvette is non-orthogonal, providing a decrease in optical aberrations.
- Introduction of an optical componentsuch as an optical wedge, which effectively tilts the image plane with respect to the camera, may also be utilized.
- a convolution filtercan be used in the beam path, and the known de-convolution algorithm may be utilized to correct for the astigmatism and coma effects.
- an improved implementation of the tilted-plane methodologyhas been developed to achieve the desired EDF performance, without the introduction of excessive off axis aberrations.
- This methodutilizes optical fabrication techniques developed for precision prism manufacturing, to polish the desired tilt angle into the cuvette front surface, relative to the cuvette flow channel, which enables the air/glass interface to remain orthogonal to the objective optical axis, while the three degree tilted surface is placed at the glass/water interface, thereby substantially reducing the residual coma and astigmatism, since the index or refraction mismatch is reduced.
- This TOPTDI systemwas modeled, and PSFs were determined for the matrix of field heights and shifted object positions shown below:
- the blur associated with the wave front distortion inherent in EDF imagingcan be removed through post-processing of the image using de-convolution.
- De-convolutionis the process of enhancing the contrast of a system over some range of frequencies, usually with the objective of overcoming some degradation that has occurred in producing the image data.
- the difficulty with this procedureis that noise, which is often present at those frequencies, is amplified along with any real signal that may be present. Because of this difficulty, it is usually not desirable to attempt to achieve a perfect de-convolution, which would reconstruct a signal exactly as it was before the degradation. Instead, the attempt should be made to achieve some reasonable level of reconstruction that does not result in too large an amplification of the noise.
- the Airy disk diameterincreases, and the energy spreads out into secondary and tertiary rings, covering a larger area, resulting in relatively poorer spatial resolution.
- the radius ( ⁇ ) of the central bright spot of the Airy diskis a function the numerical aperture (NA) of the optical system and the wavelength ( ⁇ ) of light comprising the image, as defined by the following equation:
- the diffraction limited resolution and the depth of focus as defined by Equations 6 and 7are 0.45 microns and +/ ⁇ 0.49 microns, respectively.
- the process of imagingis the mathematical equivalent of convolution.
- the spatial and intensity information contained within the object (250 line pairs/mm bar target) as shown in the leftmost portion of FIG. 8is convolved with the PSF of the optical system, resulting in the image shown in the rightmost portion of FIG. 8 .
- the imageappears very similar to the object, but some contrast is lost and the edges of the bars are not as sharp as in the original object.
- a cellular featuresuch as a FISH spot having an area of less than one micron and located six microns away from the plane of best focus will blur into an area covering more than 100 microns, rendering it unrecognizable to a human observer and making automated detection and enumeration difficult at best. This result can occur when viewing FISH probes located at the periphery of the nucleus.
- Confocal image stacking techniquesavoid this problem by synthesizing an image of the cell with all features simultaneously in focus via the collection of multiple images of the cell at different focal planes.
- an imageis collected by scanning a spot of illumination over the object with a conjugate pinhole located at an intermediate image plane in the collection system.
- the conjugate pinholesubstantially eliminates light from objects outside the focal plane, providing a crisp image of the object structures in the immediate focal plane.
- the convolution process inherent in imagingcan be “undone” through post-processing of the image using de-convolution. This effect can be visually illustrated by reversing the process shown in FIG. 8 , where the PSF can be “removed” via de-convolution from the image in the rightmost portion of FIG. 8 , such that the image appears more like that of the actual object (the leftmost portion of FIG. 8 ).
- de-convolution algorithmscan be applied to an image to minimize the effect of optical system performance limitations, resulting in a better representation of the original spatial and intensity content of the object.
- a convenient method to theoretically evaluate the expected performance of the various EDF methods described aboveis to compare their modulation transfer functions (MTF).
- MTFmodulation transfer functions
- the typical MTF plotprovides a quantitative assessment of contrast over a range of spatial frequencies. For the comparison of the EDF methods discussed above, a single spatial frequency was chosen, and curves were generated for different focus positions. A through-focus MTF plot shows the behavior of the decreasing contrast function on either side of the best focus position.
- the exemplary flow imaging systemutilizes a pixel size of 18 microns at the detector, corresponding to a maximum sampled spatial frequency of 27.8 line pairs/mm at the detector plane.
- FIGS. 10A and 10Bshow a family of curves representing contrast versus focus for the various EDF methods (without PSF de-convolution), as well as the non-EDF version of the exemplary imaging system.
- the standard non-EDF system(solid line) provides the best contrast at the plane of focus. However, the contrast falls off rapidly as the focal position changes. At 2.5 microns of defocus, the standard system provides no contrast in the image. Numerous null contrast points are observed throughout the plotted focal range.
- the TOPTDI (continuous long dash) EDF methodintegrates light from focal planes over a range of ⁇ 5 to +5 microns from best focus. At best focus, the contrast is about 0.2, which is less than one-third of the standard in-focus contrast, but the TOPTDI EDF contrast remains relatively constant over a much wider range of focal positions.
- the WFC EDF methodprovides slightly lower contrast than the TOPTDI EDF method, but with a greater enhancement to the depth of focus.
- the Spherical Aberration EDF methodsacrifices more contrast than either of the other EDF methods modeled here, while providing less improvement to the depth of field. It also exhibits a classical non-symmetrical behavior about the best focus position.
- the lower plot in FIG. 10Billustrates a “modulation normalized” view of the same data, which more clearly shows the relative depth of field enhancements provided by each method.
- FIGS. 11A and 12Ashow simulated point source imagery generated for the various EDF methods using collection parameters associated with the exemplary flow imaging system, including an 18 micron pixel size (0.5 microns in object space), 0.75 counts of random noise per pixel, and the corresponding PSFs for the various focus positions.
- FIG. 11Bshows the results of ten iterations of a Richardson-Lucy de-convolution algorithm applied to each of the EDF images, using the best focus PSF as the de-convolution kernel. The peak intensity (based on a 10 bit A/D conversion) for each thumbnail image is listed above each image. As demonstrated in the upper thumbnail images in FIG.
- the PSF de-convolution processcan recover a high degree of image contrast (673 counts for TOPTDI at 5 microns of defocus versus 801 counts at best focus in the non-EDF image).
- the display of each imageis scaled for visualization purposes, so that the brightest pixel in the image appears black, and the lowest intensity in the background appears white, causing the background noise to appear higher in the cases where the PSF imagery has a lower peak intensity, particularly in the case of standard imagery at five microns of defocus. It should be understood in all cases the noise level in all pre-de-convolved imagery is the same.
- the simulated imageryillustrates the effectiveness of both the TOPTDI EDF and WFC EDF methods in maintaining a constant PSF over an extended focal range.
- the resultsare particularly striking when comparing the de-convolved EDF imagery to the standard imagery at five microns of defocus.
- the peak intensity in the standard imagedrops to 19 counts at the defocus position, while both the TOPTDI EDF and WFC EDF methods produce peak intensities in excess of 350 counts ( FIG. 12B ), resulting in an increase in contrast of more than 30 fold (340 counts vs. 9 counts) for both of these EDF methods (over standard imaging).
- the imagery in the WFC EDF methodexhibits some asymmetrical horizontal and vertical artifacts after processing.
- the artifactsare attenuated by more than an order of magnitude in comparison to the primary image. Optimization of this first-generation WFC element and de-convolution kernel is expected to further reduce these artifacts.
- the induced spherical aberration methodfares better under defocus conditions than the standard optical system, but exhibits much lower contrast with defocus than the other two EDF methods: 151 counts ( FIG. 12B ) vs. ⁇ 350 counts ( FIG. 12B ).
- the WFC EDF methodwas chosen for implementation in an EDF modified version of the empirical imaging system of FIG. 1A , based on its high level of performance in modeling, its flexibility in implementation, and because it offered the ability to custom tailor the degree of depth of field extension to specific applications by employing a choice of any one of multiple WFC elements, each having a different sag function.
- a crossed cubic WFC elementwas procured (available from CDM Optics, Inc., Boulder, Colo.) The element was installed at an external aperture stop in the exemplary flow imaging system, and the PSF of the modified imaging system was measured by running a sample of 200 nanometer diameter fluorescent beads (Invitrogen, FluoSpheresTM carboxylate-modified microspheres, 0.2 ⁇ m, yellow-green, 505/515 2% solids, F-8811), which was prepared at a 10,000:1 dilution, and run on the modified flow imaging system.
- Such beadsare sufficiently small relative to the pixel size and diffraction limited spot size of the exemplary imaging systems optics so as to be considered as point sources.
- FIG. 13A and 13Bshow a small sampling of the PSF imagery collected during the run.
- the form of the PSFcorresponds very closely to the modeled imagery shown in FIG. 11B .
- Approximately 1,000 bead imageswere collected and processed to generate the composite PSF shown in FIG. 13B .
- Processingincluded a linear interpolation of each image to remove shift variance caused by under-sampling, and then spatially aligning each image such that the highest intensity appeared in the same pixel for each image. A mean intensity was then calculated for each pixel to generate the composite PSF used in the subsequent image de-convolution step.
- a simple testwas devised using 2.5 micron diameter fluorescent beads (as manufactured by Invitrogen Inc., Linear Flow Green), 0.1% intensity.
- a filewas collected containing imagery from nine focus positions spaced 2.0 microns apart.
- the exemplary flow imaging system's auto-focus controlwas first enabled to establish the nominal best focus for the beads.
- the auto-focus controlwas then disabled, and the stage was positioned at ⁇ 8.0 microns from best focus.
- Approximately 200 objectswere imaged in darkfield and fluorescence modes at each of the nine focus positions ( ⁇ 8, ⁇ 6, ⁇ 4, ⁇ 2, 0, 2, 4, 6, and 8 microns from best focus), resulting in a file containing 3,600 images over a pan range of 16 microns.
- Two test fileswere collected, one using standard imaging, and one using WFC EDF imaging.
- FIGS. 14A and 14Bshow an image gallery of 8 pairs of consecutively selected beads (16 beads total) from each interval of the focus pan. Darkfield (blue) and fluorescence images (green) are shown for each bead. A gallery of bead images collected using standard imagery are shown in FIG. 14A , and a gallery of bead images collected using WFC EDF imaging are shown in FIG. 14B . As is clearly apparent in FIG. 14B , the WFC EDF imagery maintains a much higher degree of focus over the pan range. Focus blur is present in the standard imagery ( FIG. 14A ) at +/ ⁇ 2 microns of defocus in both darkfield and fluorescent images (objects 701 , 702 , 1102 , and 1103 ).
- the WFC EDF imagery of FIG. 14Bmaintains consistent image characteristics throughout the focus pan with both the bead area and intensity remaining relatively constant throughout the pan. This result is particularly evident in the green fluorescent bead imagery shown in the right hand column of FIG. 14B (in a full color image channel 3 of FIG. 14B corresponds to green spectral images).
- FIGS. 15A , 15 B, 16 A, and 16 Bprovide a quantitative analysis of the entire image set from which the imagery in FIGS. 14A and 14B was selected.
- the peak pixel intensity and area of each objectare plotted against object number for both standard images ( FIGS. 15A and 15B ), and EDF images ( FIGS. 16A and 16B ), where each dot in a dot plot represents a single bead.
- a total of 1,800 objectswere imaged, including approximately 200 objects acquired at each of nine focal positions, with each focal position separated by 2 microns.
- Object # 1 and object # 1800are therefore spaced 16 microns apart, with the best focus position corresponding to object numbers in the range of 800-1,000.
- the dot plot for the standard image set(the upper portion of FIG. 15A ) exhibited nearly a 14-fold decrease in average peak intensity (641 counts vs. 44 counts) between the best focus and the “8 ⁇ m defocus” positions.
- the EDF dot plot(the upper portion of FIG. 16A ) showed only approximately a 2-fold decrease in average peak intensity (613 counts vs. 287 counts) over the same focus pan. Allowing for the increased focal range and the larger bead size, these results were consistent with the theoretical models for the behavior of peak intensity.
- the fluorescent EDF imagery of FIG. 16Bexhibited a consistent area of approximately 24 pixels throughout most of the focus range, rising to 32 pixels at the +8 micron defocus position.
- the dot plot of the standard imagery(the upper portion of FIG. 15B ) exhibited an increase in area of almost 14 times, from 32 pixels to 437 pixels at ⁇ 8 microns of defocus.
- the exemplary flow imaging system with WFC EDF imagingdemonstrates 7-14 times better feature consistency through a depth of field covering the majority of most prokaryotic and eukaryotic cell diameters.
- a statistical analysis of the noise contained in the imagerywas performed by evaluating the standard deviation in background signal outside the bead image for each individual object.
- An analysis of over 2,100 objects for each focus panindicates the median standard deviation in background signal is 0.97 and 1.30 counts, respectively, for the standard and EDF focus pans (identified by ⁇ in each of FIGS. 15A and 16A ).
- the increase in noise of 0.33 countswill degrade the signal-to-noise ratio and therefore, negatively impact the sensitivity of the instrument.
- the degradationwill be greatest for objects located at the best plane of focus.
- the increased signal maintained via EDFshould more than offset the increase in noise.
- Sensitivity studies of the standard exemplary flow imaging systemdemonstrate sensitivity superior to standard flow cytometry and indicate an ability to detect as little as 50 molecules of equivalent soluble fluorescein. Further empirical studies of EDF imaging will include a detailed sensitivity study of the EDF collection mode.
- FISH probesoffer a powerful means for detecting and/or quantifying RNA/DNA in a cell and/or cellular organelle.
- Current slide-based FISH protocolsrequire fixation (e.g., with a polar organic solvent such as methanol) of intact cells.
- fixatione.g., with a polar organic solvent such as methanol
- this fixation stepis not compatible with in-suspension hybridization due to the occurrence of substantial cell loss and cell clumping.
- Fluorescence In Situ Hybridization-In Suspension (FISH-IS) protocols for performing chromosomal detection on whole cells maintained in fluid suspensionhave therefore been developed. These protocols enable the cells to be fixed and hybridized without significant loss of cells or cell clumping.
- FISH-IShas been successfully performed on many different cell types with a variety of probes that are of interest to the clinical and scientific research communities.
- Automated chromosome enumeration via FISH or FISH-IS probingis an application for which EDF imaging may confer significant benefits. Defocus causes significant changes in the presentation of probes often blurring one into another or spreading out the signal to such a degree that it is difficult to automatically segment, or visually separate FISH probes from each other or from non-specific binding in the nucleus.
- the samplewas then loaded into the exemplary flow imaging system, and a file of 1,000 cells was collected in the standard collection mode (i.e., without the optical deformation element in place). A second file was collected from the same sample immediately thereafter using the WFC EDF collection mode. Both files were analyzed in the same manner using IDEASTM software to detect and enumerate chromosome 8 in each cell. Image galleries were generated of cells having one, two, or more copies of chromosome 8. The entire collection time for both files was several minutes (including the time required to switch from standard to EDF modes).
- resultswere automatically analyzed to enumerate copies of the Y chromosome in each cell.
- Simple classifiers using brightfield imagerywere developed to exclude cellular debris, doublet events, and other artifacts from the analysis.
- a specialized segmentation routine and connected components analysiswere performed on the fluorescence imagery to generate a first pass enumeration of chromosomes on single cells.
- a refinement of the monosomy and disomy classified cells from the first pass enumerationwas performed to eliminate false positive events.
- the resulting imagerywas manually reviewed to qualitatively judge the efficacy of the final classification. This analysis was not intended to be a rigorous examination of the efficacy of the exemplary flow imaging system with EDF for chromosome enumeration. Rather, this experiment was performed to explore an application for which the exemplary flow imaging system with WFC EDF imaging may have a beneficial result.
- FIGS. 17A-23Dpresent a brief overview of the analysis of these two files (standard images and EDF images).
- FIGS. 17A and 17Bshows a sampling of 20 cells (10 in each collection mode, i.e., FIG. 17A includes 10 cells obtained using standard imaging and FIG. 17B includes 10 cells obtained using WFC EDF imaging), highlighting some of the challenges in the classification of disomies within the Jurkat sample.
- the FISH-IS probe imageryis superimposed over a reduced contrast brightfield image of the cells (black and white have been reversed to reduce the amount of black in the image, to facilitate reproduction in this patent application) to provide a sense of scale and verify that the probes are located within the cell.
- FIG. 17Athe cell images obtained using standard imaging
- at least one of the FISH-IS probesis positioned out of the plane of focus. Consequently, the area of the out of focus probe increases and sometimes engulfs the second probe in the cell.
- Image 916 of FIG. 17Aincludes a cell in which two probes appear to be in close proximity. Slight defocus may have caused these relatively bright probe images to blur into each other, creating what appears to be a single large probe. Although it cannot be specified with certainty, this cell is thought to have two probes due to the total intensity of the probe signal and the elongated shape of the probe.
- the EDF imagery presented in FIG. 17Bshows discrete FISH-IS spots even when they are positioned in close proximity to each other, as in images 298 and 935 .
- the EDF imagery of FIG. 17Bexhibits little to no blurring of FISH-IS spots. This result is also readily apparent when comparing the larger selection of images shown in FIGS. 22A-23D , wherein each FISH labeled chromosome appears as a bright, tightly focused spot.
- an exemplary, simple five-step classifierwas developed using the IDEASTM analysis software.
- the first two stepsinvolved segmentation and the selection of appropriate objects within the data file for subsequent analysis (the data file includes each image collected from a sample of cells or objects run through the flow imaging system).
- Object selectionwas accomplished by plotting the brightfield aspect ratio vs. brightfield area, as shown in the dot plot in FIG. 18 .
- a gate 156was drawn that encompassed primarily single cells (image 424 being exemplary of a cell in the gated region) and excluded cell fragments/debris (image 845 being exemplary of a cell fragment or debris), and grouped cells (image 75 being exemplary of a grouping or cluster of cells).
- the gatedefined a population named “Cells” containing 595 individual objects, to which subsequent analysis was applied.
- a similar segmentation and selection processwas performed on the standard collection file (i.e., images of cells collected without using EDF imaging) and resulted in 588 individual objects.
- the third step in classification(graphically illustrated in FIGS. 19A-19C ), involved refinement of the standard segmentation mask to isolate areas of local maxima in each fluorescence cell image.
- a fluorescence image 89 of a cell, collected in Channel 3is shown prior to segmentation in FIG. 19A , after initial segmentation (light blue overlay) to identify all areas containing light above background in FIG. 19B , and after morphology segmentation in FIG. 19C (light blue overlay).
- Morphology maskingis a form of contour masking to identify areas of local maxima contained in the initial segmentation mask.
- the fourth step in the exemplary classificationemployed an IDEASTM feature called “FISH Spots,” which uses the morphology mask to perform a connected components analysis to enumerate discrete FISH spots contained within each fluorescent image.
- FISH Spotsuses the morphology mask to perform a connected components analysis to enumerate discrete FISH spots contained within each fluorescent image.
- the results of this computation and the final gating of disomic cells, the fifth step in the classification,are shown in FIG. 20 for normal images, and in FIG. 21 for EDF images.
- the upper leftmost portion of FIGS. 20 and 21respectively correspond to FISH spot enumeration histograms for normal images and EDF images.
- the first pass analysis using the standard collection modeyielded enumerations of 506 monosomic, 67 disomic, and 15 polysomic (three or more FISH spots) cells as shown in the histogram of FIG.
- each population of monosomy and disomy-classified cellswas further analyzed by plotting peak intensity vs. area for the fluorescence channel.
- Non-specific bindinggenerally has low peak intensity and large area, and therefore, plots of peak intensity vs. area improve discrimination of nonspecific binding events.
- Bi-variant plots of this analysisare shown in the middle portion of FIGS. 20 and 21 , for standard images and EDF images, respectively.
- the discrimination boundaries for the standard collection modeare not clear. This result is most evident in a boundary 201 (upper center portion of FIG. 20 ) drawn to discriminate true and false positives for disomy refinement.
- the boundaryis complex and arbitrary and therefore unsuitable for fully automated classification.
- a boundary 203(upper center portion of FIG.
- the refined classificationsresult in 45 (the table in the rightmost portion of FIG. 20 ) and 96 (the table in the rightmost portion of FIG. 21 ) disomy events for the standard and EDF collection modes, respectively and a respective 191 (the table in the center portion of FIG. 20 ) and 189 (the table in the center portion of FIG. 21 ) monosomy events.
- FIGS. 22A-22Ddisplay a random set of images from each set of “Refined” and “False Positive” populations defined in FIG. 20 (i.e., standard images).
- Images in FIG. 22Acorrespond to standard images of cells categorized as Monosomy Refined in the center plot of FIG. 20 .
- Images in FIG. 22Bcorrespond to standard images of cells categorized as Monosomy False Positive in the center plot of FIG. 20 .
- Images in FIG. 22Ccorrespond to standard images of cells categorized as Disomy Refined in the center plot of FIG. 20 .
- Images in FIG. 22Dcorrespond to standard images of cells categorized as Disomy False Positive in the center plot of FIG. 20 .
- FIGS. 23A-23Ddisplay a random set of images from each set of “Refined” and “False Positive” populations defined in FIG. 21 (i.e., standard images).
- Images in FIG. 23Acorrespond to EDF images of cells categorized as Monosomy Refined in the center plot of FIG. 21 .
- Images in FIG. 23Bcorrespond to EDF images of cells categorized as Monosomy False Positive in the center plot of FIG. 21 .
- Images in FIG. 23Ccorrespond to EDF images of cells categorized as Disomy Refined in the center plot of FIG. 21 .
- Images in FIG. 23Dcorrespond to EDF images of cells categorized as Disomy False Positive in the center plot of FIG. 21 .
- FIGS. 22A-23DA review of the imagery in FIGS. 22A-23D sheds light on why the EDF collection mode exhibits a two-fold increase in discrimination of disomic events.
- the EDF collection modelargely eliminated focus variation, producing small, bright, tightly focused spots for each hybridization event, as evident in both “Refined” monosomy and disomy populations ( FIGS. 23A and 23C ).
- these tightly focused spotsdramatically improved the performance of the morphological segmentation algorithm and final classification steps by forming a clear demarcation between well-hybridized probes and non-specific binding events (the plots in the center and rightmost portions of FIG. 21 , respectively).
- Tight focussubstantially reduces the probability of events where a defocused probe image engulfs or contacts a second probe image in the cell.
- a defocused probe imageengulfs or contacts a second probe image in the cell.
- the exemplary flow imaging systemcollects imagery in a flow cuvette with image collection access to all four sides of the cell, unlike slide-based imaging systems, there exists the potential to develop a two-axis orthogonal implementation of the architecture described herein. Coupling a two-axis version of the exemplary flow imaging system architecture (i.e., a flow imaging system such as that shown in FIG. 2 ) with the EDF techniques discussed above would provide a means to perform full 3-D cell mapping and optical sectioning similar to confocal techniques, but at two to three orders of magnitude greater speed and without photo-bleaching.
- Each axiswould collect an EDF projection of the cell from orthogonal perspectives, enabling a 3-D reconstruction of the cell, as is done in optical tomographic methods. However, unlike confocal techniques, this method would provide an isometric perspective with consistent resolution in all axes. Since the cells would be mapped in a single pass, photo-bleaching would be minimized and, with sufficient image processing capacity, tens of thousands of cells could be analyzed in several minutes.
- FIG. 2schematically illustrates such a stereoscopic imaging system.
- FISH-ISwhich provides high throughput automated spot counting of FISH-probed cells in suspension
- Cell Cycle and Mitosis Analysisfor quantization and visualization of DNA-stained cells
- Stem Cell Imagingfor visualization of rare cells
- Phagocytosisfor quantitative analysis of macrophage activity
- Cell Signalingfor imaging and quantization of T-cell/antigen-presenting cell conjugates.
- Standard FISHis increasingly being used for such purposes as prenatal genetic testing, qualifying patients for breast cancer treatment with HerceptinTM, and leukemia lymphoma testing.
- FISH-IS techniquein connection with the exemplary EDF flow imaging system's ability to analyze tens of thousands of cells, will allow the detection of rare target cells for clinical applications like cancer detection as well as the correlation of genetic and phenotypic traits in target validation studies.
- PSFsused for image reconstruction. More specifically, a custom model PSF for each channel will be created, to take into account different focal depths and aberrations which may be present at different wavelengths. Thus, different correct PSFs will be used for post image processing (i.e., image de-convolution). Such PSFs will be tailored to work with a given depth of field, by collecting data from beads over the full depth for which the system is expected to perform.
- FIG. 24schematically illustrates an exemplary computing system 250 suitable for use in implementing the method of FIG. 4 (i.e., for executing step 170 of this method).
- Exemplary computing system 250includes a processing unit 254 that is functionally coupled to an input device 252 and to an output device 262 , e.g., a display (which can be used to output a result to a user, although such a result can also be stored).
- Processing unit 254comprises, for example, a central processing unit (CPU) 258 that executes machine instructions for carrying out an analysis of data collected in connection with operation of the vehicle to determine upon which one of the plurality of predefined routes the vehicle has been operated in conjunction with acquisition of the data.
- the machine instructionsimplement functions generally consistent with those described above with respect to step 170 of FIG. 4 , as well as those at other locations herein with respect to image processing to enhance the EDF image.
- CPUs suitable for this purposeare readily available, for example, from Intel Corporation, AMD Corporation, Motorola Corporation, and other sources, as will be well known to those of ordinary skill in this art.
- RAMrandom access memory
- non-volatile memory 260which can include read only memory (ROM) and may include some form of memory storage, such as a hard drive, an optical disk (and drive), etc.
- RAMrandom access memory
- ROMread only memory
- RAMnon-volatile memory
- Such storage devicesare well known in the art.
- Machine instructions and dataare temporarily loaded into RAM 256 from non-volatile memory 260 .
- an operating system software and ancillary softwareWhile not separately shown, it will be understood that a generally conventional power supply will be included to provide electrical power at a voltage and current level appropriate to energize the components of computing system 250 .
- Input device 252can be any device or mechanism that facilitates user input into the operating environment, including, but not limited to, one or more of a mouse or other pointing device, a keyboard, a microphone, a modem, or other input device.
- the input devicewill be used to initially configure computing system 250 , to achieve the desired processing (e.g., to process image data to produce images as discussed above).
- Configuration of computing system 250 to achieve the desired processingincludes the steps of loading appropriate processing software into non-volatile memory 260 , and launching the processing application (e.g., loading the processing software into RAM 256 for execution by the CPU) so that the processing application is ready for use.
- Output device 262generally includes any device that produces output information, but will most typically comprise a monitor or computer display designed for human visual perception of output. Use of a conventional computer keyboard for input device 252 and a computer display for output device 262 should be considered as exemplary, rather than as limiting on the scope of this system.
- Data link 264is configured to enable image data collected from a flow imaging system to be introduced into computing system 250 for subsequent image processing as discussed above.
- Those of ordinary skill in the artwill readily recognize that many types of data links can be implemented, including, but not limited to, universal serial bus (USB) ports, parallel ports, serial ports, inputs configured to couple with portable memory storage devices, FireWire (conforming to I.E.E.E. 1394 specification) ports, infrared data ports, wireless data ports such as BluetoothTM, network connections such as Ethernet ports, and Internet connections.
- USBuniversal serial bus
- FireWireconforming to I.E.E.E. 1394 specification
- FireWireconforming to I.E.E.E. 1394
Landscapes
- Physics & Mathematics (AREA)
- General Physics & Mathematics (AREA)
- Optics & Photonics (AREA)
- Health & Medical Sciences (AREA)
- Engineering & Computer Science (AREA)
- Multimedia (AREA)
- Chemical & Material Sciences (AREA)
- Analytical Chemistry (AREA)
- Computer Vision & Pattern Recognition (AREA)
- Nuclear Medicine, Radiotherapy & Molecular Imaging (AREA)
- Life Sciences & Earth Sciences (AREA)
- Biochemistry (AREA)
- General Health & Medical Sciences (AREA)
- Immunology (AREA)
- Pathology (AREA)
- Microscoopes, Condenser (AREA)
- Investigating, Analyzing Materials By Fluorescence Or Luminescence (AREA)
- Image Processing (AREA)
Abstract
Description
where n is the refractive index (approximately 1.5) inside the glass.
| Object Field | Object Shift | Object Shift | Object Shift |
| Height (um) | Best Focus +5 um | Best Focus Position | Best Focus −5 um |
| 128 | +10 | +5 | 0 |
| 85.3 | +8.332 | +3.332 | −1.668 |
| 42.7 | +6.668 | +1.668 | −3.332 |
| 0 | +5 | 0 | −5 |
| −42.7 | +3.332 | −1.668 | −6.668 |
| −85.3 | +1.668 | −3.332 | −8.332 |
| −128 | 0 | −5 | −10 |
g=h{circle around (x)}f+n (8)
where {circle around (x)} is the convolution operator. The R-L algorithm attempts to reconstruct f using the following relationship:
and where {circumflex over (f)}kis the estimate of f after k iterations, and * is the correlation operator. Stability is maintained and convergence achieved in 5 iterations by constraining {circumflex over (f)}kto be nonnegative and by normalizing at every step to conserve energy between g and {circumflex over (f)}k
Evaluation of Chromosome Enumeration Using Standard and EDF Imaging
Claims (23)
Priority Applications (2)
| Application Number | Priority Date | Filing Date | Title |
|---|---|---|---|
| US11/609,269US8005314B2 (en) | 2005-12-09 | 2006-12-11 | Extended depth of field imaging for high speed object analysis |
| US12/132,394US8009189B2 (en) | 1999-01-25 | 2008-06-03 | Extended depth of field imaging for high speed object analysis |
Applications Claiming Priority (2)
| Application Number | Priority Date | Filing Date | Title |
|---|---|---|---|
| US74888805P | 2005-12-09 | 2005-12-09 | |
| US11/609,269US8005314B2 (en) | 2005-12-09 | 2006-12-11 | Extended depth of field imaging for high speed object analysis |
Related Parent Applications (1)
| Application Number | Title | Priority Date | Filing Date |
|---|---|---|---|
| US11/123,610ContinuationUS7450229B2 (en) | 1999-01-25 | 2005-05-04 | Methods for analyzing inter-cellular phenomena |
Related Child Applications (1)
| Application Number | Title | Priority Date | Filing Date |
|---|---|---|---|
| US12/132,394ContinuationUS8009189B2 (en) | 1999-01-25 | 2008-06-03 | Extended depth of field imaging for high speed object analysis |
Publications (2)
| Publication Number | Publication Date |
|---|---|
| US20070146873A1 US20070146873A1 (en) | 2007-06-28 |
| US8005314B2true US8005314B2 (en) | 2011-08-23 |
Family
ID=38123665
Family Applications (2)
| Application Number | Title | Priority Date | Filing Date |
|---|---|---|---|
| US11/609,269Active2030-05-31US8005314B2 (en) | 1999-01-25 | 2006-12-11 | Extended depth of field imaging for high speed object analysis |
| US12/132,394Expired - Fee RelatedUS8009189B2 (en) | 1999-01-25 | 2008-06-03 | Extended depth of field imaging for high speed object analysis |
Family Applications After (1)
| Application Number | Title | Priority Date | Filing Date |
|---|---|---|---|
| US12/132,394Expired - Fee RelatedUS8009189B2 (en) | 1999-01-25 | 2008-06-03 | Extended depth of field imaging for high speed object analysis |
Country Status (2)
| Country | Link |
|---|---|
| US (2) | US8005314B2 (en) |
| WO (1) | WO2007067999A2 (en) |
Cited By (12)
| Publication number | Priority date | Publication date | Assignee | Title |
|---|---|---|---|---|
| US8345239B1 (en)* | 2008-08-04 | 2013-01-01 | Fluid Imaging Technologies, Inc. | System and method for monitoring birefringent particles in a fluid |
| US8748789B2 (en) | 2010-03-06 | 2014-06-10 | Illumina, Inc. | Assay instrument for detecting optical signals from samples |
| US8879797B2 (en) | 2012-05-25 | 2014-11-04 | Fluid Imaging Technologies, Inc. | System and method for total internal reflection enhanced imaging flow cytometry |
| US20150042838A1 (en)* | 2012-02-28 | 2015-02-12 | Nikon Corporation | Image processing apparatus |
| US8994945B2 (en) | 2011-10-27 | 2015-03-31 | Fluid Imaging Technologies, Inc. | Method of treatment analysis with particle imaging |
| US9091628B2 (en) | 2012-12-21 | 2015-07-28 | L-3 Communications Security And Detection Systems, Inc. | 3D mapping with two orthogonal imaging views |
| US9151943B2 (en) | 2008-08-04 | 2015-10-06 | Fluid Imaging Technologies, Inc. | System and method for monitoring birefringent particles in a fluid |
| US9706094B2 (en) | 2014-12-05 | 2017-07-11 | National Security Technologies, Llc | Hyperchromatic lens for recording time-resolved phenomena |
| US9983115B2 (en) | 2015-09-21 | 2018-05-29 | Fluid Imaging Technologies, Inc. | System and method for monitoring particles in a fluid using ratiometric cytometry |
| US10386290B2 (en) | 2017-03-31 | 2019-08-20 | Life Technologies Corporation | Apparatuses, systems and methods for imaging flow cytometry |
| US10408676B2 (en) | 2015-10-01 | 2019-09-10 | Mission Support and Test Services, LLC | Long-pulse-width variable-wavelength chirped pulse generator and method |
| US20220057329A1 (en)* | 2018-12-03 | 2022-02-24 | Carl Zeiss Microscopy Gmbh | Method and apparatus for detecting fluorescence signals in a three-dimensional region of a sample |
Families Citing this family (100)
| Publication number | Priority date | Publication date | Assignee | Title |
|---|---|---|---|---|
| US7280207B2 (en) | 2001-07-25 | 2007-10-09 | Applera Corporation | Time-delay integration in a flow cytometry system |
| US8953866B2 (en)* | 2004-03-16 | 2015-02-10 | Amnis Corporation | Method for imaging and differential analysis of cells |
| US9068917B1 (en)* | 2006-03-14 | 2015-06-30 | Kla-Tencor Technologies Corp. | Systems and methods for inspection of a specimen |
| JP2008177064A (en)* | 2007-01-19 | 2008-07-31 | Hitachi High-Technologies Corp | Scanning charged particle microscope apparatus and method for processing images acquired by scanning charged particle microscope apparatus |
| US8237776B2 (en)* | 2007-10-19 | 2012-08-07 | Warner Bros. Entertainment Inc. | Method and apparatus for generating stereoscopic images from a DVD disc |
| US7835561B2 (en)* | 2007-05-18 | 2010-11-16 | Visiongate, Inc. | Method for image processing and reconstruction of images for optical tomography |
| US8917901B2 (en)* | 2007-07-18 | 2014-12-23 | Iatia Imaging Pty Ltd. | Method and apparatus for determining the surface profile of an object |
| US8088593B2 (en) | 2007-10-02 | 2012-01-03 | Theranos, Inc. | Modular point-of-care devices, systems, and uses thereof |
| US7787112B2 (en) | 2007-10-22 | 2010-08-31 | Visiongate, Inc. | Depth of field extension for optical tomography |
| WO2009073649A1 (en)* | 2007-12-04 | 2009-06-11 | Particle Measuring Systems, Inc. | Non-orthogonal particle detection systems and methods |
| US8143600B2 (en) | 2008-02-18 | 2012-03-27 | Visiongate, Inc. | 3D imaging of live cells with ultraviolet radiation |
| US8090183B2 (en) | 2009-03-12 | 2012-01-03 | Visiongate, Inc. | Pattern noise correction for pseudo projections |
| US8039817B2 (en)* | 2008-05-05 | 2011-10-18 | Illumina, Inc. | Compensator for multiple surface imaging |
| US8331712B2 (en)* | 2008-06-25 | 2012-12-11 | Industrial Technology Research Institute | Method for designing computational optical imaging system |
| WO2010014244A2 (en)* | 2008-07-30 | 2010-02-04 | The Regents Of The University Of California, San Francisco | Multidirectional selective plane illumination microscopy |
| US8502877B2 (en) | 2008-08-28 | 2013-08-06 | Kyocera Corporation | Image pickup apparatus electronic device and image aberration control method |
| US8254023B2 (en)* | 2009-02-23 | 2012-08-28 | Visiongate, Inc. | Optical tomography system with high-speed scanner |
| DE102009020252B4 (en)* | 2009-05-07 | 2012-01-12 | Krohne Optosens Gmbh | Device for measuring the fluorescence of a medium |
| US8155420B2 (en) | 2009-05-21 | 2012-04-10 | Visiongate, Inc | System and method for detecting poor quality in 3D reconstructions |
| US8526754B2 (en)* | 2009-05-28 | 2013-09-03 | Aptina Imaging Corporation | System for enhancing depth of field with digital image processing |
| JP5497386B2 (en)* | 2009-09-11 | 2014-05-21 | 浜松ホトニクス株式会社 | Image acquisition device |
| US20110091125A1 (en)* | 2009-10-15 | 2011-04-21 | General Electric Company | System and method for imaging with enhanced depth of field |
| US8314837B2 (en)* | 2009-10-15 | 2012-11-20 | General Electric Company | System and method for imaging with enhanced depth of field |
| US20110090327A1 (en)* | 2009-10-15 | 2011-04-21 | General Electric Company | System and method for imaging with enhanced depth of field |
| JP5537347B2 (en)* | 2009-11-30 | 2014-07-02 | シスメックス株式会社 | Particle analyzer |
| US20110261179A1 (en)* | 2010-04-22 | 2011-10-27 | General Electric Company | Imaging system for fluorescence guided surgery based on fixed magnification lens and digital zoom |
| WO2011152523A1 (en)* | 2010-06-03 | 2011-12-08 | 株式会社ニコン | Microscope device |
| JP5945282B2 (en) | 2011-01-21 | 2016-07-05 | セラノス, インコーポレイテッド | System and method for maximizing sample usage |
| JP5832433B2 (en)* | 2011-01-31 | 2015-12-16 | パナソニック株式会社 | Image restoration device, imaging device, and image restoration method |
| JP5547105B2 (en)* | 2011-02-01 | 2014-07-09 | 株式会社キーエンス | Dimension measuring apparatus, dimension measuring method and program for dimension measuring apparatus |
| US8633969B2 (en) | 2011-02-09 | 2014-01-21 | Omnivision Technologies, Inc. | Apparatus and method for three-dimensional image capture with extended depth of field |
| WO2012120470A1 (en)* | 2011-03-10 | 2012-09-13 | Optika Amuka (A.A.) Ltd. | Stereographic viewing with extended depth of field |
| TWI654419B (en) | 2011-08-29 | 2019-03-21 | 美商安美基公司 | Method and apparatus for non-destructive detection - undissolved particles in a fluid |
| US8475739B2 (en) | 2011-09-25 | 2013-07-02 | Theranos, Inc. | Systems and methods for fluid handling |
| US20140170735A1 (en) | 2011-09-25 | 2014-06-19 | Elizabeth A. Holmes | Systems and methods for multi-analysis |
| US9664702B2 (en) | 2011-09-25 | 2017-05-30 | Theranos, Inc. | Fluid handling apparatus and configurations |
| US9632102B2 (en) | 2011-09-25 | 2017-04-25 | Theranos, Inc. | Systems and methods for multi-purpose analysis |
| WO2013041951A1 (en)* | 2011-09-22 | 2013-03-28 | Foce Technology International Bv | Optical platelet counter method |
| US9810704B2 (en) | 2013-02-18 | 2017-11-07 | Theranos, Inc. | Systems and methods for multi-analysis |
| US10012664B2 (en) | 2011-09-25 | 2018-07-03 | Theranos Ip Company, Llc | Systems and methods for fluid and component handling |
| IN2014CN03228A (en)* | 2011-10-05 | 2015-07-03 | Cireca Theranostics Llc | |
| US9693034B2 (en)* | 2011-12-13 | 2017-06-27 | The Board Of Trustees Of The Leland Stanford Junior University | Apparatus and method for localizing objects for distance and/or in three dimensions using a spiral point spread function |
| US20130281858A1 (en)* | 2012-04-19 | 2013-10-24 | Industrial Technology Research Institute | Method for increasing depth of field and ultrasound imaging system using the same |
| US9746412B2 (en) | 2012-05-30 | 2017-08-29 | Iris International, Inc. | Flow cytometer |
| US8994809B2 (en)* | 2012-07-19 | 2015-03-31 | Sony Corporation | Method and apparatus for simulating depth of field (DOF) in microscopy |
| AU2013322130B2 (en) | 2012-09-30 | 2017-03-09 | Optica Amuka (A.A.) Ltd. | Lenses with electrically-tunable power and alignment |
| US11126040B2 (en) | 2012-09-30 | 2021-09-21 | Optica Amuka (A.A.) Ltd. | Electrically-tunable lenses and lens systems |
| US9798918B2 (en)* | 2012-10-05 | 2017-10-24 | Cireca Theranostics, Llc | Method and system for analyzing biological specimens by spectral imaging |
| EP2926558B1 (en)* | 2012-11-30 | 2018-01-31 | L & T Technology Services Limited | A method and system for extended depth of field calculation for microscopic images |
| US9897792B2 (en) | 2012-11-30 | 2018-02-20 | L&T Technology Services Limited | Method and system for extended depth of field calculation for microscopic images |
| DE102013106895B4 (en)* | 2013-07-01 | 2015-09-17 | Leica Microsystems Cms Gmbh | Light microscopic method for the localization of point objects |
| CN103400345A (en)* | 2013-07-18 | 2013-11-20 | 西南交通大学 | Method for lowering TDI-CCD (time delay integration-charge coupled device) camera image ambiguity |
| US10422806B1 (en) | 2013-07-25 | 2019-09-24 | Theranos Ip Company, Llc | Methods for improving assays of biological samples |
| US20150034613A1 (en)* | 2013-08-02 | 2015-02-05 | Rofin-Sinar Technologies Inc. | System for performing laser filamentation within transparent materials |
| KR20160117440A (en) | 2013-12-31 | 2016-10-10 | 메모리얼 슬로안-케터링 캔서 센터 | Systems, methods, and apparatus for multichannel imaging of fluorescent sources in real-time |
| US9584730B2 (en)* | 2014-02-03 | 2017-02-28 | Cognex Corporation | Apparatus, systems, and methods for a multi-position image sensor |
| US9810893B2 (en) | 2014-03-27 | 2017-11-07 | The Board Of Trustees Of The Leland Stanford Junior University | Phase mask imaging with characterization of rotational mobility |
| EP3152602B1 (en) | 2014-06-05 | 2019-03-20 | Optica Amuka (A.A.) Ltd. | Dynamic lenses and method of manufacturing thereof |
| JP6104475B2 (en) | 2014-08-28 | 2017-04-05 | シスメックス株式会社 | Particle imaging apparatus and particle imaging method |
| US10761011B2 (en) | 2015-02-24 | 2020-09-01 | The University Of Tokyo | Dynamic high-speed high-sensitivity imaging device and imaging method |
| US10187626B2 (en) | 2015-04-10 | 2019-01-22 | The Board Of Trustees Of The Leland Stanford Junior University | Apparatuses and methods for three-dimensional imaging of an object |
| EP3088863A1 (en) | 2015-05-01 | 2016-11-02 | Malvern Instruments Limited | Improvements relating to particle characterisation |
| EP3372985B1 (en) | 2015-10-28 | 2025-06-25 | The University Of Tokyo | Analysis device |
| US11069054B2 (en) | 2015-12-30 | 2021-07-20 | Visiongate, Inc. | System and method for automated detection and monitoring of dysplasia and administration of immunotherapy and chemotherapy |
| JP6742783B2 (en)* | 2016-04-01 | 2020-08-19 | 株式会社ミツトヨ | Imaging system and imaging method |
| ES2904889T3 (en) | 2016-04-17 | 2022-04-06 | Optica Amuka A A Ltd | Spectacle lens comprising an improved electrically actuated liquid crystal lens |
| US10339595B2 (en) | 2016-05-09 | 2019-07-02 | Grabango Co. | System and method for computer vision driven applications within an environment |
| WO2017216716A1 (en) | 2016-06-16 | 2017-12-21 | Optica Amuka (A.A.) Ltd. | Tunable lenses for spectacles |
| WO2018013439A1 (en) | 2016-07-09 | 2018-01-18 | Grabango Co. | Remote state following devices |
| CN113406004A (en) | 2016-08-15 | 2021-09-17 | 国立大学法人大阪大学 | Electromagnetic wave phase amplitude generating apparatus, method and non-transitory recording medium |
| EP3306317A1 (en)* | 2016-10-04 | 2018-04-11 | Université de Bordeaux | Novel real-time multiplexed, multi-color bioluminescence resonance energy transfer assay, apparatus, and uses thereof |
| WO2018148613A1 (en) | 2017-02-10 | 2018-08-16 | Grabango Co. | A dynamic customer checkout experience within an automated shopping environment |
| US10088660B2 (en) | 2017-02-10 | 2018-10-02 | Amgen Inc. | Imaging system for counting and sizing particles in fluid-filled vessels |
| AU2017202910A1 (en)* | 2017-05-02 | 2018-11-22 | Canon Kabushiki Kaisha | Image processing for turbulence compensation |
| US10778906B2 (en) | 2017-05-10 | 2020-09-15 | Grabango Co. | Series-configured camera array for efficient deployment |
| IL271528B2 (en) | 2017-06-21 | 2024-08-01 | Grabango Co | Linking observed human activity on video to a user account |
| US11953764B2 (en) | 2017-07-10 | 2024-04-09 | Optica Amuka (A.A.) Ltd. | Tunable lenses with enhanced performance features |
| US11747619B2 (en) | 2017-07-10 | 2023-09-05 | Optica Amuka (A.A.) Ltd. | Virtual reality and augmented reality systems with dynamic vision correction |
| WO2019021621A1 (en)* | 2017-07-26 | 2019-01-31 | 浜松ホトニクス株式会社 | Sample observation device and sample observation method |
| US20190079591A1 (en) | 2017-09-14 | 2019-03-14 | Grabango Co. | System and method for human gesture processing from video input |
| WO2019077442A1 (en) | 2017-10-16 | 2019-04-25 | Optica Amuka (A.A.) Ltd. | Spectacles with electrically-tunable lenses controllable by an external system |
| US10963704B2 (en) | 2017-10-16 | 2021-03-30 | Grabango Co. | Multiple-factor verification for vision-based systems |
| US11481805B2 (en) | 2018-01-03 | 2022-10-25 | Grabango Co. | Marketing and couponing in a retail environment using computer vision |
| US11408814B2 (en)* | 2018-03-18 | 2022-08-09 | Technion Research & Development Foundation Limited | Apparatus and methods for high throughput three-dimensional imaging |
| WO2019234916A1 (en)* | 2018-06-08 | 2019-12-12 | オリンパス株式会社 | Observation device |
| GB2592113B (en) | 2018-06-13 | 2023-01-11 | Thinkcyte Inc | Methods and systems for cytometry |
| EP3624047B1 (en)* | 2018-09-14 | 2022-08-10 | Leica Microsystems CMS GmbH | Deconvolution apparatus and method using a local signal-to-noise ratio |
| US11288648B2 (en) | 2018-10-29 | 2022-03-29 | Grabango Co. | Commerce automation for a fueling station |
| CN109557653B (en)* | 2018-12-20 | 2021-06-29 | 浙江大学 | A differential confocal microscopy imaging method and device based on algorithm recovery |
| AU2020231365A1 (en) | 2019-03-01 | 2021-09-16 | Grabango Co. | Cashier interface for linking customers to virtual data |
| EP3977199A4 (en) | 2019-06-02 | 2023-06-14 | Optica Amuka (A.A.) Ltd. | Electrically-tunable vision aid for treatment of myopia |
| KR102597470B1 (en)* | 2019-06-05 | 2023-11-03 | 삼성전자주식회사 | Metohod for determining depth map and electronic device applying the method |
| CN112529951B (en) | 2019-09-18 | 2024-06-25 | 华为技术有限公司 | Method, device and electronic device for acquiring extended depth of field image |
| US11125675B2 (en)* | 2019-10-18 | 2021-09-21 | Roger Lawrence Deran | Fluid suspended particle classifier |
| WO2021132484A1 (en) | 2019-12-27 | 2021-07-01 | シンクサイト株式会社 | Flow cytometer performance evaluation method and standard particle suspension |
| WO2021200911A1 (en) | 2020-04-01 | 2021-10-07 | シンクサイト株式会社 | Flow cytometer |
| WO2021200960A1 (en) | 2020-04-01 | 2021-10-07 | シンクサイト株式会社 | Observation device |
| JP7432182B2 (en) | 2020-10-18 | 2024-02-16 | エイアイエックスメド・インコーポレイテッド | Method and system for acquiring cytology images in cytopathology examination |
| IL303323A (en)* | 2020-12-27 | 2023-07-01 | Diptera Ai Ltd | Optical means for examining snails and fish |
| CN114279568B (en)* | 2022-03-04 | 2022-07-29 | 清华大学 | Multispectral imaging method, device and equipment for encoding compression based on chromatic dispersion |
Citations (137)
| Publication number | Priority date | Publication date | Assignee | Title |
|---|---|---|---|---|
| US3497690A (en) | 1967-09-21 | 1970-02-24 | Bausch & Lomb | Method and apparatus for classifying biological cells by measuring the size and fluorescent response thereof |
| US3555280A (en) | 1966-04-19 | 1971-01-12 | Hycon Mfg Co | Automatic focus sensor and control |
| US3586760A (en) | 1967-09-26 | 1971-06-22 | Fernseh Gmbh | Color television camera generating uniform lag color component signals |
| US3922069A (en) | 1973-04-09 | 1975-11-25 | Fuji Photo Optical Co Ltd | Color separating prism system |
| US4313734A (en) | 1978-07-13 | 1982-02-02 | Akzona Incorporated | Metal sol particle immunoassay |
| US4414575A (en) | 1980-11-21 | 1983-11-08 | Hitachi Denshi Kabushiki Kaisha | Autofocus system |
| US4635293A (en) | 1984-02-24 | 1987-01-06 | Kabushiki Kaisha Toshiba | Image processing system |
| US4662742A (en) | 1985-05-10 | 1987-05-05 | Becton, Dickinson And Company | Scatter/fluorescene beam splitter in a flow cytometry apparatus |
| US4677680A (en) | 1982-08-31 | 1987-06-30 | Dai Nippon Insatsu Kabushiki Kaisha | Method and device for inspecting image |
| US4703017A (en) | 1984-02-14 | 1987-10-27 | Becton Dickinson And Company | Solid phase assay with visual readout |
| US4737932A (en) | 1984-06-05 | 1988-04-12 | Nec Corporation | Processor |
| US4770992A (en) | 1985-11-27 | 1988-09-13 | Den Engh Gerrit J Van | Detection of specific DNA sequences by flow cytometry |
| US4777525A (en) | 1985-12-23 | 1988-10-11 | Preston Jr Kendall | Apparatus and method for a multi-resolution electro-optical imaging, display and storage/retrieval system |
| US4786165A (en) | 1986-07-10 | 1988-11-22 | Toa Medical Electronics Co., Ltd. | Flow cytometry and apparatus therefor |
| US4845197A (en) | 1985-09-09 | 1989-07-04 | Agri-Diagnostics Associates | Monoclonal antibodies and methods for fungal pathogen detection |
| US4857453A (en) | 1987-04-07 | 1989-08-15 | Syntex (U.S.A.) Inc. | Immunoassay device |
| US5096807A (en) | 1985-03-06 | 1992-03-17 | Murex Corporation | Imaging immunoassay detection system with background compensation and its use |
| US5107522A (en) | 1990-02-05 | 1992-04-21 | Sharp Kabushiki Kaisha | Automatic frequency control circuit |
| US5122453A (en) | 1984-03-28 | 1992-06-16 | Technicon Instruments Corporation | Method for discriminating surface stained lymphocytes |
| US5141609A (en) | 1990-11-16 | 1992-08-25 | The Trustees Of The Leland Stanford Junior University | Method and device employing time-delayed integration for detecting sample components after separation |
| US5153916A (en) | 1990-04-20 | 1992-10-06 | Hitachi, Ltd. | Method and apparatus for detecting focal plane |
| US5159642A (en) | 1990-07-13 | 1992-10-27 | Toa Medical Electronics Co., Ltd. | Particle image analyzing apparatus |
| US5159397A (en) | 1991-02-27 | 1992-10-27 | Toa Medical Electronics Co., Ltd. | Flow imaging cytometer |
| US5159398A (en) | 1991-02-27 | 1992-10-27 | Toa Medical Electronics Co., Ltd. | Flow imaging cytometer |
| EP0281327B1 (en) | 1987-02-27 | 1993-06-30 | EASTMAN KODAK COMPANY (a New Jersey corporation) | Immunoreactive reagent, method of preparation and its use to determine an immunoreactive species |
| US5247339A (en) | 1991-02-27 | 1993-09-21 | Toa Medical Electronics Co., Ltd. | Flow imaging cytometer |
| US5247340A (en) | 1991-02-27 | 1993-09-21 | Toa Medical Electronics Co., Ltd. | Flow imaging cytometer |
| EP0280559B1 (en) | 1987-02-27 | 1993-10-20 | EASTMAN KODAK COMPANY (a New Jersey corporation) | Agglutination immunoassay and kit for determination of a multivalent immune species using a buffered salt wash solution |
| US5257182A (en) | 1991-01-29 | 1993-10-26 | Neuromedical Systems, Inc. | Morphological classification system and method |
| US5272354A (en) | 1991-11-20 | 1993-12-21 | Toa Medical Electronics Co., Ltd. | Apparatus for imaging particles in a liquid flow |
| US5351311A (en) | 1992-07-28 | 1994-09-27 | The United States Of America As Represented By The Secretary Of The Navy | Neural network for detection and correction of local boundary misalignments between images |
| US5372936A (en) | 1989-05-12 | 1994-12-13 | Avl Photoronics Corporation | Method for detecting biological activities in a specimen |
| US5422712A (en) | 1992-04-01 | 1995-06-06 | Toa Medical Electronics Co., Ltd. | Apparatus for measuring fluorescent spectra of particles in a flow |
| US5436144A (en) | 1991-04-08 | 1995-07-25 | Health Research, Inc. | Process for performing PCR in mammalian cells |
| US5444527A (en) | 1992-06-12 | 1995-08-22 | Toa Medical Electronics Co., Ltd. | Imaging flow cytometer for imaging and analyzing particle components in a liquid sample |
| US5459240A (en) | 1986-01-21 | 1995-10-17 | Foxwell; Brian M. J. | Peptides which serve as substrates for a phosphokinase and methods for their use to modify antibodies in order to facilitate radioabelling of antibodies with 32 P |
| US5471294A (en) | 1991-10-24 | 1995-11-28 | Toa Medical Electronics Co., Ltd. | Flow imaging cytometer |
| EP0372707B1 (en) | 1988-10-28 | 1996-03-06 | Pestka Biomedical Laboratories, Inc. | Modified proteins, modified interferons, alphas and beta, phosphorylated proteins and analogues, DNA sequences, applications and uses thereof |
| US5547849A (en) | 1993-02-17 | 1996-08-20 | Biometric Imaging, Inc. | Apparatus and method for volumetric capillary cytometry |
| US5548395A (en) | 1991-09-20 | 1996-08-20 | Toa Medical Electronics Co., Ltd. | Particle analyzer |
| US5548349A (en) | 1993-12-27 | 1996-08-20 | Sharp Kabushiki Kaisha | Transmission type color liquid display apparatus with first and second lens layers located between a white light source and the display device |
| US5568315A (en) | 1991-05-28 | 1996-10-22 | Discovision Associates | Optical beamsplitter |
| US5596401A (en) | 1993-09-16 | 1997-01-21 | Toa Medical Electronics Co., Ltd. | Particle analyzing apparatus using a coherence lowering device |
| US5621460A (en) | 1994-10-11 | 1997-04-15 | Lockheed Martin Corporation | Optical differentiation between plants and background utilizing a single CCD camera |
| US5625048A (en) | 1994-11-10 | 1997-04-29 | The Regents Of The University Of California | Modified green fluorescent proteins |
| US5633503A (en) | 1993-11-26 | 1997-05-27 | Toa Medical Electronics Co., Ltd. | Particle analyzer |
| US5644388A (en) | 1994-04-19 | 1997-07-01 | Toa Medical Electronics Co., Ltd. | Imaging flow cytometer nearly simultaneously capturing a plurality of images |
| US5674743A (en) | 1993-02-01 | 1997-10-07 | Seq, Ltd. | Methods and apparatus for DNA sequencing |
| US5686960A (en) | 1992-01-14 | 1997-11-11 | Michael Sussman | Image input device having optical deflection elements for capturing multiple sub-images |
| US5695934A (en) | 1994-10-13 | 1997-12-09 | Lynx Therapeutics, Inc. | Massively parallel sequencing of sorted polynucleotides |
| US5733721A (en) | 1992-11-20 | 1998-03-31 | The Board Of Regents Of The University Of Oklahoma | Cell analysis method using quantitative fluorescence image analysis |
| US5754291A (en) | 1996-09-19 | 1998-05-19 | Molecular Dynamics, Inc. | Micro-imaging system |
| US5760899A (en) | 1996-09-04 | 1998-06-02 | Erim International, Inc. | High-sensitivity multispectral sensor |
| US5764792A (en) | 1996-01-19 | 1998-06-09 | Oncor, Inc. | Method and apparatus for processing images |
| US5784162A (en) | 1993-08-18 | 1998-07-21 | Applied Spectral Imaging Ltd. | Spectral bio-imaging methods for biological research, medical diagnostics and therapy |
| US5828776A (en) | 1994-09-20 | 1998-10-27 | Neopath, Inc. | Apparatus for identification and integration of multiple cell patterns |
| US5831723A (en) | 1996-04-03 | 1998-11-03 | Toa Medical Electronics Co., Ltd. | Particle analyzer |
| US5844670A (en) | 1995-07-28 | 1998-12-01 | Ricoh Co., Ltd. | Method of and systems for measuring eccentricity of an aspherical lens surface |
| US5848123A (en) | 1995-11-21 | 1998-12-08 | Planmed Oy | Methods and apparatus for use in imaging an object |
| US5855753A (en) | 1996-11-26 | 1999-01-05 | The Trustees Of Princeton University | Method for electrohydrodynamically assembling patterned colloidal structures |
| US5900942A (en) | 1997-09-26 | 1999-05-04 | The United States Of America As Represented By Administrator Of National Aeronautics And Space Administration | Multi spectral imaging system |
| US5926283A (en) | 1997-07-12 | 1999-07-20 | Optical Insights, Llc | Multi-spectral two dimensional imaging spectrometer |
| US5929986A (en) | 1996-08-26 | 1999-07-27 | Kaiser Optical Systems, Inc. | Synchronous spectral line imaging methods and apparatus |
| US5959953A (en) | 1996-07-03 | 1999-09-28 | Zen Research Nv | Methods and apparatus for performing cross-talk correction in a multi-track optical disk reader based on magnification error |
| US5986061A (en) | 1988-10-28 | 1999-11-16 | Pbl Biomedical Laboratories | Phosphorylated fusion proteins |
| US5985549A (en) | 1985-10-22 | 1999-11-16 | University Of Massachusetts | Non-isotopic in-situ hybridization method for detection of nucleic acids |
| US6007994A (en) | 1995-12-22 | 1999-12-28 | Yale University | Multiparametric fluorescence in situ hybridization |
| US6014468A (en) | 1997-07-31 | 2000-01-11 | The Regents Of The University Of California | Apparatus and methods for image and signal processing |
| US6066459A (en) | 1993-08-18 | 2000-05-23 | Applied Spectral Imaging Ltd. | Method for simultaneous detection of multiple fluorophores for in situ hybridization and multicolor chromosome painting and banding |
| US6108082A (en) | 1998-01-07 | 2000-08-22 | Bio-Rad Laboratories | Spectral imaging apparatus and methodology |
| US6115119A (en) | 1997-10-21 | 2000-09-05 | Bigelow Laboratory For Ocean Science | Device and method for studying particles in a fluid |
| US6116739A (en) | 1998-03-26 | 2000-09-12 | Minolta Co., Ltd. | Color projection display apparatus |
| US6156465A (en) | 1999-04-12 | 2000-12-05 | Cymbolic Sciences Inc. | Crosstalk correction |
| US6159686A (en) | 1992-09-14 | 2000-12-12 | Sri International | Up-converting reporters for biological and other assays |
| US6211955B1 (en) | 2000-01-24 | 2001-04-03 | Amnis Corporation | Imaging and analyzing parameters of small moving objects such as cells |
| US6210973B1 (en) | 1994-12-05 | 2001-04-03 | John W. Pettit | Method for automated flourescent tagged sample detecting |
| US6229913B1 (en) | 1995-06-07 | 2001-05-08 | The Trustees Of Columbia University In The City Of New York | Apparatus and methods for determining the three-dimensional shape of an object using active illumination and relative blurring in two-images due to defocus |
| US6249314B1 (en) | 1994-05-27 | 2001-06-19 | Matsushita Electric Industrial Co., Ltd. | Solid-state imaging apparatus having a solid-state imaging device and a signal processing circuit and method for driving the solid-state imaging device |
| US6256096B1 (en) | 1999-01-11 | 2001-07-03 | Softray | Flow cytometry apparatus and method |
| US20010006416A1 (en) | 1999-01-11 | 2001-07-05 | Johnson Paul E. | Ribbon flow cytometry apparatus and methods |
| US6259807B1 (en) | 1997-05-14 | 2001-07-10 | Applied Imaging Corp. | Identification of objects of interest using multiple illumination schemes and finding overlap of features in corresponding multiple images |
| US20010012620A1 (en) | 1998-06-03 | 2001-08-09 | Rich Ivan N. | Method of reducing cell proliferation by inducing apoptosis in differentially selected cell subpopulations |
| US6330361B1 (en) | 1999-03-16 | 2001-12-11 | Litton Systems, Inc. | Adaptively aligned optical correlator and method |
| US6330081B1 (en) | 1998-11-20 | 2001-12-11 | Agfa Corporation | Crosstalk cancellation in a multi-color CCD signal processor |
| US6381363B1 (en) | 1999-03-15 | 2002-04-30 | Grass Valley (U.S.), Inc. | Histogram-based segmentation of images and video via color moments |
| US20020126275A1 (en) | 2001-03-12 | 2002-09-12 | Johnson Paul E. | LED illuminated particle detection apparatus and methods |
| US20020146734A1 (en) | 2001-02-21 | 2002-10-10 | Amnis Corporation | Method and apparatus for labeling and analyzing cellular components |
| US6473176B2 (en) | 1999-01-25 | 2002-10-29 | Amnis Corporation | Imaging and analyzing parameters of small moving objects such as cells |
| US20020196980A1 (en) | 2001-01-19 | 2002-12-26 | Dowski Edward Raymond | Combined wavefront coding and amplitude contrast imaging systems |
| US6507391B2 (en) | 2000-08-25 | 2003-01-14 | Amnis Corporation | Measuring the velocity of small moving objects such as cells |
| US6510319B2 (en) | 1998-02-05 | 2003-01-21 | Lucent Technologies Inc. | Method for optimizing forward link power levels during soft handoffs in a wireless telecommunications network |
| US6519355B2 (en) | 2001-03-28 | 2003-02-11 | Alan C. Nelson | Optical projection imaging system and method for automatically detecting cells having nuclear and cytoplasmic densitometric features associated with disease |
| US6522781B1 (en) | 1998-12-10 | 2003-02-18 | Sysmex Corporation | Particle image analyzer |
| US20030048931A1 (en) | 2001-03-23 | 2003-03-13 | Peter Johnson | Quantification and differentiation of tissue based upon quantitative image analysis |
| US20030049701A1 (en) | 2000-09-29 | 2003-03-13 | Muraca Patrick J. | Oncology tissue microarrays |
| US20030059093A1 (en) | 2001-03-26 | 2003-03-27 | Cellomics, Inc. | Methods for determining the organization of a cellular component of interest |
| US6549664B1 (en) | 1998-12-31 | 2003-04-15 | Siros Technologies, Inc. | Sparse modulation codes for holographic data storage |
| US6563583B2 (en) | 2000-10-12 | 2003-05-13 | Amnis Corporation | Multipass cavity for illumination and excitation of moving objects |
| EP1316793A1 (en) | 2001-12-03 | 2003-06-04 | Christian Leist | Process and apparatus for characterization of a collection of cells |
| US20030104439A1 (en) | 2001-11-30 | 2003-06-05 | Finch Rosalynde J. | Methods of identifying cellular target molecules |
| US6580504B1 (en) | 1999-01-25 | 2003-06-17 | Amnis Corporation | Multipass cavity for illumination and excitation of moving objects |
| US6583865B2 (en) | 2000-08-25 | 2003-06-24 | Amnis Corporation | Alternative detector configuration and mode of operation of a time delay integration particle analyzer |
| US6608680B2 (en) | 2000-08-25 | 2003-08-19 | Amnis Corporation | TDI imaging system for kinetic studies |
| US6608682B2 (en) | 1999-01-25 | 2003-08-19 | Amnis Corporation | Imaging and analyzing parameters of small moving objects such as cells |
| US6618140B2 (en) | 2001-06-18 | 2003-09-09 | Amnis Corporation | Spectral deconvolution of fluorescent markers |
| US6620591B1 (en) | 1997-02-27 | 2003-09-16 | Cellomics, Inc. | System for cell-based screening |
| US6658143B2 (en) | 2002-04-29 | 2003-12-02 | Amersham Biosciences Corp. | Ray-based image analysis for biological specimens |
| US6671624B1 (en) | 1997-02-27 | 2003-12-30 | Cellomics, Inc. | Machine readable storage media for detecting distribution of macromolecules between nucleus and cytoplasm in cells |
| US6671044B2 (en) | 1999-01-25 | 2003-12-30 | Amnis Corporation | Imaging and analyzing parameters of small moving objects such as cells in broad flat flow |
| US6707551B2 (en) | 2000-01-24 | 2004-03-16 | Amnis Corporation | Multipass cavity for illumination and excitation of moving objects |
| US6716588B2 (en) | 1999-12-09 | 2004-04-06 | Cellomics, Inc. | System for cell-based screening |
| US6727066B2 (en) | 2000-07-28 | 2004-04-27 | Incyte Corporation | Genes expressed in treated human C3A liver cell cultures |
| US20040093166A1 (en) | 2002-09-13 | 2004-05-13 | Kil David H. | Interactive and automated tissue image analysis with global training database and variable-abstraction processing in cytological specimen classification and laser capture microdissection applications |
| US20040111220A1 (en) | 1999-02-19 | 2004-06-10 | Fox Chase Cancer Center | Methods of decomposing complex data |
| US6763149B2 (en) | 2001-04-25 | 2004-07-13 | Amnis Corporation | Method and apparatus for correcting crosstalk and spatial resolution for multichannel imaging |
| US6778263B2 (en) | 2000-08-25 | 2004-08-17 | Amnis Corporation | Methods of calibrating an imaging system using calibration beads |
| US20040228005A1 (en) | 2003-03-28 | 2004-11-18 | Dowski Edward Raymond | Mechanically-adjustable optical phase filters for modifying depth of field, aberration-tolerance, anti-aliasing in optical systems |
| US20040241759A1 (en) | 1997-06-16 | 2004-12-02 | Eileen Tozer | High throughput screening of libraries |
| US20050014129A1 (en) | 2001-08-06 | 2005-01-20 | David Cliffel | Device and methods for detecting the response of a plurality of cells to at least one analyte of interest |
| US6875973B2 (en) | 2000-08-25 | 2005-04-05 | Amnis Corporation | Auto focus for a flow imaging system |
| EP0950890B1 (en) | 1998-04-13 | 2005-06-22 | Sysmex Corporation | Particle imaging apparatus |
| US6927922B2 (en) | 2001-12-18 | 2005-08-09 | The University Of Rochester | Imaging using a multifocal aspheric lens to obtain extended depth of field |
| US6934408B2 (en) | 2000-08-25 | 2005-08-23 | Amnis Corporation | Method and apparatus for reading reporter labeled beads |
| US6975400B2 (en) | 1999-01-25 | 2005-12-13 | Amnis Corporation | Imaging and analyzing parameters of small moving objects such as cells |
| US7033819B2 (en) | 2000-11-08 | 2006-04-25 | Surface Logix, Inc. | System for monitoring cell motility in real-time |
| US7042639B1 (en) | 2003-08-21 | 2006-05-09 | The United States Of America As Represented By The Administrator Of Nasa | Identification of cells with a compact microscope imaging system with intelligent controls |
| US7050620B2 (en) | 2001-03-30 | 2006-05-23 | Heckman Carol A | Method of assaying shape and structural features in cells |
| US7057732B2 (en) | 1999-01-25 | 2006-06-06 | Amnis Corporation | Imaging platform for nanoparticle detection applied to SPR biomolecular interaction analysis |
| US20060257884A1 (en) | 2004-05-20 | 2006-11-16 | Amnis Corporation | Methods for preparing and analyzing cells having chromosomal abnormalities |
| US7139415B2 (en) | 2001-12-05 | 2006-11-21 | The Regents Of The University Of California | Robotic microscopy systems |
| US20070054350A1 (en) | 2003-03-27 | 2007-03-08 | Walker Fitz Jr | System and method for rapidly identifying pathogens, bacteria and abnormal cells |
| US7190832B2 (en) | 2001-07-17 | 2007-03-13 | Amnis Corporation | Computational methods for the segmentation of images of objects from background in a flow imaging instrument |
| US7289205B2 (en) | 2003-09-19 | 2007-10-30 | The General Hospital Corporation | Fluorescence polarization imaging devices and methods |
| US20080240539A1 (en) | 2004-03-16 | 2008-10-02 | Amins Corporation | Method For Imaging And Differential Analysis Of Cells |
| US7450229B2 (en) | 1999-01-25 | 2008-11-11 | Amnis Corporation | Methods for analyzing inter-cellular phenomena |
| US20090202130A1 (en) | 2004-03-16 | 2009-08-13 | Amnis Corporation | Image based quantitation of molecular translocation |
| US7667761B2 (en) | 2004-07-06 | 2010-02-23 | Cairn Research Limited | Optical imaging device for splitting an initial image into at least two images |
Family Cites Families (11)
| Publication number | Priority date | Publication date | Assignee | Title |
|---|---|---|---|---|
| DE3737989C1 (en)* | 1987-11-09 | 1989-05-11 | Messwandler Bau Ag | High voltage converter |
| DE4229930C1 (en)* | 1992-09-08 | 1993-04-29 | Mercedes-Benz Aktiengesellschaft, 7000 Stuttgart, De | |
| US5412200A (en)* | 1993-03-01 | 1995-05-02 | Rhoads; Geoffrey B. | Wide field distortion-compensating imaging system and methods |
| US5448053A (en)* | 1993-03-01 | 1995-09-05 | Rhoads; Geoffrey B. | Method and apparatus for wide field distortion-compensated imaging |
| US6084227A (en)* | 1995-01-30 | 2000-07-04 | Rhoads; Geoffrey B. | Method and apparatus for wide field distortion-compensated imaging |
| US5760901A (en)* | 1997-01-28 | 1998-06-02 | Zetetic Institute | Method and apparatus for confocal interference microscopy with background amplitude reduction and compensation |
| US6086064A (en)* | 1998-09-28 | 2000-07-11 | Xerox Corporation | Object position/presence sensor and method for detecting object position or presence |
| DE10209715A1 (en)* | 2002-03-06 | 2003-09-18 | Kramski Gmbh | Process for the production and / or processing of connector parts in progressive tools |
| US7260251B2 (en)* | 2003-03-31 | 2007-08-21 | Cdm Optics, Inc. | Systems and methods for minimizing aberrating effects in imaging systems |
| US7336430B2 (en)* | 2004-09-03 | 2008-02-26 | Micron Technology, Inc. | Extended depth of field using a multi-focal length lens with a controlled range of spherical aberration and a centrally obscured aperture |
| US8502877B2 (en)* | 2008-08-28 | 2013-08-06 | Kyocera Corporation | Image pickup apparatus electronic device and image aberration control method |
- 2006
- 2006-12-11USUS11/609,269patent/US8005314B2/enactiveActive
- 2006-12-11WOPCT/US2006/061871patent/WO2007067999A2/enactiveApplication Filing
- 2008
- 2008-06-03USUS12/132,394patent/US8009189B2/ennot_activeExpired - Fee Related
Patent Citations (155)
| Publication number | Priority date | Publication date | Assignee | Title |
|---|---|---|---|---|
| US3555280A (en) | 1966-04-19 | 1971-01-12 | Hycon Mfg Co | Automatic focus sensor and control |
| US3497690A (en) | 1967-09-21 | 1970-02-24 | Bausch & Lomb | Method and apparatus for classifying biological cells by measuring the size and fluorescent response thereof |
| US3586760A (en) | 1967-09-26 | 1971-06-22 | Fernseh Gmbh | Color television camera generating uniform lag color component signals |
| US3922069A (en) | 1973-04-09 | 1975-11-25 | Fuji Photo Optical Co Ltd | Color separating prism system |
| US4313734A (en) | 1978-07-13 | 1982-02-02 | Akzona Incorporated | Metal sol particle immunoassay |
| US4414575A (en) | 1980-11-21 | 1983-11-08 | Hitachi Denshi Kabushiki Kaisha | Autofocus system |
| US4677680A (en) | 1982-08-31 | 1987-06-30 | Dai Nippon Insatsu Kabushiki Kaisha | Method and device for inspecting image |
| US4703017A (en) | 1984-02-14 | 1987-10-27 | Becton Dickinson And Company | Solid phase assay with visual readout |
| US4703017C1 (en) | 1984-02-14 | 2001-12-04 | Becton Dickinson Co | Solid phase assay with visual readout |
| EP0154404B1 (en) | 1984-02-24 | 1991-06-12 | Kabushiki Kaisha Toshiba | Processing system for aligning two picture images |
| US4635293A (en) | 1984-02-24 | 1987-01-06 | Kabushiki Kaisha Toshiba | Image processing system |
| US5122453A (en) | 1984-03-28 | 1992-06-16 | Technicon Instruments Corporation | Method for discriminating surface stained lymphocytes |
| US4737932A (en) | 1984-06-05 | 1988-04-12 | Nec Corporation | Processor |
| US5096807A (en) | 1985-03-06 | 1992-03-17 | Murex Corporation | Imaging immunoassay detection system with background compensation and its use |
| US4662742A (en) | 1985-05-10 | 1987-05-05 | Becton, Dickinson And Company | Scatter/fluorescene beam splitter in a flow cytometry apparatus |
| US4845197A (en) | 1985-09-09 | 1989-07-04 | Agri-Diagnostics Associates | Monoclonal antibodies and methods for fungal pathogen detection |
| US5985549A (en) | 1985-10-22 | 1999-11-16 | University Of Massachusetts | Non-isotopic in-situ hybridization method for detection of nucleic acids |
| US4770992A (en) | 1985-11-27 | 1988-09-13 | Den Engh Gerrit J Van | Detection of specific DNA sequences by flow cytometry |
| US4777525A (en) | 1985-12-23 | 1988-10-11 | Preston Jr Kendall | Apparatus and method for a multi-resolution electro-optical imaging, display and storage/retrieval system |
| US5459240A (en) | 1986-01-21 | 1995-10-17 | Foxwell; Brian M. J. | Peptides which serve as substrates for a phosphokinase and methods for their use to modify antibodies in order to facilitate radioabelling of antibodies with 32 P |
| US4786165A (en) | 1986-07-10 | 1988-11-22 | Toa Medical Electronics Co., Ltd. | Flow cytometry and apparatus therefor |
| EP0281327B1 (en) | 1987-02-27 | 1993-06-30 | EASTMAN KODAK COMPANY (a New Jersey corporation) | Immunoreactive reagent, method of preparation and its use to determine an immunoreactive species |
| EP0280559B1 (en) | 1987-02-27 | 1993-10-20 | EASTMAN KODAK COMPANY (a New Jersey corporation) | Agglutination immunoassay and kit for determination of a multivalent immune species using a buffered salt wash solution |
| US4857453A (en) | 1987-04-07 | 1989-08-15 | Syntex (U.S.A.) Inc. | Immunoassay device |
| US5986061A (en) | 1988-10-28 | 1999-11-16 | Pbl Biomedical Laboratories | Phosphorylated fusion proteins |
| EP0372707B1 (en) | 1988-10-28 | 1996-03-06 | Pestka Biomedical Laboratories, Inc. | Modified proteins, modified interferons, alphas and beta, phosphorylated proteins and analogues, DNA sequences, applications and uses thereof |
| US5372936A (en) | 1989-05-12 | 1994-12-13 | Avl Photoronics Corporation | Method for detecting biological activities in a specimen |
| US5107522A (en) | 1990-02-05 | 1992-04-21 | Sharp Kabushiki Kaisha | Automatic frequency control circuit |
| US5153916A (en) | 1990-04-20 | 1992-10-06 | Hitachi, Ltd. | Method and apparatus for detecting focal plane |
| US5159642A (en) | 1990-07-13 | 1992-10-27 | Toa Medical Electronics Co., Ltd. | Particle image analyzing apparatus |
| US5141609A (en) | 1990-11-16 | 1992-08-25 | The Trustees Of The Leland Stanford Junior University | Method and device employing time-delayed integration for detecting sample components after separation |
| US5257182B1 (en) | 1991-01-29 | 1996-05-07 | Neuromedical Systems Inc | Morphological classification system and method |
| US5257182A (en) | 1991-01-29 | 1993-10-26 | Neuromedical Systems, Inc. | Morphological classification system and method |
| US5247340A (en) | 1991-02-27 | 1993-09-21 | Toa Medical Electronics Co., Ltd. | Flow imaging cytometer |
| US5247339A (en) | 1991-02-27 | 1993-09-21 | Toa Medical Electronics Co., Ltd. | Flow imaging cytometer |
| US5159398A (en) | 1991-02-27 | 1992-10-27 | Toa Medical Electronics Co., Ltd. | Flow imaging cytometer |
| US5159397A (en) | 1991-02-27 | 1992-10-27 | Toa Medical Electronics Co., Ltd. | Flow imaging cytometer |
| US5436144A (en) | 1991-04-08 | 1995-07-25 | Health Research, Inc. | Process for performing PCR in mammalian cells |
| US5568315A (en) | 1991-05-28 | 1996-10-22 | Discovision Associates | Optical beamsplitter |
| US5548395A (en) | 1991-09-20 | 1996-08-20 | Toa Medical Electronics Co., Ltd. | Particle analyzer |
| US5471294A (en) | 1991-10-24 | 1995-11-28 | Toa Medical Electronics Co., Ltd. | Flow imaging cytometer |
| US5272354A (en) | 1991-11-20 | 1993-12-21 | Toa Medical Electronics Co., Ltd. | Apparatus for imaging particles in a liquid flow |
| USRE35868E (en) | 1991-11-20 | 1998-08-11 | Toa Medical Electronics Co., Ltd. | Apparatus for imaging particles in a liquid flow |
| US5686960A (en) | 1992-01-14 | 1997-11-11 | Michael Sussman | Image input device having optical deflection elements for capturing multiple sub-images |
| US5422712A (en) | 1992-04-01 | 1995-06-06 | Toa Medical Electronics Co., Ltd. | Apparatus for measuring fluorescent spectra of particles in a flow |
| US5444527A (en) | 1992-06-12 | 1995-08-22 | Toa Medical Electronics Co., Ltd. | Imaging flow cytometer for imaging and analyzing particle components in a liquid sample |
| US5351311A (en) | 1992-07-28 | 1994-09-27 | The United States Of America As Represented By The Secretary Of The Navy | Neural network for detection and correction of local boundary misalignments between images |
| US6159686A (en) | 1992-09-14 | 2000-12-12 | Sri International | Up-converting reporters for biological and other assays |
| US5733721A (en) | 1992-11-20 | 1998-03-31 | The Board Of Regents Of The University Of Oklahoma | Cell analysis method using quantitative fluorescence image analysis |
| US5674743A (en) | 1993-02-01 | 1997-10-07 | Seq, Ltd. | Methods and apparatus for DNA sequencing |
| US5547849A (en) | 1993-02-17 | 1996-08-20 | Biometric Imaging, Inc. | Apparatus and method for volumetric capillary cytometry |
| US5784162A (en) | 1993-08-18 | 1998-07-21 | Applied Spectral Imaging Ltd. | Spectral bio-imaging methods for biological research, medical diagnostics and therapy |
| US6066459A (en) | 1993-08-18 | 2000-05-23 | Applied Spectral Imaging Ltd. | Method for simultaneous detection of multiple fluorophores for in situ hybridization and multicolor chromosome painting and banding |
| US5596401A (en) | 1993-09-16 | 1997-01-21 | Toa Medical Electronics Co., Ltd. | Particle analyzing apparatus using a coherence lowering device |
| US5633503A (en) | 1993-11-26 | 1997-05-27 | Toa Medical Electronics Co., Ltd. | Particle analyzer |
| US5548349A (en) | 1993-12-27 | 1996-08-20 | Sharp Kabushiki Kaisha | Transmission type color liquid display apparatus with first and second lens layers located between a white light source and the display device |
| US5644388A (en) | 1994-04-19 | 1997-07-01 | Toa Medical Electronics Co., Ltd. | Imaging flow cytometer nearly simultaneously capturing a plurality of images |
| US6249314B1 (en) | 1994-05-27 | 2001-06-19 | Matsushita Electric Industrial Co., Ltd. | Solid-state imaging apparatus having a solid-state imaging device and a signal processing circuit and method for driving the solid-state imaging device |
| US5828776A (en) | 1994-09-20 | 1998-10-27 | Neopath, Inc. | Apparatus for identification and integration of multiple cell patterns |
| US5621460A (en) | 1994-10-11 | 1997-04-15 | Lockheed Martin Corporation | Optical differentiation between plants and background utilizing a single CCD camera |
| US5695934A (en) | 1994-10-13 | 1997-12-09 | Lynx Therapeutics, Inc. | Massively parallel sequencing of sorted polynucleotides |
| US5625048A (en) | 1994-11-10 | 1997-04-29 | The Regents Of The University Of California | Modified green fluorescent proteins |
| US6210973B1 (en) | 1994-12-05 | 2001-04-03 | John W. Pettit | Method for automated flourescent tagged sample detecting |
| US6229913B1 (en) | 1995-06-07 | 2001-05-08 | The Trustees Of Columbia University In The City Of New York | Apparatus and methods for determining the three-dimensional shape of an object using active illumination and relative blurring in two-images due to defocus |
| US5844670A (en) | 1995-07-28 | 1998-12-01 | Ricoh Co., Ltd. | Method of and systems for measuring eccentricity of an aspherical lens surface |
| US5848123A (en) | 1995-11-21 | 1998-12-08 | Planmed Oy | Methods and apparatus for use in imaging an object |
| US6007996A (en) | 1995-12-12 | 1999-12-28 | Applied Spectral Imaging Ltd. | In situ method of analyzing cells |
| US6548259B2 (en) | 1995-12-22 | 2003-04-15 | Yale University | Multiparametric fluorescence in situ hybridization |
| US6007994A (en) | 1995-12-22 | 1999-12-28 | Yale University | Multiparametric fluorescence in situ hybridization |
| US5764792A (en) | 1996-01-19 | 1998-06-09 | Oncor, Inc. | Method and apparatus for processing images |
| US5831723A (en) | 1996-04-03 | 1998-11-03 | Toa Medical Electronics Co., Ltd. | Particle analyzer |
| US5959953A (en) | 1996-07-03 | 1999-09-28 | Zen Research Nv | Methods and apparatus for performing cross-talk correction in a multi-track optical disk reader based on magnification error |
| US5929986A (en) | 1996-08-26 | 1999-07-27 | Kaiser Optical Systems, Inc. | Synchronous spectral line imaging methods and apparatus |
| US5760899A (en) | 1996-09-04 | 1998-06-02 | Erim International, Inc. | High-sensitivity multispectral sensor |
| US5754291A (en) | 1996-09-19 | 1998-05-19 | Molecular Dynamics, Inc. | Micro-imaging system |
| US5855753A (en) | 1996-11-26 | 1999-01-05 | The Trustees Of Princeton University | Method for electrohydrodynamically assembling patterned colloidal structures |
| US6671624B1 (en) | 1997-02-27 | 2003-12-30 | Cellomics, Inc. | Machine readable storage media for detecting distribution of macromolecules between nucleus and cytoplasm in cells |
| US6620591B1 (en) | 1997-02-27 | 2003-09-16 | Cellomics, Inc. | System for cell-based screening |
| US6259807B1 (en) | 1997-05-14 | 2001-07-10 | Applied Imaging Corp. | Identification of objects of interest using multiple illumination schemes and finding overlap of features in corresponding multiple images |
| US20040241759A1 (en) | 1997-06-16 | 2004-12-02 | Eileen Tozer | High throughput screening of libraries |
| US5926283A (en) | 1997-07-12 | 1999-07-20 | Optical Insights, Llc | Multi-spectral two dimensional imaging spectrometer |
| US6014468A (en) | 1997-07-31 | 2000-01-11 | The Regents Of The University Of California | Apparatus and methods for image and signal processing |
| US5900942A (en) | 1997-09-26 | 1999-05-04 | The United States Of America As Represented By Administrator Of National Aeronautics And Space Administration | Multi spectral imaging system |
| US6115119A (en) | 1997-10-21 | 2000-09-05 | Bigelow Laboratory For Ocean Science | Device and method for studying particles in a fluid |
| US6108082A (en) | 1998-01-07 | 2000-08-22 | Bio-Rad Laboratories | Spectral imaging apparatus and methodology |
| US6510319B2 (en) | 1998-02-05 | 2003-01-21 | Lucent Technologies Inc. | Method for optimizing forward link power levels during soft handoffs in a wireless telecommunications network |
| US6116739A (en) | 1998-03-26 | 2000-09-12 | Minolta Co., Ltd. | Color projection display apparatus |
| EP0950890B1 (en) | 1998-04-13 | 2005-06-22 | Sysmex Corporation | Particle imaging apparatus |
| US20010012620A1 (en) | 1998-06-03 | 2001-08-09 | Rich Ivan N. | Method of reducing cell proliferation by inducing apoptosis in differentially selected cell subpopulations |
| US6330081B1 (en) | 1998-11-20 | 2001-12-11 | Agfa Corporation | Crosstalk cancellation in a multi-color CCD signal processor |
| US6522781B1 (en) | 1998-12-10 | 2003-02-18 | Sysmex Corporation | Particle image analyzer |
| US6549664B1 (en) | 1998-12-31 | 2003-04-15 | Siros Technologies, Inc. | Sparse modulation codes for holographic data storage |
| US20010006416A1 (en) | 1999-01-11 | 2001-07-05 | Johnson Paul E. | Ribbon flow cytometry apparatus and methods |
| US6256096B1 (en) | 1999-01-11 | 2001-07-03 | Softray | Flow cytometry apparatus and method |
| US6975400B2 (en) | 1999-01-25 | 2005-12-13 | Amnis Corporation | Imaging and analyzing parameters of small moving objects such as cells |
| US6249341B1 (en) | 1999-01-25 | 2001-06-19 | Amnis Corporation | Imaging and analyzing parameters of small moving objects such as cells |
| US7450229B2 (en) | 1999-01-25 | 2008-11-11 | Amnis Corporation | Methods for analyzing inter-cellular phenomena |
| US7315357B2 (en) | 1999-01-25 | 2008-01-01 | Amnis Corporation | Imaging and analyzing parameters of small moving objects such as cells |
| US6473176B2 (en) | 1999-01-25 | 2002-10-29 | Amnis Corporation | Imaging and analyzing parameters of small moving objects such as cells |
| US7221457B2 (en) | 1999-01-25 | 2007-05-22 | Amnis Corporation | Imaging platform for nanoparticle detection applied to SPR biomolecular interaction analysis |
| US7057732B2 (en) | 1999-01-25 | 2006-06-06 | Amnis Corporation | Imaging platform for nanoparticle detection applied to SPR biomolecular interaction analysis |
| US6580504B1 (en) | 1999-01-25 | 2003-06-17 | Amnis Corporation | Multipass cavity for illumination and excitation of moving objects |
| US6947136B2 (en) | 1999-01-25 | 2005-09-20 | Amnis Corporation | Multipass cavity for illumination and excitation of moving objects |
| US6608682B2 (en) | 1999-01-25 | 2003-08-19 | Amnis Corporation | Imaging and analyzing parameters of small moving objects such as cells |
| US6671044B2 (en) | 1999-01-25 | 2003-12-30 | Amnis Corporation | Imaging and analyzing parameters of small moving objects such as cells in broad flat flow |
| US20040111220A1 (en) | 1999-02-19 | 2004-06-10 | Fox Chase Cancer Center | Methods of decomposing complex data |
| US6381363B1 (en) | 1999-03-15 | 2002-04-30 | Grass Valley (U.S.), Inc. | Histogram-based segmentation of images and video via color moments |
| US6330361B1 (en) | 1999-03-16 | 2001-12-11 | Litton Systems, Inc. | Adaptively aligned optical correlator and method |
| US6156465A (en) | 1999-04-12 | 2000-12-05 | Cymbolic Sciences Inc. | Crosstalk correction |
| US6716588B2 (en) | 1999-12-09 | 2004-04-06 | Cellomics, Inc. | System for cell-based screening |
| US6707551B2 (en) | 2000-01-24 | 2004-03-16 | Amnis Corporation | Multipass cavity for illumination and excitation of moving objects |
| US6211955B1 (en) | 2000-01-24 | 2001-04-03 | Amnis Corporation | Imaging and analyzing parameters of small moving objects such as cells |
| US6727066B2 (en) | 2000-07-28 | 2004-04-27 | Incyte Corporation | Genes expressed in treated human C3A liver cell cultures |
| US7087877B2 (en) | 2000-08-25 | 2006-08-08 | Amnis Corporation | Auto focus for a flow imaging system |
| US6875973B2 (en) | 2000-08-25 | 2005-04-05 | Amnis Corporation | Auto focus for a flow imaging system |
| US6507391B2 (en) | 2000-08-25 | 2003-01-14 | Amnis Corporation | Measuring the velocity of small moving objects such as cells |
| US6608680B2 (en) | 2000-08-25 | 2003-08-19 | Amnis Corporation | TDI imaging system for kinetic studies |
| US6583865B2 (en) | 2000-08-25 | 2003-06-24 | Amnis Corporation | Alternative detector configuration and mode of operation of a time delay integration particle analyzer |
| US6532061B2 (en) | 2000-08-25 | 2003-03-11 | Amnis Corporation | Measuring the velocity of small moving objects such as cells |
| US7567695B2 (en) | 2000-08-25 | 2009-07-28 | Amnis Corporation | Method and apparatus for reading reporter labeled beads |
| US6947128B2 (en) | 2000-08-25 | 2005-09-20 | Amnis Corporation | Alternative detector configuration and mode of operation of a time delay integration particle analyzer |
| US6934408B2 (en) | 2000-08-25 | 2005-08-23 | Amnis Corporation | Method and apparatus for reading reporter labeled beads |
| US6778263B2 (en) | 2000-08-25 | 2004-08-17 | Amnis Corporation | Methods of calibrating an imaging system using calibration beads |
| US6906792B2 (en) | 2000-08-25 | 2005-06-14 | Amnis Corporation | Methods of calibrating an imaging system using calibration beads |
| US20030049701A1 (en) | 2000-09-29 | 2003-03-13 | Muraca Patrick J. | Oncology tissue microarrays |
| US6563583B2 (en) | 2000-10-12 | 2003-05-13 | Amnis Corporation | Multipass cavity for illumination and excitation of moving objects |
| US7033819B2 (en) | 2000-11-08 | 2006-04-25 | Surface Logix, Inc. | System for monitoring cell motility in real-time |
| US20020196980A1 (en) | 2001-01-19 | 2002-12-26 | Dowski Edward Raymond | Combined wavefront coding and amplitude contrast imaging systems |
| US20020146734A1 (en) | 2001-02-21 | 2002-10-10 | Amnis Corporation | Method and apparatus for labeling and analyzing cellular components |
| US20020126275A1 (en) | 2001-03-12 | 2002-09-12 | Johnson Paul E. | LED illuminated particle detection apparatus and methods |
| US20030048931A1 (en) | 2001-03-23 | 2003-03-13 | Peter Johnson | Quantification and differentiation of tissue based upon quantitative image analysis |
| US20030059093A1 (en) | 2001-03-26 | 2003-03-27 | Cellomics, Inc. | Methods for determining the organization of a cellular component of interest |
| US6519355B2 (en) | 2001-03-28 | 2003-02-11 | Alan C. Nelson | Optical projection imaging system and method for automatically detecting cells having nuclear and cytoplasmic densitometric features associated with disease |
| US7050620B2 (en) | 2001-03-30 | 2006-05-23 | Heckman Carol A | Method of assaying shape and structural features in cells |
| US7006710B2 (en) | 2001-04-25 | 2006-02-28 | Amnis Corporation | Method and apparatus for correcting crosstalk and spatial resolution for multichannel imaging |
| US6763149B2 (en) | 2001-04-25 | 2004-07-13 | Amnis Corporation | Method and apparatus for correcting crosstalk and spatial resolution for multichannel imaging |
| US7079708B2 (en) | 2001-04-25 | 2006-07-18 | Amnis Corporation | Method and apparatus for correcting crosstalk and spatial resolution for multichannel imaging |
| US6618140B2 (en) | 2001-06-18 | 2003-09-09 | Amnis Corporation | Spectral deconvolution of fluorescent markers |
| US7190832B2 (en) | 2001-07-17 | 2007-03-13 | Amnis Corporation | Computational methods for the segmentation of images of objects from background in a flow imaging instrument |
| US20050014129A1 (en) | 2001-08-06 | 2005-01-20 | David Cliffel | Device and methods for detecting the response of a plurality of cells to at least one analyte of interest |
| US20030104439A1 (en) | 2001-11-30 | 2003-06-05 | Finch Rosalynde J. | Methods of identifying cellular target molecules |
| US20060246481A1 (en) | 2001-11-30 | 2006-11-02 | Amnis Corporation | Methods of identifying cellular target molecules |
| EP1316793A1 (en) | 2001-12-03 | 2003-06-04 | Christian Leist | Process and apparatus for characterization of a collection of cells |
| US7139415B2 (en) | 2001-12-05 | 2006-11-21 | The Regents Of The University Of California | Robotic microscopy systems |
| US6927922B2 (en) | 2001-12-18 | 2005-08-09 | The University Of Rochester | Imaging using a multifocal aspheric lens to obtain extended depth of field |
| US6658143B2 (en) | 2002-04-29 | 2003-12-02 | Amersham Biosciences Corp. | Ray-based image analysis for biological specimens |
| US20040093166A1 (en) | 2002-09-13 | 2004-05-13 | Kil David H. | Interactive and automated tissue image analysis with global training database and variable-abstraction processing in cytological specimen classification and laser capture microdissection applications |
| US20070054350A1 (en) | 2003-03-27 | 2007-03-08 | Walker Fitz Jr | System and method for rapidly identifying pathogens, bacteria and abnormal cells |
| US20040228005A1 (en) | 2003-03-28 | 2004-11-18 | Dowski Edward Raymond | Mechanically-adjustable optical phase filters for modifying depth of field, aberration-tolerance, anti-aliasing in optical systems |
| US7042639B1 (en) | 2003-08-21 | 2006-05-09 | The United States Of America As Represented By The Administrator Of Nasa | Identification of cells with a compact microscope imaging system with intelligent controls |
| US7289205B2 (en) | 2003-09-19 | 2007-10-30 | The General Hospital Corporation | Fluorescence polarization imaging devices and methods |
| US20080240539A1 (en) | 2004-03-16 | 2008-10-02 | Amins Corporation | Method For Imaging And Differential Analysis Of Cells |
| US20090202130A1 (en) | 2004-03-16 | 2009-08-13 | Amnis Corporation | Image based quantitation of molecular translocation |
| US20060257884A1 (en) | 2004-05-20 | 2006-11-16 | Amnis Corporation | Methods for preparing and analyzing cells having chromosomal abnormalities |
| US7667761B2 (en) | 2004-07-06 | 2010-02-23 | Cairn Research Limited | Optical imaging device for splitting an initial image into at least two images |
Non-Patent Citations (69)
Cited By (19)
| Publication number | Priority date | Publication date | Assignee | Title |
|---|---|---|---|---|
| US9151943B2 (en) | 2008-08-04 | 2015-10-06 | Fluid Imaging Technologies, Inc. | System and method for monitoring birefringent particles in a fluid |
| US8345239B1 (en)* | 2008-08-04 | 2013-01-01 | Fluid Imaging Technologies, Inc. | System and method for monitoring birefringent particles in a fluid |
| US8748789B2 (en) | 2010-03-06 | 2014-06-10 | Illumina, Inc. | Assay instrument for detecting optical signals from samples |
| US9139875B2 (en) | 2010-03-06 | 2015-09-22 | Illumina, Inc. | Assay instrument for detecting optical signals from samples having a controlled optics adjustment system based on the priority statuses of the samples |
| US8994945B2 (en) | 2011-10-27 | 2015-03-31 | Fluid Imaging Technologies, Inc. | Method of treatment analysis with particle imaging |
| US10587798B2 (en)* | 2012-02-28 | 2020-03-10 | Nikon Corporation | Image processing apparatus |
| US20150042838A1 (en)* | 2012-02-28 | 2015-02-12 | Nikon Corporation | Image processing apparatus |
| US8879797B2 (en) | 2012-05-25 | 2014-11-04 | Fluid Imaging Technologies, Inc. | System and method for total internal reflection enhanced imaging flow cytometry |
| US9091628B2 (en) | 2012-12-21 | 2015-07-28 | L-3 Communications Security And Detection Systems, Inc. | 3D mapping with two orthogonal imaging views |
| US9706094B2 (en) | 2014-12-05 | 2017-07-11 | National Security Technologies, Llc | Hyperchromatic lens for recording time-resolved phenomena |
| US9983115B2 (en) | 2015-09-21 | 2018-05-29 | Fluid Imaging Technologies, Inc. | System and method for monitoring particles in a fluid using ratiometric cytometry |
| US10408676B2 (en) | 2015-10-01 | 2019-09-10 | Mission Support and Test Services, LLC | Long-pulse-width variable-wavelength chirped pulse generator and method |
| US10386290B2 (en) | 2017-03-31 | 2019-08-20 | Life Technologies Corporation | Apparatuses, systems and methods for imaging flow cytometry |
| US10545085B2 (en) | 2017-03-31 | 2020-01-28 | Life Technologies Corporation | Apparatuses, systems and methods for imaging flow cytometry |
| US10969326B2 (en) | 2017-03-31 | 2021-04-06 | Life Technologies Corporation | Apparatuses, systems and methods for imaging flow cytometry |
| US11566995B2 (en) | 2017-03-31 | 2023-01-31 | Life Technologies Corporation | Apparatuses, systems and methods for imaging flow cytometry |
| US11940371B2 (en) | 2017-03-31 | 2024-03-26 | Life Technologies Corporation | Apparatuses, systems and methods for imaging flow cytometry |
| US12352682B2 (en) | 2017-03-31 | 2025-07-08 | Life Technologies Corporation | Apparatuses, systems and methods for imaging flow cytometry |
| US20220057329A1 (en)* | 2018-12-03 | 2022-02-24 | Carl Zeiss Microscopy Gmbh | Method and apparatus for detecting fluorescence signals in a three-dimensional region of a sample |
Also Published As
| Publication number | Publication date |
|---|---|
| US8009189B2 (en) | 2011-08-30 |
| WO2007067999A2 (en) | 2007-06-14 |
| WO2007067999A3 (en) | 2007-11-29 |
| US20080234984A1 (en) | 2008-09-25 |
| US20070146873A1 (en) | 2007-06-28 |
Similar Documents
| Publication | Publication Date | Title |
|---|---|---|
| US8005314B2 (en) | Extended depth of field imaging for high speed object analysis | |
| Ortyn et al. | Extended depth of field imaging for high speed cell analysis | |
| JP4806630B2 (en) | A method for acquiring optical image data of three-dimensional objects using multi-axis integration | |
| Bolte et al. | A guided tour into subcellular colocalization analysis in light microscopy | |
| AU2003260751B2 (en) | Optical projection tomography | |
| EP2516994B1 (en) | System and method for imaging using dense-stochastic-sampling | |
| EP2908166B1 (en) | Confocal optical scanner | |
| WO2020041517A9 (en) | Systems and methods for enhanced imaging and analysis | |
| US20030020908A1 (en) | Spectral deconvolution of fluorescent markers | |
| US9581548B2 (en) | Methods for resolving positions in fluorescence stochastic microscopy using three-dimensional structured illumination | |
| CA2353543A1 (en) | Computerized adaptive imaging | |
| EP4014198B1 (en) | Sample imaging via two-pass light-field reconstruction | |
| US11933707B2 (en) | Depicting of objects | |
| US11340057B2 (en) | Systems and methods for interferometric multifocus microscopy | |
| CN113906284A (en) | Hyperspectral quantitative imaging cytometry system | |
| JP2025530978A (en) | Computational microscopy methods and systems for volumetric imaging. | |
| US12105270B2 (en) | Low numerical aperture lens based oblique plane illumination imaging | |
| Pankajakshan et al. | Parametric blind deconvolution for confocal laser scanning microscopy (CLSM)-proof of concept | |
| CN117169216A (en) | Super-resolution microscopic imaging system with hyperspectral structured light illumination | |
| Matyska | Simulation of optical aberrations in confocal microscopy |
Legal Events
| Date | Code | Title | Description |
|---|---|---|---|
| AS | Assignment | Owner name:AMNIS CORPORATION, WASHINGTON Free format text:ASSIGNMENT OF ASSIGNORS INTEREST;ASSIGNORS:ORTYN, WILLIAM;BASIJI, DAVID;FROST, KEITH;AND OTHERS;SIGNING DATES FROM 20070110 TO 20070122;REEL/FRAME:018851/0726 Owner name:AMNIS CORPORATION, WASHINGTON Free format text:ASSIGNMENT OF ASSIGNORS INTEREST;ASSIGNORS:ORTYN, WILLIAM;BASIJI, DAVID;FROST, KEITH;AND OTHERS;REEL/FRAME:018851/0726;SIGNING DATES FROM 20070110 TO 20070122 | |
| STCF | Information on status: patent grant | Free format text:PATENTED CASE | |
| FEPP | Fee payment procedure | Free format text:PAT HOLDER NO LONGER CLAIMS SMALL ENTITY STATUS, ENTITY STATUS SET TO UNDISCOUNTED (ORIGINAL EVENT CODE: STOL); ENTITY STATUS OF PATENT OWNER: LARGE ENTITY | |
| FPAY | Fee payment | Year of fee payment:4 | |
| MAFP | Maintenance fee payment | Free format text:PAYMENT OF MAINTENANCE FEE, 8TH YEAR, LARGE ENTITY (ORIGINAL EVENT CODE: M1552); ENTITY STATUS OF PATENT OWNER: LARGE ENTITY Year of fee payment:8 | |
| AS | Assignment | Owner name:AMNIS, LLC, WASHINGTON Free format text:CHANGE OF NAME;ASSIGNOR:AMNIS CORPORATION;REEL/FRAME:062917/0024 Effective date:20181231 | |
| FEPP | Fee payment procedure | Free format text:MAINTENANCE FEE REMINDER MAILED (ORIGINAL EVENT CODE: REM.); ENTITY STATUS OF PATENT OWNER: LARGE ENTITY | |
| FEPP | Fee payment procedure | Free format text:11.5 YR SURCHARGE- LATE PMT W/IN 6 MO, LARGE ENTITY (ORIGINAL EVENT CODE: M1556); ENTITY STATUS OF PATENT OWNER: LARGE ENTITY | |
| MAFP | Maintenance fee payment | Free format text:PAYMENT OF MAINTENANCE FEE, 12TH YEAR, LARGE ENTITY (ORIGINAL EVENT CODE: M1553); ENTITY STATUS OF PATENT OWNER: LARGE ENTITY Year of fee payment:12 | |
| AS | Assignment | Owner name:CYTEK BIOSCIENCES, INC., CALIFORNIA Free format text:ASSIGNMENT OF ASSIGNORS INTEREST;ASSIGNORS:LUMINEX CORPORATION;AMNIS, LLC;IRIS BIOTECH CORPORATION;REEL/FRAME:065044/0762 Effective date:20230228 |