US7962314B2 - Mechanism for profiling program software running on a processor - Google Patents
Mechanism for profiling program software running on a processorDownload PDFInfo
- Publication number
- US7962314B2 US7962314B2US11/958,764US95876407AUS7962314B2US 7962314 B2US7962314 B2US 7962314B2US 95876407 AUS95876407 AUS 95876407AUS 7962314 B2US7962314 B2US 7962314B2
- Authority
- US
- United States
- Prior art keywords
- monitor
- processor
- processes
- event
- logic
- Prior art date
- Legal status (The legal status is an assumption and is not a legal conclusion. Google has not performed a legal analysis and makes no representation as to the accuracy of the status listed.)
- Expired - Fee Related, expires
Links
Images


Classifications
- G—PHYSICS
- G06—COMPUTING OR CALCULATING; COUNTING
- G06F—ELECTRIC DIGITAL DATA PROCESSING
- G06F11/00—Error detection; Error correction; Monitoring
- G06F11/30—Monitoring
- G06F11/34—Recording or statistical evaluation of computer activity, e.g. of down time, of input/output operation ; Recording or statistical evaluation of user activity, e.g. usability assessment
- G06F11/3409—Recording or statistical evaluation of computer activity, e.g. of down time, of input/output operation ; Recording or statistical evaluation of user activity, e.g. usability assessment for performance assessment
- G—PHYSICS
- G06—COMPUTING OR CALCULATING; COUNTING
- G06F—ELECTRIC DIGITAL DATA PROCESSING
- G06F11/00—Error detection; Error correction; Monitoring
- G06F11/30—Monitoring
- G06F11/34—Recording or statistical evaluation of computer activity, e.g. of down time, of input/output operation ; Recording or statistical evaluation of user activity, e.g. usability assessment
- G06F11/3466—Performance evaluation by tracing or monitoring
- G06F11/348—Circuit details, i.e. tracer hardware
- G—PHYSICS
- G06—COMPUTING OR CALCULATING; COUNTING
- G06F—ELECTRIC DIGITAL DATA PROCESSING
- G06F11/00—Error detection; Error correction; Monitoring
- G06F11/30—Monitoring
- G06F11/34—Recording or statistical evaluation of computer activity, e.g. of down time, of input/output operation ; Recording or statistical evaluation of user activity, e.g. usability assessment
- G06F11/3466—Performance evaluation by tracing or monitoring
- G06F11/349—Performance evaluation by tracing or monitoring for interfaces, buses
- G—PHYSICS
- G06—COMPUTING OR CALCULATING; COUNTING
- G06F—ELECTRIC DIGITAL DATA PROCESSING
- G06F9/00—Arrangements for program control, e.g. control units
- G06F9/06—Arrangements for program control, e.g. control units using stored programs, i.e. using an internal store of processing equipment to receive or retain programs
- G06F9/46—Multiprogramming arrangements
- G06F9/54—Interprogram communication
- G06F9/542—Event management; Broadcasting; Multicasting; Notifications
- G—PHYSICS
- G06—COMPUTING OR CALCULATING; COUNTING
- G06F—ELECTRIC DIGITAL DATA PROCESSING
- G06F2201/00—Indexing scheme relating to error detection, to error correction, and to monitoring
- G06F2201/81—Threshold
- G—PHYSICS
- G06—COMPUTING OR CALCULATING; COUNTING
- G06F—ELECTRIC DIGITAL DATA PROCESSING
- G06F2201/00—Indexing scheme relating to error detection, to error correction, and to monitoring
- G06F2201/86—Event-based monitoring
- G—PHYSICS
- G06—COMPUTING OR CALCULATING; COUNTING
- G06F—ELECTRIC DIGITAL DATA PROCESSING
- G06F2201/00—Indexing scheme relating to error detection, to error correction, and to monitoring
- G06F2201/865—Monitoring of software
- G—PHYSICS
- G06—COMPUTING OR CALCULATING; COUNTING
- G06F—ELECTRIC DIGITAL DATA PROCESSING
- G06F2201/00—Indexing scheme relating to error detection, to error correction, and to monitoring
- G06F2201/87—Monitoring of transactions
- G—PHYSICS
- G06—COMPUTING OR CALCULATING; COUNTING
- G06F—ELECTRIC DIGITAL DATA PROCESSING
- G06F2201/00—Indexing scheme relating to error detection, to error correction, and to monitoring
- G06F2201/88—Monitoring involving counting
- G—PHYSICS
- G06—COMPUTING OR CALCULATING; COUNTING
- G06F—ELECTRIC DIGITAL DATA PROCESSING
- G06F2201/00—Indexing scheme relating to error detection, to error correction, and to monitoring
- G06F2201/885—Monitoring specific for caches
Definitions
- This inventionrelates to microprocessors and, more particularly, mechanisms for the monitoring of microprocessor processes and process performance data gathering during program execution.
- a profiler or program analysis toolmay monitor a given process and provide an output stream of events, or a summary of the historical events.
- instrumentingtypically refers to the insertion of monitor code into the program to be monitored.
- the instrumented codemay output analysis data.
- Other types of profilinginclude event based profiling and statistical profiling. Some event based profilers use profiling modules that trap events such as calls, for example.
- Statistical profilinguses sampling by interrupting the operating system at predetermined intervals that may be based on time or on the number of times an event has occurred.
- a processor having one or more processor coresincludes execution logic that may execute instructions including one or more processes. Each process may include one or more execution threads.
- the processoralso includes a profiling mechanism that includes monitor logic and a monitor process.
- the monitor logicmay monitor the one or more processes and provide access to performance data associated with the one or more processes without interrupting a flow of control of the one or more processes being monitored.
- the monitor processmay gather the performance data.
- the monitor processcomprises program instructions executable by the one more processor cores while operating in user mode.
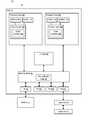
- FIG. 1is a block diagram of one embodiment of a computer system including a multi-core processing node.
- FIG. 2is a block diagram illustrating more detailed aspects of an embodiment of the profiling mechanism of FIG. 1 .
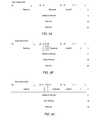
- FIG. 3Ais a diagram illustrating an exemplary instructions retired event record.
- FIG. 3Bis a diagram illustrating an exemplary branches retired event record.
- FIG. 3Cis a diagram illustrating an exemplary DCache misses event record.
- FIG. 4is a diagram illustrating one embodiment of an exemplary profiling control block.
- the computer system 10includes a processing node 12 coupled to memory 14 and to peripheral devices 13 A- 13 B.
- the node 12includes processor cores 15 A- 15 B coupled to a node controller 20 which is further coupled to a memory controller 22 , a plurality of HyperTransportTM (HT) interface circuits 24 A- 24 C, and a shared level three (L3) cache memory 60 .
- the HT circuit 24 Cis coupled to the peripheral device 16 A, which is coupled to the peripheral device 16 B in a daisy-chain configuration (using HT interfaces, in this embodiment).
- node 12may be a single integrated circuit chip comprising the circuitry shown therein in FIG. 1 . That is, node 12 may be a chip multiprocessor (CMP). Any level of integration or discrete components may be used. It is noted that processing node 12 may include various other circuits that have been omitted for simplicity. It is noted that reference designators that include a number and a letter (e.g., processor core 15 A) may be referred to by the number only where appropriate.
- the processor cores 15 A- 15 Bmay use the interface(s) to the node controller 20 to communicate with one another and with other components of the computer system 10 (e.g. peripheral devices 13 A- 13 B, other processor cores (not shown), the memory controller 22 , etc.).
- the interfacemay be designed in any desired fashion.
- Cache coherent communicationmay be defined for the interface, in some embodiments.
- communication on the interfaces between the node controller 20 and the processor cores 15 A- 15 Bmay be in the form of packets similar to those used on the HT interfaces. In other embodiments, any desired communication may be used (e.g. transactions on a bus interface, packets of a different form, etc.).
- the processor cores 15 A- 15 Bmay share an interface to the node controller 20 (e.g. a shared bus interface).
- the communications from the processor cores 15 A- 15 Bmay include requests such as read operations (to read a memory location or a register external to the processor core) and write operations (to write a memory location or external register), responses to probes (for cache coherent embodiments), interrupt acknowledgements, and system management messages, etc.
- the memory 14may include any suitable memory devices.
- the memory 14may comprise one or more random access memories (RAM) in the dynamic RAM (DRAM) family such as RAMBUS DRAMs (RDRAMs), synchronous DRAMs (SDRAMs), double data rate (DDR) SDRAM.
- RAMrandom access memories
- RDRAMsRAMBUS DRAMs
- SDRAMssynchronous DRAMs
- DDRdouble data rate SDRAM
- memory 14may be implemented using static RAM, etc.
- Memory 14may sometimes be referred to as a computer readable storage medium in which program data and instructions may be stored and retrieved for execution.
- the memory controller 22may comprise control circuitry for interfacing to the memories 14 . Additionally, the memory controller 22 may include request queues for queuing memory requests, etc.
- the HT circuits 24 A- 24 Cmay comprise a variety of buffers and control circuitry for receiving packets from an HT link and for transmitting packets upon an HT link.
- the HT interfacecomprises unidirectional links for transmitting packets.
- Each HT circuit 24 A- 24 Cmay be coupled to two such links (one for transmitting and one for receiving).
- a given HT interfacemay be operated in a cache coherent fashion (e.g. between processing nodes) or in a non-coherent fashion (e.g. to/from peripheral devices 16 A- 16 B).
- the HT circuits 24 A- 24 Bare not in use, and the HT circuit 24 C is coupled via non-coherent links to the peripheral devices 16 A- 16 B.
- HT interfacefor communication between nodes and between a node and peripheral devices
- other embodimentsmay use any desired interface or interfaces for either communication.
- packet based interfacesmay be used
- bus interfacesmay be used
- various standard peripheral interfacesmay be used (e.g., peripheral component interconnect (PCI), PCI express, etc.), etc.
- the peripheral devices 13 A- 13 Bmay be any type of peripheral devices.
- the peripheral devices 13 A- 13 Bmay include devices for communicating with another computer system to which the devices may be coupled (e.g. network interface cards, circuitry similar to a network interface card that is integrated onto a main circuit board of a computer system, or modems).
- the peripheral devices 13 A- 13 Bmay include video accelerators, audio cards, drive controllers, SCSI (Small Computer Systems Interface) adapters and telephony cards, sound cards, and a variety of data acquisition cards such as GPIB or field bus interface cards.
- the peripheral devices 13 A- 13 Bmay include non-volatile storage such as hard disks, floppy disk drives, flash drives, optical storage media, and the like. It is noted that the term “peripheral device” is also intended to encompass input/output (I/O) devices.
- a processor core 15 A- 15 Bmay include circuitry that is designed to execute instructions defined in a given instruction set architecture. That is, the processor core circuitry may be configured to fetch, decode, execute, and store results of the instructions defined in the instruction set architecture.
- processor cores 15 A- 15 Bmay implement the x86 architecture. As such, the processor cores may be operated in one or more modes or protection levels, which are typically referred to as CPU protection levels (CPLs) or protection rings.
- CPU protection levelsCPLs
- One of the commonly used levelsis CPL 0 , which is typically referred to as kernel mode and is the most privileged level.
- the other commonly used levelis CPL 3 , which is typically referred to as user mode and is the least privileged level.
- the processor cores 15 A- 15 Bmay comprise any desired configurations, including superpipelined, superscalar, or combinations thereof. Other configurations may include scalar, pipelined, non-pipelined, etc. Various embodiments may employ out of order speculative execution or in order execution.
- the processor coresmay include microcoding for one or more instructions or other functions, in combination with any of the above constructions. Various embodiments may implement a variety of other design features such as caches, translation lookaside buffers (TLBs), missed address buffers (MAB), model specific registers (MSRs), control registers (CRs), as well as other system level control hardware.
- processor core 15 Aincludes profiling hardware that includes PMSR 0 and PMSR 1 designated 16 A and 17 A, respectively, and monitor logic 18 A, which includes event counters 19 A. It is noted that in other embodiments, other numbers of profiling hardware elements such as model specific registers, for example, may be used. It is also noted that event counters 19 A is shown as a single block. However, in various implementations, processor 15 A may include a number of event counter units that may be placed in proximity to the events that are being counted. For example, if a particular event counter unit is counting instructions retired, the counter unit may be physically located near logic that maintains that information such as reorder buffer logic (not shown). As shown, processor core 15 B includes similar features.
- node controller 20may include a variety of interconnection circuits (not shown) for interconnecting processor cores 15 A and 15 B to each other, to other nodes, and to memory. Node controller 20 may also include functionality for selecting and controlling various node properties such as the maximum and minimum operating frequencies for the node, and the maximum and minimum power supply voltages for the node, for example.
- the node controller 20may generally be configured to route communications between the processor cores 15 A- 15 B, the memory controller 22 , and the HT circuits 24 A- 24 C dependent upon the communication type, the address in the communication, etc.
- the node controller 20may include a system request queue (SRQ) (not shown) into which received communications are written by the node controller 20 .
- SRQsystem request queue
- the node controller 20may schedule communications from the SRQ for routing to the destination or destinations among the processor cores 15 A- 15 B, the HT circuits 24 A- 24 C, and the memory controller 22 .
- node controller 20includes additional monitor logic that is part of the profiling hardware and is thus designated monitor logic 18 , which may be configured to control among other things, the routing of monitor samples to memory 14 and to peripheral devices 13 during process profiling operations.
- processor core 15 A and 15 Bmay each be configured to concurrently execute one or more threads or processes.
- processor 15 A and 15 Bmay each include hardware and software functionality (i.e., the profiling mechanism) that enables process profiling.
- processor 15 Amay be configured to execute a monitor process in either user mode (CPL 3 ) or kernel mode (CPL 0 ) that may gather performance data associated with user mode processes running on processor core 15 A or processor core 15 B without interrupting the control flow of the processes being monitored.
- the processor core hardwaresuch as the PMSR 0 and PMSR 1 , monitor logic 18 A, monitor logic 18 B and monitor logic 18 may facilitate such gathering of performance data.
- FIG. 1While the computer system 10 illustrated in FIG. 1 includes one processing node 12 , other embodiments may implement any number of processing nodes. Similarly, a processing node such as node 12 may include any number of processor cores, in various embodiments. Various embodiments of the computer system 10 may also include different numbers of HT interfaces per node 12 , and differing numbers of peripheral devices 13 coupled to the node, etc.
- monitor logic 18includes event counters 19 , a missed event counter 221 and in some implementations, control block registers 218 .
- monitor logic 18communicates with peripheral device 13 A, which in the illustrated embodiment is depicted as a non-volatile storage such as a hard disk drive or flash drive, for example.
- Monitor logic 18also communicates with memory 14 , and operating system 250 , which may represent an operating system (OS) instance executing on either or both processor cores 15 A and 15 B, respectively.
- OSoperating system
- the profiling mechanism 200may collectively include at least portions of the OS, monitor logic 18 , PMSR 0 , and PMSR 1 , memory 14 and peripheral device 13 A, for example.
- the profiling mechanism 200extends the processor architecture to allow user mode (CPL 3 ) processes to gather performance data about themselves with very low overhead.
- modulessuch as dynamic optimizers and managed runtime environments may be enabled to monitor the currently running program with high accuracy and resolution, thereby allowing them to report on performance problems and opportunities and fix them immediately.
- the architecture extensionsmay allow a program to gather performance data and examine it either by polling or by taking an occasional interrupt. It introduces minimal additional state to the CPU and to the process. It differs from conventional performance counters in that large quantities of data may be collected with no interrupts, considerably reducing the overhead of using performance feedback. More particularly, in one embodiment the profiling mechanism 200 described herein may be used with a polling scheme that requires no data collection interrupts at all.
- the profiling mechanism 200may also allow a user mode program to control its data collection without calling a driver, which may be a software routine that interacts with data collection hardware or software. Finally, the profiling mechanism 200 may run within the context of a thread, so it may be used by multiple processes within a system at the same time.
- the monitor logic 18when enabled, may be configured to monitor and count one or more events during the execution of user mode code and at predetermined intervals, to insert event records into a ring buffer (e.g., ring buffer 231 A) in the address space of the running process within memory 14 .
- a ring buffere.g., ring buffer 231 A
- the monitor logic 18may cause an interrupt to the OS, which the OS may use to signal a process to empty the buffer by moving the buffer contents to non-volatile storage (e.g., peripheral device 13 A) or by using the buffer contents in some other way. With proper OS support, the interrupt may even be delivered to a separate process or thread.
- the profiling mechanism 200may allow the user program to manually insert information into an event record in the ring buffer, allowing the program to record software events that may affect the interpretation of the other data in the buffer.
- the profiling mechanism 200may gather information associated with events such as instructions retired, branches (i.e., transfer of control) retired, and certain data cache misses. However, it is contemplated that in other embodiments other events such as CPU cycles, data TLB misses, instruction TLB misses, floating point operations, instruction cache (ICache) misses, and memory lock contention, for example, may also me monitored.
- the event informationmay be recorded in event records, examples of which are illustrated in FIG. 3A through FIG. 3C .
- the OSis configured to detect whether the profiling mechanism 200 is available and, if so, which profiling features are present.
- the OSmust enable the profiling mechanism 200 if the OS will allow programs to interact with it.
- the OScommits to context switching the profiling state.
- profiling interruptsBy enabling profiling interrupts, the OS commits to handling them.
- no data on the operation of the OSmay “leak” to any user process, and no data on the operation of one user process may leak to any other process.
- memory 14includes storage for a number of processes and threads, and for profiling control block information 275 . More particularly, memory 14 is shown with four exemplary address spaces allocated for the processes and threads. Beginning on the left, process and thread (P 1 T 1 ) includes user mode code that may include some application code and monitor code. In addition, the address space also includes a ring buffer 231 A for storing event records. The monitor code may also include polling code that monitors the ring buffer 231 A and as mentioned above, may be notified by monitor logic 18 when the ring buffer 231 A fills to a predetermined threshold.
- the next address spaceis designated as P 1 T 2 , and is similar to P 1 T 1 in that it also includes user mode code that includes monitor code and a ring buffer 231 B. Similarly for the next address space designated P 2 T 1 , which refers to a second process and thread.
- the fourth address space within memory 14illustrates an embodiment of a monitor thread designated P 1 T 3 .
- the address space for the monitor threadincludes space for a number of ring buffers (e.g., 232 A and 232 B).
- the monitor codeis user mode code.
- the monitor thread P 1 T 3may be used to monitor a number of processes that may be executing on any processor core. In the illustrated embodiment, there are two ring buffers and thus two processes are being monitored. However, any number of threads or processes may be monitored in other embodiments.
- the ring buffers 232 A and 232 Bmay be in memory that is shared with the processes being monitored and the buffers may be read and written by both the monitor thread P 1 T 3 and by the threads being monitored.
- instructionsmay be counted if they execute in user mode (e.g., CPL 3 ) and contribute to the instruction count in that mode according to instruction counting standards such as the Advanced Micro Devices standard for counting instructions, for example. However, other embodiments may count instructions in other ways. Furthermore, profiling may be inactive while in (or entering or leaving) the System Management Mode (SMM).
- SMMSystem Management Mode
- the user threadmay have complete control over its operations via new instructions.
- the new instructionsmay be called LLWPCB, SLWPCB, and LWPINS. These instructions may specify a pointer to the profiling control block 275 (shown in more detail FIG. 4 ), initialize internal profiling state, begin (or end) profiling operations, and insert event records into ring buffers.
- Each thread in a multi-threaded processmay configure profiling operation separately.
- a threadhas its own ring buffer and event counters which may be context switched with the rest of the thread state. However, ring buffers may be shared so that a single monitor thread such as thread P 1 T 3 of FIG. 2 may process the data from multiple other threads in a given process.
- the monitor logic 18may be configured to monitor and report on one or more types of events.
- the monitor logic 18may include functionality configured to count events, gather event records, store event records to buffers in memory (e.g., ring buffers 231 , 232 ), report buffer fills, and reset a particular event counter when an event record is stored, and control the transfer of information in the ring buffers to non-volatile storage. These functions are described in greater detail below.
- monitor logic 18decrements its internal event counters 19 for all of the events associated with the instruction.
- An instructionmay cause zero, one, or multiple events. For example, an indirect jump through a pointer in memory counts as an instruction retired, a branch retired, and may also cause up to two data cache (DCache) misses (or more, if there is a TLB miss) and up to two instruction cache (ICache) misses.
- DCachedata cache
- ICacheinstruction cache
- some eventsmay have filters or conditions on them that may regulate counting. For example, a cache miss event might specify that only events with latency greater than a specified minimum are eligible to be counted.
- the monitor logic 18gathers an event record (shown in FIG. 3A ). More particularly, in one implementation, in an internal copy of an event record may be written. For most events, such as instructions retired, the monitor logic 18 may be configured to gather an event record describing the instruction that caused the counter to reach zero. However, as will be described in greater detail below, the monitor logic 18 may be configured to gather event record data for the next instruction that causes the event, or to take other alternatives to capture the record.
- the monitor logic 18may gather event information on one or many events at any one time (i.e., concurrently), dependent on the specific implementation. In one implementation, the monitor logic 18 may select one of the eligible events while other expired events wait until the selected event record is written to memory 14 , and monitor logic 18 may then pick the next eligible instruction for the waiting event. In another implementation, if multiple event counters reach zero, the monitor logic 18 may gather one event record per event and write them sequentially to memory 14 .
- Monitor logic 18may be configured to discard an event occurrence in certain instances. For example, if a given ring buffer needs to be paged in from disk, there may be no way to preserve the pending event record data. If an event is discarded, the monitor logic 18 may gather an event record for the next instruction to cause the event. Similarly, if the monitor logic 18 needs to replay an instruction to gather a complete event record, the replay may for some reason abort instead of retiring. In this case, the event counter 19 remains at zero and the monitor logic 18 gathers an event record for the next instruction to cause the event.
- the monitor logic 18may be configured to store the event into a ring buffer (e.g., 231 ) in the process' address space and to advance a ring buffer pointer. If the ring buffer is full at this time, the monitor logic 18 may increment the missed event counter of missed events and may not advance the ring buffer pointer.
- a ring buffere.g., 231
- the monitor logic 18may delay storing other event records or it may discard the information and return to select the next eligible instruction for the discarded event type(s), as desired. It is noted that the store need not complete synchronously with the instruction retiring. In other words, if the profiling mechanism 200 buffers the event record contents, the store stage (and subsequent stages) may complete some number of cycles after the instruction which caused the event retires. The data associated with the event and the instruction is precise, but the rest of the profiling process may complete later.
- the monitor logic 18may be configured to initiate an interrupt, so the OS can signal some process to empty the buffer. This interrupt may be directed to the process being monitored or to a separate process or thread, such as P 1 T 3 as described in the above example. It is noted that the interrupt may occur significantly later than the event that caused the threshold to be met.
- the counter for the event that was storedis reset to its programmed interval (with any randomization applied), and counting for that event may start again. Reset happens if the event record is stored or if the missed event counter was incremented.
- the user processcan wait until an interrupt occurs to process the events in the ring buffer.
- thismay require some kernel or driver support.
- interruptsmay only be enabled if a kernel mode routine allows it.
- the user programmay call a driver to associate the profiling mechanism interrupt with a semaphore or mutex.
- the driversignals the associated object. Any thread waiting on the object may wake up and may process the buffer.
- driver modelsare possible.
- the user processmay have a thread that periodically polls (e.g., 233 ) the ring buffer (e.g., 231 ) and removes event records from it, advancing the tail pointer so that the profiling mechanism 200 hardware can continue storing records.
- a threadthat periodically polls (e.g., 233 ) the ring buffer (e.g., 231 ) and removes event records from it, advancing the tail pointer so that the profiling mechanism 200 hardware can continue storing records.
- each event record in the ring bufferis 32 bytes long. However, it is contemplated that in other embodiments any number of bytes may be used as desired.
- the actual record sizemay be determined by using a CPUID command to characterize the profiling mechanism 200 . It is noted that Reserved fields in event records may be set to zero when the profiling mechanism 200 writes an event record. However, other embodiments may provide other ways of characterizing the profiling mechanism.
- the event records shown in FIG. 3A through FIG. 3Care exemplary records. In other embodiments, event records may include other fields, the fields may be arranged differently in the record, or the fields may have different sizes than the event records shown in FIG. 3A through FIG. 3C .
- an exemplary event record 305 for instructions retiredis shown.
- byte 0is the event ID field, which specifies the event record type.
- the event ID of one (1)represents the instructions retired event record.
- valid identifiersare 1 to 255, and zero is an invalid event identifier.
- the next byteis the core identifier field.
- this fieldidentifies the core on which the profiling mechanism 200 is running. This field allows software to aggregate event records from multiple threads into a single buffer without losing CPU information. In one embodiment, for single core systems an ID of zero may be used.
- the core identifiermay be supplied from a machine specific register (MSR) or other value that is initialized by the operating system or other code.
- MSRmachine specific register
- the next two bytesis an event-specific flags field and may include any number of flags dependent on the type of event record. In the present exemplary event record, the entire field is reserved. The next four bytes represent an event-specific data field. In the present exemplary event record, these bytes are reserved.
- the next rowincludes bytes 8 : 15 , and represents the instruction address.
- an event counteris decremented each time an instruction retires.
- monitor logic 18 within the profiling mechanism 200may be configured to store an event record with an event identifier of (1).
- Bytes 8 : 15 of the event recordcontain the linear instruction pointer address of the instruction whose execution caused the event.
- an exemplary event record 310 for branches retiredis shown.
- the structure of the event record 310is similar to the event record 305 shown in FIG. 3A .
- the event IDis two (2), designating this event record as a branches retired event record.
- the event specific flags fieldincludes three flags at bit locations 31 : 29 . Those flags are TKN, PRD, and PRV, respectively.
- the TKN bitwill indicate a logic one (1) if branch was taken, and a logic zero (0) if not taken.
- the PRD bitwill indicate a logic one (1) if branch was predicted correctly, and a logic zero (0) if not mispredicted.
- the PRV bitwill indicate a logic one (1) if the PRD bit is valid, and a logic zero (0) if prediction information not available. Similar to FIG. 3A , bytes 8 : 15 of FIG. 3B also include an instruction address. In addition, bytes 16 : 23 represent the address of the instruction after the branch. This is the target if the branch was taken and the fall-through address if the branch is not taken.
- an event counteris decremented each time a transfer of control retires, regardless of whether or not it is taken.
- the transfer of controlincludes short and long jumps (including JCXZ and its variants), LOOPx, CALL, and RET instructions. However, it may not include traps or interrupts, whether synchronous or asynchronous, nor does it include operations that switch to or from CPL 3 or SMM or SVM, such as SYSCALL, SYSENTER or INT 3 .
- monitor logic 18 within the profiling mechanism 200may be configured to store an event record with an event identifier of 2.
- the flagsindicate whether the branch was taken (always true for unconditional transfers) and whether it was correctly predicted (always true for direct branches).
- the recordalso includes the addresses of the branch instruction and the branch target. For not-taken conditional branches, the target is the fall-through address.
- Some implementations of the profiling mechanism 200may not capture branch prediction information on some or all branches. A bit in the event record may indicate whether prediction information is valid.
- an exemplary event record 320 for DCache missesis shown.
- the structure of the event record 320is similar to the event record 305 and 310 shown in FIG. 3A and 3B , respectively.
- the event IDis three (3), designating this event record as a DCache misses event record.
- the event specific flags fieldincludes two flags at bit locations 31 : 28 .
- Those flagsare SRC, which includes bit locations 31 : 28 , and DAV, respectively.
- the SRC bitsrepresent a 3-bit encoding of the source for the requested data.
- An exemplary set of SRC encodingsis shown in Table 1, although other encodings are possible and contemplated.
- the event counteris decremented each time a load from memory causes a DCache miss whose latency exceeds the a predetermined Latency threshold and/or whose data comes from a level of the cache or memory hierarchy that is selected for counting.
- a misaligned access that causes two misses on a single loadonly decrements the event counter by 1 and, if it reports an event, the data is for the lowest address that missed.
- the profiling mechanism 200may not count cache misses that are indirectly due to TLB walks, local or global descriptor table (LDT, GDT) references, TLB misses, etc. Accordingly, in one embodiment, the profiling mechanism 200 may be configured to only counts loads directly caused by the instruction.
- monitor logic 18may be configured to store an event record with an event identifier of 3.
- the flagsoptionally indicate the source of the data, if available.
- the event recordincludes the total latency, the address of the load instruction, and the address of the referenced data. However, cache misses caused by the profiling hardware itself are not subject to counting.
- the x86 architectureallows multiple loads to be outstanding simultaneously. However, in some cases it may be impractical to have a full latency counter for every load that is waiting for a cache miss to be resolved. In such cases it is contemplated that a variety of simplifications may be used.
- an approximationmay be performed when starting to count latency. If counting in increments of 16, the 16 cycles need not start when the load begins to wait. Instead, the latency value may be bumped from 0 to 16 any time during the first 16 cycles of waiting.
- the latency threshold used to filter eventsis a multiple of 16 when performing the comparison that decides whether a cache miss event is eligible to be counted. It is also noted that when determining whether to use the above simplifications, whatever is practical in terms of area and power should be chosen.
- the event record for a DCache missreports the linear address of the data.
- the way the linear address is recordedaffects the exact event that is reported and the amount of time it takes to report a cache miss event. Accordingly, monitor logic 18 may capture data for either the event that caused the counter to reach zero, or for the next eligible event.
- An exemplary set of valuesis shown below in Table 2, although other values and bit functions are possible and contemplated.
- the bottom PLatencyRnd bits of latency informationwill be zero.
- the actual number of bits implemented for the counteris PLatencyMax ⁇ PLatencyRnd.
- ECX 29:9Reserved
- ECX 30PCacheLevels Cache-related events can be filtered by cache level that returned data; the value of CLF in the PCB enables cache level filtering. If 0, CLF is ignored. An implementation must support filtering by either latency or cache level. It may support both.
- ECX 31 PCacheLatency Cache-related eventscan be filtered by latency; the value of MinLatency in the PCB is used. If 0, MinLatency is ignored. An implementation must support filtering by either latency or cache level. It may support both.
- EDX 0 Enabled Profiling Mechanismis available. If this bit is 0, the remainder of the data returned by CPUID should be ignored.
- the bits returned in EAXare taken from PMSR 0 and reflect the currently enabled features of the profiling mechanism 200 . However, these are a subset of the bits returned in EDX, which reflect the full capabilities of the profiling mechanism 200 in the current processor.
- the OSmay enable a subset of the profiling mechanism 200 if it is configured to not support all available features. For example, if the OS is configured not to handle a profiling threshold interrupt, it may disable the feature.
- User mode softwareshould be configured to interpret the bits in EAX to describe the features it can use. Operating systems should be configured to use the bits from EDX to determine the capabilities of the profiling mechanism 200 and to enable all or some of the available features. It is noted that in other embodiments, the profiling mechanism may report the processor configuration using different instructions or mechanisms and may report additional data and parameters, especially in implementations that are an extension of, or are a subset of the examples given here.
- the PMSRsare model-specific registers which describe and control the profiling mechanism 200 hardware.
- the PMSRsare available if EDX bit 0 of CPUID 8000 — 0001 is set to a logic value of 1.
- PMSR 0may be referred to as the profiling mechanism 200 feature enable register. As such, PMSR 0 may control how the profiling mechanism 200 can be used on a given processor. Depending on which bits are asserted and to what value, it can prohibit the use of the profiling mechanism 200 or restrict its operation in several ways.
- the features that may be enabled in PMSR 0are shown below in Table 3. However, it is noted that the PMSR 0 features shown in Table 3 are exemplary, and it is contemplated that in other embodiments other functions and bits may be used.
- the OSmay be configured to load PMSR 0 at start-up time (or at the time the profiling mechanism 200 driver is loaded) to indicate its level of support for the profiling mechanism 200 .
- PMSR 0In one implementation, only bits that are set in EDX in response to the CPUID instruction when enumerating the profiling mechanism 200 can be turned on in PMSR 0 . Attempting to set other bits may cause a #GP fault.
- PMSR 1provides access to the internal copy of the Profiling Control Block (PCB) pointer.
- PCBProfiling Control Block
- executing a RDMSR instruction to this registerperforms the operations corresponding to the SLWPCB instruction
- executing a WRMSR instruction to this registerperforms operations corresponding to the LLWPCB instruction as described further below.
- PMSR 2may provide the value which is stored into the Core Id field of an event record to identify the processor on which the monitored thread is running. This value may be set by the BIOS or the Operating System or it may be initialized by the hardware.
- the LLWPCB instructionmay be used to enable and disable profiling and to control the events being profiled in user mode.
- the SLWPCB instructionmay be used. These instructions effectively provide user mode access to the PCB pointer in PMSR 1 .
- the LWPINS instructionmay allow software insertion of event records into an event ring buffer.
- the LLWPCB instruction(which stands for Load LightWeight Profiling Control Block) may set the state of the profiling mechanism 200 hardware from the Profiling Control Block (PCB) at DS:rAX and enable profiling if specified. It may return the previous value of the PCB address in the rAX register.
- PCBProfiling Control Block
- profilingshould really only be turned on by the user program. Transitions to CPL 3 that implicitly turn on the profiling mechanism 200 should do so using an extended context save/restore mechanism, which restores some of the profiling mechanism 200 volatile state and requires the profiling mechanism 200 to initialize the remainder of its state from the PCB.
- the profiling mechanism 200flushes its internal state to memory in the old PCB.
- the profiling mechanism 200may be configured to then set up new internal state from the new PCB and to write the new PCB.Flags field to indicate the resulting status of the profiling mechanism 200 .
- the PCB.Flags fieldcontains bits indicating which events are actually being profiled and whether threshold interrupts are enabled.
- execution of the SLWPCB instructionflushes the current state of the profiling mechanism 200 into the PCB in memory and returns the current address of the PCB in rAX. If the profiling mechanism 200 is not currently active, executing the SLWPCB instruction may set rAX to zero. This operation may only be issued when the machine is in protected mode, but it can be executed at any privilege level.
- execution of the LWPINS instructioninserts an event record into the event ring buffer for the currently executing thread and advances the ring buffer pointer in a manner similar to the way hardware inserts a record into the ring buffer.
- the Event Id of the inserted recordmay be a predetermined value (e.g., 255) to indicate a user inserted event, and the other fields of the record may be taken from the general registers of the processor at the time the instruction is executed.
- the LWPINS instructionmay clear the processor carry bit (or some other flag bit) to indicate success, or it may set the bit to indicate that the ring buffer is full.
- the PCBspecifies the details of how the profiling mechanism 200 operates.
- the PCBincludes a number of fields and is stored in an interactive region of memory in which some fields are controlled and modified by the profiling mechanism 200 hardware and others are controlled and modified by the software that processes the profiling mechanism 200 event records.
- monitor logic 18may be configured to cache a portion of the information from the PCB into internal registers (e.g., control block registers 218 ) for speed.
- PCB 475includes a variable and dynamic number of bytes depending upon, for example, the number of events being monitored. Accordingly, in FIG. 4 , the PCB 475 is shown with M+8 bytes.
- the PCB 475also includes a number of fields. The fields of PCB 475 are described in greater detail below in conjunction with Table 4.
- the R/W column in Table 4indicates how the field is modified while the profiling mechanism 200 is enabled.
- a profiling control blockmay include other fields having additional or different functionality than the profiling control block shown in FIG. 4 and Table 4, and described herein.
- BufferHeadOffsetUnsigned offset into BufferBase specifying where the Mon. monitor logic will store the next event record.
- the bufferis empty.
- BufferHeadOffsetis always ⁇ BufferSize and is always a multiple of PEventSize.
- BufferTailOffsetUnsigned offset into BufferBase specifying the oldest event SW record in the buffer.
- BufferTailOffsetis always ⁇ BufferSize and is always a multiple of PEventSize.
- MissedEvents64-bit count of the number of events that were missed.
- a Mon. missed eventoccurs after monitor logic stores an event Logic record when it increments BufferHeadOffset and discovers that it would be equal to BufferTailOffset. Instead of updating BufferHeadOffset, monitor logic increments the MissedEvents counter. Thus, when the buffer is full, the last event record is overwritten.
- ThresholdIf non-zero, threshold for interrupting the user to indicate No that the buffer is filling up.
- monitor logicadvances BufferHeadOffset, it computes the space used as ((BufferHeadOffset ⁇ BufferTailOffset) % BufferSize) and compares it to Threshold.
- monitor logiccauses an interrupt. (Note that no division is needed for the modulus operator; if the difference is ⁇ 0, simply add BufferSize to the difference.)
- the compare for equalityensures that only one interrupt occurs when the threshold is crossed. If zero, no threshold interrupts will be generated. This field is ignored if threshold interrupts are not enabled in PMSR1.
- MinLatency Minimum latency required to make a cache-related eventNo eligible for profiling counting. Applies to all cache-related events being monitored. The number in MinLatency is multiplied by 16 to get the actual latency in cycles. This scaling provides less resolution but a larger range for filtering. An implementation may have a maximum for the latency value it captures.
- MinLatency* 16exceeds this maximum value, the maximum is used instead.
- a value of 0disables filtering by latency.
- NOTE MinLatencymay be ignored if no cache latency event is chosen in one of the EventIdn fields.
- MinLatencyis ignored if CPUID indicates that the implementation does not filter by latency.
- CLF Cache Level Filtering. 1enables filtering cache-related No events by the cache level or memory level that returned the data. It enables the next 4 bits, and cache-related events are only eligible for Profiling Mechanism counting if the bit describing the memory level is on. 0 means no cache level filtering, the next 4 bits are ignored, and any cache or memory level is eligible.
- NOTE CLFmay be ignored if no cache latency event is chosen in one of the EventIdn fields. CLF is ignored if CPUID indicates that the implementation does not filter by cache level. Use the MinLatency field to get a similar effect. At least one of these mechanisms must be available.
- NBCSet to 1 to record cache-related events that are satisfied No from data held in a cache that resides on the Northbridge. Ignored if CLF is 0.
- RDCto 1 to record cache-related events that are satisfied No from data held in a remote data cache. Ignored if CLF is 0
- RAMto 1 to record cache-related events that are satisfied No from DRAM.
- EventId0EventId of the event to count in this counter. 0 means No disable this counter. It is invalid to specify the same EventId in two or more counters and may cause unpredictable results.
- EventCounter0Starting or current value of counter Mon.
- Logic Event1 . . .(Repeat counter configuration PMaxEvents times . . .)
- the flags fieldincludes five flags that are in bit locations 0 - 3 and 31 .
- the flagsare EN, IRE, BRE, DME, and INT, respectively.
- the En flagindicates whether profiling is enabled or not.
- the IRE flagindicates whether the Instructions retired events are enabled, the BRE flag indicates whether the Branches retired events are enabled, the DME flag indicates whether the DCache Misses events are enabled, and the INT flag indicates whether threshold interrupts are enabled.
- Most of the fields in the PCBmay be constant for the duration of a profiling session (the time between enabling the profiling mechanism 200 and disabling it). This means that they are loaded into the profiling mechanism 200 hardware when it is enabled, and may be periodically reloaded from the same location as needed. The contents of the constant fields must not be changed during a profiling run or results will be unpredictable. In addition, changing the PCB memory to read-only or unmapped may cause an exception the next time the monitor logic 18 attempts to access it.
- a few fieldsmay be modified by the monitor logic 18 to communicate progress to the software that is emptying the event record buffer. Software may read them but should never modify them while the profiling mechanism 200 is enabled. Other fields may enable software to indicate that progress has been made in emptying the ring buffer. Software may write these fields and the monitor logic 18 may read them as needed. For efficiency, as mentioned above, some of the PCB fields may be shadowed in control block registers 218 when profiling is active. Monitor logic 18 may refresh these fields from (or flush them to) memory as needed to allow software to make progress as described further below.
- the monitor logic 18may keep internal copies of the buffer head and tail pointers. It need not flush the head pointer to the PCB every time it stores an event record. Instead, the flush may be deferred until a threshold or buffer full event happens, or until context needs to be saved for a context switch. Accordingly, exceeding the buffer threshold should force the head pointer to memory so that a process or thread polling the ring buffer will be able to see forward progress.
- the monitor logic 18need not read the software-maintained tail pointer unless it detects a threshold or buffer full condition. At that point, the monitor logic 18 may be configured to reread the tail pointer to see if software has emptied some records from the buffer. If so, it recomputes the threshold condition and acts accordingly. This implies that software polling the buffer should begin processing event records when it detects a threshold event itself. To avoid a race condition with software, the monitor logic 18 should reread the tail pointer every time it stores an event record while the threshold condition appears to be true. Alternatively, monitor logic 18 may reread the tail pointer every nth time for some small n.
- multiple eventsare possible when an instruction retires. For example, an indirect jump through a pointer in memory can trigger the instructions retired, branches retired, and DCache miss events simultaneously.
- the profiling mechanismmay be configured to count all events that apply to the instruction, but only report one event per instruction. The other events will not cause an event record to be stored. The choice of which event to report is implementation dependent, and may vary from run to run on the same processor. Doing so may ensure that an instruction that regularly causes multiple events can be reported in all of its categories since the events' counters may expire at varying intervals. It is noted that in other embodiments, a priority scheme may be used to prioritize the events when multiple events occur.
- the OSmust ensure that information does not leak from one process to another or from the kernel to a user process. Hence, if it supports the profiling mechanism 200 at all, the OS must ensure that the state of the monitor logic 18 is set appropriately when a context switch occurs. In a system with hardware context switch support, this should happen automatically. Otherwise, the PCB pointer for each process must be saved and restored as part of the process context.
- Various implementations of the profiling mechanism 200have internal state to hold the current values of the counters for the various events (up to the maximum number of simultaneous events supported), a copy of the pointer into the event buffer, and a copy of the tail pointer for quick detection of threshold and overflow states.
- the OS contextswitches from one user thread to another, the old user state must be saved with the thread's context and the new state must be loaded.
- a hypervisordecides to switch from one guest OS to another, the same must be done for the guest systems' states.
- statemust be stored and reloaded when the system enters and exits SMM, since the SMM code may decide to shut off power to the core.
- the PCB addressis eight bytes
- the BufferHeadOffset valueis four bytes
- the 26-bit counter valuesare four bytes each
- the SMM save areamay include the volatile profiling state.
- SMM entry and exitmay save and restore profiling state as necessary. State must be saved when the processor is going to change power state, but since profiling is executed in CPL 3 only, its state should not need to be saved and restored otherwise.
- the PCBmay not be in memory at all times. Therefore, the monitor logic 18 must not attempt to access it while still in the OS kemel/VMM/SMM, since that access might fault.
- the profiling state restoremust only be done once the processor is in CPL 3 and can take a page fault exception without crashing.
- cache system 200 and 400may be used in any type of processor, including single core processors.
- the monitor logic 18may reside within the individual core.
- the various embodimentsdescribe particular entities as hardware or software entities, it is contemplated that any entity described above may be implemented in hardware, software, or a combination as desired.
Landscapes
- Engineering & Computer Science (AREA)
- Theoretical Computer Science (AREA)
- General Engineering & Computer Science (AREA)
- Physics & Mathematics (AREA)
- General Physics & Mathematics (AREA)
- Computer Hardware Design (AREA)
- Quality & Reliability (AREA)
- Software Systems (AREA)
- Multimedia (AREA)
- Debugging And Monitoring (AREA)
Abstract
Description
| TABLE 1 |
| Source bits encodings |
| 0 | No |
| 1 | |
| 2 | Remote CPU or |
| 3 | DRAM |
| 4 | Reserved (for Remote cache) |
| 5 | Reserved |
| 6 | |
| 7 | Other (MMIO/Config/PCI/APIC) |
| TABLE 2 |
| Profiling Mechanism CPUID values |
| Reg | Bits | Function | |
| EAX | |||
| 0 | Enabled | Profiling mechanism is enabled. If this bit is 0, the | |
| remainder of the data returned by CPUID should be ignored. | |||
| 1 | IRE | Instructions retired event (EventId = 1) is enabled | |
| 2 | BRE | Branch retired event (EventId = 2) is enabled | |
| 3 | DME | DCache miss event (EventId = 3) is enabled | |
| EAX | 4:29 | Reserved for future events | |
| EAX | 30 | Extension | Extended CPUID information is available. If 1, |
| information on events with EventId >29 is | |||
| available by executing CPUID with EAX = 8000_001D. | |||
| 31 | Interrupt | Interrupt on threshold overflow is enabled | |
| EBX | 7:0 | PCBSize | Size in bytes of the PCB. At least 40 + (PMaxEvents * 8) |
| but implementation may require | |||
| a larger control block | |||
| EBX | 15:8 | PEventSize | Size in bytes of an event record in the Profiling |
| Mechanism ring buffer (32 for Profiling | |||
| Mechanism Version 1). | |||
| EBX | 23:16 | PMaxEvents | Number of different events that can be monitored |
| simultaneously. | |||
| EBX | 31:24 | PVersion | Version of Profiling Mechanism implementation (1 |
| for Profiling Mechanism Version 1). | |||
| ECX | 4:0 | PLatencyMax | Number of bits in cache latency counters (10 to 31) |
| ECX | 5 | PDataAddress | If 1, cache miss event records report the data |
| address of the reference. If 0, data address is not reported. | |||
| ECX | 8:6 | PLatencyRnd | The amount by which cache latency is rounded. |
| The bottom PLatencyRnd bits of latency | |||
| information will be zero. The actual number of | |||
| bits implemented for the counter is PLatencyMax − | |||
| PLatencyRnd. Must be 0 to 4. | |||
| ECX | 29:9 | ||
| ECX | |||
| 30 | PCacheLevels | Cache-related events can be filtered by cache level | |
| that returned data; the value of CLF in the PCB | |||
| enables cache level filtering. If 0, CLF is ignored. | |||
| An implementation must support filtering by either | |||
| latency or cache level. It may support both. | |||
| 31 | PCacheLatency | Cache-related events can be filtered by latency; the | |
| value of MinLatency in the PCB is used. If 0, | |||
| MinLatency is ignored. | |||
| An implementation must support filtering by either | |||
| latency or cache level. It may support both. | |||
| 0 | Enabled | Profiling Mechanism is available. If this bit is 0, | |
| the remainder of the data returned by CPUID | |||
| should be ignored. | |||
| 1 | Interrupt | Interrupt on threshold overflow is | |
| EDX | |||
| 2 | IRE | Instructions retired event (EventId = 1) is | |
| EDX | |||
| 3 | BRE | Branch retired event (EventId = 2) is available | |
| EDX | 4 | DME | DCache miss event (EventId = 3) is available |
| EDX | 5:31 | Reserved for future events | |
| TABLE 3 |
| PMSR0 Profiling feature enables |
| Bit | Mnemonic | Function | R/ | Reset | |
| 0 | Enabled | Enable Profiling Mechanism | R/ | 0 | |
| 1 | IRE | Allow Profiling Mechanism to count | R/ | 0 | |
| instructions retired | |||||
| 2 | BRE | Allow Profiling Mechanism to count | R/ | 0 | |
| branches retired | |||||
| 3 | DME | Allow Profiling Mechanism to count | R/ | 0 | |
| DCache misses | |||||
| 4:30 | 0 | ||||
| 31 | Interrupt | Allow Profiling Mechanism to generate | R/ | 0 | |
| an interrupt when threshold is exceeded | |||||
| TABLE 4 |
| Profiling Control Block fields |
| Field | Description | R/W |
| Flags | Flags indicating profiling mechanism state. | Init |
| BufferSize | Total size of the event record buffer (in bytes). Must be a | No |
| multiple of the event record size (PEventSize). | ||
| Random | Number of bits of randomness to use in counters. Each | No |
| time a counter is loaded from an interval to start counting | ||
| down to the next event record, the bottom Random bits are | ||
| set to a random value. This avoids fixed patterns in events. | ||
| It is contemplated that a number of mechanisms may | ||
| be used to get the random values. | ||
| It is noted that in other embodiments, a second | ||
| Random field may be included in each event, taking | ||
| up some of the current Rsvd field. | ||
| BufferBase | Linear address of the event record buffer. Must be aligned | No |
| on a 32-byte boundary (the low 5 bits of BufferBase are | ||
| ignored). Software may be configured to align the buffer | ||
| on a page boundary, but this is not required. | ||
| BufferHeadOffset | Unsigned offset into BufferBase specifying where the | Mon. |
| monitor logic will store the next event record. When | Logic | |
| BufferHeadOffset == BufferTailOffset, the buffer is empty. | ||
| BufferHeadOffset is always < BufferSize and is always a | ||
| multiple of PEventSize. | ||
| BufferTailOffset | Unsigned offset into BufferBase specifying the oldest event | SW |
| record in the buffer. BufferTailOffset is always < BufferSize | ||
| and is always a multiple of PEventSize. | ||
| MissedEvents | 64-bit count of the number of events that were missed. A | Mon. |
| missed event occurs after monitor logic stores an event | Logic | |
| record when it increments BufferHeadOffset and discovers | ||
| that it would be equal to BufferTailOffset. Instead of | ||
| updating BufferHeadOffset, monitor logic increments the | ||
| MissedEvents counter. Thus, when the buffer is full, the | ||
| last event record is overwritten. | ||
| Threshold | If non-zero, threshold for interrupting the user to indicate | No |
| that the buffer is filling up. When monitor logic advances | ||
| BufferHeadOffset, it computes the space used as | ||
| ((BufferHeadOffset − BufferTailOffset) % BufferSize) and | ||
| compares it to Threshold. If the space used == Threshold | ||
| and threshold interrupts are enabled, monitor logic causes | ||
| an interrupt. (Note that no division is needed for the | ||
| modulus operator; if the difference is < 0, simply add | ||
| BufferSize to the difference.) The compare for equality | ||
| ensures that only one interrupt occurs when the threshold is crossed. | ||
| If zero, no threshold interrupts will be generated. This | ||
| field is ignored if threshold interrupts are not enabled in PMSR1. | ||
| MinLatency | Minimum latency required to make a cache-related event | No |
| eligible for profiling counting. Applies to all cache-related | ||
| events being monitored. The number in MinLatency is | ||
| multiplied by 16 to get the actual latency in cycles. This | ||
| scaling provides less resolution but a larger range for | ||
| filtering. An implementation may have a maximum for the | ||
| latency value it captures. If MinLatency* 16 exceeds this | ||
| maximum value, the maximum is used instead. A value of | ||
| 0 disables filtering by latency. | ||
| NOTE | ||
| MinLatency may be ignored if no cache latency event is | ||
| chosen in one of the EventIdn fields. | ||
| MinLatency is ignored if CPUID indicates that the | ||
| implementation does not filter by latency. Use the CLF | ||
| bits to get a similar effect. At least one of these | ||
| mechanisms must be available. | ||
| CLF | Cache Level Filtering. 1 enables filtering cache-related | No |
| events by the cache level or memory level that returned the | ||
| data. It enables the next 4 bits, and cache-related events | ||
| are only eligible for Profiling Mechanism counting if the | ||
| bit describing the memory level is on. 0 means no cache | ||
| level filtering, the next 4 bits are ignored, and any cache or | ||
| memory level is eligible. | ||
| NOTE | ||
| CLF may be ignored if no cache latency event is chosen in | ||
| one of the EventIdn fields. | ||
| CLF is ignored if CPUID indicates that the implementation | ||
| does not filter by cache level. Use the MinLatency field to | ||
| get a similar effect. At least one of these mechanisms must | ||
| be available. | ||
| NBC | Set to 1 to record cache-related events that are satisfied | No |
| from data held in a cache that resides on the Northbridge. | ||
| Ignored if CLF is 0. | ||
| RDC | Set to 1 to record cache-related events that are satisfied | No |
| from data held in a remote data cache. Ignored if CLF is 0 | ||
| RAM | Set to 1 to record cache-related events that are satisfied | No |
| from DRAM. Ignored if CLF is 0 | ||
| OTH | Set to 1 to record cache-related events that are satisfied | No |
| from other sources, such as MMIO, Config space, PCI | ||
| space, or APIC. Ignored if CLF is 0 | ||
| NDB | No direct branches. 1 means direct branches will not be | No |
| counted. This only applies to unconditional RIP-relative | ||
| branches. Conditional branches, indirect jumps through a | ||
| register or memory, calls, and returns are counted normally. | ||
| This value is ignored if the Branches Retired event is not | ||
| chosen in one of the EventIdn fields. | ||
| It is noted that in embodiments that define a separate | ||
| event for non-direct branches this field may be omitted. | ||
| EventInterval0 | Number of events of type EventId0 to count before storing | No |
| an event record. | ||
| EventId0 | EventId of the event to count in this counter. 0 means | No |
| disable this counter. It is invalid to specify the same | ||
| EventId in two or more counters and may cause | ||
| unpredictable results. | ||
| EventCounter0 | Starting or current value of counter | Mon. |
| Logic | ||
| Event1 . . . | (Repeat counter configuration PMaxEvents times . . .) | |
Claims (14)
Priority Applications (8)
| Application Number | Priority Date | Filing Date | Title |
|---|---|---|---|
| US11/958,764US7962314B2 (en) | 2007-12-18 | 2007-12-18 | Mechanism for profiling program software running on a processor |
| JP2010539421AJP2011507128A (en) | 2007-12-18 | 2008-12-03 | Mechanism for profiling program software running on a processor |
| KR1020107016120AKR20100112137A (en) | 2007-12-18 | 2008-12-03 | Mechanism for profiling program software running on a processor |
| CN2008801250083ACN101952806A (en) | 2007-12-18 | 2008-12-03 | Mechanism for profiling program software running on a processor |
| GB1011296AGB2467891A (en) | 2007-12-18 | 2008-12-03 | Mechanism for profiling program software running on a processor |
| PCT/US2008/013311WO2009085088A1 (en) | 2007-12-18 | 2008-12-03 | Mechanism for profiling program software running on a processor |
| DE112008003457TDE112008003457T5 (en) | 2007-12-18 | 2008-12-03 | Mechanism for operationally analyzing program software executed on a processor |
| TW097147292ATW200941338A (en) | 2007-12-18 | 2008-12-05 | Mechanism for profiling program software running on a processor |
Applications Claiming Priority (1)
| Application Number | Priority Date | Filing Date | Title |
|---|---|---|---|
| US11/958,764US7962314B2 (en) | 2007-12-18 | 2007-12-18 | Mechanism for profiling program software running on a processor |
Publications (2)
| Publication Number | Publication Date |
|---|---|
| US20090157359A1 US20090157359A1 (en) | 2009-06-18 |
| US7962314B2true US7962314B2 (en) | 2011-06-14 |
Family
ID=40657677
Family Applications (1)
| Application Number | Title | Priority Date | Filing Date |
|---|---|---|---|
| US11/958,764Expired - Fee RelatedUS7962314B2 (en) | 2007-12-18 | 2007-12-18 | Mechanism for profiling program software running on a processor |
Country Status (8)
| Country | Link |
|---|---|
| US (1) | US7962314B2 (en) |
| JP (1) | JP2011507128A (en) |
| KR (1) | KR20100112137A (en) |
| CN (1) | CN101952806A (en) |
| DE (1) | DE112008003457T5 (en) |
| GB (1) | GB2467891A (en) |
| TW (1) | TW200941338A (en) |
| WO (1) | WO2009085088A1 (en) |
Cited By (31)
| Publication number | Priority date | Publication date | Assignee | Title |
|---|---|---|---|---|
| US20100269123A1 (en)* | 2009-04-21 | 2010-10-21 | International Business Machines Corporation | Performance Event Triggering Through Direct Interthread Communication On a Network On Chip |
| US20110289485A1 (en)* | 2010-05-21 | 2011-11-24 | International Business Machines Corporation | Software Trace Collection and Analysis Utilizing Direct Interthread Communication On A Network On Chip |
| US20110302560A1 (en)* | 2010-06-04 | 2011-12-08 | Guenther Nadbath | Real-time profiling in a multi-core architecture |
| US20130198540A1 (en)* | 2012-02-01 | 2013-08-01 | Sejoong LEE | Dynamic Power Management in Real Time Systems |
| US20130246736A1 (en)* | 2010-11-25 | 2013-09-19 | Toyota Jidosha Kabushiki Kaisha | Processor, electronic control unit and generating program |
| US20130247010A1 (en)* | 2012-03-16 | 2013-09-19 | International Business Machines Corporation | Run-time instrumentation sampling in transactional-execution mode |
| US20140089902A1 (en)* | 2012-09-27 | 2014-03-27 | International Business Machines Corporation | Monitoring software performance |
| US20140282418A1 (en)* | 2013-03-15 | 2014-09-18 | Ab Initio Technology Llc | Recording program execution |
| US9116816B2 (en) | 2013-03-05 | 2015-08-25 | International Business Machines Corporation | Prefetching for a parent core in a multi-core chip |
| US9128851B2 (en) | 2013-03-05 | 2015-09-08 | International Business Machines Corporation | Prefetching for multiple parent cores in a multi-core chip |
| US9141551B2 (en) | 2013-03-05 | 2015-09-22 | International Business Machines Corporation | Specific prefetch algorithm for a chip having a parent core and a scout core |
| US9158660B2 (en) | 2012-03-16 | 2015-10-13 | International Business Machines Corporation | Controlling operation of a run-time instrumentation facility |
| US20150317161A1 (en)* | 2014-04-30 | 2015-11-05 | Nicholas J. Murphy | System and method of context switching |
| US9250903B2 (en) | 2012-03-16 | 2016-02-02 | International Business Machinecs Corporation | Determining the status of run-time-instrumentation controls |
| US9280447B2 (en) | 2012-03-16 | 2016-03-08 | International Business Machines Corporation | Modifying run-time-instrumentation controls from a lesser-privileged state |
| US9280346B2 (en) | 2012-03-16 | 2016-03-08 | International Business Machines Corporation | Run-time instrumentation reporting |
| US9367316B2 (en) | 2012-03-16 | 2016-06-14 | International Business Machines Corporation | Run-time instrumentation indirect sampling by instruction operation code |
| US9367313B2 (en) | 2012-03-16 | 2016-06-14 | International Business Machines Corporation | Run-time instrumentation directed sampling |
| US20160196222A1 (en)* | 2015-01-05 | 2016-07-07 | Tuxera Corporation | Systems and methods for network i/o based interrupt steering |
| US9395989B2 (en) | 2012-03-16 | 2016-07-19 | International Business Machines Corporation | Run-time-instrumentation controls emit instruction |
| US9400736B2 (en) | 2012-03-16 | 2016-07-26 | International Business Machines Corporation | Transformation of a program-event-recording event into a run-time instrumentation event |
| US9405543B2 (en) | 2012-03-16 | 2016-08-02 | International Business Machines Corporation | Run-time instrumentation indirect sampling by address |
| US9454462B2 (en) | 2012-03-16 | 2016-09-27 | International Business Machines Corporation | Run-time instrumentation monitoring for processor characteristic changes |
| US9483268B2 (en) | 2012-03-16 | 2016-11-01 | International Business Machines Corporation | Hardware based run-time instrumentation facility for managed run-times |
| US9792120B2 (en) | 2013-03-05 | 2017-10-17 | International Business Machines Corporation | Anticipated prefetching for a parent core in a multi-core chip |
| US11036693B2 (en) | 2017-08-07 | 2021-06-15 | Electronics And Telecommunications Research Institute | Apparatus of continuous profiling for multicore embedded system and method of the same |
| US11042403B2 (en)* | 2017-07-10 | 2021-06-22 | Intel Corporation | Platform auto-configuration and tuning |
| US11126535B2 (en) | 2018-12-31 | 2021-09-21 | Samsung Electronics Co., Ltd. | Graphics processing unit for deriving runtime performance characteristics, computer system, and operation method thereof |
| US11216055B2 (en) | 2018-02-09 | 2022-01-04 | Samsung Electronics Co., Ltd. | Mobile device including context hub and operation method thereof |
| US11281967B1 (en)* | 2018-12-11 | 2022-03-22 | Amazon Technologies, Inc. | Event-based device performance monitoring |
| US11416749B2 (en) | 2018-12-11 | 2022-08-16 | Amazon Technologies, Inc. | Execution synchronization and tracking |
Families Citing this family (37)
| Publication number | Priority date | Publication date | Assignee | Title |
|---|---|---|---|---|
| US8533687B1 (en)* | 2009-11-30 | 2013-09-10 | dynaTrade Software GmbH | Methods and system for global real-time transaction tracing |
| US7716534B2 (en)* | 2007-05-04 | 2010-05-11 | Alcatel-Lucent Usa Inc. | Methods and apparatus for measuring performance in processing system |
| US20100008464A1 (en)* | 2008-07-11 | 2010-01-14 | Infineon Technologies Ag | System profiling |
| US7917677B2 (en)* | 2008-09-15 | 2011-03-29 | International Business Machines Corporation | Smart profiler |
| US8578138B2 (en)* | 2009-08-31 | 2013-11-05 | Intel Corporation | Enabling storage of active state in internal storage of processor rather than in SMRAM upon entry to system management mode |
| US8898646B2 (en)* | 2010-12-22 | 2014-11-25 | Intel Corporation | Method and apparatus for flexible, accurate, and/or efficient code profiling |
| US8769505B2 (en)* | 2011-01-24 | 2014-07-01 | Hewlett-Packard Development Company, L.P. | Event information related to server request processing |
| US9274919B2 (en) | 2011-04-29 | 2016-03-01 | Dynatrace Software Gmbh | Transaction tracing mechanism of distributed heterogenous transactions having instrumented byte code with constant memory consumption and independent of instrumented method call depth |
| US8639982B2 (en) | 2011-06-20 | 2014-01-28 | International Business Machines Corporation | Dynamic computer process probe |
| TWI497419B (en)* | 2011-10-20 | 2015-08-21 | Via Tech Inc | Computer apparatus and method for distributing interrupt task thereof |
| US9971603B2 (en)* | 2011-12-29 | 2018-05-15 | Intel Corporation | Causing an interrupt based on event count |
| US20140229715A1 (en)* | 2011-12-29 | 2014-08-14 | Laura A. Knauth | Apparatus and method for providing eventing ip and source data address in a statistical sampling infrastructure |
| US9916192B2 (en) | 2012-01-12 | 2018-03-13 | International Business Machines Corporation | Thread based dynamic data collection |
| CN102693159B (en) | 2012-05-09 | 2015-07-01 | 上海晨思电子科技有限公司 | Method and device for controlling hardware equipment based on user mode multitask |
| US9766999B2 (en) | 2014-05-30 | 2017-09-19 | Intel Corporation | Monitoring performance of a processing device to manage non-precise events |
| US9336391B2 (en)* | 2014-06-17 | 2016-05-10 | International Business Machines Corporation | Verification of intellectual property core trusted state |
| US9842038B2 (en)* | 2015-04-30 | 2017-12-12 | Advantest Corporation | Method and system for advanced fail data transfer mechanisms |
| CN106126336B (en)* | 2016-06-17 | 2019-06-04 | 上海兆芯集成电路有限公司 | Processor and Scheduling Method |
| US9965375B2 (en) | 2016-06-28 | 2018-05-08 | Intel Corporation | Virtualizing precise event based sampling |
| US10042737B2 (en) | 2016-08-31 | 2018-08-07 | Microsoft Technology Licensing, Llc | Program tracing for time travel debugging and analysis |
| US10031834B2 (en)* | 2016-08-31 | 2018-07-24 | Microsoft Technology Licensing, Llc | Cache-based tracing for time travel debugging and analysis |
| US10140056B2 (en)* | 2016-09-27 | 2018-11-27 | Intel Corporation | Systems and methods for differentiating function performance by input parameters |
| US10489273B2 (en) | 2016-10-20 | 2019-11-26 | Microsoft Technology Licensing, Llc | Reuse of a related thread's cache while recording a trace file of code execution |
| US10310963B2 (en) | 2016-10-20 | 2019-06-04 | Microsoft Technology Licensing, Llc | Facilitating recording a trace file of code execution using index bits in a processor cache |
| US10310977B2 (en) | 2016-10-20 | 2019-06-04 | Microsoft Technology Licensing, Llc | Facilitating recording a trace file of code execution using a processor cache |
| US10318332B2 (en) | 2017-04-01 | 2019-06-11 | Microsoft Technology Licensing, Llc | Virtual machine execution tracing |
| TWI636363B (en)* | 2017-08-08 | 2018-09-21 | 慧榮科技股份有限公司 | Method for performing dynamic resource management in a memory device, and associated memory device and controller thereof |
| CN107729221B (en)* | 2017-09-29 | 2020-12-11 | 深圳科立讯通信有限公司 | Method and device for monitoring messages among threads, computer equipment and storage medium |
| US11907091B2 (en) | 2018-02-16 | 2024-02-20 | Microsoft Technology Licensing, Llc | Trace recording by logging influxes to an upper-layer shared cache, plus cache coherence protocol transitions among lower-layer caches |
| US10747551B2 (en) | 2019-01-23 | 2020-08-18 | Salesforce.Com, Inc. | Software application optimization |
| US10802944B2 (en) | 2019-01-23 | 2020-10-13 | Salesforce.Com, Inc. | Dynamically maintaining alarm thresholds for software application performance management |
| US11194591B2 (en) | 2019-01-23 | 2021-12-07 | Salesforce.Com, Inc. | Scalable software resource loader |
| US10922095B2 (en) | 2019-04-15 | 2021-02-16 | Salesforce.Com, Inc. | Software application performance regression analysis |
| US10922062B2 (en) | 2019-04-15 | 2021-02-16 | Salesforce.Com, Inc. | Software application optimization |
| CN110535790B (en)* | 2019-08-23 | 2022-03-18 | 天津芯海创科技有限公司 | Method for processing abnormal message of exchange chip based on semaphore |
| CN112667318A (en)* | 2020-12-31 | 2021-04-16 | 京信网络系统股份有限公司 | Binding method, device, equipment and storage medium of logic core |
| US20230315470A1 (en)* | 2022-03-30 | 2023-10-05 | Intel Corporation | Control register set to facilitate processor event based sampling |
Citations (7)
| Publication number | Priority date | Publication date | Assignee | Title |
|---|---|---|---|---|
| US6256775B1 (en) | 1997-12-11 | 2001-07-03 | International Business Machines Corporation | Facilities for detailed software performance analysis in a multithreaded processor |
| US20050273310A1 (en) | 2004-06-03 | 2005-12-08 | Newburn Chris J | Enhancements to performance monitoring architecture for critical path-based analysis |
| US20060143608A1 (en) | 2004-12-28 | 2006-06-29 | Jan Dostert | Thread monitoring using shared memory |
| US20060248283A1 (en) | 2005-04-29 | 2006-11-02 | Galin Galchev | System and method for monitoring threads in a clustered server architecture |
| US20060294347A1 (en) | 2003-02-19 | 2006-12-28 | Xiang Zou | Programmable event driven yield mechanism which may activate service threads |
| US20070079294A1 (en)* | 2005-09-30 | 2007-04-05 | Robert Knight | Profiling using a user-level control mechanism |
| US20070079020A1 (en) | 2005-09-30 | 2007-04-05 | Gautham Chinya | Dynamically migrating channels |
- 2007
- 2007-12-18USUS11/958,764patent/US7962314B2/ennot_activeExpired - Fee Related
- 2008
- 2008-12-03KRKR1020107016120Apatent/KR20100112137A/ennot_activeWithdrawn
- 2008-12-03JPJP2010539421Apatent/JP2011507128A/enactivePending
- 2008-12-03GBGB1011296Apatent/GB2467891A/ennot_activeWithdrawn
- 2008-12-03WOPCT/US2008/013311patent/WO2009085088A1/enactiveApplication Filing
- 2008-12-03CNCN2008801250083Apatent/CN101952806A/enactivePending
- 2008-12-03DEDE112008003457Tpatent/DE112008003457T5/ennot_activeWithdrawn
- 2008-12-05TWTW097147292Apatent/TW200941338A/enunknown
Patent Citations (7)
| Publication number | Priority date | Publication date | Assignee | Title |
|---|---|---|---|---|
| US6256775B1 (en) | 1997-12-11 | 2001-07-03 | International Business Machines Corporation | Facilities for detailed software performance analysis in a multithreaded processor |
| US20060294347A1 (en) | 2003-02-19 | 2006-12-28 | Xiang Zou | Programmable event driven yield mechanism which may activate service threads |
| US20050273310A1 (en) | 2004-06-03 | 2005-12-08 | Newburn Chris J | Enhancements to performance monitoring architecture for critical path-based analysis |
| US20060143608A1 (en) | 2004-12-28 | 2006-06-29 | Jan Dostert | Thread monitoring using shared memory |
| US20060248283A1 (en) | 2005-04-29 | 2006-11-02 | Galin Galchev | System and method for monitoring threads in a clustered server architecture |
| US20070079294A1 (en)* | 2005-09-30 | 2007-04-05 | Robert Knight | Profiling using a user-level control mechanism |
| US20070079020A1 (en) | 2005-09-30 | 2007-04-05 | Gautham Chinya | Dynamically migrating channels |
Non-Patent Citations (1)
| Title |
|---|
| International Search Report in application No. PCT/US2008/013311 mailed Jun. 24, 2009. |
Cited By (60)
| Publication number | Priority date | Publication date | Assignee | Title |
|---|---|---|---|---|
| US8661455B2 (en) | 2009-04-21 | 2014-02-25 | International Business Machines Corporation | Performance event triggering through direct interthread communication on a network on chip |
| US20100269123A1 (en)* | 2009-04-21 | 2010-10-21 | International Business Machines Corporation | Performance Event Triggering Through Direct Interthread Communication On a Network On Chip |
| US20110289485A1 (en)* | 2010-05-21 | 2011-11-24 | International Business Machines Corporation | Software Trace Collection and Analysis Utilizing Direct Interthread Communication On A Network On Chip |
| US20110302560A1 (en)* | 2010-06-04 | 2011-12-08 | Guenther Nadbath | Real-time profiling in a multi-core architecture |
| US8607202B2 (en)* | 2010-06-04 | 2013-12-10 | Lsi Corporation | Real-time profiling in a multi-core architecture |
| US20130246736A1 (en)* | 2010-11-25 | 2013-09-19 | Toyota Jidosha Kabushiki Kaisha | Processor, electronic control unit and generating program |
| CN104094191A (en)* | 2012-02-01 | 2014-10-08 | 德克萨斯仪器股份有限公司 | Dynamic power management in real-time systems |
| US20130198540A1 (en)* | 2012-02-01 | 2013-08-01 | Sejoong LEE | Dynamic Power Management in Real Time Systems |
| CN104094191B (en)* | 2012-02-01 | 2017-06-23 | 德克萨斯仪器股份有限公司 | Dynamic power management in real-time system |
| US8775838B2 (en)* | 2012-02-01 | 2014-07-08 | Texas Instruments Incorporated | Limiting the number of unexpected wakeups in a computer system implementing a power-saving preemptive wakeup method from historical data |
| US9483269B2 (en) | 2012-03-16 | 2016-11-01 | International Business Machines Corporation | Hardware based run-time instrumentation facility for managed run-times |
| US9411591B2 (en)* | 2012-03-16 | 2016-08-09 | International Business Machines Corporation | Run-time instrumentation sampling in transactional-execution mode |
| EP2825965B1 (en)* | 2012-03-16 | 2023-01-18 | International Business Machines Corporation | Transformation of a program-event-recording event into a run-time instrumentation event |
| US20130247010A1 (en)* | 2012-03-16 | 2013-09-19 | International Business Machines Corporation | Run-time instrumentation sampling in transactional-execution mode |
| US9489285B2 (en) | 2012-03-16 | 2016-11-08 | International Business Machines Corporation | Modifying run-time-instrumentation controls from a lesser-privileged state |
| US9483268B2 (en) | 2012-03-16 | 2016-11-01 | International Business Machines Corporation | Hardware based run-time instrumentation facility for managed run-times |
| US9471315B2 (en) | 2012-03-16 | 2016-10-18 | International Business Machines Corporation | Run-time instrumentation reporting |
| US9465716B2 (en) | 2012-03-16 | 2016-10-11 | International Business Machines Corporation | Run-time instrumentation directed sampling |
| US9459873B2 (en) | 2012-03-16 | 2016-10-04 | International Business Machines Corporation | Run-time instrumentation monitoring of processor characteristics |
| US9158660B2 (en) | 2012-03-16 | 2015-10-13 | International Business Machines Corporation | Controlling operation of a run-time instrumentation facility |
| US9454462B2 (en) | 2012-03-16 | 2016-09-27 | International Business Machines Corporation | Run-time instrumentation monitoring for processor characteristic changes |
| US9250903B2 (en) | 2012-03-16 | 2016-02-02 | International Business Machinecs Corporation | Determining the status of run-time-instrumentation controls |
| US9250902B2 (en) | 2012-03-16 | 2016-02-02 | International Business Machines Corporation | Determining the status of run-time-instrumentation controls |
| US9280448B2 (en) | 2012-03-16 | 2016-03-08 | International Business Machines Corporation | Controlling operation of a run-time instrumentation facility from a lesser-privileged state |
| US9280447B2 (en) | 2012-03-16 | 2016-03-08 | International Business Machines Corporation | Modifying run-time-instrumentation controls from a lesser-privileged state |
| US9280346B2 (en) | 2012-03-16 | 2016-03-08 | International Business Machines Corporation | Run-time instrumentation reporting |
| US9442824B2 (en) | 2012-03-16 | 2016-09-13 | International Business Machines Corporation | Transformation of a program-event-recording event into a run-time instrumentation event |
| US9367316B2 (en) | 2012-03-16 | 2016-06-14 | International Business Machines Corporation | Run-time instrumentation indirect sampling by instruction operation code |
| US9367313B2 (en) | 2012-03-16 | 2016-06-14 | International Business Machines Corporation | Run-time instrumentation directed sampling |
| US9372693B2 (en) | 2012-03-16 | 2016-06-21 | International Business Machines Corporation | Run-time instrumentation sampling in transactional-execution mode |
| US9442728B2 (en) | 2012-03-16 | 2016-09-13 | International Business Machines Corporation | Run-time instrumentation indirect sampling by instruction operation code |
| US9395989B2 (en) | 2012-03-16 | 2016-07-19 | International Business Machines Corporation | Run-time-instrumentation controls emit instruction |
| US9400736B2 (en) | 2012-03-16 | 2016-07-26 | International Business Machines Corporation | Transformation of a program-event-recording event into a run-time instrumentation event |
| US9405543B2 (en) | 2012-03-16 | 2016-08-02 | International Business Machines Corporation | Run-time instrumentation indirect sampling by address |
| US9405541B2 (en) | 2012-03-16 | 2016-08-02 | International Business Machines Corporation | Run-time instrumentation indirect sampling by address |
| US9430238B2 (en) | 2012-03-16 | 2016-08-30 | International Business Machines Corporation | Run-time-instrumentation controls emit instruction |
| US20140089902A1 (en)* | 2012-09-27 | 2014-03-27 | International Business Machines Corporation | Monitoring software performance |
| US8910125B2 (en)* | 2012-09-27 | 2014-12-09 | International Business Machines Corporation | Monitoring software performance |
| US9798545B2 (en) | 2013-03-05 | 2017-10-24 | International Business Machines Corporation | Anticipated prefetching for a parent core in a multi-core chip |
| US9116816B2 (en) | 2013-03-05 | 2015-08-25 | International Business Machines Corporation | Prefetching for a parent core in a multi-core chip |
| US9141550B2 (en) | 2013-03-05 | 2015-09-22 | International Business Machines Corporation | Specific prefetch algorithm for a chip having a parent core and a scout core |
| US9141551B2 (en) | 2013-03-05 | 2015-09-22 | International Business Machines Corporation | Specific prefetch algorithm for a chip having a parent core and a scout core |
| US9135180B2 (en) | 2013-03-05 | 2015-09-15 | International Business Machines Corporation | Prefetching for multiple parent cores in a multi-core chip |
| US9128852B2 (en) | 2013-03-05 | 2015-09-08 | International Business Machines Corporation | Prefetching for a parent core in a multi-core chip |
| US9792120B2 (en) | 2013-03-05 | 2017-10-17 | International Business Machines Corporation | Anticipated prefetching for a parent core in a multi-core chip |
| US9128851B2 (en) | 2013-03-05 | 2015-09-08 | International Business Machines Corporation | Prefetching for multiple parent cores in a multi-core chip |
| US9852047B2 (en)* | 2013-03-15 | 2017-12-26 | Ab Initio Technology Llc | Recording program execution |
| US20140282418A1 (en)* | 2013-03-15 | 2014-09-18 | Ab Initio Technology Llc | Recording program execution |
| US9311221B2 (en)* | 2013-03-15 | 2016-04-12 | Ab Initio Technology Llc | Recording program execution |
| US20150317161A1 (en)* | 2014-04-30 | 2015-11-05 | Nicholas J. Murphy | System and method of context switching |
| US10031770B2 (en)* | 2014-04-30 | 2018-07-24 | Intel Corporation | System and method of delayed context switching in processor registers |
| US9880953B2 (en)* | 2015-01-05 | 2018-01-30 | Tuxera Corporation | Systems and methods for network I/O based interrupt steering |
| US20160196222A1 (en)* | 2015-01-05 | 2016-07-07 | Tuxera Corporation | Systems and methods for network i/o based interrupt steering |
| US11042403B2 (en)* | 2017-07-10 | 2021-06-22 | Intel Corporation | Platform auto-configuration and tuning |
| US11036693B2 (en) | 2017-08-07 | 2021-06-15 | Electronics And Telecommunications Research Institute | Apparatus of continuous profiling for multicore embedded system and method of the same |
| US11216055B2 (en) | 2018-02-09 | 2022-01-04 | Samsung Electronics Co., Ltd. | Mobile device including context hub and operation method thereof |
| US11971769B2 (en) | 2018-02-09 | 2024-04-30 | Samsung Electronics Co., Ltd. | Mobile device including context hub and operation method thereof |
| US11281967B1 (en)* | 2018-12-11 | 2022-03-22 | Amazon Technologies, Inc. | Event-based device performance monitoring |
| US11416749B2 (en) | 2018-12-11 | 2022-08-16 | Amazon Technologies, Inc. | Execution synchronization and tracking |
| US11126535B2 (en) | 2018-12-31 | 2021-09-21 | Samsung Electronics Co., Ltd. | Graphics processing unit for deriving runtime performance characteristics, computer system, and operation method thereof |
Also Published As
| Publication number | Publication date |
|---|---|
| GB201011296D0 (en) | 2010-08-18 |
| JP2011507128A (en) | 2011-03-03 |
| US20090157359A1 (en) | 2009-06-18 |
| DE112008003457T5 (en) | 2010-10-14 |
| KR20100112137A (en) | 2010-10-18 |
| GB2467891A (en) | 2010-08-18 |
| CN101952806A (en) | 2011-01-19 |
| WO2009085088A1 (en) | 2009-07-09 |
| TW200941338A (en) | 2009-10-01 |
Similar Documents
| Publication | Publication Date | Title |
|---|---|---|
| US7962314B2 (en) | Mechanism for profiling program software running on a processor | |
| JP4371452B2 (en) | Apparatus for spatial and temporal sampling in a computer memory system | |
| US10261792B2 (en) | Method and apparatus for obtaining a call stack to an event of interest and analyzing the same | |
| US7448025B2 (en) | Qualification of event detection by thread ID and thread privilege level | |
| US20070079294A1 (en) | Profiling using a user-level control mechanism | |
| KR100390610B1 (en) | Method and system for counting non-speculative events in a speculative processor | |
| US5657253A (en) | Apparatus for monitoring the performance of a microprocessor | |
| JP3113855B2 (en) | Performance monitoring in data processing systems | |
| EP3405875B1 (en) | Measuring address translation latency | |
| US7849465B2 (en) | Programmable event driven yield mechanism which may activate service threads | |
| US20110055838A1 (en) | Optimized thread scheduling via hardware performance monitoring | |
| US7703095B2 (en) | Information processing and control | |
| JPH11353231A (en) | Method for estimating statistic of characteristic of memory system interaction between contexts in computer system | |
| RU2670909C2 (en) | Thread context restoration in multi-threading computer system | |
| US5872913A (en) | System and method for low overhead, high precision performance measurements using state transistions | |
| JPH11316711A (en) | Method for estimating statistical value of characteristic of memory system transaction | |
| US6499116B1 (en) | Performance of data stream touch events | |
| JP7684989B2 (en) | Profiling sample manipulations handled by the processing circuit | |
| US8683483B2 (en) | Resource utilization monitor | |
| US7702887B1 (en) | Performance instrumentation in a fine grain multithreaded multicore processor | |
| Inam et al. | Bandwidth measurement using performance counters for predictable multicore software | |
| US20030135718A1 (en) | Method and system using hardware assistance for instruction tracing by revealing executed opcode or instruction | |
| US7051177B2 (en) | Method for measuring memory latency in a hierarchical memory system | |
| Mericas | Performance monitoring on the POWER5 microprocessor | |
| Larysch | Fine-grained estimation of memory bandwidth utilization |
Legal Events
| Date | Code | Title | Description |
|---|---|---|---|
| AS | Assignment | Owner name:ADVANCED MICRO DEVICES, INC., CALIFORNIA Free format text:ASSIGNMENT OF ASSIGNORS INTEREST;ASSIGNOR:CHERNOFF, ANTON;REEL/FRAME:020263/0381 Effective date:20071217 | |
| AS | Assignment | Owner name:GLOBALFOUNDRIES INC., CAYMAN ISLANDS Free format text:AFFIRMATION OF PATENT ASSIGNMENT;ASSIGNOR:ADVANCED MICRO DEVICES, INC.;REEL/FRAME:023120/0426 Effective date:20090630 Owner name:GLOBALFOUNDRIES INC.,CAYMAN ISLANDS Free format text:AFFIRMATION OF PATENT ASSIGNMENT;ASSIGNOR:ADVANCED MICRO DEVICES, INC.;REEL/FRAME:023120/0426 Effective date:20090630 | |
| STCF | Information on status: patent grant | Free format text:PATENTED CASE | |
| FPAY | Fee payment | Year of fee payment:4 | |
| AS | Assignment | Owner name:WILMINGTON TRUST, NATIONAL ASSOCIATION, DELAWARE Free format text:SECURITY AGREEMENT;ASSIGNOR:GLOBALFOUNDRIES INC.;REEL/FRAME:049490/0001 Effective date:20181127 | |
| FEPP | Fee payment procedure | Free format text:MAINTENANCE FEE REMINDER MAILED (ORIGINAL EVENT CODE: REM.); ENTITY STATUS OF PATENT OWNER: LARGE ENTITY | |
| LAPS | Lapse for failure to pay maintenance fees | Free format text:PATENT EXPIRED FOR FAILURE TO PAY MAINTENANCE FEES (ORIGINAL EVENT CODE: EXP.); ENTITY STATUS OF PATENT OWNER: LARGE ENTITY | |
| STCH | Information on status: patent discontinuation | Free format text:PATENT EXPIRED DUE TO NONPAYMENT OF MAINTENANCE FEES UNDER 37 CFR 1.362 | |
| FP | Lapsed due to failure to pay maintenance fee | Effective date:20190614 | |
| AS | Assignment | Owner name:GLOBALFOUNDRIES INC., CAYMAN ISLANDS Free format text:RELEASE BY SECURED PARTY;ASSIGNOR:WILMINGTON TRUST, NATIONAL ASSOCIATION;REEL/FRAME:054636/0001 Effective date:20201117 | |
| AS | Assignment | Owner name:GLOBALFOUNDRIES U.S. INC., NEW YORK Free format text:RELEASE BY SECURED PARTY;ASSIGNOR:WILMINGTON TRUST, NATIONAL ASSOCIATION;REEL/FRAME:056987/0001 Effective date:20201117 |