US7904355B1 - Systems and methods for a revenue causality analyzer - Google Patents
Systems and methods for a revenue causality analyzerDownload PDFInfo
- Publication number
- US7904355B1 US7904355B1US12/027,193US2719308AUS7904355B1US 7904355 B1US7904355 B1US 7904355B1US 2719308 AUS2719308 AUS 2719308AUS 7904355 B1US7904355 B1US 7904355B1
- Authority
- US
- United States
- Prior art keywords
- time period
- revenue
- products
- data
- currencies
- Prior art date
- Legal status (The legal status is an assumption and is not a legal conclusion. Google has not performed a legal analysis and makes no representation as to the accuracy of the status listed.)
- Active, expires
Links
Images


Classifications
- G—PHYSICS
- G06—COMPUTING OR CALCULATING; COUNTING
- G06Q—INFORMATION AND COMMUNICATION TECHNOLOGY [ICT] SPECIALLY ADAPTED FOR ADMINISTRATIVE, COMMERCIAL, FINANCIAL, MANAGERIAL OR SUPERVISORY PURPOSES; SYSTEMS OR METHODS SPECIALLY ADAPTED FOR ADMINISTRATIVE, COMMERCIAL, FINANCIAL, MANAGERIAL OR SUPERVISORY PURPOSES, NOT OTHERWISE PROVIDED FOR
- G06Q40/00—Finance; Insurance; Tax strategies; Processing of corporate or income taxes
- G06Q40/02—Banking, e.g. interest calculation or account maintenance
- G—PHYSICS
- G06—COMPUTING OR CALCULATING; COUNTING
- G06Q—INFORMATION AND COMMUNICATION TECHNOLOGY [ICT] SPECIALLY ADAPTED FOR ADMINISTRATIVE, COMMERCIAL, FINANCIAL, MANAGERIAL OR SUPERVISORY PURPOSES; SYSTEMS OR METHODS SPECIALLY ADAPTED FOR ADMINISTRATIVE, COMMERCIAL, FINANCIAL, MANAGERIAL OR SUPERVISORY PURPOSES, NOT OTHERWISE PROVIDED FOR
- G06Q40/00—Finance; Insurance; Tax strategies; Processing of corporate or income taxes
- G06Q40/12—Accounting
Definitions
- This inventionrelates generally to revenue causality analyzer system and method to provide fast and efficient analysis of revenue causality for price management and business management. More particularly, the present invention relates to a method for analyzing changes in revenue over two time periods to attribute the components causally responsible for the change in revenue.
- causal factorsmay also be referred to as causal effects or causalities. These factors include changes in product pricing, changes in the volume of products sold, changes in product mix sold, changes in costs, changes in exchange rates, and any additional factors that may play a role in revenue changes.
- a method and system for a Revenue Causality Analyzeris useful for a business to analyze revenue changes, and attribute those changes to causal effects. Such an analysis may be utilized by the business for price management.
- the revenue causality analyzeris capable of accurately attributing causality effects for changes in revenue quickly and efficiently.
- the revenue causality analyzeris useful in association with products, and comprises a selector for selecting a reference time period and a comparison time period, a receiver configured to receive transaction data including pricing data and volume data about the products at reference and comparison times, a preparer that includes a missing data exchanger and data error corrector, an attributor for attributing causality effects including a price effect, a volume effect, a mix effect, an exchange effect, a cost effect, a dividend effect, a loss effect, and an inventory appreciation effect, by analyzing transaction data through a causality equation; and an output.
- the price effectcomprises summing the product of the change in price for the products at the currencies by the volume of the products sold in the comparison time period across the products and currencies.
- the volume effectcomprises the product of the change in volume by the revenue per product sold in the reference time period.
- the mix effectcomprises the product of the percent revenue change by the volume of products sold in the comparison time period.
- the exchange effectcomprises summing the product of the changes in price for the products at the comparison time in the currencies due to exchange rate difference and the volume of sales of the products at the comparison time period across products and currencies.
- FIG. 1shows a block diagram illustrating the revenue causality analyzer in accordance with an embodiment of the present invention
- FIG. 2shows a flow chart illustrating the process for analyzing revenue causality for the revenue causality analyzer of FIG. 1 ;
- FIG. 3shows a flow chart illustrating the process for a data preparation for the revenue causality analyzer of FIG. 1 ;
- FIG. 4Ashows an illustration of a raw exemplary data chart for the revenue causality analyzer of FIG. 1 ;
- FIG. 4Bshows an illustration of a prepared exemplary data chart for the revenue causality analyzer of FIG. 1 ;
- FIG. 5shows a flow chart illustrating the process for replacement of missing data for the revenue causality analyzer of FIG. 1 ;
- FIG. 6shows a causality waterfall diagram for the revenue causality analyzer of FIG. 1 ;
- FIG. 7shows an illustration of an exemplary output for the revenue causality analyzer of FIG. 1 ;
- FIG. 8shows an illustration of a user interface for the revenue causality analyzer of FIG. 1 ;
- FIG. 9Aillustrates a computer system, which forms part of a network and is suitable for implementing the revenue causality analyzer of FIG. 1 ;
- FIG. 9Billustrates a block diagram of a computer system and network suitable for implementing the revenue causality analyzer of FIG. 1 .
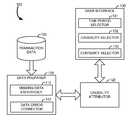
- FIG. 1shows a block diagram illustrating the Revenue Causality Analyzer 100 in accordance with an embodiment of the present invention.
- the Revenue Causality Analyzer 100receives Transaction Data 105 via the Data Preparer 110 .
- the Data Preparer 110prepares Transaction Data 105 for use by the Causality Attributor 120 .
- the Data Preparer 110includes a Missing Data Exchanger 111 , and a Data Error Corrector 112 .
- the Missing Data Exchanger 111replaces any missing data, and the Data Error Corrector 112 corrects errors in the data set.
- the Data Preparer 110is coupled to the Causality Attributor 120 .
- the Causality Attributor 120calculates the causality effects by utilizing causality equations.
- the Causality Attributor 120couples to a User Interface 130 .
- the User Interface 130includes a Time Period Selector 131 , a Causality Selector 132 and a Currency Selector 133 .
- the Time Period Selector 131enables the user to select time periods for comparison by the Causality Attributor 120 .
- the Causality Selector 132enables the user to select the causal effects of interest for analysis by the Causality Attributor 120 .
- the Currency Selector 133enables the user to select for the currency of interest for analysis by the Causality Attributor 120 .
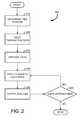
- FIG. 2shows a flow chart 200 illustrating the process for analyzing revenue causality in accordance with the Revenue Causality Analyzer 100 illustrated in FIG. 1 .
- the time periods to be comparedare selected.
- a reference time period and a comparison time periodis selected.
- these time periodsmay include consecutive financial quarters.
- the time periodsmay include similar times brackets on a recurring annual basis.
- Transaction Data 105 for each time period selected in step 210may be input for further processing. Input may be preformed manually, with the user entering transaction data. Alternatively, in some embodiments, Transaction Data 105 may be electronically compiled through point-of-sales data from a cash register, invoice compilation, or electronic bookkeeping software. Transaction Data 105 includes, but is not limited to, products, the price of each product, volume of each product sold, cost data and exchange rate data. Cost data may include costs per product, or cost estimations. In some embodiments, product, price and volume is the only data required in order to perform a comprehensive revenue causality analysis of price effect, volume effect and mix effect. These data are routinely recorded by most businesses, and thus the present invention enables extensive, accurate revenue causality analysis with minimal data collection effort from the business.
- step 230the inputted Transaction Data 105 is prepared for analysis. Preparation may include entering missing data values and correcting data errors. Such errors may exist due to changes in the product line, data input errors, software glitches or human errors.
- step 240the prepared data is run through causality equations, which determine the amount of revenue attributable to each causality effect.
- step 250the results of the causality equations are outputted for user consumption. Results may then be used in downstream applications and for raw consumption for price management purposes.
- the outputmay be in terms of a dollar amount, wherein the summation of all the causal effects is equal the change in revenue between the reference time period and the comparison time period. Additionally, the output may be a function of marginal changes.
- step 260the user may choose to interact with the outputted results in order to make alterations to transaction data, hone in on specific results or otherwise segregate the outputted results in order to increase their functionality. If the user decides to interact with the outputted data then the process returns to step 240 , where the causality equations are run again. The outputted results may then be updated, in step 250 , to incorporate the interactions. Next, the user again is given the option to interact with the outputted results, in step 260 . Otherwise, if the user does not choose to interact with the results the process ends.
- FIG. 3shows a flow chart expounding the Preparation of Data 230 .
- missing data pointsare replaced, in step 331 .
- step 332errors in the data are corrected for.
- FIG. 4AAn example of such a situation is shown in the exemplary data chart illustrated in FIG. 4A .
- six productsare shown, A-F, in the leftmost column.
- Price and product sales volumeare shown in the remaining columns for both the reference and comparison time periods. Time periods are labeled at the top row.
- Price and volume columnsare referenced by the labels in the second row.
- the price informationis shown in dollars; however, any denominator may be used.
- volumeis given in units; however, any measure of quantity may be used, such as lots or batches.
- product Ais seen to be discontinued in the comparison time period, as seen by missing data points.
- products E and Fare introduced in the comparison time period, but do not exist during the reference time period.
- FIG. 4Bthe exemplary data table of FIG. 4A is again shown, however in this data table the missing data points have been replaced with functional data points. These replacements are seen as lighter numerals for the comparison data for product A, and reference data for products E and F.
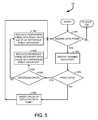
- FIG. 5shows a flow chart 331 illustrating the process of replacing missing data points.
- a searchis done of the data set to determine if any data points are missing. If no data points are missing the process ends, otherwise the data point is identified in step 502 . Then, in step 503 , an inquiry is made as to if the missing data point identified is price data. If the data point is not price data, then the missing data point is replaced with a zero value, in step 504 . This replacement occurs whenever product sales volume data is missing. After the data is replaced the process returns to step 502 , to determine if there are any remaining missing data points.
- step 503an inquiry is made as to if the missing data point is from the reference data set, in step 505 . If the missing data point is a reference data point, then the missing data point is replaced with the pricing data for the same product from the comparison time period data set, in step 506 . After the data is replaced the process returns to step 502 , to determine if there are any remaining missing data points.
- the missing data pointis not a reference data point (comparison data point)
- the missing data pointis replaced with the pricing data for the same product from the reference time period data, in step 507 .
- the processreturns to step 502 , to determine if there are any remaining missing data points.
- data preparationmay include Correction of Data Errors 332 .
- Obvious data discrepanciessuch as negative price data, may be corrected in this step.
- data values greater than an expected values by a predetermined valuemay also be corrected. For example, in some embodiments, if sales volume data is greater than two standard deviations from the expected sales volume, the data point may be corrected to reflect the expected value instead of the erroneous value.
- Transaction Data 105may include redundant data. For example, if Transaction Data 105 includes price, volume and aggregate revenue data, a comparison may be made between the transaction revenue data and the calculated revenue found by multiplying together price and volume data. If a discrepancy exists, the data may be combed in order to identify and correct the erroneous transaction data.
- Transaction Data 105After Transaction Data 105 has been Prepared 230 it may be analyzed by the causality equations to determine to what extent each causal effect contributes to the change in revenue.
- Causality equationincludes component equations known as effects. Said effects include a price effect, a volume effect, a mix effect, an exchange effect and a cost effect. Additional effects exist, and may be included within the causality equation as needs dictate. For most business applications, however, the above list of effects is sufficient for rapid and accurate Revenue Causality Analysis 200 . The said effects may be summed to provide for the change in revenue.
- Subscript—iProduct, where products are items with common UPC numbers, model numbers or SKU numbers.
- Ntotal number of products.
- p ilkthe price of product i in the reference time period (time period 1), in currency k.
- v ilkthe volume of product i sold in the reference time period (time period 1), in currency k.
- v i2kthe volume of product i sold in the comparison time period (time period 2), in currency k.
- e lkthe exchange rate in the reference time period (time period 1), in currency k. Assume the e lk for the base currency is always 1.
- e 2kthe exchange rate in the reference time period (time period 2), in currency k. Assume the e 2k for the base currency is always 1.
- the change in Revenuemay be given as part of the transaction data, or may be calculated from the price and volume data.
- the change in revenueis given by:
- the price of each product in the comparison time period at a certain currencyis multiplied by the volume of the product sold in the comparison period in that currency (v i2k ), thus providing the revenue for each product in the comparison time period in that currency.
- All product revenues for the comparison time period in that currencyare divided by the exchange rate at the comparison time period for that currency (e 2k ), to produce relative product revenues for the comparison time period.
- the relative product revenues for the comparison time periodare summed for each product, thus providing the total revenue for the comparison time period for a currency.
- the total revenue for the comparison time period for each currencyis then summed across each currency to produce the total revenue for the comparison time period.
- each product in the reference time period at a certain currencyis multiplied by the volume of the product in the reference period in that currency (v ilk ), thus providing the revenue for each product in the reference time period in that currency.
- All product revenues for the reference time period in that currencyare divided by the exchange rate at the reference time period for that currency (e lk ), to produce relative product revenues for the reference time period.
- the relative product revenues for the reference time periodare summed for each product, thus providing the total revenue for the reference time period for a currency.
- the total revenue for the reference time period for each currencyis then summed across each currency to produce the total revenue for the reference time period.
- the total revenue for the reference time periodis subtracted from the total revenue for the comparison time period, thereby providing the change in revenue.
- the price effectcalculates the quantity of revenue change that is attributable to changes in pricing.
- the price of each product at the reference time period in a certain currency(p ilk ) is subtracted from the price of the same product at the comparison time period in the currency (p i2k ), thus providing the change in price for each product at the currency.
- the change in price for each product at the currencyis divided by the exchange rate for the currency at the reference time period (e lk ), to produce the relative change in price for each product at that currency.
- the relative change in price for each product at that currencyis multiplied by the volume of the same product sold during the comparison time period at that currency (v i2k ). This provides the price effect per product at that currency.
- the price effects for each product at that currencyare summed across all products to provide the price effect at that currency.
- the price effect at that currencyis summed across all currencies to produce the price effect.
- the volume effectcalculates the quantity of revenue change that is attributable to changes in volumes sold.
- the volumes of all products sold for the reference time period in a currencyare summed across the products, resulting in the total volume for the reference time period in a currency. Then, total volume for the reference time period in a currency is summed across all currencies to produce the total volume for the reference time period.
- the volumes of all products sold for the comparison time period in a currencyare summed across the products, resulting in the total volume for the comparison time period in a currency. Then, total volume for the comparison time period in a currency is summed across all currencies to produce the total volume for the comparison time period. The total volume for the comparison time period is subtracted by the total volume for the reference time period to determine the change in volume.
- the total revenue for the reference time periodis calculated.
- the price of each product in the reference time period at a certain currency (p ilk )is multiplied by the volume of the product in the reference period in that currency (v ilk ), providing the revenue for each product in the reference time period in that currency.
- All product revenues for the reference time period in that currencyare divided by the exchange rate at the reference time period for that currency (e lk ), to produce relative product revenues for the reference time period at that currency.
- the relative product revenues for the reference time period at that currencyare summed for each product, thus providing the total revenue for the reference time period for that currency.
- the total revenue for the reference time period for each currencyis then summed across each currency to produce the total revenue for the reference time period.
- the total revenue for the reference time periodis then divided by the total volume sales for the reference time period.
- Total revenue divided by total volumeproduces a value of the revenue per product sold in the reference time period.
- the total volume sales of the reference time periodis found by summing the volumes of all products sold for the reference time period in a currency (v ilk ), across the products, resulting in the total volume for the reference time period in a currency. Then, total volume for the reference time period in a currency is summed across all currencies to produce the total volume for the reference time period.
- the mix effectcalculates the quantity of revenue change that is attributable to changes in the mix of products sold.
- the volumes of all products sold for the comparison time period in a currencyare summed across the products, resulting in the total volume for the comparison time period in a currency. Then, total volume for the comparison time period in a currency is summed across all currencies to produce the total volume for the comparison time period.
- the volumes of all products sold for the reference time period in a currencyare summed across the products, resulting in the total volume for the reference time period in a currency. Then, total volume for the reference time period in a currency is summed across all currencies to produce the total volume for the reference time period.
- volume of each product sold in the reference time period in a currency(v ilk ) is divided by the total volume for the reference time period, thus calculating the percent of sales volume for the product in the reference time period in the currency.
- the volume of each product sold in the comparison time period in a currency(v i2k ) is divided by the total volume for the comparison time period, thus calculating the percent of sales volume for the product in the comparison time period in the currency.
- the percent of sales volume for the product in the reference time period in the currencyis then subtracted from the percent of sales volume for the product in the comparison time period in the currency, to give the change in percent of sales volume for the product in the currency.
- the price of the product for the reference time period in the currency (p ilk )is divided by the exchange rate at the reference time period for that currency (e lk ), to produce relative price of the product for the reference time in the currency.
- the relative price of the product for the reference time in the currencyis then multiplied by the change in percent of sales volume for the product in the currency, thus calculating the percent revenue change of the product in the currency.
- the percent revenue change of the product in the currencyis summed across all products, thus producing a total percent revenue change in the currency.
- the total percent revenue change in the currencyis summed across all currencies, thus producing a total percent revenue change.
- the total percent revenue changeis multiplied by the total volume for the comparison period, thus giving the mix effect.
- the exchange effectcalculates the quantity of revenue change that is attributable to exchange rates.
- the price of the product for the comparison time period in the currency (p i2k )is divided by the exchange rate at the comparison time period for that currency (e 2k ), to produce the relative price of the product for the comparison time in the currency.
- the price of the product for the comparison time period in the currency (p i2k )is divided by the exchange rate at the reference time period for that currency (e lk ), to produce the price of the product for the comparison time in the currency at the reference rate.
- the change in price for the product at the comparison time due to exchange rate differenceis multiplied by the volume of sales of a product at the comparison time period at the currency (v i2k ) to calculate the change in revenue for the product at the comparison time in a currency due to exchange rate difference.
- the change in revenue for the product at the comparison time in a currency due to exchange rate differenceis summed across all products to calculate change in revenue at the comparison time in a currency due to exchange rate difference.
- the change in revenue at the comparison time in a currency due to exchange rate differenceis summed across all currencies to calculate the exchange effect.
- causality equationincludes the sum of the effects, equal to the change in revenue.
- the causality equationis shown below:
- alternate effectsmay be included within the causality equation.
- cost effectsdividend gains, stock sales, inventory appreciation/depreciation, and theft/loss may be included as additional causal effects. It should be noted, as is well known to those skilled in the art, that with the inclusion of a cost effect the analysis becomes a marginal change causality analysis.
- Transaction Data 105may include cost data associated with each product.
- the cost datamay be estimated using industry standards.
- both real datamay be included when available, and missing cost data may be estimated in the data preparation step 230 .
- the causality equationis intended to be flexible enough to meet business needs, without placing any burden upon the business data collection practices.
- Another example of the flexibility of the causality equationincludes a business which utilizes one currency, thus eliminating the need for exchange effects.
- FIG. 6shows an example of a causality waterfall diagram derived from the analysis of revenue of causality for the exemplary data charts shown in FIGS. 4A and 4B .
- the causality waterfall diagramillustrates the increase in revenue from the reference time period to the comparison time period as being an increase of roughly 14%.
- the price effect, volume effect and mix effectare also shown. Price effect and volume effects are negative in this example; however, the mix effect is positive enough to offset the price and volume effects, and is accountable for a positive revenue change. In this example only one currency is considered, therefore the exchange effect is inconsequential.
- FIG. 7shows an illustration of an exemplary output for the Revenue Causality Analyzer 100 when realistic Transaction Data 105 is utilized for product families.
- the revenue for the reference time period and the comparison time periodis shown, along with the change in revenue for each product family.
- the relevant price effect, volume effect and mix effect for each product familyis also shown.
- the usermay be able to expand the product family categories.
- Product familiesmay include individual products, product sub-groupings, or a combination. For example, within the product family labeled ‘Wireless’ there may exist a subgroup for wireless hardware and another subgroup for wireless management software. Each subgroup may include yet smaller subgroups, individual products, or a combination of both.
- the usermay Interact 260 with the output by honing into individual subgroups.
- the Transaction Data 105 from the subgroupsmay then be analyzed by Applying the Causality Equation 240 to determine the causality effects of the individual subgroup.
- the usermay develop a greater understanding of the causal effects on revenue for every level of the business.
- a refined and detailed business planmay be implemented in order to most effectuate a business goal.
- FIG. 8shows an illustration of a user interface for the analysis of revenue causality. This interface illustrates the ability for the causality analyzer to be incorporated into a system for advanced effect analysis, including the tracking of effect trends and ease of user interaction across product families, sales regions and sales channel.
- FIGS. 9A and 9Billustrate a Computer System 900 , which is suitable for implementing embodiments of the present invention.
- FIG. 9Ashows one possible physical form of the Computer System 900 .
- the Computer System 900may have many physical forms ranging from a printed circuit board, an integrated circuit, and a small handheld device up to a huge super computer.
- Computer system 900may include a Monitor 902 , a Display 904 , a Housing 906 , a Disk Drive 908 , a Keyboard 910 , and a Mouse 912 .
- Disk 914is a computer-readable medium used to transfer data to and from Computer System 900 .
- FIG. 9Bis an example of a block diagram for Computer System 900 . Attached to System Bus 920 are a wide variety of subsystems.
- Processor(s) 922also referred to as central processing units, or CPUs
- Memory 924includes random access memory (RAM) and read-only memory (ROM).
- RAMrandom access memory
- ROMread-only memory
- RAMrandom access memory
- ROMread-only memory
- Both of these types of memoriesmay include any suitable of the computer-readable media described below.
- a Fixed Disk 926may also be coupled bi-directionally to the Processor 922 ; it provides additional data storage capacity and may also include any of the computer-readable media described below.
- Fixed Disk 926may be used to store programs, data, and the like and is typically a secondary storage medium (such as a hard disk) that is slower than primary storage. It will be appreciated that the information retained within Fixed Disk 926 may, in appropriate cases, be incorporated in standard fashion as virtual memory in Memory 924 .
- Removable Disk 914may take the form of any of the computer-readable media described below.
- Processor 922is also coupled to a variety of input/output devices, such as Display 904 , Keyboard 910 , Mouse 912 and Speakers 930 .
- an input/output devicemay be any of: video displays, track balls, mice, keyboards, microphones, touch-sensitive displays, transducer card readers, magnetic or paper tape readers, tablets, styluses, voice or handwriting recognizers, biometrics readers, or other computers.
- Processor 922optionally may be coupled to another computer or telecommunications network using Network Interface 940 . With such a Network Interface 940 , it is contemplated that the Processor 922 might receive information from the network, or might output information to the network in the course of performing the above-described Revenue Causality Analyzer 100 .
- method embodiments of the present inventionmay execute solely upon Processor 922 or may execute over a network such as the Internet in conjunction with a remote CPU that shares a portion of the processing.
- embodiments of the present inventionfurther relate to computer storage products with a computer-readable medium that have computer code thereon for performing various computer-implemented operations.
- the media and computer codemay be those specially designed and constructed for the purposes of the present invention, or they may be of the kind well known and available to those having skill in the computer software arts.
- Examples of computer-readable mediainclude, but are not limited to: magnetic media such as hard disks, floppy disks, and magnetic tape; optical media such as CD-ROMs and holographic devices; magneto-optical media such as floptical disks; and hardware devices that are specially configured to store and execute program code, such as application-specific integrated circuits (ASICs), programmable logic devices (PLDs) and ROM and RAM devices.
- Examples of computer codeinclude machine code, such as produced by a compiler, and files containing higher level code that are executed by a computer using an interpreter.
Landscapes
- Business, Economics & Management (AREA)
- Accounting & Taxation (AREA)
- Finance (AREA)
- Engineering & Computer Science (AREA)
- Development Economics (AREA)
- Economics (AREA)
- Marketing (AREA)
- Strategic Management (AREA)
- Technology Law (AREA)
- Physics & Mathematics (AREA)
- General Business, Economics & Management (AREA)
- General Physics & Mathematics (AREA)
- Theoretical Computer Science (AREA)
- Financial Or Insurance-Related Operations Such As Payment And Settlement (AREA)
Abstract
Description
Claims (18)
Priority Applications (2)
| Application Number | Priority Date | Filing Date | Title |
|---|---|---|---|
| US12/027,193US7904355B1 (en) | 2007-02-20 | 2008-02-06 | Systems and methods for a revenue causality analyzer |
| US13/024,875US8412598B2 (en) | 2008-02-06 | 2011-02-10 | Systems and methods for a causality analyzer |
Applications Claiming Priority (2)
| Application Number | Priority Date | Filing Date | Title |
|---|---|---|---|
| US89077707P | 2007-02-20 | 2007-02-20 | |
| US12/027,193US7904355B1 (en) | 2007-02-20 | 2008-02-06 | Systems and methods for a revenue causality analyzer |
Related Child Applications (1)
| Application Number | Title | Priority Date | Filing Date |
|---|---|---|---|
| US13/024,875Continuation-In-PartUS8412598B2 (en) | 2008-02-06 | 2011-02-10 | Systems and methods for a causality analyzer |
Publications (1)
| Publication Number | Publication Date |
|---|---|
| US7904355B1true US7904355B1 (en) | 2011-03-08 |
Family
ID=43639372
Family Applications (1)
| Application Number | Title | Priority Date | Filing Date |
|---|---|---|---|
| US12/027,193Active2028-12-25US7904355B1 (en) | 2007-02-20 | 2008-02-06 | Systems and methods for a revenue causality analyzer |
Country Status (1)
| Country | Link |
|---|---|
| US (1) | US7904355B1 (en) |
Cited By (5)
| Publication number | Priority date | Publication date | Assignee | Title |
|---|---|---|---|---|
| US20100114636A1 (en)* | 2008-10-31 | 2010-05-06 | At&T Labs, Inc. | Method and System of Multidimensional Attribution Analysis |
| US20100218136A1 (en)* | 2004-05-13 | 2010-08-26 | Scottrade, Inc. | Method and Apparatus for User-Interactive Financial Instrument Trading |
| US20150094983A1 (en)* | 2013-09-30 | 2015-04-02 | Nec (China) Co., Ltd. | Feature extraction method and apparatus for use in casual effect analysis |
| US9430720B1 (en) | 2011-09-21 | 2016-08-30 | Roman Tsibulevskiy | Data processing systems, devices, and methods for content analysis |
| US11086881B2 (en) | 2015-09-23 | 2021-08-10 | Industrial Technology Research Institute | Method and device for analyzing data |
Citations (106)
| Publication number | Priority date | Publication date | Assignee | Title |
|---|---|---|---|---|
| US3806711A (en) | 1972-08-25 | 1974-04-23 | E Cousins | Automatic merchandise pricing calculator |
| US5053957A (en) | 1987-10-23 | 1991-10-01 | Omron Tateisi Electronics Co. | Electronic cash register having discount prices selected by customer level |
| US5224034A (en) | 1990-12-21 | 1993-06-29 | Bell Communications Research, Inc. | Automated system for generating procurement lists |
| US5461708A (en) | 1993-08-06 | 1995-10-24 | Borland International, Inc. | Systems and methods for automated graphing of spreadsheet information |
| US5497489A (en) | 1987-05-05 | 1996-03-05 | Menne; David M. | Data storage and retrieval systems having labelling for data |
| US5537590A (en) | 1993-08-05 | 1996-07-16 | Amado; Armando | Apparatus for applying analysis rules to data sets in a relational database to generate a database of diagnostic records linked to the data sets |
| US5590269A (en) | 1994-04-22 | 1996-12-31 | Minnesota Mining & Manufacturing Company | Resource assignment system providing mixed-initiative user interface updates |
| US5670984A (en) | 1993-10-26 | 1997-09-23 | Xerox Corporation | Image lens |
| US5689287A (en) | 1993-10-27 | 1997-11-18 | Xerox Corporation | Context-preserving display system using a perspective sheet |
| US5710887A (en) | 1995-08-29 | 1998-01-20 | Broadvision | Computer system and method for electronic commerce |
| US5740448A (en) | 1995-07-07 | 1998-04-14 | Sun Microsystems, Inc. | Method and apparatus for exclusive access to shared data structures through index referenced buffers |
| US5758327A (en) | 1995-11-01 | 1998-05-26 | Ben D. Gardner | Electronic requisition and authorization process |
| US5808894A (en) | 1994-10-26 | 1998-09-15 | Optipat, Inc. | Automated ordering method |
| US5870717A (en) | 1995-11-13 | 1999-02-09 | International Business Machines Corporation | System for ordering items over computer network using an electronic catalog |
| US5873069A (en) | 1995-10-13 | 1999-02-16 | American Tv & Appliance Of Madison, Inc. | System and method for automatic updating and display of retail prices |
| US5878400A (en) | 1996-06-17 | 1999-03-02 | Trilogy Development Group, Inc. | Method and apparatus for pricing products in multi-level product and organizational groups |
| US5946666A (en) | 1996-05-21 | 1999-08-31 | Albert Einstein Healthcare Network | Monitoring device for financial securities |
| US6009407A (en) | 1998-02-27 | 1999-12-28 | International Business Machines Corporation | Integrated marketing and operations decisions-making under multi-brand competition |
| US6075530A (en) | 1997-04-17 | 2000-06-13 | Maya Design Group | Computer system and method for analyzing information using one or more visualization frames |
| US6078901A (en) | 1997-04-03 | 2000-06-20 | Ching; Hugh | Quantitative supply and demand model based on infinite spreadsheet |
| US6151031A (en) | 1996-09-09 | 2000-11-21 | Hewlett-Packard Company | Map builder system and method for enabling generic interfacing of an application with a display map generation process in a management system |
| US6211880B1 (en) | 1998-04-13 | 2001-04-03 | Albert Joseph Impink, Jr. | Display apparatus |
| US20010003814A1 (en) | 1999-12-09 | 2001-06-14 | Sony Corporation | Information processing apparatus and method, and storage medium |
| US6320586B1 (en) | 1998-11-04 | 2001-11-20 | Sap Aktiengesellschaft | System an method for the visual display of data in an interactive split pie chart |
| US6336094B1 (en)* | 1995-06-30 | 2002-01-01 | Price Waterhouse World Firm Services Bv. Inc. | Method for electronically recognizing and parsing information contained in a financial statement |
| US20020007323A1 (en) | 2000-06-05 | 2002-01-17 | Masaharu Tamatsu | Order placement and payment settlement system |
| US20020032610A1 (en) | 2000-05-03 | 2002-03-14 | Gold Stephen E. | Method for providing automated delivery of a response to a pricing inquiry |
| US20020042782A1 (en) | 2000-10-06 | 2002-04-11 | International Business Machines Corporation | System and method for generating a contract and conducting contractual activities under the contract |
| US20020052817A1 (en) | 2000-11-02 | 2002-05-02 | David Dines | Sales transactions for transfer of commodities |
| US20020059229A1 (en) | 2000-10-04 | 2002-05-16 | Nsk Ltd. | Method and system for providing performance index information of a machine element, and method and system for supporting selection of a machine element |
| US20020072993A1 (en) | 2000-11-03 | 2002-06-13 | Sandus James A. | Method and system of an integrated business topography and virtual 3D network portal |
| US20020099596A1 (en) | 2000-11-27 | 2002-07-25 | Geraghty Michael Kevin | Dynamic ratemaking for insurance |
| US20020107819A1 (en) | 1997-05-21 | 2002-08-08 | Ouimet Kenneth J. | Strategic planning and optimization system |
| US6434533B1 (en) | 1999-10-27 | 2002-08-13 | Market Data Systems, Inc. | Method for the exchange, analysis, and reporting of performance data in businesses with time-dependent inventory |
| US20020116348A1 (en) | 2000-05-19 | 2002-08-22 | Phillips Robert L. | Dynamic pricing system |
| US20020128953A1 (en) | 2000-09-15 | 2002-09-12 | Jim Quallen | Price discovery and negotiations and related processes |
| US20020152133A1 (en) | 2001-03-09 | 2002-10-17 | King John Thorne | Marketplaces for on-line contract negotiation, formation, and price and availability querying |
| US20020152150A1 (en) | 2001-04-17 | 2002-10-17 | Lisette Cooper | Visualization of asset information |
| US20020156695A1 (en) | 2001-01-19 | 2002-10-24 | Globalserve Computer Services, Ltd. | Electronic procurement |
| US20020165760A1 (en) | 2001-05-04 | 2002-11-07 | Phil Delurgio | Interface for merchandise price optimization |
| US20020165726A1 (en) | 2001-05-07 | 2002-11-07 | Grundfest Joseph A. | System and method for facilitating creation and management of contractual relationships and corresponding contracts |
| US20020178077A1 (en) | 2001-05-25 | 2002-11-28 | Katz Steven Bruce | Method for automatically invoking a software module in response to an internal or external event affecting the procurement of an item |
| US20020188576A1 (en) | 2001-05-14 | 2002-12-12 | Eric Peterson | Pricing method and program product for usage based service |
| US20020194051A1 (en) | 2001-05-31 | 2002-12-19 | Hall Stephen A. | Data distribution method and sytem |
| US20030009411A1 (en) | 2001-07-03 | 2003-01-09 | Pranil Ram | Interactive grid-based graphical trading system for real time security trading |
| US20030028451A1 (en) | 2001-08-03 | 2003-02-06 | Ananian John Allen | Personalized interactive digital catalog profiling |
| US20030033240A1 (en) | 2001-06-11 | 2003-02-13 | Opt4 Derivatives, Inc. | Integrated electronic exchange of structured contracts with dynamic risk-based transaction permissioning |
| US6536037B1 (en)* | 1999-05-27 | 2003-03-18 | Accenture Llp | Identification of redundancies and omissions among components of a web based architecture |
| US20030095256A1 (en) | 2001-10-18 | 2003-05-22 | Cargill Robert L. | Method and apparatus for quantifying an "integrated index" of a material medium |
| US20030110066A1 (en) | 2001-12-10 | 2003-06-12 | I2 Technologies Us, Inc. | Generating an optimized pricing plan |
| US20030115129A1 (en) | 2000-03-16 | 2003-06-19 | Feaver Donald P. | E-commerce transaction facilitation system and method |
| US20030126053A1 (en) | 2001-12-28 | 2003-07-03 | Jonathan Boswell | System and method for pricing of a financial product or service using a waterfall tool |
| US20030130883A1 (en) | 2001-12-04 | 2003-07-10 | Schroeder Glenn George | Business planner |
| US20030167209A1 (en) | 2000-09-29 | 2003-09-04 | Victor Hsieh | Online intelligent information comparison agent of multilingual electronic data sources over inter-connected computer networks |
| US20030191723A1 (en) | 2002-03-28 | 2003-10-09 | Foretich James Christopher | System and method for valuing real property |
| US20030191832A1 (en)* | 1999-06-01 | 2003-10-09 | Ramakrishna Satyavolu | Method and apparatus for controlled establishment of a turnkey system providing a centralized data aggregation and summary capability to third party entities |
| US20030195810A1 (en) | 2002-04-12 | 2003-10-16 | Sri Raghupathy | System and method for grouping products in a catalog |
| US20030200185A1 (en) | 2002-04-12 | 2003-10-23 | Huerta Anamarie E. | Rule-based system for determining price adjustments in a product catalog |
| US20030225593A1 (en) | 2002-03-22 | 2003-12-04 | Chris Ternoey | Revenue management system |
| US20030229552A1 (en) | 2002-06-05 | 2003-12-11 | Lebaric Katarina J. | System and method for deal-making decision optimization |
| US6665577B2 (en) | 2000-12-20 | 2003-12-16 | My Virtual Model Inc. | System, method and article of manufacture for automated fit and size predictions |
| US6678695B1 (en) | 2001-06-29 | 2004-01-13 | Trilogy Development Group, Inc. | Master data maintenance tool for single source data |
| US20040049470A1 (en) | 1998-05-21 | 2004-03-11 | Khimetrics, Inc. | Demand-model based price image calculation method and computer program therefor |
| US20040078288A1 (en) | 2002-06-19 | 2004-04-22 | Jill Forbis | Computer-implemented method and system for retroactive pricing for use in order procurement |
| US20040117376A1 (en) | 2002-07-12 | 2004-06-17 | Optimalhome, Inc. | Method for distributed acquisition of data from computer-based network data sources |
| US20040128225A1 (en) | 2000-06-22 | 2004-07-01 | Globaltec Solutions, Llp | Apparatus and method for displaying trading trends |
| US20040133526A1 (en) | 2001-03-20 | 2004-07-08 | Oded Shmueli | Negotiating platform |
| US6785664B2 (en) | 2001-06-21 | 2004-08-31 | Kevin Wade Jameson | Collection knowledge system |
| US20040193442A1 (en) | 2003-03-31 | 2004-09-30 | Nissan Motor Co., Ltd. | Price revising system |
| US6801201B2 (en) | 2001-12-17 | 2004-10-05 | Recognia Incorporated | Method for chart markup and annotation in technical analysis |
| US6812926B1 (en) | 2002-02-26 | 2004-11-02 | Microsoft Corporation | Displaying data containing outlying data items |
| US20040267674A1 (en) | 2003-06-30 | 2004-12-30 | Yan Feng | Method for complex computer aided pricing of products and services |
| US20050004819A1 (en) | 2003-03-27 | 2005-01-06 | Oren Etzioni | Performing predictive pricing based on historical data |
| US6851604B2 (en) | 2002-10-02 | 2005-02-08 | Demand Tec Inc. | Method and apparatus for providing price updates |
| US6856967B1 (en) | 1999-10-21 | 2005-02-15 | Mercexchange, Llc | Generating and navigating streaming dynamic pricing information |
| US6856972B1 (en)* | 2000-08-10 | 2005-02-15 | Ford Motor Company | Automated method for analyzing and comparing financial data |
| US20050096963A1 (en) | 2003-10-17 | 2005-05-05 | David Myr | System and method for profit maximization in retail industry |
| US6907403B1 (en) | 2000-07-13 | 2005-06-14 | C4Cast.Com, Inc. | Identifying industry sectors using statistical clusterization |
| US20050187852A1 (en)* | 2004-02-24 | 2005-08-25 | Finaplex, Inc. | Method and system for account reconciliation in a wealth management system |
| US20050197857A1 (en) | 2004-03-05 | 2005-09-08 | Avery N. C. | Method and system for optimal pricing and allocation |
| US20050197971A1 (en) | 2004-03-08 | 2005-09-08 | Sap Ag | Method and system for classifying retail products and services using price band categories |
| US20050240601A1 (en)* | 2004-04-21 | 2005-10-27 | Mairead Lyons | System and method for transactional data collection and processing |
| US20050256778A1 (en) | 2000-11-15 | 2005-11-17 | Manugistics, Inc. | Configurable pricing optimization system |
| US20050267831A1 (en) | 2004-05-28 | 2005-12-01 | Niel Esary | System and method for organizing price modeling data using hierarchically organized portfolios |
| US20050278227A1 (en) | 2004-05-28 | 2005-12-15 | Niel Esary | Systems and methods of managing price modeling data through closed-loop analytics |
| US20060004861A1 (en) | 2004-05-28 | 2006-01-05 | Albanese Michael J | System and method for displaying price modeling data |
| US20060031178A1 (en) | 2002-07-12 | 2006-02-09 | Vendavo, Inc. | Systems and methods for making margin-sensitive price adjustments in an integrated price management system |
| US20060031179A1 (en) | 2004-08-09 | 2006-02-09 | Vendavo, Inc. | Systems and methods for making margin-sensitive price adjustments in an integrated price management system |
| US20060047574A1 (en) | 2004-08-27 | 2006-03-02 | Shankar Sundaram | Methods and systems for managing hierarchically organized objects in a pricing adjustment system |
| US7015912B2 (en) | 2003-01-13 | 2006-03-21 | Vendavo, Inc. | System and method for the visual display of data in an interactive zebra chart |
| US20060069585A1 (en) | 2004-09-30 | 2006-03-30 | Paul Springfield | Method for performing retail sales analysis |
| US7046248B1 (en) | 2002-03-18 | 2006-05-16 | Perttunen Cary D | Graphical representation of financial information |
| US7076463B1 (en) | 2000-07-28 | 2006-07-11 | International Business Machines Corporation | System and method for providing decentralized E-commerce |
| US7080026B2 (en) | 2000-10-27 | 2006-07-18 | Manugistics, Inc. | Supply chain demand forecasting and planning |
| US7092929B1 (en) | 2000-11-08 | 2006-08-15 | Bluefire Systems, Inc. | Method and apparatus for planning analysis |
| US20060241923A1 (en) | 2002-08-02 | 2006-10-26 | Capital One Financial Corporation | Automated systems and methods for generating statistical models |
| US7149716B2 (en) | 1998-04-24 | 2006-12-12 | Starmine Corporation | Security analyst estimates performance viewing system and method |
| US7155510B1 (en) | 2001-03-28 | 2006-12-26 | Predictwallstreet, Inc. | System and method for forecasting information using collective intelligence from diverse sources |
| US7218325B1 (en) | 2004-03-31 | 2007-05-15 | Trading Technologies International, Inc. | Graphical display with integrated recent period zoom and historical period context data |
| US7254584B1 (en) | 2000-05-17 | 2007-08-07 | Aol Llc | Relationship-based inherited attributes system |
| US20070294192A1 (en) | 2006-05-15 | 2007-12-20 | Tellefsen Jens E | Systems and methods for price setting and triangulation |
| US7315835B1 (en) | 1999-07-08 | 2008-01-01 | Sony Corporation | Price fluctuation predicting device and predicting method, price fluctuation warning device and method, and program providing medium |
| US20080059280A1 (en) | 2006-08-29 | 2008-03-06 | Tellefsen Jens E | System and methods for business to business price modeling using price change optimization |
| US7343355B2 (en) | 2002-03-14 | 2008-03-11 | I2 Technologies Us, Inc. | Calculating price elasticity |
| US7360697B1 (en) | 2004-11-18 | 2008-04-22 | Vendavo, Inc. | Methods and systems for making pricing decisions in a price management system |
| US20080126264A1 (en) | 2006-05-02 | 2008-05-29 | Tellefsen Jens E | Systems and methods for price optimization using business segmentation |
- 2008
- 2008-02-06USUS12/027,193patent/US7904355B1/enactiveActive
Patent Citations (112)
| Publication number | Priority date | Publication date | Assignee | Title |
|---|---|---|---|---|
| US3806711A (en) | 1972-08-25 | 1974-04-23 | E Cousins | Automatic merchandise pricing calculator |
| US5497489A (en) | 1987-05-05 | 1996-03-05 | Menne; David M. | Data storage and retrieval systems having labelling for data |
| US5053957A (en) | 1987-10-23 | 1991-10-01 | Omron Tateisi Electronics Co. | Electronic cash register having discount prices selected by customer level |
| US5224034A (en) | 1990-12-21 | 1993-06-29 | Bell Communications Research, Inc. | Automated system for generating procurement lists |
| US5537590A (en) | 1993-08-05 | 1996-07-16 | Amado; Armando | Apparatus for applying analysis rules to data sets in a relational database to generate a database of diagnostic records linked to the data sets |
| US5461708A (en) | 1993-08-06 | 1995-10-24 | Borland International, Inc. | Systems and methods for automated graphing of spreadsheet information |
| US5670984A (en) | 1993-10-26 | 1997-09-23 | Xerox Corporation | Image lens |
| US5689287A (en) | 1993-10-27 | 1997-11-18 | Xerox Corporation | Context-preserving display system using a perspective sheet |
| US5590269A (en) | 1994-04-22 | 1996-12-31 | Minnesota Mining & Manufacturing Company | Resource assignment system providing mixed-initiative user interface updates |
| US5808894A (en) | 1994-10-26 | 1998-09-15 | Optipat, Inc. | Automated ordering method |
| US6336094B1 (en)* | 1995-06-30 | 2002-01-01 | Price Waterhouse World Firm Services Bv. Inc. | Method for electronically recognizing and parsing information contained in a financial statement |
| US5740448A (en) | 1995-07-07 | 1998-04-14 | Sun Microsystems, Inc. | Method and apparatus for exclusive access to shared data structures through index referenced buffers |
| US5710887A (en) | 1995-08-29 | 1998-01-20 | Broadvision | Computer system and method for electronic commerce |
| US5873069A (en) | 1995-10-13 | 1999-02-16 | American Tv & Appliance Of Madison, Inc. | System and method for automatic updating and display of retail prices |
| US5758327A (en) | 1995-11-01 | 1998-05-26 | Ben D. Gardner | Electronic requisition and authorization process |
| US5870717A (en) | 1995-11-13 | 1999-02-09 | International Business Machines Corporation | System for ordering items over computer network using an electronic catalog |
| US5946666A (en) | 1996-05-21 | 1999-08-31 | Albert Einstein Healthcare Network | Monitoring device for financial securities |
| US5878400A (en) | 1996-06-17 | 1999-03-02 | Trilogy Development Group, Inc. | Method and apparatus for pricing products in multi-level product and organizational groups |
| US6553350B2 (en) | 1996-06-17 | 2003-04-22 | Trilogy Development Group, Inc. | Method and apparatus for pricing products in multi-level product and organizational groups |
| US6151031A (en) | 1996-09-09 | 2000-11-21 | Hewlett-Packard Company | Map builder system and method for enabling generic interfacing of an application with a display map generation process in a management system |
| US6078901A (en) | 1997-04-03 | 2000-06-20 | Ching; Hugh | Quantitative supply and demand model based on infinite spreadsheet |
| US6075530A (en) | 1997-04-17 | 2000-06-13 | Maya Design Group | Computer system and method for analyzing information using one or more visualization frames |
| US6988076B2 (en) | 1997-05-21 | 2006-01-17 | Khimetrics, Inc. | Strategic planning and optimization system |
| US20040024715A1 (en) | 1997-05-21 | 2004-02-05 | Khimetrics, Inc. | Strategic planning and optimization system |
| US20020107819A1 (en) | 1997-05-21 | 2002-08-08 | Ouimet Kenneth J. | Strategic planning and optimization system |
| US6009407A (en) | 1998-02-27 | 1999-12-28 | International Business Machines Corporation | Integrated marketing and operations decisions-making under multi-brand competition |
| US6211880B1 (en) | 1998-04-13 | 2001-04-03 | Albert Joseph Impink, Jr. | Display apparatus |
| US7149716B2 (en) | 1998-04-24 | 2006-12-12 | Starmine Corporation | Security analyst estimates performance viewing system and method |
| US20040049470A1 (en) | 1998-05-21 | 2004-03-11 | Khimetrics, Inc. | Demand-model based price image calculation method and computer program therefor |
| US6320586B1 (en) | 1998-11-04 | 2001-11-20 | Sap Aktiengesellschaft | System an method for the visual display of data in an interactive split pie chart |
| US6536037B1 (en)* | 1999-05-27 | 2003-03-18 | Accenture Llp | Identification of redundancies and omissions among components of a web based architecture |
| US20030191832A1 (en)* | 1999-06-01 | 2003-10-09 | Ramakrishna Satyavolu | Method and apparatus for controlled establishment of a turnkey system providing a centralized data aggregation and summary capability to third party entities |
| US7315835B1 (en) | 1999-07-08 | 2008-01-01 | Sony Corporation | Price fluctuation predicting device and predicting method, price fluctuation warning device and method, and program providing medium |
| US6856967B1 (en) | 1999-10-21 | 2005-02-15 | Mercexchange, Llc | Generating and navigating streaming dynamic pricing information |
| US6434533B1 (en) | 1999-10-27 | 2002-08-13 | Market Data Systems, Inc. | Method for the exchange, analysis, and reporting of performance data in businesses with time-dependent inventory |
| US20010003814A1 (en) | 1999-12-09 | 2001-06-14 | Sony Corporation | Information processing apparatus and method, and storage medium |
| US20030115129A1 (en) | 2000-03-16 | 2003-06-19 | Feaver Donald P. | E-commerce transaction facilitation system and method |
| US20020032610A1 (en) | 2000-05-03 | 2002-03-14 | Gold Stephen E. | Method for providing automated delivery of a response to a pricing inquiry |
| US7254584B1 (en) | 2000-05-17 | 2007-08-07 | Aol Llc | Relationship-based inherited attributes system |
| US20020116348A1 (en) | 2000-05-19 | 2002-08-22 | Phillips Robert L. | Dynamic pricing system |
| US7133848B2 (en) | 2000-05-19 | 2006-11-07 | Manugistics Inc. | Dynamic pricing system |
| US20020007323A1 (en) | 2000-06-05 | 2002-01-17 | Masaharu Tamatsu | Order placement and payment settlement system |
| US20040128225A1 (en) | 2000-06-22 | 2004-07-01 | Globaltec Solutions, Llp | Apparatus and method for displaying trading trends |
| US6907403B1 (en) | 2000-07-13 | 2005-06-14 | C4Cast.Com, Inc. | Identifying industry sectors using statistical clusterization |
| US7076463B1 (en) | 2000-07-28 | 2006-07-11 | International Business Machines Corporation | System and method for providing decentralized E-commerce |
| US6856972B1 (en)* | 2000-08-10 | 2005-02-15 | Ford Motor Company | Automated method for analyzing and comparing financial data |
| US20020128953A1 (en) | 2000-09-15 | 2002-09-12 | Jim Quallen | Price discovery and negotiations and related processes |
| US20030167209A1 (en) | 2000-09-29 | 2003-09-04 | Victor Hsieh | Online intelligent information comparison agent of multilingual electronic data sources over inter-connected computer networks |
| US20020059229A1 (en) | 2000-10-04 | 2002-05-16 | Nsk Ltd. | Method and system for providing performance index information of a machine element, and method and system for supporting selection of a machine element |
| US20020042782A1 (en) | 2000-10-06 | 2002-04-11 | International Business Machines Corporation | System and method for generating a contract and conducting contractual activities under the contract |
| US7080026B2 (en) | 2000-10-27 | 2006-07-18 | Manugistics, Inc. | Supply chain demand forecasting and planning |
| US20020052817A1 (en) | 2000-11-02 | 2002-05-02 | David Dines | Sales transactions for transfer of commodities |
| US20020072993A1 (en) | 2000-11-03 | 2002-06-13 | Sandus James A. | Method and system of an integrated business topography and virtual 3D network portal |
| US7092929B1 (en) | 2000-11-08 | 2006-08-15 | Bluefire Systems, Inc. | Method and apparatus for planning analysis |
| US20050256778A1 (en) | 2000-11-15 | 2005-11-17 | Manugistics, Inc. | Configurable pricing optimization system |
| US20020099596A1 (en) | 2000-11-27 | 2002-07-25 | Geraghty Michael Kevin | Dynamic ratemaking for insurance |
| US6665577B2 (en) | 2000-12-20 | 2003-12-16 | My Virtual Model Inc. | System, method and article of manufacture for automated fit and size predictions |
| US20020156695A1 (en) | 2001-01-19 | 2002-10-24 | Globalserve Computer Services, Ltd. | Electronic procurement |
| US20020152133A1 (en) | 2001-03-09 | 2002-10-17 | King John Thorne | Marketplaces for on-line contract negotiation, formation, and price and availability querying |
| US20040133526A1 (en) | 2001-03-20 | 2004-07-08 | Oded Shmueli | Negotiating platform |
| US7155510B1 (en) | 2001-03-28 | 2006-12-26 | Predictwallstreet, Inc. | System and method for forecasting information using collective intelligence from diverse sources |
| US20020152150A1 (en) | 2001-04-17 | 2002-10-17 | Lisette Cooper | Visualization of asset information |
| US20020165760A1 (en) | 2001-05-04 | 2002-11-07 | Phil Delurgio | Interface for merchandise price optimization |
| US20020165726A1 (en) | 2001-05-07 | 2002-11-07 | Grundfest Joseph A. | System and method for facilitating creation and management of contractual relationships and corresponding contracts |
| US20020188576A1 (en) | 2001-05-14 | 2002-12-12 | Eric Peterson | Pricing method and program product for usage based service |
| US20020178077A1 (en) | 2001-05-25 | 2002-11-28 | Katz Steven Bruce | Method for automatically invoking a software module in response to an internal or external event affecting the procurement of an item |
| US20020194051A1 (en) | 2001-05-31 | 2002-12-19 | Hall Stephen A. | Data distribution method and sytem |
| US20030033240A1 (en) | 2001-06-11 | 2003-02-13 | Opt4 Derivatives, Inc. | Integrated electronic exchange of structured contracts with dynamic risk-based transaction permissioning |
| US6785664B2 (en) | 2001-06-21 | 2004-08-31 | Kevin Wade Jameson | Collection knowledge system |
| US6678695B1 (en) | 2001-06-29 | 2004-01-13 | Trilogy Development Group, Inc. | Master data maintenance tool for single source data |
| US20030009411A1 (en) | 2001-07-03 | 2003-01-09 | Pranil Ram | Interactive grid-based graphical trading system for real time security trading |
| US20030028451A1 (en) | 2001-08-03 | 2003-02-06 | Ananian John Allen | Personalized interactive digital catalog profiling |
| US20030095256A1 (en) | 2001-10-18 | 2003-05-22 | Cargill Robert L. | Method and apparatus for quantifying an "integrated index" of a material medium |
| US20030130883A1 (en) | 2001-12-04 | 2003-07-10 | Schroeder Glenn George | Business planner |
| US20030110066A1 (en) | 2001-12-10 | 2003-06-12 | I2 Technologies Us, Inc. | Generating an optimized pricing plan |
| US6801201B2 (en) | 2001-12-17 | 2004-10-05 | Recognia Incorporated | Method for chart markup and annotation in technical analysis |
| US20030126053A1 (en) | 2001-12-28 | 2003-07-03 | Jonathan Boswell | System and method for pricing of a financial product or service using a waterfall tool |
| US6812926B1 (en) | 2002-02-26 | 2004-11-02 | Microsoft Corporation | Displaying data containing outlying data items |
| US7343355B2 (en) | 2002-03-14 | 2008-03-11 | I2 Technologies Us, Inc. | Calculating price elasticity |
| US7046248B1 (en) | 2002-03-18 | 2006-05-16 | Perttunen Cary D | Graphical representation of financial information |
| US20030225593A1 (en) | 2002-03-22 | 2003-12-04 | Chris Ternoey | Revenue management system |
| US20030191723A1 (en) | 2002-03-28 | 2003-10-09 | Foretich James Christopher | System and method for valuing real property |
| US20030195810A1 (en) | 2002-04-12 | 2003-10-16 | Sri Raghupathy | System and method for grouping products in a catalog |
| US20030200185A1 (en) | 2002-04-12 | 2003-10-23 | Huerta Anamarie E. | Rule-based system for determining price adjustments in a product catalog |
| US7308421B2 (en) | 2002-04-12 | 2007-12-11 | Vendavo, Inc. | System and method for grouping products in a catalog |
| US7233928B2 (en) | 2002-04-12 | 2007-06-19 | Vendavo, Inc. | Rule-based system for determining price adjustments in a product catalog |
| US20030229552A1 (en) | 2002-06-05 | 2003-12-11 | Lebaric Katarina J. | System and method for deal-making decision optimization |
| US20040078288A1 (en) | 2002-06-19 | 2004-04-22 | Jill Forbis | Computer-implemented method and system for retroactive pricing for use in order procurement |
| US20060031178A1 (en) | 2002-07-12 | 2006-02-09 | Vendavo, Inc. | Systems and methods for making margin-sensitive price adjustments in an integrated price management system |
| US20040117376A1 (en) | 2002-07-12 | 2004-06-17 | Optimalhome, Inc. | Method for distributed acquisition of data from computer-based network data sources |
| US20060241923A1 (en) | 2002-08-02 | 2006-10-26 | Capital One Financial Corporation | Automated systems and methods for generating statistical models |
| US6851604B2 (en) | 2002-10-02 | 2005-02-08 | Demand Tec Inc. | Method and apparatus for providing price updates |
| US7015912B2 (en) | 2003-01-13 | 2006-03-21 | Vendavo, Inc. | System and method for the visual display of data in an interactive zebra chart |
| US20050004819A1 (en) | 2003-03-27 | 2005-01-06 | Oren Etzioni | Performing predictive pricing based on historical data |
| US20040193442A1 (en) | 2003-03-31 | 2004-09-30 | Nissan Motor Co., Ltd. | Price revising system |
| US20040267674A1 (en) | 2003-06-30 | 2004-12-30 | Yan Feng | Method for complex computer aided pricing of products and services |
| US20050096963A1 (en) | 2003-10-17 | 2005-05-05 | David Myr | System and method for profit maximization in retail industry |
| US20050187852A1 (en)* | 2004-02-24 | 2005-08-25 | Finaplex, Inc. | Method and system for account reconciliation in a wealth management system |
| US20050197857A1 (en) | 2004-03-05 | 2005-09-08 | Avery N. C. | Method and system for optimal pricing and allocation |
| US20050197971A1 (en) | 2004-03-08 | 2005-09-08 | Sap Ag | Method and system for classifying retail products and services using price band categories |
| US7218325B1 (en) | 2004-03-31 | 2007-05-15 | Trading Technologies International, Inc. | Graphical display with integrated recent period zoom and historical period context data |
| US20050240601A1 (en)* | 2004-04-21 | 2005-10-27 | Mairead Lyons | System and method for transactional data collection and processing |
| US20050267831A1 (en) | 2004-05-28 | 2005-12-01 | Niel Esary | System and method for organizing price modeling data using hierarchically organized portfolios |
| US20060004861A1 (en) | 2004-05-28 | 2006-01-05 | Albanese Michael J | System and method for displaying price modeling data |
| US20050278227A1 (en) | 2004-05-28 | 2005-12-15 | Niel Esary | Systems and methods of managing price modeling data through closed-loop analytics |
| US20060031179A1 (en) | 2004-08-09 | 2006-02-09 | Vendavo, Inc. | Systems and methods for making margin-sensitive price adjustments in an integrated price management system |
| US20060047574A1 (en) | 2004-08-27 | 2006-03-02 | Shankar Sundaram | Methods and systems for managing hierarchically organized objects in a pricing adjustment system |
| US20060069585A1 (en) | 2004-09-30 | 2006-03-30 | Paul Springfield | Method for performing retail sales analysis |
| US7360697B1 (en) | 2004-11-18 | 2008-04-22 | Vendavo, Inc. | Methods and systems for making pricing decisions in a price management system |
| US20080126264A1 (en) | 2006-05-02 | 2008-05-29 | Tellefsen Jens E | Systems and methods for price optimization using business segmentation |
| US20070294192A1 (en) | 2006-05-15 | 2007-12-20 | Tellefsen Jens E | Systems and methods for price setting and triangulation |
| US20080059280A1 (en) | 2006-08-29 | 2008-03-06 | Tellefsen Jens E | System and methods for business to business price modeling using price change optimization |
Non-Patent Citations (37)
| Title |
|---|
| "eMerchant, magic Software's Powerful New Business-to-Business E-commerce Solution. Wins 'Best of Show' at Internet Commerce Expo", Apr. 1, 1999, Business Wire, (2 pages). |
| "Net Commerce Launches Its FastTrack Configurator and FasPac Catalog Utility", Apr. 17, 2001, Business Wire. New York. p. 1. |
| "PCT International Search Report and the Written Opinion of the International Searching Authority", Application No. PCT/US 07/23740, mailed Mar. 3, 2008. |
| "PCT International Search Report and the Written Opinion of the International Searching Authority", Application No. PCT/US07/18663, mailed Aug. 26, 2008. |
| "PCT International Search Report", Application No. PCT/US05/14879, mailed Apr. 16, 2007. |
| "PCT International Search Report", Application No. PCT/US07/10754, mailed Nov. 7, 2007. |
| "PCT International Search Report", Application No. PCT/US07/11571, mailed Jan. 7, 2008. |
| "SPEX Assesses B2C and B2B Electronic Commerce Software Maturity", PR Newswire. New York: Apr. 28, 2000, p. 1. |
| "Written Opinion of the International Searching Authority", Application No. PCT/US05/14879, mailed Apr. 16, 2007. |
| "Written Opinion of the International Searching Authority", Application No. PCT/US05/14883, mailed Oct. 3, 2006. |
| "Written Opinion of the International Searching Authority", Application No. PCT/US05/14981, mailed Nov. 27, 2006. |
| Beidl, Richard et al., "The Coming of Risk-Based Pricing: Part Two", Oct. 2000, Mortgage Banking, Washington, vol. 61, Issue 1. |
| Bhattacharya, Anindya et al. "Using 'smart' pricing to increase profits and maximize customer satisfaction", Aug. 2001, The National Public Accountant; vol. 25, Issue 6. |
| Bourne, Humphrey, "Pricing the Strategic Implications", Mar. 1999, Management Accounting. Magazine for Chartered Management Accountants; vol. 77, Issue 3. |
| Caru, Antonella et al. "Profitability and Customer Satisfaction in Services: An Integrated Perspective Between Marketing and Cost Management Analysis", 1999, International Journal of Service Industry Management; vol. 10, Issue 2. |
| Chan Choi, S., Desarbo, W. S., Harker, P. T. "Product Positioning under Price Competition." Feb. 1990. Management Science, vol. 36, Issue 2, pp. 175-199. |
| Coulter, Keith S., "Decreasing Price Sensitivity Involving Physical Product Inventory: A Yield Management Application", 2001, The Journal of Product and Brand Management; vol. 10, Issue 5. |
| Dawes, John, "Assessing the Impact of a Very Successful Price Promotion on Brand, Category and Competitor Sales", 2004, The Journal of Product and Brand Management; vol. 13, Issue 5. |
| Dawes, John, "Price Changes and Defection Levels in a Subscription-Type Market: Can An Estimation Model Really Predict Defecation Levels?", The Journal of Services Marketing; vol. 18, Issue 1. |
| Hung, Chao-Shun, "Conjectural Variations and Market Performance in a Differentiated Product Industry", Dec. 1991, Atlantic Economic Journal; vol. 19, Issue 4. |
| Keenan, Faith, "The Price is Really Right," Business Week, Mar. 31, 2003. |
| Kenton, Kenton B. et al., "Planning a Revenue Stream System in an E-Business Environment", 2001, Industrial Management-Data Systems, p. 406-413, 8/9;ABI/Inform Global. |
| Kim, Byung-Do et al., "Modeling the Distribution of Price Sensitivity and Implications for Optimal Retail Pricing", Jul. 1995, Journal of Business & Economic Statistics; vol. 13, Issue 3. |
| Kirschen, D. S., Strbac, G., Cumperayot, P., de Paiva Mendes, D. "Factoring the Elasticity of Demand in Electricity Prices." May 2000. IEEE Transactions on Power Systems, vol. 15, No. 2, pp. 612-617. |
| Leeflang, Peter S. H. et al., "Marketing Decisions Based on Econometric Models", Spring 2002, Marketing Research; vol. 14, Issue 1. |
| Levy, Michael et al., "Emerging Trends in Retail Pricing Practice: Implications for Research", 2004, Journal of Retailing; vol. 80. |
| Lucke, Dorothea et al., "A Note on R&D and Price Elasticity of Demand," Nov. 2005, Jahrbucher fur Nationalokonomie and Statistik; vol. 225, Issue 6. |
| Markusen,Ann, A market for jobs approach for analyzing the competition for capital, National Tax Association, pp. 30-35.* |
| Marn, Michael V. and Robert L. Rosiello, "Managing Price, Gaining Profit," Harvard Business Review, pp. 84-93 (Sep.-Oct. 1992). |
| Microsoft Excel 2000, 1985-1999. |
| Mills, Don, "Oil Rises on Report Showing Gasoline Supply Decline", National Post, Ont; May 30, 2003. |
| Murphy, Diane R., "The Exciting Role of the Credit Manager in the Expanding E-Commerce Marketplace", Business Credit, vol. 10, No. 9, p. 64, Oct. 2000. |
| Origin 7.0 Help (including 21 sheets of screen shots), 2000. |
| Spanbauer, Scott et al., "You've got E-mail", PC World, vol. 16, No. 6, p. 135, Jun. 1998. |
| Tollefson, John O. et al., "Aggregation Criteria in Normative Market Segmentation Theory", Aug. 1978, Journal of Marketing Research; vol. 15. |
| Vasigh,Bijan; Gorjidooz,Javad, Productivity Analysis of Public and Private Airpports: A causal Investigation, Journal of Air Transportation, vol. 11, num 3, pp. 144-163.* |
| Walker, Kenton B. et al., "Planning a Revenue Stream System in an E-Business Environment", 2001, Industrial Management-Data Systems, p. 406-413, 8/9;ABI/Inform Global. |
Cited By (16)
| Publication number | Priority date | Publication date | Assignee | Title |
|---|---|---|---|---|
| US20100218136A1 (en)* | 2004-05-13 | 2010-08-26 | Scottrade, Inc. | Method and Apparatus for User-Interactive Financial Instrument Trading |
| US8150725B2 (en)* | 2008-10-31 | 2012-04-03 | At&T Intellectual Property I, Lp | Method and system of multidimensional attribution analysis of telecommunication services distribution |
| US20100114636A1 (en)* | 2008-10-31 | 2010-05-06 | At&T Labs, Inc. | Method and System of Multidimensional Attribution Analysis |
| US11232251B2 (en) | 2011-09-21 | 2022-01-25 | Roman Tsibulevskiy | Data processing systems, devices, and methods for content analysis |
| US12223756B2 (en) | 2011-09-21 | 2025-02-11 | Roman Tsibulevskiy | Data processing systems, devices, and methods for content analysis |
| US11830266B2 (en) | 2011-09-21 | 2023-11-28 | Roman Tsibulevskiy | Data processing systems, devices, and methods for content analysis |
| US9430720B1 (en) | 2011-09-21 | 2016-08-30 | Roman Tsibulevskiy | Data processing systems, devices, and methods for content analysis |
| US9508027B2 (en) | 2011-09-21 | 2016-11-29 | Roman Tsibulevskiy | Data processing systems, devices, and methods for content analysis |
| US9558402B2 (en) | 2011-09-21 | 2017-01-31 | Roman Tsibulevskiy | Data processing systems, devices, and methods for content analysis |
| US9953013B2 (en) | 2011-09-21 | 2018-04-24 | Roman Tsibulevskiy | Data processing systems, devices, and methods for content analysis |
| US10311134B2 (en) | 2011-09-21 | 2019-06-04 | Roman Tsibulevskiy | Data processing systems, devices, and methods for content analysis |
| US10325011B2 (en) | 2011-09-21 | 2019-06-18 | Roman Tsibulevskiy | Data processing systems, devices, and methods for content analysis |
| CN104517020B (en)* | 2013-09-30 | 2017-10-20 | 日电(中国)有限公司 | The feature extracting method and device analyzed for cause-effect |
| CN104517020A (en)* | 2013-09-30 | 2015-04-15 | 日电(中国)有限公司 | Characteristic extraction method and device used for cause and effect analysis |
| US20150094983A1 (en)* | 2013-09-30 | 2015-04-02 | Nec (China) Co., Ltd. | Feature extraction method and apparatus for use in casual effect analysis |
| US11086881B2 (en) | 2015-09-23 | 2021-08-10 | Industrial Technology Research Institute | Method and device for analyzing data |
Similar Documents
| Publication | Publication Date | Title |
|---|---|---|
| US8412598B2 (en) | Systems and methods for a causality analyzer | |
| Aguiar et al. | Deconstructing life cycle expenditure | |
| US10360575B2 (en) | Consumer household spend capacity | |
| Canarella et al. | Unit roots and structural change: an application to US house price indices | |
| US8296221B1 (en) | Methods and systems related to securities trading | |
| US8255264B2 (en) | Methods and systems for determining the effectiveness of a dealer's ability to close a sale | |
| US20010039523A1 (en) | System and method for supporting provision of rating related service | |
| US20080221990A1 (en) | Estimating the spend capacity of consumer households | |
| US20050240539A1 (en) | Method and system for forecasting commodity prices using capacity utilization data | |
| US20190197626A1 (en) | Computer-implemented method for portfolio construction and indexation of securities under a noisy market hypothesis | |
| US7904355B1 (en) | Systems and methods for a revenue causality analyzer | |
| Durham | Risk-neutral modeling with affine and nonaffine models | |
| US20080147694A1 (en) | Method and apparatus for strategic planning | |
| Lotfi et al. | Estimating life cycle sales of technology products with frequent repeat purchases: A fractional calculus-based approach | |
| Uylangco et al. | An evaluation of the effectiveness of Value-at-Risk (VaR) models for Australian banks under Basel III | |
| CN105303447A (en) | Method and device for carrying out credit rating through network information | |
| US7921025B2 (en) | Building market models for plural market participants | |
| Axenfeld et al. | General-purpose imputation of planned missing data in social surveys: Different strategies and their effect on correlations | |
| US7840467B2 (en) | Covariance of retail loan product performances | |
| US20150088727A1 (en) | Method for determining creditworthiness for exchange of a projected, future asset | |
| Ashton et al. | Valuation weights, linear dynamics and accounting conservatism: An empirical analysis | |
| WO2019221844A1 (en) | Item-specific value optimization tool | |
| JP5015347B1 (en) | Information processing apparatus, information processing method, and program | |
| US20150081424A1 (en) | Item bundle determination using transaction data | |
| Pacicco et al. | Running event studies using Stata: The estudy command |
Legal Events
| Date | Code | Title | Description |
|---|---|---|---|
| AS | Assignment | Owner name:VENDAVO, INC., CALIFORNIA Free format text:ASSIGNMENT OF ASSIGNORS INTEREST;ASSIGNOR:JOHNSON, JEFFREY D.;REEL/FRAME:025369/0290 Effective date:20080317 | |
| STCF | Information on status: patent grant | Free format text:PATENTED CASE | |
| FPAY | Fee payment | Year of fee payment:4 | |
| AS | Assignment | Owner name:GOLUB CAPITAL LLC, ILLINOIS Free format text:SECURITY INTEREST;ASSIGNOR:VENDAVO, INC.;REEL/FRAME:033969/0399 Effective date:20141016 | |
| MAFP | Maintenance fee payment | Free format text:PAYMENT OF MAINTENANCE FEE, 8TH YEAR, LARGE ENTITY (ORIGINAL EVENT CODE: M1552); ENTITY STATUS OF PATENT OWNER: LARGE ENTITY Year of fee payment:8 | |
| AS | Assignment | Owner name:GOLUB CAPITAL MARKETS LLC, AS COLLATERAL AGENT, ILLINOIS Free format text:PATENT SECURITY AGREEMENT;ASSIGNOR:VENDAVO, INC.;REEL/FRAME:057500/0598 Effective date:20210910 Owner name:VENDAVO, INC., COLORADO Free format text:TERMINATION AND RELEASE OF PATENT SECURITY AGREEMENT;ASSIGNOR:GOLUB CAPITAL LLC;REEL/FRAME:057500/0204 Effective date:20210910 | |
| MAFP | Maintenance fee payment | Free format text:PAYMENT OF MAINTENANCE FEE, 12TH YEAR, LARGE ENTITY (ORIGINAL EVENT CODE: M1553); ENTITY STATUS OF PATENT OWNER: LARGE ENTITY Year of fee payment:12 |