US7899514B1 - Medical image processing methodology for detection and discrimination of objects in tissue - Google Patents
Medical image processing methodology for detection and discrimination of objects in tissueDownload PDFInfo
- Publication number
- US7899514B1 US7899514B1US11/340,375US34037506AUS7899514B1US 7899514 B1US7899514 B1US 7899514B1US 34037506 AUS34037506 AUS 34037506AUS 7899514 B1US7899514 B1US 7899514B1
- Authority
- US
- United States
- Prior art keywords
- anomalies
- detected
- medical image
- cancerous
- grsm
- Prior art date
- Legal status (The legal status is an assumption and is not a legal conclusion. Google has not performed a legal analysis and makes no representation as to the accuracy of the status listed.)
- Expired - Fee Related, expires
Links
Images


Classifications
- G—PHYSICS
- G06—COMPUTING OR CALCULATING; COUNTING
- G06T—IMAGE DATA PROCESSING OR GENERATION, IN GENERAL
- G06T7/00—Image analysis
- G06T7/0002—Inspection of images, e.g. flaw detection
- G06T7/0012—Biomedical image inspection
- G—PHYSICS
- G06—COMPUTING OR CALCULATING; COUNTING
- G06T—IMAGE DATA PROCESSING OR GENERATION, IN GENERAL
- G06T2207/00—Indexing scheme for image analysis or image enhancement
- G06T2207/10—Image acquisition modality
- G06T2207/10072—Tomographic images
- G06T2207/10088—Magnetic resonance imaging [MRI]
- G—PHYSICS
- G06—COMPUTING OR CALCULATING; COUNTING
- G06T—IMAGE DATA PROCESSING OR GENERATION, IN GENERAL
- G06T2207/00—Indexing scheme for image analysis or image enhancement
- G06T2207/10—Image acquisition modality
- G06T2207/10116—X-ray image
- G—PHYSICS
- G06—COMPUTING OR CALCULATING; COUNTING
- G06T—IMAGE DATA PROCESSING OR GENERATION, IN GENERAL
- G06T2207/00—Indexing scheme for image analysis or image enhancement
- G06T2207/10—Image acquisition modality
- G06T2207/10132—Ultrasound image
- G—PHYSICS
- G06—COMPUTING OR CALCULATING; COUNTING
- G06T—IMAGE DATA PROCESSING OR GENERATION, IN GENERAL
- G06T2207/00—Indexing scheme for image analysis or image enhancement
- G06T2207/20—Special algorithmic details
- G06T2207/20112—Image segmentation details
- G06T2207/20132—Image cropping
- G—PHYSICS
- G06—COMPUTING OR CALCULATING; COUNTING
- G06T—IMAGE DATA PROCESSING OR GENERATION, IN GENERAL
- G06T2207/00—Indexing scheme for image analysis or image enhancement
- G06T2207/30—Subject of image; Context of image processing
- G06T2207/30004—Biomedical image processing
- G06T2207/30068—Mammography; Breast
Definitions
- the present inventionis directed, in general, to image analysis and, more particularly, to the computerized detection and discrimination of anomalies in breast tissue images.
- the present inventionprovides an improved methodology for the radiologist to detect anomalies in the breast tissue, discriminate between cancerous and non-cancerous breast tissue, and to identify the margins of cancerous tissue.
- Breast cancer detectionis highly dependent on mammogram imagery.
- the current methodologyrelies primarily on visual inspection by radiologists with some support from automated computer aided design (CAD) systems.
- CADcomputer aided design
- the software for most CAD systemsis proprietary and uses intensity thresholding and contrast stretching for detection and shape/pattern recognition for discrimination.
- the current methodologyhas the following limitations: (1) poor detection in early stages and in high-density breast tissue; (2) many false alarms; (3) poor discrimination of cancerous masses from calcifications, non-cancerous lesions, and cysts; and (4) an inability to resolve the margins of the cancerous mass.
- the present inventionovercomes these limitations by providing improved detection of masses in noisy images, improved discrimination capability that reduces the number of false alarms, and improved digital visualization to aid the radiologist in defining cancerous margins.
- Another aspect of the present inventionis to provide a method and system for the automated detection and classification of anomalies in medical images of the breast that improves the accuracy of discrimination between cancerous and non-cancerous breast masses to reduce patient trauma and costs.
- Another aspect of the present inventionis to provide a method and system for the automated detection and classification of anomalies in medical images of the breast that improves the definition of the margins of cancerous masses to aid in better surgical removal of cancerous masses from breast tissue.
- ADAAnomaly Detection Algorithm
- GRSMGenetic Response Surface Methodology
- the ADA moduleIn the ADA module, once the intensity of an image pixel crosses a detection threshold, the pixel is detected and linking inputs are provided to its nearest-neighbor pixels, raising their intensities, which may allow the detection of these nearest-neighbor pixels if their raised intensities are greater than the threshold.
- Each anomaly in the mammogram detected by the ADA moduleis tracked and passed to the GRSM module for characterization as cancerous or benign.
- the GRSM modulecharacterizes masses identified by the ADA module as cancerous or benign based on features such as shape, intensity profile, and edge spiculation.
- a method for discriminating anomalies in a medical imageincluding detecting anomalies in the medical image, classifying the detected anomalies as cancerous or non-cancerous, and displaying the detected anomalies on the medical image.
- the anomaliesare classified by determining a GRSM model for each of the detected anomalies, determining a cancerous GRSM model from a database of cancerous anomalies, and comparing the cancerous GRSM model to the GRSM model for each of the detected anomalies to classify each of the detected anomalies as cancerous or non-cancerous.
- a computer-readable storagestoring computer instructions for computerized detection and classification of anomalies in a digitized medical image.
- the computer instructionsinclude segmenting the medical image to identify a region of interest, detecting anomalies in the segmented medical image, classifying the detected anomalies as cancerous or non-cancerous, and displaying the detected anomalies on the medical image.
- the anomaliesare classified by determining a GRSM model for each of the detected anomalies, determining a cancerous GRSM model from a database of cancerous anomalies, and comparing the cancerous GRSM model to the GRSM model for each of the detected anomalies to classify each of the detected anomalies as cancerous or non-cancerous.
- a system for analyzing a medical image to detect and classify anomalies in the medical imageincluding a programmable computer and computer software installed on the programmable computer.
- the computer softwareenables the programmable computer to detect anomalies in the medical image, determine a GRSM model for each of the detected anomalies, determine a cancerous GRSM model from a database of cancerous anomalies, compare the cancerous GRSM model to the GRSM model for each of the detected anomalies to classify each of the detected anomalies as cancerous or non-cancerous, and display the detected anomalies on the medical image.
- a system for detecting and classifying anomalies in a medical imageincluding a detector detecting anomalies in the medical image, a classifier to classify the detected anomalies as cancerous or non-cancerous, and a display to display the detected anomalies on the medical image.
- the classifierdetermines a GRSM model for each of the detected anomalies, determines a cancerous GRSM model from a database of cancerous anomalies, and compares the cancerous GRSM model to the GRSM model for each of the detected anomalies to classify each of the detected anomalies as cancerous or non-cancerous.
- FIG. 1is a flow diagram illustrating the detection and discrimination of objects in medical images according to an embodiment of the present invention
- FIG. 2is a flow diagram of image segmentation
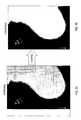
- FIGS. 3A and 3Billustrate initial image cropping
- FIGS. 4A and 4Billustrate edge detection
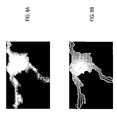
- FIGS. 5A and 5Billustrate final segmentation of the image and the version of the image to be processed for detection and classification of anomalies
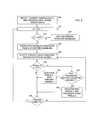
- FIG. 6is a flow diagram of anomaly detection
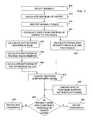
- FIG. 7is a flow diagram of anomaly discrimination
- FIG. 8Ashows an example of a detected anomaly
- FIG. 8Bshows radii from the centroid of energy of the detected anomaly of FIG. 8A to the edges of the anomaly
- FIG. 8Cis a graph of radii measurements for the detected anomaly of FIG. 8A ;
- FIG. 8Dis a graph of delta radii measurements for the detected anomaly of FIG. 8A ;
- FIG. 8Eis a histogram of the radii measurements of FIG. 8C ;
- FIG. 8Fis a histogram of the differences in successive radii for the delta radii measurements of FIG. 8D ;
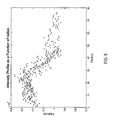
- FIG. 9is a graph of intensity profile as a function of radius for the detected anomaly of FIG. 8A ;
- FIG. 10is a flow diagram of the Genetic Response Surface Methodology (GRSM) module
- FIG. 11shows a mammogram with a detected anomaly highlighted
- FIG. 12shows a mammogram with the detected anomaly of FIG. 8A highlighted and enlarged to illustrate the margins of the detected anomaly
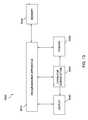
- FIG. 13illustrates a system for the processing of medical imagery.
- the present inventionprovides a method, system, and apparatus for the implementation of image processing and response surface methodology algorithms to process images (e.g., mammogram, magnetic resonance imaging (MRI), and ultrasound imagery) in order to provide improved detection of objects, such as anomalous masses in dense breast tissue, and to better characterize these masses as cancerous or benign.
- imagese.g., mammogram, magnetic resonance imaging (MRI), and ultrasound imagery
- MRImagnetic resonance imaging
- ultrasound imageryimages
- the present inventionprovides (1) an Anomaly Detection Algorithm (ADA) module for detection of masses in the breast tissue, (2) a Genetic Response Surface Methodology (GRSM) module for classification of detected masses as cancerous or non-cancerous, and (3) a definition of margins of the cancerous masses, using the results of the ADA module, to support surgical procedures.
- ADAAnomaly Detection Algorithm
- GRSMGenetic Response Surface Methodology
- margins of the cancerous massesusing the results of the ADA module, to support surgical procedures.
- the algorithmsare integrated into a modular image processing architecture that can be implemented on a computer-aided design (CAD) system, for example, that is user-friendly to radiologists.
- CADcomputer-aided design
- FIG. 1The overall architecture of the present invention is shown in FIG. 1 .
- a mammogram, ultrasound, or MRI imageis acquired at 10 , the image is segmented at 20 into breast tissue and background to identify the breast region and eliminate undesired objects from the image, such as labels and patient information.
- Anomaliesare detected in the segmented image using the ADA module at 30 .
- the detected anomaliesare classified as cancerous or non-cancerous using the GRSM module at 40 . All the detected masses are displayed and the cancerous masses are identified at 50 .
- the margins of the cancerous massesare defined at 60 .
- the segmentation process 20is shown in greater detail in FIG. 2 .
- the imageis cropped at 205 (see FIGS. 3A and 3B ) to remove borders and undesirable artifacts near the image edges, such as the bright borders around the image.
- the undesirable artifacts/bordersare cropped using manual and/or conventional automated processes.
- the manual processinvolves using a digital image editor to select large areas of interest, whereas the automated process uses changes in intensity to determine when to initiate and terminate cropping.
- the cropped imageis downsampled at 210 ( FIG. 2 ) to decrease the processing time of the ADA module.
- the imageis downsampled by a factor of 100, for example, using a common decimation algorithm, which takes each successive 10-pixel by 10-pixel block of pixels and outputs a single pixel whose intensity is equal to the mean intensity of the 10 ⁇ 10 block.
- the imagemay be downsampled to other resolutions, as desired.
- the ADA moduleis executed at 215 to detect and isolate large objects within the image, such as the breast.
- the ADA moduleis a detection and association algorithm that detects pixels having an intensity above a threshold intensity, and associates these pixels with adjacent pixels that have intensities above a linking threshold intensity into the objects referred to as “anomalies.”
- the ADA moduleis described in greater detail below.
- the centroid of energy of the imageis calculated at 220 . See FIG. 4B for an illustration of the centroid of energy.
- the centroid of energyis calculated, using the intensities of the pixels detected at 215 ( FIG. 2 ) with the ADA module, in both the x and y dimensions of the image.
- An edge detection algorithmdetects the edges of the objects in the image at 225 . See FIGS. 4A and 4B for an illustration of edge detection.
- Edge pixelsare pixels with at least one nearest-neighbor pixel that was not detected with the ADA module at 215 ( FIG. 2 ).
- the edge detection algorithmsearches through a list of detected pixels created by the ADA module. If one of the detected pixels has at least one nearest neighbor that was not detected by the ADA module, then this detected pixel is added to an edge pixel list.
- the breast edge pixelsare discriminated from the edge pixels of other objects using an edge-crossing algorithm at 230 . Because the breast region occupies the largest region on the image, the centroid of energy calculated at 220 should be on the breast region.
- the edge-crossing algorithmoperates by proceeding along a line from all edge pixels to the centroid of energy. If another edge is crossed, then the edge pixel from which a line originates does not belong to the breast and is removed from the list of edge pixels.
- the imageis cropped again at 235 by defining a bounding box of the breast using its edge pixels as identified at 230 . Also at 235 , the bounding box is rescaled to full size by multiplying by the downsampling factor, and the sub-image defined by this bounding box, which only includes anomalies that are in the breast, is returned for further processing. See FIGS. 5A and 5B for an illustration of final segmentation.
- the ADA moduleis executed again at 30 on the cropped, full-resolution image of the breast to identify individual anomalies in the breast tissue.
- Execution of the ADA module at 30differs from execution of the ADA module during segmentation at 20 by using, for example, different thresholds and linking coefficients (described below).
- a current threshold, a minimum threshold, and a linking coefficient ⁇are input to the ADA module at 305 .
- the current thresholdis initially set to the maximum pixel intensity in the entire image plus one.
- the minimum thresholdis set to the mean intensity of all the pixels in the entire image.
- the linking coefficient ⁇may be either selected by the user or calculated.
- the linking coefficient ⁇may be calculated, for example, by (a) calculating the histogram of the intensity data for the breast and finding the maximum intensity value, (b) calculating the slopes of the histogram in each direction away from the maximum intensity value and choosing the minimum slope, and (c) calculating the pixel linking coefficient ⁇ using this minimum slope.
- the minimum thresholdAfter inputting the current threshold, the minimum threshold, and the linking coefficient, initiate a search for anomalies at 310 . Determine whether the current threshold is greater than the minimum threshold at 315 . If not, exit the ADA module and return the detected anomalies at 318 . Otherwise, in each iteration, attempt to propagate detected (i.e., existing) anomalies from their edge pixels at 320 by checking the linked intensities of the nearest neighbors of the edge pixels of the existing anomalies.
- Propagation of anomalies at 320is accomplished by linking detected edge pixels of an existing anomaly to their nearest neighbors (e.g., linking to the eight pixels surrounding a detected edge pixel), and determining if these neighbors have linked intensities high enough to be detected for further propagation.
- ⁇is the linking coefficient
- Iis the intensity of the detected edge pixel (i.e., the pixel from which propagation of anomalies is attempted)
- I Nis the initial intensity of the nearest neighbor pixel. If the linked intensity I L is above the current threshold, the nearest-neighbor pixel is detected and associated with the existing anomaly.
- raster over the image pixels that are not associated with an anomaly at 325After propagating the existing anomalies at 320 , raster over the image pixels that are not associated with an anomaly at 325 . Determine whether any of these pixels is detected at 330 . In other words, determine at 330 whether a pixel that has not been associated with an existing anomaly has an intensity that is greater than or equal to the current threshold value. If such a pixel is detected, attempt to associate it with an existing anomaly at 335 by checking its nearest neighbors. If any of the nearest-neighbor pixels is associated with an existing anomaly, the detected pixel is also associated with that anomaly at 340 . If two or more neighbor pixels are found to be associated with different existing anomalies, then the detected pixel is associated with, for example, the existing anomaly that was first detected.
- a new anomalyis registered at 345 and the new anomaly is propagated from the newly detected pixel.
- the new anomalyis propagated by checking the newly detected pixel's nearest neighbors to determine if their linked intensities are greater than the current threshold. If so, these nearest neighbors are associated with the new anomaly and their nearest neighbors are checked to determine if their linked intensities are greater than the current threshold.
- the anomaliesare passed to the discrimination operation at 40 to determine whether the anomalies are cancerous or non-cancerous.
- Anomaly discriminationis illustrated in FIG. 7 . For each anomaly, the following operations are performed.
- FIG. 8Bshows the radii from the centroid of energy of the anomaly shown in FIG. 8A to the edges of the anomaly
- FIG. 8Cshows the radii measurements as a function of angle.
- GRSM moduleProvides the resulting input data (i.e., the histogram of the radii, the histogram of the differences in radii, and the intensity profile) from the above calculations to the GRSM module at 445 ( FIG. 7 ), from which a GRSM model is determined for the anomaly under test. Determination of a GRSM model is described in more detail below.
- the GRSM moduleintegrates response surface methodology with genetic algorithms.
- Response surface methodologyis a mathematical technique that predicts the response of a system or process that is dependent upon several input variables.
- the inclusion of a genetic algorithmprovides near optimal linear combination of the input variables and, thus, optimization of the response.
- the GRSM module of the present inventionoptimizes the classification of the detected anomalies as cancerous or non-cancerous.
- the parameterscharacterize the input data and may include, for example, the slopes of the histograms. Other parameters related to patient clinical data and lifestyle factors are possible depending upon the particular circumstances.
- the parameters used by the GRSM moduleare optimized using a genetic algorithm to maximize the true-positive detections while minimizing the false-positive detections.
- parameters x 1 , x 2 , x 3 , x 4 , x 5 , x 6 , and x 7will be used in the examples that follow to determine an nth-order GRSM algorithm or GRSM model f(x 1 , x 2 , x 3 , x 4 , x 5 , x 6 , x 7 ) that best satisfies a user-defined fitness function G(x 1 , x 2 , x 3 , x 4 , x 5 , x 6 , x 7 ).
- the fitness functionis an expression of the goals of the problem to be solved and the problem-specific parameters.
- the goalsinfluence the weightings applied to the terms of the fitness function.
- the goal of the fitness functionis to optimize the fit of the response surface model to the input data.
- the specifics, such as the coefficients of the fitness functionwill change depending upon the particular circumstances of each problem.
- the concept of use of fitness functions with generic algorithmsis known. Thus, one of skill in the art would understand how to formulate the appropriate fitness function for a given application.
- the pool of function terms(i.e., chromosomes) becomes the following: x 1 ,x 1 2 ,x 1 3 ,x 1 ⁇ 1 ,x 1 ⁇ 2 ,x 1 ⁇ 3 ,x 2 ,x 2 2 ,x 2 3 ,x 2 ⁇ 1 ,x 2 ⁇ 2 ,x 2 ⁇ 3 ,x 3 ,x 3 2 ,x 3 3 ,x 3 ⁇ 1 ,x 3 ⁇ 2 ,x 3 ⁇ 3 ,x 4 ,x 4 2 ,x 4 3 ,x 4 ⁇ 1 ,x 4 ⁇ 2 ,x 4 ⁇ 3 ,x 5 ,x 5 2 ,x 5 3 ,x 5 ⁇ 1 ,x 5 ⁇ 2 ,x 5 ⁇ 3 ,x 6 ,x 6 2 ,x 6 3 ,x 6 ⁇ 1 ,x 6 ⁇ 2 ,x 6 ⁇ 3 ,x 7 ,x 7 2 ,x 7 3 , x 7 ⁇
- f 1a 1,1 +a 1,2 x 4 ⁇ 3 x 2 2 x 6 ⁇ 1 +a 1,3 x 3 ⁇ 3 +a 1,4 x 1 ⁇ 2 x 7 3 x 6 3 x 5 ⁇ 2 +a 1,5 x 4 3 x 5 2
- f 2a 2,1 +a 2,2 x 1 3 x 2 3 x 2 ⁇ 2 +a 2,3 x 4 ⁇ 1 x 1 ⁇ 3 x 6 ⁇ 2 x 7 ⁇ 2 +a 2,4 x 4 ⁇ 2 x 6 3 x 1 ⁇ 2 x 7 2 +a 2,5 x 6 ⁇ 2 x 6 3 x 5 3
- f na n,1 +a n,2 x 2 2 x 2 ⁇ 1 +a n,3 x 7
- a i,jrepresents the coefficient for term j of equation i.
- a weighted random draw from the initial population based on rankcan be performed to choose K+1 parents (K being an even number). A certain percentage, for example, 20% of the initial population, may be chosen. K of the parents are then divided into pairs. Each pair's function terms are used to form a mini-pool of function terms and four children equations are birthed similar to the way in which the initial population is generated above.
- the (K+1)st parentis used to produce a mutation by exchanging one of its terms with a random draw from the original pool of terms.
- An immigration childis also introduced by randomly drawing from the original pool of function terms, similar to the way in which an equation in the first generation of equations is formed.
- the mutation and immigration children, along with the other four children,are then executed on the input data and ranked along with the rest of the equations from the current generation.
- the (K+1)*2 equations with the lowest rankare removed from the current generation of equations and the remaining equations are used to form the next generation of equations.
- the above processis also applied to an existing database of cancerous breast masses to develop the cancerous GRSM model.
- the processcan be repeated using different data sets, where each data set represents a class to be discriminated from other classes.
- a classmay be a specific type of cancer (e.g., lobular or glandular) or a cyst.
- the resulting GRSM modelscan then be used for discrimination of detected anomalies as cancerous or non-cancerous.
- the results of the anomaly detection and anomaly discriminationare displayed to the operator using a color overlay scheme as shown in FIG. 11 .
- a red anomalycould represent an anomaly that is probably cancerous
- a yellow anomalycould represent an anomaly that is probably non-cancerous.
- Other indicatorsmay be used, such as rectangles drawn around the anomalies and arrows pointing to the anomalies.
- the degree of confidence in the decisioncan be used by the operator to visualize the margins of the anomalies (see FIG. 12 ). This visualization enables further expert discrimination by the radiologist by allowing the radiologist to better see the total extent of the cancerous material, and aids in better removal of the mass during surgery.
- FIG. 13illustrates a system 5000 for processing medical image data in accordance with the present invention.
- the method of the present inventionmay be performed on a programmable apparatus 5010 having software capable of instructing the programmable apparatus 5010 to perform the invention.
- the programmable apparatusmay be a computer (for example, a general-purpose computer, such as a desktop computer, or a CAD system) having an executable program, such as MATLAB® or C++, that enables the computer to perform the invention, and an operating system such as Windows®, Windows NT®, Linux®, UNIX®, etc.
- Preparation of the executable program to provide the above described methodis within the capability of a skilled computer programmer.
- the executable programmay reside on a computer-readable memory 5020 , such as a computer disk drive, a CD-ROM, DAT tape, FLASH memory, EPROM, etc.
- the image datamay be transmitted to the programmable apparatus 5010 and to the memory 5020 .
- the programmable apparatus 5010may receive commands from an operator via an operator workstation 5030 typically having a keyboard and other input devices, such as a mouse. The operator may control the system 5000 using the input devices.
- a display 5040 coupled to the operator workstation 5030may be used to view the image data.
- the imagemay be printed using a printer 5050 , which may be connected to the programmable apparatus 5010 and the operator workstation 5030 .
- Other hardware and software elementsmay be used by those with ordinary skill in the art.
- the present inventionhas been described with respect to the detection and discrimination of anomalous masses in mammogram images. However, the present invention may also be used in detecting other types of cancer (e.g., lung cancer, kidney cancer, bone cancer, etc.), and it may be used with other types of images (e.g., MRI and ultrasound imagery). It is further envisaged that the present invention may be used in other environments in which detection and discrimination of objects is required, such as pattern recognition and detection and discrimination of targets in clutter.
- the ADA modulemay be used to detect targets in infrared imagery
- the GRSM modulemay be used to predict impact points for rockets and mortars to provide early warning for soldiers.
Landscapes
- Engineering & Computer Science (AREA)
- Health & Medical Sciences (AREA)
- General Health & Medical Sciences (AREA)
- Medical Informatics (AREA)
- Nuclear Medicine, Radiotherapy & Molecular Imaging (AREA)
- Radiology & Medical Imaging (AREA)
- Quality & Reliability (AREA)
- Computer Vision & Pattern Recognition (AREA)
- Physics & Mathematics (AREA)
- General Physics & Mathematics (AREA)
- Theoretical Computer Science (AREA)
- Image Analysis (AREA)
Abstract
Description
IL=(1+β*I)*IN
x1,x12,x13,x1−1,x1−2,x1−3,x2,x22,x23,x2−1,x2−2,x2−3,x3,x32,x33,x3−1,x3−2,x3−3,x4,x42,x43,x4−1,x4−2,x4−3,x5,x52,x53,x5−1,x5−2,x5−3,x6,x62,x63,x6−1,x6−2,x6−3,x7,x72,x73, x7−1,x7−2, and x7−3
f1=a1,1+a1,2x4−3x22x6−1+a1,3x3−3+a1,4x1−2x73x63x5−2+a1,5x43x52
f2=a2,1+a2,2x13x23x2−2+a2,3x4−1x1−3x6−2x7−2+a2,4x4−2x63x1−2x72+a2,5x6−2x63x53
fn=an,1+an,2x22x2−1+an,3x7x63x2−3x5−2+an,4x52x6−2x6−2x23x4−2
Claims (36)
Priority Applications (1)
| Application Number | Priority Date | Filing Date | Title |
|---|---|---|---|
| US11/340,375US7899514B1 (en) | 2006-01-26 | 2006-01-26 | Medical image processing methodology for detection and discrimination of objects in tissue |
Applications Claiming Priority (1)
| Application Number | Priority Date | Filing Date | Title |
|---|---|---|---|
| US11/340,375US7899514B1 (en) | 2006-01-26 | 2006-01-26 | Medical image processing methodology for detection and discrimination of objects in tissue |
Publications (1)
| Publication Number | Publication Date |
|---|---|
| US7899514B1true US7899514B1 (en) | 2011-03-01 |
Family
ID=43617358
Family Applications (1)
| Application Number | Title | Priority Date | Filing Date |
|---|---|---|---|
| US11/340,375Expired - Fee RelatedUS7899514B1 (en) | 2006-01-26 | 2006-01-26 | Medical image processing methodology for detection and discrimination of objects in tissue |
Country Status (1)
| Country | Link |
|---|---|
| US (1) | US7899514B1 (en) |
Cited By (23)
| Publication number | Priority date | Publication date | Assignee | Title |
|---|---|---|---|---|
| US20100061613A1 (en)* | 2008-09-11 | 2010-03-11 | PACSPLUS Co., Ltd. | Method, apparatus and program for processing mammographic image |
| US20100183204A1 (en)* | 2008-12-16 | 2010-07-22 | Olympus Corporation | Image processing device, image processing method, and computer readable storage medium storing image processing program |
| US20100232668A1 (en)* | 2007-10-17 | 2010-09-16 | Deutsches Krebsforschungszentrum | Method, Computer Program And Workstation For Removing Undesirable Objects From A Digital Medical Image |
| WO2013186676A1 (en)* | 2012-06-13 | 2013-12-19 | Crystalview Medical Imaging Limited | Suppression of reverberations and/or clutter in ultrasonic imaging systems |
| US8724871B1 (en) | 2011-12-14 | 2014-05-13 | Atti International Services Company, Inc. | Method and system for identifying anomalies in medical images |
| US9401021B1 (en) | 2011-12-14 | 2016-07-26 | Atti International Services Company, Inc. | Method and system for identifying anomalies in medical images especially those including body parts having symmetrical properties |
| US9495604B1 (en) | 2013-01-09 | 2016-11-15 | D.R. Systems, Inc. | Intelligent management of computerized advanced processing |
| US9672477B1 (en) | 2006-11-22 | 2017-06-06 | D.R. Systems, Inc. | Exam scheduling with customer configured notifications |
| US9684762B2 (en) | 2009-09-28 | 2017-06-20 | D.R. Systems, Inc. | Rules-based approach to rendering medical imaging data |
| US9727938B1 (en) | 2004-11-04 | 2017-08-08 | D.R. Systems, Inc. | Systems and methods for retrieval of medical data |
| US9734576B2 (en) | 2004-11-04 | 2017-08-15 | D.R. Systems, Inc. | Systems and methods for interleaving series of medical images |
| US9779504B1 (en)* | 2011-12-14 | 2017-10-03 | Atti International Services Company, Inc. | Method and system for identifying anomalies in medical images especially those including one of a pair of symmetric body parts |
| US9836202B1 (en) | 2004-11-04 | 2017-12-05 | D.R. Systems, Inc. | Systems and methods for viewing medical images |
| CN107735838A (en)* | 2017-03-02 | 2018-02-23 | 香港应用科技研究院有限公司 | Anomaly detection for medical samples in multiple settings |
| WO2018157387A1 (en)* | 2017-03-02 | 2018-09-07 | Hong Kong Applied Science and Technology Research Institute Company Limited | Anomaly detection for medical samples under multiple settings |
| US10540763B2 (en) | 2004-11-04 | 2020-01-21 | Merge Healthcare Solutions Inc. | Systems and methods for matching, naming, and displaying medical images |
| US10579903B1 (en) | 2011-08-11 | 2020-03-03 | Merge Healthcare Solutions Inc. | Dynamic montage reconstruction |
| US10592688B2 (en) | 2008-11-19 | 2020-03-17 | Merge Healthcare Solutions Inc. | System and method of providing dynamic and customizable medical examination forms |
| US10614615B2 (en) | 2004-11-04 | 2020-04-07 | Merge Healthcare Solutions Inc. | Systems and methods for viewing medical 3D imaging volumes |
| US10909168B2 (en) | 2015-04-30 | 2021-02-02 | Merge Healthcare Solutions Inc. | Database systems and interactive user interfaces for dynamic interaction with, and review of, digital medical image data |
| CN113361439A (en)* | 2021-06-17 | 2021-09-07 | 中国人民解放军海军航空大学航空作战勤务学院 | SAR image ship target identification method and system |
| TWI750518B (en)* | 2019-04-01 | 2021-12-21 | 大陸商北京市商湯科技開發有限公司 | Image processing method, image processing device, electronic equipment and computer readable storage medium |
| US20220067945A1 (en)* | 2020-09-01 | 2022-03-03 | Research & Business Foundation Sungkyunkwan University | Apparatus and method for lesion analysis based on marginal feature |
Citations (12)
| Publication number | Priority date | Publication date | Assignee | Title |
|---|---|---|---|---|
| US5452367A (en) | 1993-11-29 | 1995-09-19 | Arch Development Corporation | Automated method and system for the segmentation of medical images |
| US5832103A (en) | 1993-11-29 | 1998-11-03 | Arch Development Corporation | Automated method and system for improved computerized detection and classification of massess in mammograms |
| US5857030A (en) | 1995-08-18 | 1999-01-05 | Eastman Kodak Company | Automated method and system for digital image processing of radiologic images utilizing artificial neural networks |
| US5999639A (en) | 1997-09-04 | 1999-12-07 | Qualia Computing, Inc. | Method and system for automated detection of clustered microcalcifications from digital mammograms |
| US6282305B1 (en) | 1998-06-05 | 2001-08-28 | Arch Development Corporation | Method and system for the computerized assessment of breast cancer risk |
| US20020064788A1 (en)* | 2000-07-21 | 2002-05-30 | Monforte Joseph A. | Systematic approach to mechanism-of-response analyses |
| US20030007598A1 (en)* | 2000-11-24 | 2003-01-09 | U-Systems, Inc. | Breast cancer screening with adjunctive ultrasound mammography |
| US20030231790A1 (en)* | 2002-05-02 | 2003-12-18 | Bottema Murk Jan | Method and system for computer aided detection of cancer |
| US6738500B2 (en) | 1995-10-26 | 2004-05-18 | The Johns Hopkins University | Method and system for detecting small structures in images |
| US6748044B2 (en) | 2002-09-13 | 2004-06-08 | Ge Medical Systems Global Technology Company, Llc | Computer assisted analysis of tomographic mammography data |
| US6785662B1 (en) | 2001-05-04 | 2004-08-31 | Uop Llc | Refinery scheduling of incoming crude oil using a genetic algorithm |
| US20050027188A1 (en) | 2002-12-13 | 2005-02-03 | Metaxas Dimitris N. | Method and apparatus for automatically detecting breast lesions and tumors in images |
- 2006
- 2006-01-26USUS11/340,375patent/US7899514B1/ennot_activeExpired - Fee Related
Patent Citations (13)
| Publication number | Priority date | Publication date | Assignee | Title |
|---|---|---|---|---|
| US5832103A (en) | 1993-11-29 | 1998-11-03 | Arch Development Corporation | Automated method and system for improved computerized detection and classification of massess in mammograms |
| US5452367A (en) | 1993-11-29 | 1995-09-19 | Arch Development Corporation | Automated method and system for the segmentation of medical images |
| US5857030A (en) | 1995-08-18 | 1999-01-05 | Eastman Kodak Company | Automated method and system for digital image processing of radiologic images utilizing artificial neural networks |
| US6738500B2 (en) | 1995-10-26 | 2004-05-18 | The Johns Hopkins University | Method and system for detecting small structures in images |
| US6650766B1 (en)* | 1997-08-28 | 2003-11-18 | Qualia Computing, Inc. | Method for combining automated detections from medical images with observed detections of a human interpreter |
| US5999639A (en) | 1997-09-04 | 1999-12-07 | Qualia Computing, Inc. | Method and system for automated detection of clustered microcalcifications from digital mammograms |
| US6282305B1 (en) | 1998-06-05 | 2001-08-28 | Arch Development Corporation | Method and system for the computerized assessment of breast cancer risk |
| US20020064788A1 (en)* | 2000-07-21 | 2002-05-30 | Monforte Joseph A. | Systematic approach to mechanism-of-response analyses |
| US20030007598A1 (en)* | 2000-11-24 | 2003-01-09 | U-Systems, Inc. | Breast cancer screening with adjunctive ultrasound mammography |
| US6785662B1 (en) | 2001-05-04 | 2004-08-31 | Uop Llc | Refinery scheduling of incoming crude oil using a genetic algorithm |
| US20030231790A1 (en)* | 2002-05-02 | 2003-12-18 | Bottema Murk Jan | Method and system for computer aided detection of cancer |
| US6748044B2 (en) | 2002-09-13 | 2004-06-08 | Ge Medical Systems Global Technology Company, Llc | Computer assisted analysis of tomographic mammography data |
| US20050027188A1 (en) | 2002-12-13 | 2005-02-03 | Metaxas Dimitris N. | Method and apparatus for automatically detecting breast lesions and tumors in images |
Non-Patent Citations (3)
| Title |
|---|
| Abstract: Dongcheol Kim, Sehun Rhee, et al., Modeling and Optimization of a GMA Welding Process by Genetic Algorithm and Response Surface Methodology, Int'l Journal of Production Research, vol. 40, No. 7, May 1, 2002, http://taylorandfrancis.metapress.com/(2i1xsi55ru1kre45h53xhbb2)/app/home/contribution.asp?referrer=parent&backto=searcharticlesresults, 13,77;. |
| Abstract: L.P. Khoo and C.H. Chen, "Integration of Response Surface Methodology with Genetic Algorithms," Int'l Journal of Advanced Manufacturing Technology, vol. 18, No. 7, Oct. 2001, pp. 483-489, http://www.springerlink.com/(ftfusd55stuvte45zg4wsi55)/app/home/contribution.asp?referrer=parent&backto=searcharticlesresults,24,75;. |
| Odusanya, A.A., M.O., Petrovic, D., et al., "A Genetic Algorithm-Based Model for Breast Cancer Prognosis", IN: Proceedings of the 6th World Multiconference on Svstemics, Cybernetics and Informatics (SCI2002), 2002, pp. 394-397. |
Cited By (44)
| Publication number | Priority date | Publication date | Assignee | Title |
|---|---|---|---|---|
| US10540763B2 (en) | 2004-11-04 | 2020-01-21 | Merge Healthcare Solutions Inc. | Systems and methods for matching, naming, and displaying medical images |
| US9734576B2 (en) | 2004-11-04 | 2017-08-15 | D.R. Systems, Inc. | Systems and methods for interleaving series of medical images |
| US10790057B2 (en) | 2004-11-04 | 2020-09-29 | Merge Healthcare Solutions Inc. | Systems and methods for retrieval of medical data |
| US10614615B2 (en) | 2004-11-04 | 2020-04-07 | Merge Healthcare Solutions Inc. | Systems and methods for viewing medical 3D imaging volumes |
| US10437444B2 (en) | 2004-11-04 | 2019-10-08 | Merge Healthcare Soltuions Inc. | Systems and methods for viewing medical images |
| US9836202B1 (en) | 2004-11-04 | 2017-12-05 | D.R. Systems, Inc. | Systems and methods for viewing medical images |
| US10096111B2 (en) | 2004-11-04 | 2018-10-09 | D.R. Systems, Inc. | Systems and methods for interleaving series of medical images |
| US11177035B2 (en) | 2004-11-04 | 2021-11-16 | International Business Machines Corporation | Systems and methods for matching, naming, and displaying medical images |
| US9727938B1 (en) | 2004-11-04 | 2017-08-08 | D.R. Systems, Inc. | Systems and methods for retrieval of medical data |
| US10896745B2 (en) | 2006-11-22 | 2021-01-19 | Merge Healthcare Solutions Inc. | Smart placement rules |
| US9754074B1 (en) | 2006-11-22 | 2017-09-05 | D.R. Systems, Inc. | Smart placement rules |
| US9672477B1 (en) | 2006-11-22 | 2017-06-06 | D.R. Systems, Inc. | Exam scheduling with customer configured notifications |
| US20100232668A1 (en)* | 2007-10-17 | 2010-09-16 | Deutsches Krebsforschungszentrum | Method, Computer Program And Workstation For Removing Undesirable Objects From A Digital Medical Image |
| US20100061613A1 (en)* | 2008-09-11 | 2010-03-11 | PACSPLUS Co., Ltd. | Method, apparatus and program for processing mammographic image |
| US8165380B2 (en)* | 2008-09-11 | 2012-04-24 | PACSPLUS Co., Ltd. | Method, apparatus and program for processing mammographic image |
| US10592688B2 (en) | 2008-11-19 | 2020-03-17 | Merge Healthcare Solutions Inc. | System and method of providing dynamic and customizable medical examination forms |
| US20100183204A1 (en)* | 2008-12-16 | 2010-07-22 | Olympus Corporation | Image processing device, image processing method, and computer readable storage medium storing image processing program |
| US8290280B2 (en)* | 2008-12-16 | 2012-10-16 | Olympus Corporation | Image processing device, image processing method, and computer readable storage medium storing image processing program |
| US9684762B2 (en) | 2009-09-28 | 2017-06-20 | D.R. Systems, Inc. | Rules-based approach to rendering medical imaging data |
| US9892341B2 (en) | 2009-09-28 | 2018-02-13 | D.R. Systems, Inc. | Rendering of medical images using user-defined rules |
| US10607341B2 (en) | 2009-09-28 | 2020-03-31 | Merge Healthcare Solutions Inc. | Rules-based processing and presentation of medical images based on image plane |
| US9934568B2 (en) | 2009-09-28 | 2018-04-03 | D.R. Systems, Inc. | Computer-aided analysis and rendering of medical images using user-defined rules |
| US10579903B1 (en) | 2011-08-11 | 2020-03-03 | Merge Healthcare Solutions Inc. | Dynamic montage reconstruction |
| US9177379B1 (en) | 2011-12-14 | 2015-11-03 | Atti International Services Company, Inc. | Method and system for identifying anomalies in medical images |
| US8724871B1 (en) | 2011-12-14 | 2014-05-13 | Atti International Services Company, Inc. | Method and system for identifying anomalies in medical images |
| US9779504B1 (en)* | 2011-12-14 | 2017-10-03 | Atti International Services Company, Inc. | Method and system for identifying anomalies in medical images especially those including one of a pair of symmetric body parts |
| US9401021B1 (en) | 2011-12-14 | 2016-07-26 | Atti International Services Company, Inc. | Method and system for identifying anomalies in medical images especially those including body parts having symmetrical properties |
| WO2013186676A1 (en)* | 2012-06-13 | 2013-12-19 | Crystalview Medical Imaging Limited | Suppression of reverberations and/or clutter in ultrasonic imaging systems |
| US9495604B1 (en) | 2013-01-09 | 2016-11-15 | D.R. Systems, Inc. | Intelligent management of computerized advanced processing |
| US10665342B2 (en) | 2013-01-09 | 2020-05-26 | Merge Healthcare Solutions Inc. | Intelligent management of computerized advanced processing |
| US10672512B2 (en) | 2013-01-09 | 2020-06-02 | Merge Healthcare Solutions Inc. | Intelligent management of computerized advanced processing |
| US11094416B2 (en) | 2013-01-09 | 2021-08-17 | International Business Machines Corporation | Intelligent management of computerized advanced processing |
| US10909168B2 (en) | 2015-04-30 | 2021-02-02 | Merge Healthcare Solutions Inc. | Database systems and interactive user interfaces for dynamic interaction with, and review of, digital medical image data |
| US10929508B2 (en) | 2015-04-30 | 2021-02-23 | Merge Healthcare Solutions Inc. | Database systems and interactive user interfaces for dynamic interaction with, and indications of, digital medical image data |
| US10108845B2 (en) | 2017-03-02 | 2018-10-23 | Hong Kong Applied Science and Technology Research Institute Company Limited | Anomaly detection for medical samples under multiple settings |
| CN107735838B (en)* | 2017-03-02 | 2021-04-09 | 香港应用科技研究院有限公司 | Anomaly detection in medical samples in a variety of settings |
| WO2018157387A1 (en)* | 2017-03-02 | 2018-09-07 | Hong Kong Applied Science and Technology Research Institute Company Limited | Anomaly detection for medical samples under multiple settings |
| CN107735838A (en)* | 2017-03-02 | 2018-02-23 | 香港应用科技研究院有限公司 | Anomaly detection for medical samples in multiple settings |
| TWI750518B (en)* | 2019-04-01 | 2021-12-21 | 大陸商北京市商湯科技開發有限公司 | Image processing method, image processing device, electronic equipment and computer readable storage medium |
| TWI758233B (en)* | 2019-04-01 | 2022-03-11 | 大陸商北京市商湯科技開發有限公司 | Image processing method and image processing device, electronic device and computer-readable storage medium |
| TWI758234B (en)* | 2019-04-01 | 2022-03-11 | 大陸商北京市商湯科技開發有限公司 | Image processing method and image processing device, electronic device and computer-readable storage medium |
| US20220067945A1 (en)* | 2020-09-01 | 2022-03-03 | Research & Business Foundation Sungkyunkwan University | Apparatus and method for lesion analysis based on marginal feature |
| US11756207B2 (en)* | 2020-09-01 | 2023-09-12 | Research & Business Foundation Sungkyunkwan University | Apparatus and method for lesion analysis based on marginal feature |
| CN113361439A (en)* | 2021-06-17 | 2021-09-07 | 中国人民解放军海军航空大学航空作战勤务学院 | SAR image ship target identification method and system |
Similar Documents
| Publication | Publication Date | Title |
|---|---|---|
| US7899514B1 (en) | Medical image processing methodology for detection and discrimination of objects in tissue | |
| Tang et al. | Splat feature classification with application to retinal hemorrhage detection in fundus images | |
| US6760468B1 (en) | Method and system for the detection of lung nodule in radiological images using digital image processing and artificial neural network | |
| EP1815431B1 (en) | False positive reduction in computer-assisted detection (cad) with new 3d features | |
| US8311310B2 (en) | Methods and apparatus to integrate systematic data scaling into genetic algorithm-based feature subset selection | |
| Alahmer et al. | Computer-aided classification of liver lesions from CT images based on multiple ROI | |
| EP1815399B1 (en) | A stratification method for overcoming unbalanced case numbers in computer-aided lung nodule false positive reduction | |
| US20040086161A1 (en) | Automated detection of lung nodules from multi-slice CT image data | |
| US20080002870A1 (en) | Automatic detection and monitoring of nodules and shaped targets in image data | |
| CN101061509A (en) | System and method for automated detection and segmentation of tumor boundaries within medical imaging data | |
| US20090175531A1 (en) | System and method for false positive reduction in computer-aided detection (cad) using a support vector macnine (svm) | |
| Gunasundari et al. | A study of textural analysis methods for the diagnosis of liver diseases from abdominal computed tomography | |
| Laajili et al. | Application of radiomics features selection and classification algorithms for medical imaging decision: MRI radiomics breast cancer cases study | |
| Hong et al. | Automatic liver tumor detection from CT | |
| Gopinath et al. | Enhanced lung cancer classification and prediction based on hybrid neural network approach | |
| US7555152B2 (en) | System and method for detecting ground glass nodules in medical images | |
| GB2457022A (en) | Creating a fuzzy inference model for medical image analysis | |
| JP2004173748A (en) | Generation method for similar medical image database, searching method for similar medical image database and similar medical image and device used for the same | |
| US20250086787A1 (en) | Liver cirrhosis detection in digital images | |
| Loizidou et al. | A new method for breast micro-calcification detection and characterization using digital temporal subtraction of mammogram pairs | |
| Arymurthy | Association technique based on classification for classifying microcalcification and mass in mammogram | |
| JP2003079606A (en) | Abnormal shadow-detecting system | |
| Caballo et al. | Breast parenchyma analysis and classification for breast masses detection using texture feature descriptors and neural networks in dedicated breast CT images | |
| Kumar et al. | Integrated global and local feature extraction and classification from computerized tomography (CT) images for lung cancer classification. | |
| Majumder et al. | Digital image analysis for early diagnosis of cancer: Identification of pre-cancerous state |
Legal Events
| Date | Code | Title | Description |
|---|---|---|---|
| AS | Assignment | Owner name:ARMY, UNITED STATES OF AMERICA AS REPRESENTED BY T Free format text:ASSIGNMENT OF ASSIGNORS INTEREST;ASSIGNOR:NASH, KEVIN D.;REEL/FRAME:017671/0505 Effective date:20051214 Owner name:ARMY, USA AS REPRESENTED BY THE SECRETARY OF THE, Free format text:ASSIGNMENT OF ASSIGNORS INTEREST;ASSIGNOR:KIRKLAND, JAMES H.;REEL/FRAME:017517/0772 Effective date:20051214 | |
| STCF | Information on status: patent grant | Free format text:PATENTED CASE | |
| REMI | Maintenance fee reminder mailed | ||
| FPAY | Fee payment | Year of fee payment:4 | |
| SULP | Surcharge for late payment | ||
| FEPP | Fee payment procedure | Free format text:MAINTENANCE FEE REMINDER MAILED (ORIGINAL EVENT CODE: REM.); ENTITY STATUS OF PATENT OWNER: LARGE ENTITY | |
| LAPS | Lapse for failure to pay maintenance fees | Free format text:PATENT EXPIRED FOR FAILURE TO PAY MAINTENANCE FEES (ORIGINAL EVENT CODE: EXP.); ENTITY STATUS OF PATENT OWNER: LARGE ENTITY | |
| STCH | Information on status: patent discontinuation | Free format text:PATENT EXPIRED DUE TO NONPAYMENT OF MAINTENANCE FEES UNDER 37 CFR 1.362 | |
| FP | Lapsed due to failure to pay maintenance fee | Effective date:20190301 |