US7873529B2 - System and method for analyzing and correcting retail data - Google Patents
System and method for analyzing and correcting retail dataDownload PDFInfo
- Publication number
- US7873529B2 US7873529B2US10/783,323US78332304AUS7873529B2US 7873529 B2US7873529 B2US 7873529B2US 78332304 AUS78332304 AUS 78332304AUS 7873529 B2US7873529 B2US 7873529B2
- Authority
- US
- United States
- Prior art keywords
- data
- source
- sources
- data source
- factor
- Prior art date
- Legal status (The legal status is an assumption and is not a legal conclusion. Google has not performed a legal analysis and makes no representation as to the accuracy of the status listed.)
- Active, expires
Links
Images


Classifications
- G—PHYSICS
- G06—COMPUTING OR CALCULATING; COUNTING
- G06Q—INFORMATION AND COMMUNICATION TECHNOLOGY [ICT] SPECIALLY ADAPTED FOR ADMINISTRATIVE, COMMERCIAL, FINANCIAL, MANAGERIAL OR SUPERVISORY PURPOSES; SYSTEMS OR METHODS SPECIALLY ADAPTED FOR ADMINISTRATIVE, COMMERCIAL, FINANCIAL, MANAGERIAL OR SUPERVISORY PURPOSES, NOT OTHERWISE PROVIDED FOR
- G06Q30/00—Commerce
- G06Q30/02—Marketing; Price estimation or determination; Fundraising
- G—PHYSICS
- G06—COMPUTING OR CALCULATING; COUNTING
- G06Q—INFORMATION AND COMMUNICATION TECHNOLOGY [ICT] SPECIALLY ADAPTED FOR ADMINISTRATIVE, COMMERCIAL, FINANCIAL, MANAGERIAL OR SUPERVISORY PURPOSES; SYSTEMS OR METHODS SPECIALLY ADAPTED FOR ADMINISTRATIVE, COMMERCIAL, FINANCIAL, MANAGERIAL OR SUPERVISORY PURPOSES, NOT OTHERWISE PROVIDED FOR
- G06Q10/00—Administration; Management
- G06Q10/06—Resources, workflows, human or project management; Enterprise or organisation planning; Enterprise or organisation modelling
- G06Q10/063—Operations research, analysis or management
- G06Q10/0637—Strategic management or analysis, e.g. setting a goal or target of an organisation; Planning actions based on goals; Analysis or evaluation of effectiveness of goals
- G—PHYSICS
- G06—COMPUTING OR CALCULATING; COUNTING
- G06Q—INFORMATION AND COMMUNICATION TECHNOLOGY [ICT] SPECIALLY ADAPTED FOR ADMINISTRATIVE, COMMERCIAL, FINANCIAL, MANAGERIAL OR SUPERVISORY PURPOSES; SYSTEMS OR METHODS SPECIALLY ADAPTED FOR ADMINISTRATIVE, COMMERCIAL, FINANCIAL, MANAGERIAL OR SUPERVISORY PURPOSES, NOT OTHERWISE PROVIDED FOR
- G06Q30/00—Commerce
- G06Q30/02—Marketing; Price estimation or determination; Fundraising
- G06Q30/0201—Market modelling; Market analysis; Collecting market data
- G06Q30/0204—Market segmentation
Definitions
- the present inventionrelates to computer software, and more particularly, but not exclusively, relates to systems and methods for analyzing and correcting retail data.
- POSpoint of sale
- IRIInformation Resources, Inc.
- ACNA.C. Nielsen
- Sampling errorsare those errors attributable to the normal (random) variation that would be expected due to the fact that, by the very act of sampling, measurements are not being taken from the entire population. Sampling errors can be reduced by increasing the sample size since the standard deviation of the sampling distribution (often referred to as the “standard error”) decreases with the square root of the sample size.
- Biasesare systematic errors that affect any sample taken by a particular sampling method. Because these errors are systematic, they are not affected by the size of the sample. Examples of panel biases include, but are not limited to:
- bias and sampling errorare present in consumer panel data, for panels of a size significant enough to be of use in tracking consumer purchases (e.g., the IRI and ACN panels), the vast majority of the error that is present is due to bias. Further, since bias is unaffected by sample size, the negative impact of bias relative to the negative impact of sampling error worsens as the panel size increases.
- biasThe negative impact of bias is substantially larger than that of sampling error for most products. Increasing the size of the sample (i.e., the size of the panel) will reduce only the sampling error and may, in fact, worsen any bias that may be present. Given the sizes of today's consumer panels, there is limited advantage to be gained by increasing the size of the panel—since over 90% of the total error is often due to non-sampling errors (i.e., bias).
- Coverageincludes both the number of channels in which measurements are reported and the business usefulness of those measurements. While Information Resources, Inc.'s (IRI's) point-of-sale (POS) based services provide excellent coverage of the Food/Grocery, Drug, Mass (excluding WALMART®), Convenience, and Military channels, these channels may account for only 50% of a manufacturer's sales—and as little as 20% of its sales growth. Non-tracked, growth channels—e.g., Club, Dollar, WALMART®—are, thus, becoming an increasingly important part of manufacturers' businesses while at the same time having little data available in the way of actionable sales measurement information. Further advancements are also needed in this area.
- IRI'sInformation Resources, Inc.'s
- POSpoint-of-sale
- One form of the present inventionis a unique system for analyzing and correcting retail data.
- Another formincludes operating a computer system that has several client workstations and servers coupled together over a network.
- At least one serveris a database server that stores sale data for various data sources, product identifier and attribute categorizations, calculated factors, and other data. External sources can be used to feed the data store on a scheduled or on-demand basis.
- At least one serveris a server that contains business logic for analyzing and correcting some of the data sources stored in database server.
- Some client workstationscan be used to administer settings used in process of analyzing and correcting the data sources.
- Other client workstationscan be used to view the corrected and/or uncorrected data in a multi-dimensional format using a graphical user interface.
- Another formincludes providing a computer system that uses multiple data sources to support inferences that would not be feasible based upon any single data source when used alone.
- Salesare positioned along product, venue, and time dimension hierarchies. Characteristics of the data source determine the level of aggregation at which the data can be positioned in the framework. For example, POS data may be available weekly in a particular channel; however, direct store delivery (DSD) data may be available at a daily level, and still other measures may be available only at a monthly or quarterly level.
- DSDdirect store delivery
- the situationis similar along the product and venue dimensions—ranging from the specificity of the sale of a particular UPC-coded item at a particular store to the generality of total category sales within a channel (across all geographies).
- the data fusion processitself is an iterative one, utilizing both competitive and complementary fusion methods.
- competitive fusiontwo or more data sources that provide overlapping measurements along at least one dimension are compared (“competed”) against each other at some level of aggregation along the product, venue, and time dimensions. More accurate/reliable sources are used to correct less accurate/reliable sources.
- complementary fusionrelationships modeled where data sources overlap are projected to areas of the data framework in which fewer (or even a single) sources exist—enhancing the accuracy/reliability of those fewer (or single) sources even in domains where data from of the other sources upon which the models were based do not exist.
- the processis iterative in that the competitive and complementary fusion methodologies can be repeated at varying level of aggregation of the data framework.
- Another formincludes providing a method for identifying and quantifying biases in consumer panel data so that the inherent utility of the consumer panel data may be enhanced.
- This methodis termed competitive fusion.
- At least two data sourcesare used, with at least one assumed to be more accurate than the other—e.g., scanner-based POS data and consumer panel purchase data.
- the data sourcesare aligned along a common framework (i.e., data model or hierarchy) along the dimensions of product (item), venue (channel and/or geography), and/or time, with aggregation along these dimensions as necessary.
- the attributes associated with the frameworkare identified along which the framework may be characterized.
- the data sourcesare compared along these attributes—quantifying the impact of the attributes on the less-accurate data source.
- the usefulness of the consumer panel datamay be enhanced.
- the effect of the biasesmay be corrected for via modeling; i.e., the raw data may be adjusted to reduce or eliminate the effect of the biases.
- panel management practicesmay be changed in order to remove or lessen the source of bias in the panel itself.
- Yet another form of the present inventionincludes providing a method for using complementary fusion to “project” the results and relationships from the competitive fusion method onto consumer panel data in a channel with incomplete/less data than desired (e.g. data from WALMART®) to help enhance the accuracy of the Panel data source.
- competitive fusionmay be used again in several possible ways and at several levels of aggregation along the venue, time, and/or product dimensions in order to develop independent estimates against which the complementary-fused estimate may be competed:
- FIG. 1is a diagrammatic view of a computer system of one embodiment of the present invention.
- FIG. 2is a multi-dimensional diagram illustrating the data space used by the system of FIG. 1 .
- FIG. 3is a block diagram illustrating selected data sources that are used by the system of FIG. 1 .
- FIG. 4is a high-level process flow diagram for the system of FIG. 1 .
- FIG. 5Ais a first part process flow diagram for the system of FIG. 1 demonstrating the stages involved in performing competitive and complementary fusion.
- FIG. 5Bis a second part process flow diagram for the system of FIG. 1 demonstrating the stages involved in performing competitive and complementary fusion.
- FIG. 6Ais a first part process flow diagram for the system of FIG. 1 demonstrating a preferred process for calculating and applying factors in competitive fusion.
- FIG. 6Bis a second part process flow diagram for the system of FIG. 1 demonstrating a preferred process for calculating and applying factors in competitive fusion.
- FIG. 6Cis a third part process flow diagram for the system of FIG. 1 demonstrating a preferred process for calculating and applying factors in competitive fusion.
- FIG. 7Ais a first part process flow diagram for the system of FIG. 1 demonstrating an alternate process for calculating and applying factors in competitive fusion.
- FIG. 7Bis a second part process flow diagram for the system of FIG. 1 demonstrating an alternate process for calculating and applying factors in competitive fusion.
- FIG. 7Cis a third part process flow diagram for the system of FIG. 1 demonstrating an alternate process for calculating and applying factors in competitive fusion.
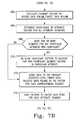
- FIG. 8is a process flow diagram for the system of FIG. 1 demonstrating the stages involved in performing complementary fusion.
- FIG. 9is a process flow diagram for the system of FIG. 1 demonstrating the stages involved in iteratively performing competitive and complementary fusion steps.
- FIG. 10is a process flow diagram for the system of FIG. 1 demonstrating the stages involved in calculating blended factors where multiple factor measures are available for the same factor.
- FIG. 11is a data table illustrating hypothetical data elements stored in the database of FIG. 1 to be used in accordance with the procedure of FIG. 6 .
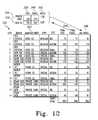
- FIG. 12is a data table illustrating hypothetical data elements that are stored in the database of FIG. 1 and are adjusted according to factors for a first attribute in accordance with the procedure of FIG. 6 .
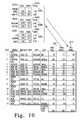
- FIG. 13is a data table illustrating hypothetical data elements that are stored in the database of FIG. 1 and are adjusted according to factors for a second attribute in accordance with the procedure of FIG. 6 .
- FIG. 14is a data table illustrating hypothetical data elements that are stored in the database of FIG. 1 and are adjusted according to factors for a third attribute in accordance with the procedure of FIG. 6 .
- FIG. 15is a data table illustrating hypothetical data elements stored in the database of FIG. 1 , with attribute summaries, and used in accordance with the procedure of FIG. 7 .
- FIG. 16is a data table illustrating hypothetical data elements that are stored in the database of FIG. 1 and are adjusted according to factors for three attributes in accordance with the procedure of FIG. 7 .
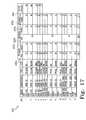
- FIG. 17is a data table illustrating hypothetical data elements by retailer that are stored in the database of FIG. 1 and used in accordance with the complementary fusion procedure of FIG. 8 .
- FIG. 18is a data table illustrating hypothetical data elements by retailer that are stored in the database of FIG. 1 , adjusted using complementary fusion according to the factors calculated in accordance with the procedure of FIG. 7 , as described in the procedure of FIG. 8 .
- FIG. 19is a data table illustrating hypothetical data elements by retailer that are stored in the database of FIG. 1 and are used to perform another iteration of competitive fusion, including calculating blended factors, as described in the procedures of FIG. 9 and FIG. 10 .
- FIG. 20is a data table illustrating hypothetical data elements by retailer that are stored in the database of FIG. 1 and updated based upon the blended factor, as described in the procedures of FIG. 9 and FIG. 10 .
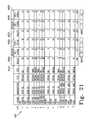
- FIG. 21is a data table illustrating hypothetical real, original, and corrected values stored in the database of FIG. 1 to show how the competitive and complementary fusion process helped improve the data, as described in the procedures of FIG. 9 .
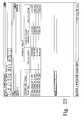
- FIG. 22is a simulated screen of a user interface for one or more client workstations of FIG. 1 that allows a user to view the multi-dimensional elements in the database, as described in the procedures of FIG. 4 and FIG. 5 .
- FIG. 1is a diagrammatic view of computer system 20 of one embodiment of the present invention.
- Computer system 20includes computer network 22 .
- Computer network 22couples together a number of computers 21 over network pathways 23 a - e .
- system 20includes several servers, namely business logic server 24 and database server 25 .
- System 20also includes external data sources 26 , which in various embodiments include other computers, files, electronic and/or paper data sources. External data sources 26 are optionally coupled to network over pathway 23 f .
- System 20also includes client workstations 30 a , 30 b , and 30 c (collectively client workstations 30 ). While computers 21 are each illustrated as being either a server or a client, it should be understood that any of computers 21 may be arranged to provide both a client and server functionality, solely a client functionality, or solely a server functionality. Furthermore, it should be understood that while six computers 21 are illustrated, more or fewer may be utilized in alternative embodiments.
- Computers 21include one or more processors or CPUs ( 50 a , 50 b , 50 c , 50 d , and 50 e , respectively) and one or more types of memory ( 52 a , 52 b , 52 c , 52 d , and 52 e , respectively).
- Each memory 52 a , 52 b , 52 c , 52 d , and 52 eincludes a removable memory device.
- Each processormay be comprised of one or more components configured as a single unit. Alternatively, when of a multi-component form, a processor may have one or more components located remotely relative to the others.
- One or more components of each processormay be of the electronic variety defining digital circuitry, analog circuitry, or both.
- each processoris of a conventional, integrated circuit microprocessor arrangement, such as one or more PENTIUM III or PENTIUM 4 processors supplied by INTEL Corporation of 2200 Mission College Boulevard, Santa Clara, Calif. 95052, USA.
- Each memoryis one form of computer-readable device.
- Each memorymay include one or more types of solid-state electronic memory, magnetic memory, or optical memory, just to name a few.
- each memorymay include solid-state electronic Random Access Memory (RAM), Sequentially Accessible Memory (SAM) (such as the First-In, First-Out (FIFO) variety or the Last-In-First-Out (LIFO) variety), Programmable Read-Only Memory (PROM), Electronically Programmable Read-Only Memory (EPROM), or Electrically Erasable Programmable Read-Only Memory (EEPROM); an optical disc memory (such as a DVD or CD ROM); a magnetically encoded hard disc, floppy disc, tape, or cartridge media; or a combination of any of these memory types.
- each memorymay be volatile, nonvolatile, or a hybrid combination of volatile and nonvolatile varieties.
- each computer 21is coupled to a display.
- Computers 21may be of the same type, or be a heterogeneous combination of different computing devices.
- the displaysmay be of the same type, or a heterogeneous combination of different visual devices.
- each computer 21may also include one or more operator input devices such as a keyboard, mouse, track ball, light pen, and/or microtelecommunicator, to name just a few representative examples.
- operator input devicessuch as a keyboard, mouse, track ball, light pen, and/or microtelecommunicator, to name just a few representative examples.
- one or more other output devicesmay be included such as loudspeaker(s) and/or a printer.
- Various display and input device arrangementsare possible.
- Computer network 22can be in the form of a wired or wireless Local Area Network (LAN), Municipal Area Network (MAN), Wide Area Network (WAN) such as the Internet, a combination of these, or such other network arrangement as would occur to those skilled in the art.
- the operating logic of system 20can be embodied in signals transmitted over network 22 , in programming instructions, dedicated hardware, or a combination of these. It should be understood that more or fewer computers 21 can be coupled together by computer network 22 .
- system 20operates at one or more physical locations where business logic server 24 is configured as a server that hosts and runs application business logic 33 , database server 25 is configured as a database 34 that stores reference data 35 (e.g. product identifiers 36 a , attributes 36 b , and a dictionary 36 c ), at least two retail data sources (such as point-of-sale and panel data) 38 , calculated factors 39 , and other data 40 .
- reference data 35e.g. product identifiers 36 a , attributes 36 b , and a dictionary 36 c
- at least two retail data sourcessuch as point-of-sale and panel data
- calculated factors 39e.g., calculated factors 39
- other data 40e.g., external data 26 is imported to database server 25 from a mainframe extract file that is generated on a periodic basis.
- mainframe extract filee.g., a mainframe extract file that is generated on a periodic basis.
- external data sourcesare not used.
- database 34 of database server 25is a relational database and/or a data warehouse.
- database 34can be a series of files, a combination of database tables and external files, calls to external web or other services that return data, and various other arrangements for accessing data for use in a program as would occur to one of ordinary skill in the art.
- Client workstations 30are configured for providing one or more user interfaces to allow a user to modify settings used by business logic 33 and/or to view the retail data sources 38 of database 34 in a multi-dimensional format. Typical applications of system 20 would include more or fewer client workstations of this type at one or more physical locations, but three have been illustrated in FIG. 1 to preserve clarity.
- business logic server 24 and database server 25could be provided on the same computer or varying other arrangements of computers at one or more physical locations and still be within the spirit of the invention. Farms of dedicated servers could also be provided to support the specific features if desired.
- FIG. 2is a multi-dimensional cube 60 that illustrates a way of conceptually thinking about the elements stored in database 34 of system 20 .
- Cube 60contains three dimensions: complexity 62 , sources 64 , and aggregation 66 .
- complexity 62the data in database 34 is categorized according to complexity 62 , sources 64 , and aggregation 66 axes of multi-dimensional cube 60 for analysis, viewing, and/or reporting.
- Cube 60helps illustrate the concept that the aggregation dimension 66 is multi-dimensional, although other dimensions could be used than illustrated.
- Examples of elements of the source dimension 64includes client (internal) data 65 a , scanning (point-of-sale) data 65 b , panel data 65 c , audit data 66 d , and other (external) data 66 e , as a few examples.
- Examples of elements of the aggregation dimension 66include time 67 a , item (product) 67 b , channel (venue) 67 c , geography (venue) 67 d , and other 67 e , to name a few examples.
- Various dimensions of cube 60are used in the competitive fusion and complementary fusion processes described herein.
- FIG. 3is a block diagram illustrating further examples of the one or more retail data sources ( 36 in FIGS. 1 and 64 in FIG. 2 ) that can be used by the system of FIG. 1 in the competitive fusion and complementary fusion processes described herein.
- Point-of-sale data 70consumer panel data 72
- audit/survey data 74including causal (promotional) data
- population census data 78including geo-demographic data
- store universe data 80including geo-demographic data
- other data sources 82and specialty panels 84
- the types of data that can be used with system 20are not limited to traditional retailers. For example, data collected during any part of the supply chain could be used as a data source.
- FIG. 4illustrates the high-level procedures for performing “competitive fusion” and “complementary fusion”.
- “competitive fusion”two or more data sources that provide overlapping measurements along at least one dimension are compared (“competed”) against each other at some level of aggregation along the product, venue, and/or time dimensions. More accurate/reliable sources are used to correct less accurate/reliable sources.
- procedure 150is at least partially implemented in the operating logic of system 20 .
- Procedure 150begins with business logic server 24 identifying at least two data sources, with at least one data source being more accurate than another (stage 152 ).
- At least one data source(see e.g. 36 in FIGS. 1 and 64 in FIG. 2 ) is used as the “reference” data source and another is used as the “target” data source with the biases to be identified and quantified.
- the reference data sourceis more accurate than the target data source.
- scanner-based point-of-sale (POS) datais typically a good “reference” source, due to its inherent accuracy and high level of granularity along the dimensions of time, venue, and product.
- manufacturer-supplied shipment dataespecially where such data is based upon direct store delivery (DSD) information, may be utilized as a “reference” source.
- DSDdirect store delivery
- retailer-specific data sourcese.g., “frequent shopper” program data from loyalty cards
- the product characteristics of the data sourcesshould ideally be available at the item level, where “item” is by UPC, SKU, or another unique product identifier.
- itemis by UPC, SKU, or another unique product identifier.
- venue characteristics of the data sourcesthey should ideally be available at the retailer and market level, where “retailer” is a store (or chain of stores) within a particular retail channel and “market” is a geographic construct (e.g., Chicago area).
- “retailer”is a store (or chain of stores) within a particular retail channel and “market” is a geographic construct (e.g., Chicago area).
- time characteristics of the data sourcesthey should ideally be available at the weekly level (or even daily in some cases), although monthly data (or 4-week “quad” data) or various other time frames are also acceptable.
- more aggregated levels of the producte.g., “brand”
- venuee.g., “food” or “mass” channel for retailer and/or “region” or “total U.S.” for market
- timee.g., quarterly or annual data
- stage 154After the data sources have been identified (stage 152 ), they are next aligned along a common framework (stage 154 ), such as along the item, venue, and/or time dimensions. Depending upon the characteristics (and quality) of the data sources, some aggregation along these dimensions may be required in order for the alignment to be possible. For example, UPC-level POS data may need to be aggregated at the SKU or even brand level in order to be aligned with data from other sources (particularly in the cases in which venue-specific UPCs are involved). Similarly, store-level data may need to be aggregated at the local market or even regional level in order to be aligned with consumer panel purchase data. Finally, weekly (or even daily) POS data may need to be aggregated at the 4-week quad level in order to be aligned with shipment/delivery data. Various other arrangements for aligning the data along a common framework are also possible.
- the item structureis provided by a multiple-level hierarchy, in which UPCs are the lowest level and are aggregated along category-related characteristics.
- Venue structureis provided along both geographical and channel dimensions, with FIPS-code-level transactions being aligned along market and regions and store locations being part of a sub-chain, chain, and parent store hierarchy.
- Time structureis presently provided at the weekly level at the lowest level of aggregation, with daily data being aggregated at the weekly level before placement into the structure, although a daily data compatible structure or other variation is also possible.
- overlapping attribute segments of at least one dimensionare available to use for data comparison and correction.
- Certain attributes associated with the data sourcesare identified along which more detailed comparisons may be made.
- product attributesare available in from reference data 35 of database 34 .
- product attributesare available in from reference data 35 of database 34 .
- one or more pieces of information from product identifier 36 a , attributes 36 b , and dictionary 36 c referencescan be used to access or modify attributes, attribute hierarchies, and mappings.
- These attributesrepresent category-specific dimensions along which products in that category may be characterized (e.g., diet vs. regular in carbonated soft drinks, active ingredient in internal analgesics, product size in most categories).
- attribute used hereinis meant in the generic sense to cover various types of descriptors.
- Business logic server 24compares the data sources and calculates factors for the attributes of at least one element of the common framework (stage 158 ). Each segment of a given attribute will have its own factor, as described in detail herein. The presence of attribute-related bias may be identified by comparison of the data sources. In the examples illustrated herein, volumetric comparisons are made (e.g., equivalent units); however, various other measures (e.g., dollar sales, actual units) could also be utilized, as long as the same type of measure is being used for the comparison. For example, it would not be useful to compare dollar sales to actual units, but it would be useful to compare dollars to dollars.
- the comparison itselfis between the value of the target data source (e.g., projected panel volume) and that of the reference data source (e.g., POS data).
- This comparisoncan be by way of two-sample inference, regression analysis, or other statistical tests appropriate for determining whether any differences between the two data sources are associated with the attributes along which they have been characterized at a statistically significant level. Where such differences (biases) are identified, they are quantified, and factors are calculated for use in bias correction/adjustment.
- the factorsare used to correct bias in the less accurate data source (stage 160 ), which in this example is consumer panel data.
- stage 160By using the factors to correct the bias in the less accurate “target” data source, the effect of these biases is reduced or eliminated.
- These biasescan be corrected by adjusting the raw data, or by way of post-adjustment.
- the factorsare also used to supplement the data that is incomplete in the less complete data source (stage 162 ), such as consumer panel data.
- Incomplete datais used in a general sense to mean that less data was provided than desired or that the data is less accurate than desired, to name a few non-limiting examples.
- highly accurate datae.g. POS data
- less accurate datae.g. panel data
- Relationships modeled where data sources overlapare projected to areas of the data framework in which fewer (or even a single) sources exist, enhancing the accuracy and reliability of those fewer (or single) sources even in domains where data from of the other sources upon which the models were based do not exist.
- Users and/or reportscan access database 34 from one of client workstations 30 to view/analyze the corrected and adjusted data (stage 164 ). Users and/or reports can also access database 34 from one of client workstations 30 to view and/or modify settings used by system 20 to make data corrections. The steps are repeated as desired (stage 166 ). The process then ends at stage 168 .
- FIGS. 5A-5Bare first and second parts of a process flow diagram for the system of FIG. 1 demonstrating the stages involved in performing competitive and complementary fusion using POS and panel data as the data sources. While in this and other figures, the first data source (the “source” data source) is described as being POS data and the second data source (the “target” data source) is described as being panel data, it will be appreciated that the system and methodologies can be used with other data sources as appropriate.
- procedure 170is at least partially implemented in the operating logic of system 20 . Procedure 170 begins in FIG. 5A with receiving updates for reference data 35 and/or data sources 38 on a periodic basis (stage 172 ).
- a parameter specification for the number of weeks used in calculating the factorsis thirteen, and the minimum week range included in database 34 is then set to be thirteen weeks prior to the update week.
- Database 34may be built and maintained using various data sources and can include various types of data, as would occur to one of ordinary skill in the art.
- system 20supports the option to pull the desired period (e.g. all thirteen weeks) of the data sources 38 , append the recent period (e.g. four weeks) needed since the last factor update to the existing database 34 , and/or be able to recreate the data a week at a time.
- the systemcan optionally drop the same number of weeks from the start week of database 34 as were appended to the end week. For example, if the option was chosen to append the four weeks needed since the last factor update, the system should drop the four oldest weeks from the existing database 34 when appending the four new weeks.
- the received updates to reference data 35 and/or data sources 38are stored in database 34 (stage 174 ).
- the systemdetermines that data adjustments should be made to correct bias (decision point 175 ).
- Application business logic 33ensures reference data 35 and data sources 38 are up to date, and if not, updates them accordingly (stage 176 ).
- reference data 35is reviewed to ensure that the default attributes for the current category will be appropriate for the client or scenario, and adjustments are made to reference data 35 as appropriate (stage 177 ).
- attribute segmentsmay be reviewed and translated to more succinct segmentations that better classify the product identifiers. Other variations are also possible.
- a product-identifier-to-attribute-segment mappingis prepared for the product identifiers (e.g. UPC's) (stage 178 ). If the attributes are determined to be irrelevant, they can be removed from further consideration in this process.
- the attribute table 36 bis a reference table that maps each product identifier 36 a to a set of attribute variables. While UPC's are described as a common product identifier, other identifiers could also be used. For example, not every dataset has a UPC, but may have a product identifier at a higher, lower, or equivalent level. Rules are used to determine supportable attribute segments and relevant attributes.
- the UPCis assigned to a new segment “not supportable.” All segments with less than a 5% share are assigned to “not supportable.” Furthermore, in one embodiment, if the final “not supportable” category accounts for >50% of the category share, then the attribute is designated as “irrelevant.” Other ways for determining relevance can also be used, or relevance can simply be ignored. Stage 178 can be repeated to arrive at the final level of segments to use (rolled-up or drilled-down) as appropriate.
- source (e.g. POS) and target (e.g. panel) data 38are retrieved from database 34 and summarized by attribute segments (stage 180 ).
- Factorsare calculated for attribute segments (stage 181 ).
- the significance of the attribute segmentsis determined (stage 182 ). If any non-significant factors are determined, the significant attribute factors can be re-aligned (stage 183 ).
- the factors for each attribute segmentare applied to the target (panel) data to correct bias (stage 184 ).
- the factorsare also applied to the target (panel) data to correct data that is incomplete (e.g. less available) (stage 186 ).
- the competitive and/or complementary data fusion stepscan be repeated as desired or appropriate (stage 187 ).
- FIGS. 6-10illustrate the competitive and complementary fusion stages in further detail.
- FIGS. 6A-6Care first, second, and third parts of a process flow diagram for the system of FIG. 1 demonstrating a preferred process for iteratively calculating and applying factors in competitive fusion.
- procedure 200is at least partially implemented in the operating logic of system 20 .
- Procedure 200begins on FIG. 6A with summing source (POS) data by the most granular product and time dimension (e.g. UPC) (stage 202 ) and summing target (panel) data by the most granular product and time dimension (e.g. UPC) (stage 204 ). In one embodiment, they are both summed to weekly (e.g. 52) totals.
- POSsumming source
- UPCtime dimension
- panelpanel
- weeklye.g. 52
- Business logic server 24determines the period of time to use in the analysis (stage 206 ), such as to use all of the weekly totals summed in the prior step or to use only part of the weekly totals that cover a desired time period, such as the most recent 13 weeks, to name a few examples.
- Outliersare also eliminated (stage 207 ) at this point or another appropriate point before final calculations. For example, in one embodiment, although thirteen weeks are contained in the dataset, only 11 weeks are actually used in calculations. Research indicates that panel volume is extremely vulnerable to outliers. To minimize the potential impact of outliers, the week with the lowest coverage and the week with the highest coverage are eliminated from further use in calculations for the current update.
- Business logic server 24then merges the source (POS) data, target (panel) data, and product identifier to attribute segment mapping reference data (stage 208 ). Attributes can optionally be sorted in order by importance (stage 210 ). In one embodiment, the least important is first and the most important is last. If factors for the most important attribute segments are the last ones applied, it usually has the most significant mathematical effect because no lesser important attribute segment factor will be applied after that last calculation to further skew the results.
- An initial factor of 1.0is assigned to all attribute segment (stage 212 ).
- source (POS) and target (panel) dataare then summarized for the segments of the current attribute (stage 214 ).
- a factoris calculated for each attribute segment of the current attribute as source data volume divided by target data volume (stage 216 ). Other mathematical variations could also be used.
- For each segment of the current attributedetermine whether the attribute segment is significant (stage 218 ). In one embodiment, shares are calculated for the attribute segments, such as by dividing the Calculation Period Segment Total U.S. POS volume by the Calculation Period Category Total U.S. POS volume.
- Significanceis then determined by first analyzing a confidence interval (CI) for each share to determine if there is overlap between the POS share CI and the panel share CI. If there is overlap, then the difference between source and target shares is not significant and the attribute segment will be designated as “nonsignificant.” Other ways for determining significance can also be used, or significance can be assumed.
- CIconfidence interval
- each volumeis multiplied by the factor for the corresponding segment (stage 224 ). Again, other mathematical variations could also be used.
- the factors for each attribute segmentare then saved to factor data store 39 of database 34 (stage 226 ). If another attribute is present (decision point 228 ), the next attribute is made the current attribute (stage 230 ) and stages 214 - 226 are repeated. These stages are repeated until all attributes are processed. Continuing with FIG.
- a category adjustment factoris applied to all product identifiers as necessary (stage 232 ) to adjust for the level of coverage.
- the use of a category adjustment factordepends on the type of measure being used. For example, where volume is used, coverage adjustments may not be necessary, but where shares are used, further coverage adjustments may be necessary. Any final factors for the category adjustment factor are saved to the factor data store 39 of database 34 (stage 234 ). The process 200 then ends at stage 236 .
- FIGS. 7 A-&Care first, second, and third parts of a process flow diagram for the system of FIG. 1 demonstrating an alternate process for calculating and applying factors in competitive fusion.
- procedure 250is at least partially implemented in the operating logic of system 20 .
- Procedure 250begins on FIG. 7A with summing the more reliable (source) data source (e.g., POS data) by the most granular product and time dimension (e.g. UPC) (stage 252 ) and summing the less accurate (target) data source (e.g., panel data) by the most granular product and time dimension (stage 254 ).
- sourcesource
- target data sourcee.g., panel data
- Business logic server 24determines the period of time to use in the analysis (stage 256 ) and eliminates outliers (stage 257 ), as discussed in FIG. 6 .
- Source data, target data, and product identifiers to attribute segment mapping dataare merged (stage 258 ).
- An initial factor of 1.0is assigned to each attribute segment (stage 260 ).
- Source and target dataare summarized to the segments for all attributes (stage 262 ).
- each attribute segmentis calculated for each attribute segment as source volume divided by target volume (stage 264 ).
- Business logic server 24determines whether the attribute segment is significant (stage 266 ), as described in FIG. 6 . Where two or more segments for any particular attribute are insignificant (decision point 268 ), then the significant factors are re-aligned to account for the elimination of the insignificant segment factors in the particular attribute (stage 270 ).
- each volumeis multiplied by the factor for each corresponding segment (stage 272 ). In other words, all of the factors applicable to the volume are applied simultaneously, as opposed to iteratively as shown in FIG. 6 .
- the factorsare then saved to factor data store 39 for each attribute segment (stage 274 ).
- a category adjustment factoris applied to all product identifiers as necessary (stage 276 ), as described in FIG. 6 .
- the final factors for the category adjustment factorare saved to the factor data store 39 of database 34 (stage 277 ).
- the procedure 250then ends at stage 278 .
- Procedure 250should only be used in the appropriate circumstances, such as when the attributes are not affected by each other and iteration is not needed for greater accuracy, to name one example. If attributes are affected by each other and procedure 250 is used instead of the iterative procedure of FIG. 6 , then the results will be mathematically different, with the procedure of FIG. 6 producing a more accurate result.
- FIG. 8is a process flow diagram for the system of FIG. 1 demonstrating the stages involved in performing complementary fusion.
- procedure 280is at least partially implemented in the operating logic of system 20 .
- Procedure 280begins with merging source data, target data, and product identifier data to attribute segment mapping data (stage 282 ).
- the factors previously calculated in accordance with FIG. 6 or FIG. 7are applied to the product identifier-level target data based on the attribute segment mapping to correct the data for incompleteness (e.g. less data than desired) (stage 286 ).
- the target data elements that are corrected in this processcan be the same, different, or overlapping from the target data that was used to help calculate the factors.
- the procedure 280then ends at stage 288 .
- FIG. 9is a process flow diagram for the system of FIG. 1 demonstrating the stages involved in performing repeating competitive and complementary fusion steps multiple times.
- procedure 290is at least partially implemented in the operating logic of system 20 .
- Procedure 290begins with determining what additional public or private data sources are available to use for competitive fusion along venue, time, and/or product dimensions (stage 292 ). Using one or more of those data sources, additional factors are calculated that are independent estimates against which the complementary-fused estimate may be competed (stage 294 ). The newly calculated factors are applied to the product identifier-level target data (e.g. POS data) to further adjust the data (stage 296 ).
- the competitive and complementary fusion stepscan be repeated as desired and/or appropriate (stage 298 ).
- the procedure 290then ends at stage 299 .
- FIG. 10is a process flow diagram for the system of FIG. 1 demonstrating the stages involved in calculating blended factors where multiple factor measures are available for the same factor.
- procedure 300is at least partially implemented in the operating logic of system 20 .
- Procedure 300can be used when competitive fusion is being performed and at least two data sources are available for the same factor (stage 302 ).
- Factors for each aggregation of the current data sourceare calculated by dividing source data volume by target data volume (stage 305 ).
- a blended factor(stage 308 ) where the more accurate source is given a higher weight and the less accurate source is given a lower weight.
- a blended factoruses an “inverse-variance-weighted” method (see 444 on FIG. 19 as an example).
- FIG. 11is a data table illustrating hypothetical data elements that are adjusted according to the preferred embodiment competitive fusion procedure of FIG. 6 .
- POS data 320 , panel data 322 , and attribute information 324are shown in a summarized form by UPC 326 . For each attribute and its corresponding segments, various steps are performed as discussed below.
- the datais assumed to be relevant and the POS and panel data shown in table 330 are then summarized for the segments of the current attribute (stage 214 ), which in the current iteration is manufacturer 332 .
- Private brand label summaries 334 and non-private brand label summaries 336 for POS 338 and panel data 340are calculated from table 330 as illustrated.
- a factor 342 for each attribute segment of the current attribute, in this case private label manufacturer 334 and non-private label manufacturer 336 segments,is calculated as POS volume 338 divided by panel volume 340 (stage 216 ).
- Business logic server 24determines whether the current attribute segment is significant (stage 218 ). For purposes of illustrating the current example, all attribute segments are also assumed significant.
- each panel volume 344is multiplied by the factor 342 for its corresponding segment (stage 224 ) to arrive at an adjusted panel value 346 .
- Factors 342are saved to the factor data store 39 of database 34 (stage 226 ).
- stages 214 to 226repeat for each attribute, with previously adjusted data being used in the calculation.
- FIG. 13illustrates data elements being adjusted according to factors calculated for a second attribute in accordance with the procedure of FIG. 6 .
- the POS and panel data shown in table 350are then summarized for the segments of the current attribute (stage 214 ), which in the current iteration is type 352 .
- Summaries for regular type 354 and special type 356 for POS 358 and panel data 360are calculated from table 350 as illustrated.
- a factor 362 for each attribute segment of the current attribute, in this case regular type 354 and special type 356 segments,is calculated as POS Volume 358 divided by panel volume 360 (stage 216 ).
- the previously adjusted panel volume 364is multiplied by the factor 362 for its corresponding segment (stage 224 ) to arrive at yet another adjusted panel value 366 .
- Factors 362are saved to the factor data store 39 of database 34 (stage 226 ).
- FIG. 14illustrates data elements being adjusted according to factors calculated for a third attribute in accordance with the procedure of FIG. 6 .
- the POS and panel data shown in table 370are then summarized for the segments of the current attribute (stage 214 ), which in the current iteration is size 372 .
- Summaries for size big 374 , size medium 375 , and size small 376 for POS 378 and panel data 380are calculated from table 370 as illustrated.
- a factor 382 for each attribute segment of the current attribute, in this case size big 374 , medium 375 , and small 376 segments,is calculated as POS Volume 378 divided by panel volume 380 (stage 216 ).
- each previously adjusted panel volume 384is multiplied by the factor 382 for its corresponding segment (stage 224 ) to arrive at yet another adjusted panel value 386 .
- Factors 382are saved to the factor data store 39 of database 34 (stage 226 ). After processing all attributes, the final factors are saved to the factor data store 39 of database 34 (stage 234 ). The process then ends at stage 236 .
- FIGS. 15 and 16illustrate data elements being adjusted according to factors calculated according to an alternative embodiment competitive fusion process in accordance with the procedure of FIG. 7 .
- Business logic server 24determines the period of time to use in the analysis (stage 256 ), and merges POS, panel, and attribute information by UPC as shown in table 390 (stage 258 ).
- POS data 392 and panel data 394are summarized for all attribute segments (stage 262 ), in this case by manufacturer 396 , type 398 , and size 400 .
- factors for each attribute segment 402are calculated as each respective POS volume 404 divided by each respective panel volume 406 (stage 264 ).
- Each panel volume 407is multiplied by the factors 408 a - 408 c appropriate for its corresponding segment (stage 272 ) to calculate an adjusted panel value 410 .
- the processends at stage 278 .
- FIG. 17is a data table illustrating hypothetical data elements by retailer that are stored in the database of FIG. 1 and used in accordance with the complementary fusion procedure of FIG. 8 .
- POS, panel and attribute informationare merged by UPC (stage 282 ) for multiple retailers, as shown in table 420 .
- Client shipment data 424is also merged by UPC.
- Sharesare calculated for POS data 420 a - 420 b and panel data 422 a - 422 c for the segments of each attribute (stage 284 ).
- the previously calculated factors 430 a - 430 c408 a - 408 c in FIG.
- stage 16are applied to the UPC level panel data 432 a - 432 c to further adjust the data to correct for incompleteness (stage 286 ) and arrive at an adjusted panel value 434 a - 434 c .
- the complementary fusion processthen ends at stage 288 .
- FIGS. 19 and 20illustrate performing another iteration of competitive fusion, including calculating blended factors, as described in the procedures of FIG. 9 and FIG. 10 .
- Additional public or private data sourcesare identified as available to use for competitive fusion (stage 292 ).
- channel specific totals 440 a - 440 f across attributeshave been identified for use in competitive fusion.
- client shipment total 440 e and panel total 440 fcan also be used for comparison.
- additional factors 442have been calculated that are independent estimates against which the complementary-fused data from FIG. 18 may be competed (stage 294 ).
- a blended factor 444has been calculated since multiple data sources were available for the same factor (stages 302 - 308 in FIG. 10 ). As shown in FIGS. 19 and 20 , each volume 446 a - 446 c of the previously adjusted UPC-level panel data is then multiplied by the blended factor to arrive at the newly adjusted panel values 450 a - 450 c (stage 298 in FIG. 9 , and stage 310 in FIG. 10 ).
- FIG. 21is a data table illustrating hypothetical table 460 of end results for POS data elements by retailers 2 and 3 , with a comparison to reality FIGS. 462 a - 462 b , pre-fusion FIGS. 464 a - 464 b , and post-fusion FIGS. 466 a - 466 b to show how the competitive and complementary fusion processes according to FIGS. 4-10 and illustrated in the hypothetical of FIGS. 11-20 helped improve the data accuracy.
- FIG. 22is a simulated screen of a user interface for one or more client workstations 30 that allows a user to view the multi-dimensional elements in the database, as described in the procedures of FIG. 4 and FIG. 5 .
- the updated datacan be used by various systems, users, and/or reports as appropriate.
- a methodcomprising identifying a plurality of data sources, wherein at least a first data source is more accurate than a second data source; identifying a plurality of overlapping attribute segments to use for comparing the data sources; calculating a factor as a function of each of the plurality of overlapping attribute segments; and using the factors to update a first group of values in the second data source to reduce bias.
- a methodcomprising receiving point-of-sale data and panel data on a periodic basis; identifying a plurality of product identifiers and a plurality of attributes to analyze; retrieving and summarizing the point-of-sale data and the panel data by the plurality of product identifiers, the plurality of attributes, and a plurality of corresponding attribute segments for a specified time period; calculating a factor for each attribute segment of a particular attribute; and applying the factors for the particular attribute segment to the panel data to correct panel bias.
- a methodcomprising receiving point-of-sale data and panel data on a periodic basis; identifying a plurality of product identifiers and a plurality of attributes to analyze; retrieving and summarizing the point-of-sale data and the panel data by the plurality of product identifiers, the plurality of attributes, and a plurality of corresponding attribute segments for a specified time period; calculating a plurality of factors, wherein one factor is calculated for each attribute segment of the plurality of attributes; and applying the factors to the second data source to reduce bias; and applying the factors to the second data source to reduce incompleteness.
- a methodcomprising identifying a plurality of product identifiers and a plurality of attributes to analyze for at least two data sources, wherein at least a first data source is more accurate than a second data source; retrieving and summarizing the first data source and the second data source by the plurality of product identifiers, the plurality of attributes, and a plurality of corresponding attribute segments for a specified time period; calculating a plurality of factors, wherein one factor is calculated for each attribute segment of the plurality of attributes; applying the factors to the second data source to reduce bias; and applying the factors to a different or overlapping dataset of the second data source to reduce incompleteness.
- a systemcomprising one or more servers being operable to store retail data from at least two data sources, store product identifier and attribute categorizations, and store a plurality of factor calculations; wherein the at least two data sources includes a first data source that is more accurate than a second data source; and wherein one or more of said servers contains business logic that is operable to identify and retrieve a plurality of overlapping attribute segments to use for comparing the at least two data sources, compare each of the overlapping attribute segments, calculate a factor for each of the overlapping attribute segments, and use the factors to update a first group of values in the second data source to reduce bias.
- an apparatuscomprises a device encoded with logic executable by one or more processors to: identify and retrieve a plurality of overlapping attribute segments to use for comparing at least two data sources, wherein the at least two data sources includes a first data source that is more accurate than a second data source, compare each of the overlapping attribute segments, calculate a factor for each of the overlapping attribute segments, and use the factors to update a first group of values in the second data source to reduce bias.
Landscapes
- Business, Economics & Management (AREA)
- Engineering & Computer Science (AREA)
- Strategic Management (AREA)
- Development Economics (AREA)
- Entrepreneurship & Innovation (AREA)
- Accounting & Taxation (AREA)
- Finance (AREA)
- Human Resources & Organizations (AREA)
- Economics (AREA)
- Theoretical Computer Science (AREA)
- Marketing (AREA)
- Physics & Mathematics (AREA)
- General Business, Economics & Management (AREA)
- General Physics & Mathematics (AREA)
- Game Theory and Decision Science (AREA)
- Educational Administration (AREA)
- Data Mining & Analysis (AREA)
- Operations Research (AREA)
- Quality & Reliability (AREA)
- Tourism & Hospitality (AREA)
- Information Retrieval, Db Structures And Fs Structures Therefor (AREA)
- Management, Administration, Business Operations System, And Electronic Commerce (AREA)
Abstract
Description
- Recruitment bias—in which households recruited to participate in the panel are not representative of the target population (e.g., the overall population of the United States);
- Self-selection bias—in which households who choose to participate in the panel have slightly different buying habits than the average household (e.g., an orientation toward using promotions or adopting new products);
- Panelist turnover bias—in which the reporting effectiveness (accuracy and consistency) of panelists may vary over the time period in which they participate in the panel;
- Hereditary bias—in which individuals within a household share a tendency toward certain behaviors or medical conditions;
- Compliance bias—in which certain purchases or purchase occasions are consistently underreported by panelists;
- Item placement bias—in which panelists report products purchased that have not been accurately captured and/or classified in the hierarchy maintained by the data collector; and
- Projection bias—in which the weighting or projection system cannot fully adjust all geo-demographics or is stressed by over- or under-sampled segments of the target population.
- Publicly available data about the incomplete channel (e.g., channel reports, reported sales and financials, store databases, geo-demographics, etc.) may be used to develop an independent venue (channel) estimate.
- Publicly available data about the category of interest (e.g., category studies, industry reports, reported sales/financials, etc.) may be used to develop an independent category estimate.
- Private data from manufacturer-partners (e.g., shipment data, delivery data, retailer-supplied data, etc.) may be used to develop independent channel and category estimates. Due to the potentially sensitive nature of some of these data sources, this competitive fusion may be performed inside a manufacturer's facility—as an auxiliary input to the baseline model.
- Private data from retailer-partners within a Collaborative Retail Exchange may be used in some venues to develop independent channel and category estimates.
Claims (33)
Priority Applications (30)
| Application Number | Priority Date | Filing Date | Title |
|---|---|---|---|
| US10/783,323US7873529B2 (en) | 2004-02-20 | 2004-02-20 | System and method for analyzing and correcting retail data |
| PCT/US2005/005297WO2005081876A2 (en) | 2004-02-20 | 2005-02-22 | System and method for analyzing and correcting retail data |
| EP05713819AEP1723588A4 (en) | 2004-02-20 | 2005-02-22 | System and method for analyzing and correcting retail data |
| US11/926,309US20080162571A1 (en) | 2004-02-20 | 2007-10-29 | System and method for analyzing and correcting retail data |
| US11/926,316US20080147459A1 (en) | 2004-02-20 | 2007-10-29 | System and method for analyzing and correcting retail data |
| US11/926,351US20080162404A1 (en) | 2004-02-20 | 2007-10-29 | System and method for analyzing and correcting retail data |
| US11/926,318US20080143474A1 (en) | 2004-02-20 | 2007-10-29 | System and method for analyzing and correcting retail data |
| US11/926,308US20080162460A1 (en) | 2004-02-20 | 2007-10-29 | System and method for analyzing and correcting retail data |
| US11/926,374US20080136583A1 (en) | 2004-02-20 | 2007-10-29 | System and method for analyzing and correcting retail data |
| US11/926,347US20080162462A1 (en) | 2004-02-20 | 2007-10-29 | System and method for analyzing and correcting retail data |
| US11/926,360US20080162464A1 (en) | 2004-02-20 | 2007-10-29 | System and method for analyzing and correcting retail data |
| US11/926,358US20080162463A1 (en) | 2004-02-20 | 2007-10-29 | System and method for analyzing and correcting retail data |
| US11/926,332US20080136582A1 (en) | 2004-02-20 | 2007-10-29 | System and method for analyzing and correcting retail data |
| US11/926,329US20080256027A1 (en) | 2004-02-20 | 2007-10-29 | System and method for analyzing and correcting retail data |
| US11/927,565US20080168028A1 (en) | 2004-02-20 | 2007-10-29 | System and method for analyzing and correcting retail data |
| US11/926,366US20080140480A1 (en) | 2004-02-20 | 2007-10-29 | System and method for analyzing and correcting retail data |
| US11/926,354US20080162223A1 (en) | 2004-02-20 | 2007-10-29 | System and method for analyzing and correcting retail data |
| US11/926,372US20080162466A1 (en) | 2004-02-20 | 2007-10-29 | System and method for analyzing and correcting retail data |
| US11/926,320US20080154843A1 (en) | 2004-02-20 | 2007-10-29 | System and method for analyzing and correcting retail data |
| US11/927,515US20080256028A1 (en) | 2004-02-20 | 2007-10-29 | System and method for analyzing and correcting retail data |
| US11/926,383US20080154885A1 (en) | 2004-02-20 | 2007-10-29 | System and method for analyzing and correcting retail data |
| US11/926,381US20080154884A1 (en) | 2004-02-20 | 2007-10-29 | System and method for analyzing and correcting retail data |
| US11/927,502US20080147699A1 (en) | 2004-02-20 | 2007-10-29 | System and method for analyzing and correcting retail data |
| US11/926,368US20080162465A1 (en) | 2004-02-20 | 2007-10-29 | System and method for analyzing and correcting retail data |
| US11/926,335US20080162461A1 (en) | 2004-02-20 | 2007-10-29 | System and method for analyzing and correcting retail data |
| US11/926,343US20080162572A1 (en) | 2004-02-20 | 2007-10-29 | System and method for analyzing and correcting retail data |
| US11/927,550US20080168027A1 (en) | 2004-02-20 | 2007-10-29 | System and method for analyzing and correcting retail data |
| US12/021,227US10325272B2 (en) | 2004-02-20 | 2008-01-28 | Bias reduction using data fusion of household panel data and transaction data |
| US12/021,916US20080288889A1 (en) | 2004-02-20 | 2008-01-29 | Data visualization application |
| US12/021,495US7949639B2 (en) | 2004-02-20 | 2008-01-29 | Attribute segments and data table bias reduction |
Applications Claiming Priority (1)
| Application Number | Priority Date | Filing Date | Title |
|---|---|---|---|
| US10/783,323US7873529B2 (en) | 2004-02-20 | 2004-02-20 | System and method for analyzing and correcting retail data |
Related Parent Applications (2)
| Application Number | Title | Priority Date | Filing Date |
|---|---|---|---|
| US88679807PContinuation | 2004-02-20 | 2007-01-26 | |
| US12/021,263Continuation-In-PartUS20090006156A1 (en) | 2004-02-20 | 2008-01-28 | Associating a granting matrix with an analytic platform |
Related Child Applications (28)
| Application Number | Title | Priority Date | Filing Date |
|---|---|---|---|
| US11/926,368ContinuationUS20080162465A1 (en) | 2004-02-20 | 2007-10-29 | System and method for analyzing and correcting retail data |
| US11/926,381ContinuationUS20080154884A1 (en) | 2004-02-20 | 2007-10-29 | System and method for analyzing and correcting retail data |
| US11/926,309ContinuationUS20080162571A1 (en) | 2004-02-20 | 2007-10-29 | System and method for analyzing and correcting retail data |
| US11/927,550Continuation-In-PartUS20080168027A1 (en) | 2004-02-20 | 2007-10-29 | System and method for analyzing and correcting retail data |
| US11/926,318ContinuationUS20080143474A1 (en) | 2004-02-20 | 2007-10-29 | System and method for analyzing and correcting retail data |
| US11/926,316ContinuationUS20080147459A1 (en) | 2004-02-20 | 2007-10-29 | System and method for analyzing and correcting retail data |
| US11/926,329ContinuationUS20080256027A1 (en) | 2004-02-20 | 2007-10-29 | System and method for analyzing and correcting retail data |
| US11/926,383ContinuationUS20080154885A1 (en) | 2004-02-20 | 2007-10-29 | System and method for analyzing and correcting retail data |
| US11/926,320ContinuationUS20080154843A1 (en) | 2004-02-20 | 2007-10-29 | System and method for analyzing and correcting retail data |
| US11/926,343ContinuationUS20080162572A1 (en) | 2004-02-20 | 2007-10-29 | System and method for analyzing and correcting retail data |
| US11/926,354ContinuationUS20080162223A1 (en) | 2004-02-20 | 2007-10-29 | System and method for analyzing and correcting retail data |
| US11/926,366ContinuationUS20080140480A1 (en) | 2004-02-20 | 2007-10-29 | System and method for analyzing and correcting retail data |
| US11/926,335ContinuationUS20080162461A1 (en) | 2004-02-20 | 2007-10-29 | System and method for analyzing and correcting retail data |
| US11/926,351ContinuationUS20080162404A1 (en) | 2004-02-20 | 2007-10-29 | System and method for analyzing and correcting retail data |
| US11/927,515Continuation-In-PartUS20080256028A1 (en) | 2004-02-20 | 2007-10-29 | System and method for analyzing and correcting retail data |
| US11/926,374ContinuationUS20080136583A1 (en) | 2004-02-20 | 2007-10-29 | System and method for analyzing and correcting retail data |
| US11/927,565Continuation-In-PartUS20080168028A1 (en) | 2004-02-20 | 2007-10-29 | System and method for analyzing and correcting retail data |
| US11/926,347ContinuationUS20080162462A1 (en) | 2004-02-20 | 2007-10-29 | System and method for analyzing and correcting retail data |
| US11/926,360ContinuationUS20080162464A1 (en) | 2004-02-20 | 2007-10-29 | System and method for analyzing and correcting retail data |
| US11/926,332ContinuationUS20080136582A1 (en) | 2004-02-20 | 2007-10-29 | System and method for analyzing and correcting retail data |
| US11/927,502Continuation-In-PartUS20080147699A1 (en) | 2004-02-20 | 2007-10-29 | System and method for analyzing and correcting retail data |
| US11/926,308ContinuationUS20080162460A1 (en) | 2004-02-20 | 2007-10-29 | System and method for analyzing and correcting retail data |
| US11/926,358ContinuationUS20080162463A1 (en) | 2004-02-20 | 2007-10-29 | System and method for analyzing and correcting retail data |
| US11/926,372ContinuationUS20080162466A1 (en) | 2004-02-20 | 2007-10-29 | System and method for analyzing and correcting retail data |
| US12/021,227Continuation-In-PartUS10325272B2 (en) | 2004-02-20 | 2008-01-28 | Bias reduction using data fusion of household panel data and transaction data |
| US12/021,263Continuation-In-PartUS20090006156A1 (en) | 2004-02-20 | 2008-01-28 | Associating a granting matrix with an analytic platform |
| US12/021,916Continuation-In-PartUS20080288889A1 (en) | 2004-02-20 | 2008-01-29 | Data visualization application |
| US12/021,495Continuation-In-PartUS7949639B2 (en) | 2004-02-20 | 2008-01-29 | Attribute segments and data table bias reduction |
Publications (2)
| Publication Number | Publication Date |
|---|---|
| US20050187972A1 US20050187972A1 (en) | 2005-08-25 |
| US7873529B2true US7873529B2 (en) | 2011-01-18 |
Family
ID=34861204
Family Applications (21)
| Application Number | Title | Priority Date | Filing Date |
|---|---|---|---|
| US10/783,323Active2027-11-12US7873529B2 (en) | 2004-02-20 | 2004-02-20 | System and method for analyzing and correcting retail data |
| US11/926,316AbandonedUS20080147459A1 (en) | 2004-02-20 | 2007-10-29 | System and method for analyzing and correcting retail data |
| US11/926,320AbandonedUS20080154843A1 (en) | 2004-02-20 | 2007-10-29 | System and method for analyzing and correcting retail data |
| US11/926,368AbandonedUS20080162465A1 (en) | 2004-02-20 | 2007-10-29 | System and method for analyzing and correcting retail data |
| US11/926,383AbandonedUS20080154885A1 (en) | 2004-02-20 | 2007-10-29 | System and method for analyzing and correcting retail data |
| US11/926,308AbandonedUS20080162460A1 (en) | 2004-02-20 | 2007-10-29 | System and method for analyzing and correcting retail data |
| US11/926,309AbandonedUS20080162571A1 (en) | 2004-02-20 | 2007-10-29 | System and method for analyzing and correcting retail data |
| US11/926,372AbandonedUS20080162466A1 (en) | 2004-02-20 | 2007-10-29 | System and method for analyzing and correcting retail data |
| US11/926,347AbandonedUS20080162462A1 (en) | 2004-02-20 | 2007-10-29 | System and method for analyzing and correcting retail data |
| US11/926,332AbandonedUS20080136582A1 (en) | 2004-02-20 | 2007-10-29 | System and method for analyzing and correcting retail data |
| US11/926,374AbandonedUS20080136583A1 (en) | 2004-02-20 | 2007-10-29 | System and method for analyzing and correcting retail data |
| US11/926,366AbandonedUS20080140480A1 (en) | 2004-02-20 | 2007-10-29 | System and method for analyzing and correcting retail data |
| US11/926,335AbandonedUS20080162461A1 (en) | 2004-02-20 | 2007-10-29 | System and method for analyzing and correcting retail data |
| US11/926,343AbandonedUS20080162572A1 (en) | 2004-02-20 | 2007-10-29 | System and method for analyzing and correcting retail data |
| US11/926,351AbandonedUS20080162404A1 (en) | 2004-02-20 | 2007-10-29 | System and method for analyzing and correcting retail data |
| US11/926,354AbandonedUS20080162223A1 (en) | 2004-02-20 | 2007-10-29 | System and method for analyzing and correcting retail data |
| US11/926,358AbandonedUS20080162463A1 (en) | 2004-02-20 | 2007-10-29 | System and method for analyzing and correcting retail data |
| US11/926,329AbandonedUS20080256027A1 (en) | 2004-02-20 | 2007-10-29 | System and method for analyzing and correcting retail data |
| US11/926,381AbandonedUS20080154884A1 (en) | 2004-02-20 | 2007-10-29 | System and method for analyzing and correcting retail data |
| US11/926,360AbandonedUS20080162464A1 (en) | 2004-02-20 | 2007-10-29 | System and method for analyzing and correcting retail data |
| US11/926,318AbandonedUS20080143474A1 (en) | 2004-02-20 | 2007-10-29 | System and method for analyzing and correcting retail data |
Family Applications After (20)
| Application Number | Title | Priority Date | Filing Date |
|---|---|---|---|
| US11/926,316AbandonedUS20080147459A1 (en) | 2004-02-20 | 2007-10-29 | System and method for analyzing and correcting retail data |
| US11/926,320AbandonedUS20080154843A1 (en) | 2004-02-20 | 2007-10-29 | System and method for analyzing and correcting retail data |
| US11/926,368AbandonedUS20080162465A1 (en) | 2004-02-20 | 2007-10-29 | System and method for analyzing and correcting retail data |
| US11/926,383AbandonedUS20080154885A1 (en) | 2004-02-20 | 2007-10-29 | System and method for analyzing and correcting retail data |
| US11/926,308AbandonedUS20080162460A1 (en) | 2004-02-20 | 2007-10-29 | System and method for analyzing and correcting retail data |
| US11/926,309AbandonedUS20080162571A1 (en) | 2004-02-20 | 2007-10-29 | System and method for analyzing and correcting retail data |
| US11/926,372AbandonedUS20080162466A1 (en) | 2004-02-20 | 2007-10-29 | System and method for analyzing and correcting retail data |
| US11/926,347AbandonedUS20080162462A1 (en) | 2004-02-20 | 2007-10-29 | System and method for analyzing and correcting retail data |
| US11/926,332AbandonedUS20080136582A1 (en) | 2004-02-20 | 2007-10-29 | System and method for analyzing and correcting retail data |
| US11/926,374AbandonedUS20080136583A1 (en) | 2004-02-20 | 2007-10-29 | System and method for analyzing and correcting retail data |
| US11/926,366AbandonedUS20080140480A1 (en) | 2004-02-20 | 2007-10-29 | System and method for analyzing and correcting retail data |
| US11/926,335AbandonedUS20080162461A1 (en) | 2004-02-20 | 2007-10-29 | System and method for analyzing and correcting retail data |
| US11/926,343AbandonedUS20080162572A1 (en) | 2004-02-20 | 2007-10-29 | System and method for analyzing and correcting retail data |
| US11/926,351AbandonedUS20080162404A1 (en) | 2004-02-20 | 2007-10-29 | System and method for analyzing and correcting retail data |
| US11/926,354AbandonedUS20080162223A1 (en) | 2004-02-20 | 2007-10-29 | System and method for analyzing and correcting retail data |
| US11/926,358AbandonedUS20080162463A1 (en) | 2004-02-20 | 2007-10-29 | System and method for analyzing and correcting retail data |
| US11/926,329AbandonedUS20080256027A1 (en) | 2004-02-20 | 2007-10-29 | System and method for analyzing and correcting retail data |
| US11/926,381AbandonedUS20080154884A1 (en) | 2004-02-20 | 2007-10-29 | System and method for analyzing and correcting retail data |
| US11/926,360AbandonedUS20080162464A1 (en) | 2004-02-20 | 2007-10-29 | System and method for analyzing and correcting retail data |
| US11/926,318AbandonedUS20080143474A1 (en) | 2004-02-20 | 2007-10-29 | System and method for analyzing and correcting retail data |
Country Status (3)
| Country | Link |
|---|---|
| US (21) | US7873529B2 (en) |
| EP (1) | EP1723588A4 (en) |
| WO (1) | WO2005081876A2 (en) |
Cited By (20)
| Publication number | Priority date | Publication date | Assignee | Title |
|---|---|---|---|---|
| US20080005155A1 (en)* | 2006-04-11 | 2008-01-03 | University Of Southern California | System and Method for Generating a Service Oriented Data Composition Architecture for Integrated Asset Management |
| US20080288889A1 (en)* | 2004-02-20 | 2008-11-20 | Herbert Dennis Hunt | Data visualization application |
| US20080319829A1 (en)* | 2004-02-20 | 2008-12-25 | Herbert Dennis Hunt | Bias reduction using data fusion of household panel data and transaction data |
| US20130111005A1 (en)* | 2011-10-26 | 2013-05-02 | Yahoo!, Inc. | Online Active Learning in User-Generated Content Streams |
| US8543523B1 (en) | 2012-06-01 | 2013-09-24 | Rentrak Corporation | Systems and methods for calibrating user and consumer data |
| US20140089051A1 (en)* | 2012-09-25 | 2014-03-27 | Frank Piotrowski | Methods and apparatus to align panelist data with retailer sales data |
| US8719266B2 (en) | 2007-01-26 | 2014-05-06 | Information Resources, Inc. | Data perturbation of non-unique values |
| US9784774B2 (en) | 2014-01-06 | 2017-10-10 | The Nielsen Company (Us), Llc | Methods and apparatus to determine an operational status of a device |
| US20180276726A1 (en)* | 2017-03-23 | 2018-09-27 | Wal-Mart Stores, Inc. | Systems and methods for correcting incorrect product information in an electronic data catalog |
| US10262331B1 (en) | 2016-01-29 | 2019-04-16 | Videomining Corporation | Cross-channel in-store shopper behavior analysis |
| US10354262B1 (en) | 2016-06-02 | 2019-07-16 | Videomining Corporation | Brand-switching analysis using longitudinal tracking of at-shelf shopper behavior |
| US10373099B1 (en)* | 2015-12-18 | 2019-08-06 | Palantir Technologies Inc. | Misalignment detection system for efficiently processing database-stored data and automatically generating misalignment information for display in interactive user interfaces |
| US10387896B1 (en) | 2016-04-27 | 2019-08-20 | Videomining Corporation | At-shelf brand strength tracking and decision analytics |
| US10776728B1 (en) | 2016-06-07 | 2020-09-15 | The Nielsen Company (Us), Llc | Methods, systems and apparatus for calibrating data using relaxed benchmark constraints |
| US10963893B1 (en) | 2016-02-23 | 2021-03-30 | Videomining Corporation | Personalized decision tree based on in-store behavior analysis |
| US11205214B2 (en) | 2019-07-29 | 2021-12-21 | Luke MARIETTA | Method and system for automatically replenishing consumable items |
| US11354683B1 (en) | 2015-12-30 | 2022-06-07 | Videomining Corporation | Method and system for creating anonymous shopper panel using multi-modal sensor fusion |
| US11449880B2 (en) | 2018-11-01 | 2022-09-20 | Nielsen Consumer Llc | Methods, systems, apparatus and articles of manufacture to model eCommerce sales |
| US11544653B2 (en)* | 2019-06-24 | 2023-01-03 | Overstock.Com, Inc. | System and method for improving product catalog representations based on product catalog adherence scores |
| US20230260002A1 (en)* | 2022-02-14 | 2023-08-17 | Target Brands, Inc. | Systems and methods for determining item quality index scores in an online retail environment |
Families Citing this family (38)
| Publication number | Priority date | Publication date | Assignee | Title |
|---|---|---|---|---|
| US8238696B2 (en) | 2003-08-21 | 2012-08-07 | Microsoft Corporation | Systems and methods for the implementation of a digital images schema for organizing units of information manageable by a hardware/software interface system |
| US8166101B2 (en) | 2003-08-21 | 2012-04-24 | Microsoft Corporation | Systems and methods for the implementation of a synchronization schemas for units of information manageable by a hardware/software interface system |
| US7873529B2 (en) | 2004-02-20 | 2011-01-18 | Symphonyiri Group, Inc. | System and method for analyzing and correcting retail data |
| US20080162213A1 (en)* | 2004-06-14 | 2008-07-03 | Clayton James D | Decision object for associating a plurality of business plans |
| CA2532374A1 (en)* | 2005-01-07 | 2006-07-07 | Masco Corporation Of Indiana | Style trend tracking tool |
| US20060173864A1 (en)* | 2005-01-28 | 2006-08-03 | Microsoft Corporation | Systems and methods for reconciling image metadata |
| US9069436B1 (en)* | 2005-04-01 | 2015-06-30 | Intralinks, Inc. | System and method for information delivery based on at least one self-declared user attribute |
| US7996256B1 (en) | 2006-09-08 | 2011-08-09 | The Procter & Gamble Company | Predicting shopper traffic at a retail store |
| US8676745B2 (en) | 2006-12-29 | 2014-03-18 | Accenture Global Services Limited | Integrated number management module and service order system |
| EP2168089A4 (en)* | 2007-06-14 | 2020-09-09 | The Nielsen Company (US), LLC | METHODS AND DEVICES FOR WEIGHTING INCOMPLETE RELEVANT DATA |
| US8909632B2 (en)* | 2007-10-17 | 2014-12-09 | International Business Machines Corporation | System and method for maintaining persistent links to information on the Internet |
| US8655708B2 (en)* | 2008-12-19 | 2014-02-18 | The Toronto Dominion Bank | Systems and methods for generating and using trade areas associated with business branches based on correlated demographics |
| US9292485B2 (en) | 2009-05-29 | 2016-03-22 | Red Hat, Inc. | Extracting data cell transformable to model object |
| US9292592B2 (en)* | 2009-05-29 | 2016-03-22 | Red Hat, Inc. | Object-based modeling using composite model object having independently updatable component objects |
| US8838469B2 (en)* | 2009-06-12 | 2014-09-16 | Accenture Global Services Limited | System and method for optimizing display space allocation of merchandising using regression analysis to generate space elasticity curves |
| US8122038B2 (en)* | 2009-06-15 | 2012-02-21 | Microsoft Corporation | Period to date functions for time intelligence functionality |
| US20110106808A1 (en)* | 2009-10-30 | 2011-05-05 | Salesforce.Com, Inc. | Multi-dimensional content organization and delivery |
| US20120209697A1 (en)* | 2010-10-14 | 2012-08-16 | Joe Agresti | Bias Reduction in Internet Measurement of Ad Noting and Recognition |
| US8447721B2 (en)* | 2011-07-07 | 2013-05-21 | Platfora, Inc. | Interest-driven business intelligence systems and methods of data analysis using interest-driven data pipelines |
| US9251037B2 (en) | 2011-11-04 | 2016-02-02 | Hewlett Packard Enterprise Development Lp | Providing elastic insight to information technology performance data |
| US9251360B2 (en) | 2012-04-27 | 2016-02-02 | Intralinks, Inc. | Computerized method and system for managing secure mobile device content viewing in a networked secure collaborative exchange environment |
| US9253176B2 (en) | 2012-04-27 | 2016-02-02 | Intralinks, Inc. | Computerized method and system for managing secure content sharing in a networked secure collaborative exchange environment |
| US9553860B2 (en) | 2012-04-27 | 2017-01-24 | Intralinks, Inc. | Email effectivity facility in a networked secure collaborative exchange environment |
| CA2871600A1 (en) | 2012-04-27 | 2013-10-31 | Intralinks, Inc. | Computerized method and system for managing networked secure collaborative exchange |
| US10445777B2 (en) | 2013-10-29 | 2019-10-15 | Verizon Patent And Licensing Inc. | Methods and systems for delivering electronic content to users in population based geographic zones |
| EP3069462A4 (en) | 2013-11-14 | 2017-05-03 | Intralinks, Inc. | Litigation support in cloud-hosted file sharing and collaboration |
| GB2530685A (en) | 2014-04-23 | 2016-03-30 | Intralinks Inc | Systems and methods of secure data exchange |
| US10255345B2 (en)* | 2014-10-09 | 2019-04-09 | Business Objects Software Ltd. | Multivariate insight discovery approach |
| US10740774B2 (en)* | 2015-07-15 | 2020-08-11 | The Nielsen Company (Us), Llc | Reducing processing requirements to correct for bias in ratings data having interdependencies among demographic statistics |
| US10033702B2 (en) | 2015-08-05 | 2018-07-24 | Intralinks, Inc. | Systems and methods of secure data exchange |
| CA3007479A1 (en)* | 2015-12-18 | 2017-06-22 | Walmart Apollo, Llc | Systems and methods for resolving data discrepancy |
| US10776740B2 (en)* | 2016-06-07 | 2020-09-15 | International Business Machines Corporation | Detecting potential root causes of data quality issues using data lineage graphs |
| CN107358035A (en)* | 2017-06-28 | 2017-11-17 | 广东技术师范学院 | A kind of portable medical data digging system |
| US11810015B2 (en) | 2019-04-22 | 2023-11-07 | Walmart Apollo, Llc | Forecasting system |
| US11537961B2 (en)* | 2019-04-22 | 2022-12-27 | Walmart Apollo, Llc | Forecasting system |
| CN112667699A (en)* | 2019-10-15 | 2021-04-16 | 深圳海知科技有限公司 | Intelligent security comparison method and system based on individual, group and overall multilevel |
| CN112132705B (en)* | 2020-09-30 | 2023-07-11 | 国网智能科技股份有限公司 | A method and system for storing and reproducing substation panorama data |
| WO2024249536A2 (en)* | 2023-05-29 | 2024-12-05 | Cotton Council International | Cotton spinning mill performance and optimization system |
Citations (32)
| Publication number | Priority date | Publication date | Assignee | Title |
|---|---|---|---|---|
| US5041972A (en) | 1988-04-15 | 1991-08-20 | Frost W Alan | Method of measuring and evaluating consumer response for the development of consumer products |
| US5758257A (en) | 1994-11-29 | 1998-05-26 | Herz; Frederick | System and method for scheduling broadcast of and access to video programs and other data using customer profiles |
| WO2001080137A2 (en) | 2000-04-17 | 2001-10-25 | Michael Von Gonten, Inc. | System and method for projecting market penetration |
| US6401070B1 (en)* | 1996-10-11 | 2002-06-04 | Freddie Mac | System and method for providing house price forecasts based on repeat sales model |
| US20020099597A1 (en) | 2000-12-27 | 2002-07-25 | Michael Gamage | Method for analyzing assortment of retail product |
| US20020169657A1 (en) | 2000-10-27 | 2002-11-14 | Manugistics, Inc. | Supply chain demand forecasting and planning |
| WO2003001428A2 (en) | 2001-05-04 | 2003-01-03 | Ims Health Incorporated | System and methods for estimating product sales in highly fragmented geographical segments of service provider location |
| US20030028417A1 (en) | 2001-05-02 | 2003-02-06 | Fox Edward J. | Method for evaluating retail locations |
| US20030046121A1 (en)* | 2001-03-23 | 2003-03-06 | Restaurant Services, Inc. ("RSI") | System, method and computer program product for normalizing data in a supply chain management framework |
| US20030046120A1 (en)* | 2001-03-23 | 2003-03-06 | Restaurant Services, Inc. | System, method and computer program product for evaluating the success of a promotion in a supply chain management framework |
| US20030083925A1 (en) | 2001-11-01 | 2003-05-01 | Weaver Chana L. | System and method for product category management analysis |
| US20030088474A1 (en) | 2001-03-23 | 2003-05-08 | Restaurant Services, Inc. ("RSI"). | System, method and computer program product for an electronics and appliances supply chain management framework |
| US20030171978A1 (en) | 2002-03-11 | 2003-09-11 | Jenkins Margalyn Toi | Efficient retail item assortment |
| US6636585B2 (en) | 2000-06-26 | 2003-10-21 | Bearingpoint, Inc. | Metrics-related testing of an operational support system (OSS) of an incumbent provider for compliance with a regulatory scheme |
| US6636862B2 (en) | 2000-07-05 | 2003-10-21 | Camo, Inc. | Method and system for the dynamic analysis of data |
| US20030200129A1 (en) | 2002-04-23 | 2003-10-23 | Kimberly-Clark Worldwide, Inc. | Method and system for allocating shelf space |
| US6662192B1 (en) | 2000-03-29 | 2003-12-09 | Bizrate.Com | System and method for data collection, evaluation, information generation, and presentation |
| US6839682B1 (en) | 1999-05-06 | 2005-01-04 | Fair Isaac Corporation | Predictive modeling of consumer financial behavior using supervised segmentation and nearest-neighbor matching |
| US20060020641A1 (en) | 2002-03-25 | 2006-01-26 | Data Quality Solutions | Business process management system and method |
| US7027843B2 (en)* | 2002-03-21 | 2006-04-11 | Lenovo (Singapore) Pte. Ltd. | Wireless device power optimization |
| US7379890B2 (en) | 2003-10-17 | 2008-05-27 | Makor Issues And Rights Ltd. | System and method for profit maximization in retail industry |
| US20080136582A1 (en) | 2004-02-20 | 2008-06-12 | Kruger Michael W | System and method for analyzing and correcting retail data |
| US20080147699A1 (en) | 2004-02-20 | 2008-06-19 | Kruger Michael W | System and method for analyzing and correcting retail data |
| US20080168104A1 (en) | 2004-06-22 | 2008-07-10 | Kruger Michael W | System and method for analyzing and correcting retail data |
| US20080168028A1 (en) | 2004-02-20 | 2008-07-10 | Kruger Michael W | System and method for analyzing and correcting retail data |
| US20080168027A1 (en) | 2004-02-20 | 2008-07-10 | Kruger Michael W | System and method for analyzing and correcting retail data |
| US20080256028A1 (en) | 2004-02-20 | 2008-10-16 | Kruger Michael W | System and method for analyzing and correcting retail data |
| US20080288889A1 (en) | 2004-02-20 | 2008-11-20 | Herbert Dennis Hunt | Data visualization application |
| US20080319829A1 (en) | 2004-02-20 | 2008-12-25 | Herbert Dennis Hunt | Bias reduction using data fusion of household panel data and transaction data |
| US20090006490A1 (en) | 2004-02-20 | 2009-01-01 | Herbert Dennis Hunt | Attribute segments and data table bias reduction |
| US20090094274A1 (en) | 2003-09-10 | 2009-04-09 | Exeros, Inc. | Method and apparatus for semantic discovery and mapping between data sources |
| US7523047B1 (en)* | 2000-12-20 | 2009-04-21 | Demandtec, Inc. | Price optimization system |
Family Cites Families (3)
| Publication number | Priority date | Publication date | Assignee | Title |
|---|---|---|---|---|
| US4731585A (en)* | 1987-02-24 | 1988-03-15 | Kabushiki Kaisha Toshiba | Antenna coupling circuit for magnetic resonance imaging |
| US5719573A (en)* | 1995-06-01 | 1998-02-17 | Cirrus Logic, Inc. | Analog modulator for A/D converter utilizing leap-frog filter |
| US6011432A (en)* | 1998-07-23 | 2000-01-04 | Lucent Technologies Inc. | Continuous tuning of switched capacitor circuits using DC-isolated tuning elements |
- 2004
- 2004-02-20USUS10/783,323patent/US7873529B2/enactiveActive
- 2005
- 2005-02-22EPEP05713819Apatent/EP1723588A4/ennot_activeWithdrawn
- 2005-02-22WOPCT/US2005/005297patent/WO2005081876A2/enactiveApplication Filing
- 2007
- 2007-10-29USUS11/926,316patent/US20080147459A1/ennot_activeAbandoned
- 2007-10-29USUS11/926,320patent/US20080154843A1/ennot_activeAbandoned
- 2007-10-29USUS11/926,368patent/US20080162465A1/ennot_activeAbandoned
- 2007-10-29USUS11/926,383patent/US20080154885A1/ennot_activeAbandoned
- 2007-10-29USUS11/926,308patent/US20080162460A1/ennot_activeAbandoned
- 2007-10-29USUS11/926,309patent/US20080162571A1/ennot_activeAbandoned
- 2007-10-29USUS11/926,372patent/US20080162466A1/ennot_activeAbandoned
- 2007-10-29USUS11/926,347patent/US20080162462A1/ennot_activeAbandoned
- 2007-10-29USUS11/926,332patent/US20080136582A1/ennot_activeAbandoned
- 2007-10-29USUS11/926,374patent/US20080136583A1/ennot_activeAbandoned
- 2007-10-29USUS11/926,366patent/US20080140480A1/ennot_activeAbandoned
- 2007-10-29USUS11/926,335patent/US20080162461A1/ennot_activeAbandoned
- 2007-10-29USUS11/926,343patent/US20080162572A1/ennot_activeAbandoned
- 2007-10-29USUS11/926,351patent/US20080162404A1/ennot_activeAbandoned
- 2007-10-29USUS11/926,354patent/US20080162223A1/ennot_activeAbandoned
- 2007-10-29USUS11/926,358patent/US20080162463A1/ennot_activeAbandoned
- 2007-10-29USUS11/926,329patent/US20080256027A1/ennot_activeAbandoned
- 2007-10-29USUS11/926,381patent/US20080154884A1/ennot_activeAbandoned
- 2007-10-29USUS11/926,360patent/US20080162464A1/ennot_activeAbandoned
- 2007-10-29USUS11/926,318patent/US20080143474A1/ennot_activeAbandoned
Patent Citations (53)
| Publication number | Priority date | Publication date | Assignee | Title |
|---|---|---|---|---|
| US5041972A (en) | 1988-04-15 | 1991-08-20 | Frost W Alan | Method of measuring and evaluating consumer response for the development of consumer products |
| US5758257A (en) | 1994-11-29 | 1998-05-26 | Herz; Frederick | System and method for scheduling broadcast of and access to video programs and other data using customer profiles |
| US6401070B1 (en)* | 1996-10-11 | 2002-06-04 | Freddie Mac | System and method for providing house price forecasts based on repeat sales model |
| US6839682B1 (en) | 1999-05-06 | 2005-01-04 | Fair Isaac Corporation | Predictive modeling of consumer financial behavior using supervised segmentation and nearest-neighbor matching |
| US6662192B1 (en) | 2000-03-29 | 2003-12-09 | Bizrate.Com | System and method for data collection, evaluation, information generation, and presentation |
| US6708156B1 (en) | 2000-04-17 | 2004-03-16 | Michael Von Gonten, Inc. | System and method for projecting market penetration |
| US20030065555A1 (en) | 2000-04-17 | 2003-04-03 | Von Gonten Michael F. | Systems and methods for modeling product penetration and repeat |
| WO2001080137A2 (en) | 2000-04-17 | 2001-10-25 | Michael Von Gonten, Inc. | System and method for projecting market penetration |
| US6636585B2 (en) | 2000-06-26 | 2003-10-21 | Bearingpoint, Inc. | Metrics-related testing of an operational support system (OSS) of an incumbent provider for compliance with a regulatory scheme |
| US6636862B2 (en) | 2000-07-05 | 2003-10-21 | Camo, Inc. | Method and system for the dynamic analysis of data |
| US20020169657A1 (en) | 2000-10-27 | 2002-11-14 | Manugistics, Inc. | Supply chain demand forecasting and planning |
| US7523047B1 (en)* | 2000-12-20 | 2009-04-21 | Demandtec, Inc. | Price optimization system |
| US20020099597A1 (en) | 2000-12-27 | 2002-07-25 | Michael Gamage | Method for analyzing assortment of retail product |
| US20030088474A1 (en) | 2001-03-23 | 2003-05-08 | Restaurant Services, Inc. ("RSI"). | System, method and computer program product for an electronics and appliances supply chain management framework |
| US20030046120A1 (en)* | 2001-03-23 | 2003-03-06 | Restaurant Services, Inc. | System, method and computer program product for evaluating the success of a promotion in a supply chain management framework |
| US20030046121A1 (en)* | 2001-03-23 | 2003-03-06 | Restaurant Services, Inc. ("RSI") | System, method and computer program product for normalizing data in a supply chain management framework |
| US20030028417A1 (en) | 2001-05-02 | 2003-02-06 | Fox Edward J. | Method for evaluating retail locations |
| WO2003001428A2 (en) | 2001-05-04 | 2003-01-03 | Ims Health Incorporated | System and methods for estimating product sales in highly fragmented geographical segments of service provider location |
| US20030083925A1 (en) | 2001-11-01 | 2003-05-01 | Weaver Chana L. | System and method for product category management analysis |
| US20030171978A1 (en) | 2002-03-11 | 2003-09-11 | Jenkins Margalyn Toi | Efficient retail item assortment |
| US7027843B2 (en)* | 2002-03-21 | 2006-04-11 | Lenovo (Singapore) Pte. Ltd. | Wireless device power optimization |
| US20060020641A1 (en) | 2002-03-25 | 2006-01-26 | Data Quality Solutions | Business process management system and method |
| US20030200129A1 (en) | 2002-04-23 | 2003-10-23 | Kimberly-Clark Worldwide, Inc. | Method and system for allocating shelf space |
| US20090094274A1 (en) | 2003-09-10 | 2009-04-09 | Exeros, Inc. | Method and apparatus for semantic discovery and mapping between data sources |
| US7379890B2 (en) | 2003-10-17 | 2008-05-27 | Makor Issues And Rights Ltd. | System and method for profit maximization in retail industry |
| US20080147699A1 (en) | 2004-02-20 | 2008-06-19 | Kruger Michael W | System and method for analyzing and correcting retail data |
| US20080162462A1 (en) | 2004-02-20 | 2008-07-03 | Kruger Michael W | System and method for analyzing and correcting retail data |
| US20080143474A1 (en) | 2004-02-20 | 2008-06-19 | Kruger Michael W | System and method for analyzing and correcting retail data |
| US20080147459A1 (en) | 2004-02-20 | 2008-06-19 | Kruger Michael W | System and method for analyzing and correcting retail data |
| US20080154885A1 (en) | 2004-02-20 | 2008-06-26 | Kruger Michael W | System and method for analyzing and correcting retail data |
| US20080154884A1 (en) | 2004-02-20 | 2008-06-26 | Kruger Michael W | System and method for analyzing and correcting retail data |
| US20080154843A1 (en) | 2004-02-20 | 2008-06-26 | Kruger Michael W | System and method for analyzing and correcting retail data |
| US20080162223A1 (en) | 2004-02-20 | 2008-07-03 | Kruger Michael W | System and method for analyzing and correcting retail data |
| US20080162571A1 (en) | 2004-02-20 | 2008-07-03 | Kruger Michael W | System and method for analyzing and correcting retail data |
| US20080162466A1 (en) | 2004-02-20 | 2008-07-03 | Kruger Michael W | System and method for analyzing and correcting retail data |
| US20080162465A1 (en) | 2004-02-20 | 2008-07-03 | Kruger Michael W | System and method for analyzing and correcting retail data |
| US20080162404A1 (en) | 2004-02-20 | 2008-07-03 | Kruger Michael W | System and method for analyzing and correcting retail data |
| US20080162461A1 (en) | 2004-02-20 | 2008-07-03 | Kruger Michael W | System and method for analyzing and correcting retail data |
| US20080136583A1 (en) | 2004-02-20 | 2008-06-12 | Kruger Michael W | System and method for analyzing and correcting retail data |
| US20080162463A1 (en) | 2004-02-20 | 2008-07-03 | Kruger Michael W | System and method for analyzing and correcting retail data |
| US20080162464A1 (en) | 2004-02-20 | 2008-07-03 | Kruger Michael W | System and method for analyzing and correcting retail data |
| US20080162460A1 (en) | 2004-02-20 | 2008-07-03 | Kruger Michael W | System and method for analyzing and correcting retail data |
| US20080162572A1 (en) | 2004-02-20 | 2008-07-03 | Kruger Michael W | System and method for analyzing and correcting retail data |
| US20080136582A1 (en) | 2004-02-20 | 2008-06-12 | Kruger Michael W | System and method for analyzing and correcting retail data |
| US20080168028A1 (en) | 2004-02-20 | 2008-07-10 | Kruger Michael W | System and method for analyzing and correcting retail data |
| US20080168027A1 (en) | 2004-02-20 | 2008-07-10 | Kruger Michael W | System and method for analyzing and correcting retail data |
| US20080256027A1 (en) | 2004-02-20 | 2008-10-16 | Kruger Michael W | System and method for analyzing and correcting retail data |
| US20080256028A1 (en) | 2004-02-20 | 2008-10-16 | Kruger Michael W | System and method for analyzing and correcting retail data |
| US20080288889A1 (en) | 2004-02-20 | 2008-11-20 | Herbert Dennis Hunt | Data visualization application |
| US20080319829A1 (en) | 2004-02-20 | 2008-12-25 | Herbert Dennis Hunt | Bias reduction using data fusion of household panel data and transaction data |
| US20090006490A1 (en) | 2004-02-20 | 2009-01-01 | Herbert Dennis Hunt | Attribute segments and data table bias reduction |
| US20080140480A1 (en) | 2004-02-20 | 2008-06-12 | Kruger Michael W | System and method for analyzing and correcting retail data |
| US20080168104A1 (en) | 2004-06-22 | 2008-07-10 | Kruger Michael W | System and method for analyzing and correcting retail data |
Non-Patent Citations (57)
| Title |
|---|
| "U.S. Appl. No. 12/021,495, Non-Final Office Action mailed May 26, 2010", , 15. |
| , "U.S. Appl. No. 11/926,308, Non-Final Office Action mailed Aug. 14, 2008", OARN , 12 pgs. |
| , "U.S. Appl. No. 11/926,309, Non-Final Office Action mailed Aug. 14, 2008", OARN , 12. |
| , "U.S. Appl. No. 11/926,316, Non-Final Office Action mailed Oct. 1, 2008", OARN , 12 pgs. |
| , "U.S. Appl. No. 11/926,318, Non-Final Office Action mailed Feb. 2, 2010", , 53. |
| , "U.S. Appl. No. 11/926,320, Non-Final Office Action mailed Aug. 5, 2008", OARN , 12 pgs. |
| , "U.S. Appl. No. 11/926,329, Non-Final Office Action mailed Nov. 30, 2009" 8. |
| , "U.S. Appl. No. 11/926,332, Non-Final Office Action mailed Aug. 7, 2008", OARN , 12. |
| , "U.S. Appl. No. 11/926,335, Non-Final Office Action mailed Aug. 6, 2008", OARN , 12. |
| , "U.S. Appl. No. 11/926,343, Non-Final Office Action mailed Aug. 14, 2008", OARN , 12. |
| , "U.S. Appl. No. 11/926,347 Non-Final Office Action mailed Oct. 23, 2008", OARN , 12 Pgs. |
| , "U.S. Appl. No. 11/926,351, Non-Final Office Action mailed Aug. 14, 2008", OARN , 12 pgs. |
| , "U.S. Appl. No. 11/926,354,Non-Final office Action mailed Sep. 30, 2008", OARN , 12 pgs. |
| , "U.S. Appl. No. 11/926,360 Non-Final Office Action mailed Aug. 14, 2008", OARN , 12 Pgs. |
| , "U.S. Appl. No. 11/926,366 Non-Final Office Action mailed Sep. 19, 2008", OARN , 12 Pgs. |
| , "U.S. Appl. No. 11/926,368 Non-Final Office Action mailed Sep. 19, 2008", OARN , 12 Pgs. |
| , "U.S. Appl. No. 11/926,372, Non-Final Office Action mailed Sep. 19, 2008", OARN , 12 pgs. |
| , "U.S. Appl. No. 11/926,374, Non-Final Office Action mailed Aug. 7, 2008", OARN , 12. |
| , "U.S. Appl. No. 11/926,381, Non-Final office Action mailed Sep. 19, 2008", OARN , 12 pgs. |
| , "U.S. Appl. No. 11/926,383, Non-Final office Action mailed Sep. 19, 2008", OARN , 12 pgs. |
| , "U.S. Appl. No. 11/927,502, Non-Final Office Action mailed Jan. 8, 2009", ,12 pgs. |
| , "U.S. Appl. No. 11/927,515, Non-Final Office Action mailed Feb. 17, 2010", , 10 Pgs. |
| , "U.S. Appl. No. 11/927,528, Non-Final Office Action mailed Nov. 30, 2009", , 11 pgs. |
| , "U.S. Appl. No. 11/927,550, Non-Final Office Action mailed Jan. 8, 2009", , 12 pgs. |
| , "U.S. Appl. No. 11/927,565, Non-Final Office Action mailed Jan. 9, 2009", , 12 pgs. |
| -, , "U.S. Appl. No. 11/926,358, Non-Final Office Action mailed Oct. 7, 2008.", OARN , 12 pgs. |
| Baron, Steve et al., "The Challenges of Scanner Data", The Journal of Operational Research Society (vol. 46, No. 1) Jan. 1995, 50-61. |
| Baron, Steve; Lock, Andrew; "The Challenges of Scanner Data", Jan. 1995, The Journal of the Operational Research Society, vol. 46, No. 1, pp. 50-61.* |
| Brand choice, purchase incidence, and segmentation: An integrated modeling RE Bucklin, S Gupta-Journal of Marketing Research, 1992-jstor.org.* |
| Brand choice, purchase incidence, and segmentation: An integrated modeling RE Bucklin, S Gupta—Journal of Marketing Research, 1992—jstor.org.* |
| Bronnenberg, Bart J. et al., "Unobserved Retailer Behavior in Multimarket Data: Joint Spatial Dependence in Market Shares and Promotion Variables", in Market Science 20,3 Summer 2001. |
| Bronnenberg, Bart J; Mahajan, Vijay; "Unobserved Retailer Behavior in Multimarket Behavior: Joint Spatial Dependence in Market Shares and Promotional Variables", Summer 2001, Marketing Science, 20, 3, ABI/INFORM Global p. 284.* |
| Combining sources of preference data D Hensher, J Louviere, J Swait-Journal of Econometrics, 1998-Elsevier.* |
| Combining sources of preference data D Hensher, J Louviere, J Swait—Journal of Econometrics, 1998—Elsevier.* |
| Commercial use of UPC scanner data: Industry and academic perspectives RE Bucklin, S Gupta-Marketing Science, 1999-jstor.org.* |
| Commercial use of UPC scanner data: Industry and academic perspectives RE Bucklin, S Gupta—Marketing Science, 1999—jstor.org.* |
| Do household scanner data provide representative inferences from brand choices: a comparison with store data S Gupta, P Chintagunta, A Kaul, DR Wittink-Journal of Marketing . . . , 1996-jstor.org.* |
| Do household scanner data provide representative inferences from brand choices: a comparison with store data S Gupta, P Chintagunta, A Kaul, DR Wittink—Journal of Marketing . . . , 1996—jstor.org.* |
| Gerald L, S et al., "Consumer buying behavior on the Internet: Find ings from panel data", Wharton Forum on Electron ic Commerce The Wharton School University of Pennsylvania, Department of marketing Columbia School of Business Columbia University Aug. 23, 1999. |
| Guadagni, Peter M. et al., "A Logit Model of Brand Choice Calibrated on Scanner Data", In Marketing Science, vol. 2, No. 3 Summer 1983 , 203-238. |
| Guadagni, Peter M; Little, John D. C.; "A logit model of brand choice calibrated on scanner data", Summer 1983, Marketing Science, vol. 2, No. 3, pp. 203-238.* |
| Kong, E.B.; Dietterich, T.G., "Error-Correcting Output Coding Corrects Bias and Variance," http://citeseer.nj.nec.com/kong95errorcorrecting.html. |
| Kruger, Michael W. , "U.S. Appl. No. 10/783,323", May 8, 2009. |
| Lohse, G.L.; Bellman, S.; Johnson, E.J.; "Consumer buying behavior on the Internet: Findings from panel data," http://knowledge.wharton.upenn.edu/pdfs/793.pdf. |
| Malhotra, et al., "Marketing research in the new millennium: Emergin issues and trends. Marketing Intelligence and Planning", vol. 19, No. 4. 2001 , 216-235 pgs.. |
| McCulloch, Robert et al., "An Exact Likelihood Analysis of the Multinomial Probit Model", Journal of Econometrics, vol. 64 1994 , 207-240. |
| McCullock, Robert; Rossi, Peter E. "An exact likelihood Analysis of the multinomial probit model", 1994, Journal of Econometrics, 64, pp. 207-240.* |
| Missing price and coupon availability data in scanner panels: Correcting for the self selection bias in choice model parameters T Erdem, MP Keane, B Sun-Journal of Econometrics, 1998-Elsevier.* |
| Missing price and coupon availability data in scanner panels: Correcting for the self selection bias in choice model parameters T Erdem, MP Keane, B Sun—Journal of Econometrics, 1998—Elsevier.* |
| Parameter bias from unobserved effects in the multinomial logit model of consumer C Abramson, RL Andrews, IS Currim . . . -Journal of Marketing . . . , 2000-Am Marketing Assoc.* |
| Parameter bias from unobserved effects in the multinomial logit model of consumer C Abramson, RL Andrews, IS Currim . . . —Journal of Marketing . . . , 2000—Am Marketing Assoc.* |
| Purchase frequency, sample selection, and price sensitivity: The heavy-user bias BD Kim, PE Rossi-Marketing Letters, 1994-Springer.* |
| Purchase frequency, sample selection, and price sensitivity: The heavy-user bias BD Kim, PE Rossi—Marketing Letters, 1994—Springer.* |
| Qian, J et al., ""Optimally weighted Means in Stratified Sampling"", amstat.org 1994, 863-866. |
| Qian, Jiahe; Spencer, Bruce D; "Optimally Weighted Means in Stratified Sampling", 1994, amstat.org, pp. 863-866.* |
| Swait, Joffre et al., "Enriching Scanner Panel Models with Choice Experiments", in Marketing Science (22, 4, ABI) Fall 2003, 442-460. |
| Swait, Joffre; Andrews, Rick L; "Enriching Scannel Panel Models with Choice Experiments", Fall 2003, Marketing Science, 22, 4; ABI/INFORM Global. pp. 442-460.* |
Cited By (29)
| Publication number | Priority date | Publication date | Assignee | Title |
|---|---|---|---|---|
| US20080288889A1 (en)* | 2004-02-20 | 2008-11-20 | Herbert Dennis Hunt | Data visualization application |
| US20080319829A1 (en)* | 2004-02-20 | 2008-12-25 | Herbert Dennis Hunt | Bias reduction using data fusion of household panel data and transaction data |
| US10325272B2 (en) | 2004-02-20 | 2019-06-18 | Information Resources, Inc. | Bias reduction using data fusion of household panel data and transaction data |
| US20080005155A1 (en)* | 2006-04-11 | 2008-01-03 | University Of Southern California | System and Method for Generating a Service Oriented Data Composition Architecture for Integrated Asset Management |
| US8719266B2 (en) | 2007-01-26 | 2014-05-06 | Information Resources, Inc. | Data perturbation of non-unique values |
| US20130111005A1 (en)* | 2011-10-26 | 2013-05-02 | Yahoo!, Inc. | Online Active Learning in User-Generated Content Streams |
| US9967218B2 (en)* | 2011-10-26 | 2018-05-08 | Oath Inc. | Online active learning in user-generated content streams |
| US9519910B2 (en) | 2012-06-01 | 2016-12-13 | Rentrak Corporation | System and methods for calibrating user and consumer data |
| US8543523B1 (en) | 2012-06-01 | 2013-09-24 | Rentrak Corporation | Systems and methods for calibrating user and consumer data |
| US11004094B2 (en) | 2012-06-01 | 2021-05-11 | Comscore, Inc. | Systems and methods for calibrating user and consumer data |
| US20140089051A1 (en)* | 2012-09-25 | 2014-03-27 | Frank Piotrowski | Methods and apparatus to align panelist data with retailer sales data |
| US9784774B2 (en) | 2014-01-06 | 2017-10-10 | The Nielsen Company (Us), Llc | Methods and apparatus to determine an operational status of a device |
| US11940475B2 (en) | 2014-01-06 | 2024-03-26 | The Nielsen Company (Us), Llc | Methods and apparatus to determine an operational status of a device |
| US11360131B2 (en) | 2014-01-06 | 2022-06-14 | The Nielsen Company (Us), Llc | Methods and apparatus to determine an operational status of a device |
| US10718799B2 (en) | 2014-01-06 | 2020-07-21 | The Nielsen Company (Us), Llc | Methods and apparatus to determine an operational status of a device using a magnetic field |
| US10373099B1 (en)* | 2015-12-18 | 2019-08-06 | Palantir Technologies Inc. | Misalignment detection system for efficiently processing database-stored data and automatically generating misalignment information for display in interactive user interfaces |
| US11354683B1 (en) | 2015-12-30 | 2022-06-07 | Videomining Corporation | Method and system for creating anonymous shopper panel using multi-modal sensor fusion |
| US10262331B1 (en) | 2016-01-29 | 2019-04-16 | Videomining Corporation | Cross-channel in-store shopper behavior analysis |
| US10963893B1 (en) | 2016-02-23 | 2021-03-30 | Videomining Corporation | Personalized decision tree based on in-store behavior analysis |
| US10387896B1 (en) | 2016-04-27 | 2019-08-20 | Videomining Corporation | At-shelf brand strength tracking and decision analytics |
| US10354262B1 (en) | 2016-06-02 | 2019-07-16 | Videomining Corporation | Brand-switching analysis using longitudinal tracking of at-shelf shopper behavior |
| US11361264B2 (en) | 2016-06-07 | 2022-06-14 | The Nielsen Company (Us), Llc | Methods, systems and apparatus for calibrating data using relaxed benchmark constraints |
| US10776728B1 (en) | 2016-06-07 | 2020-09-15 | The Nielsen Company (Us), Llc | Methods, systems and apparatus for calibrating data using relaxed benchmark constraints |
| US11062365B2 (en)* | 2017-03-23 | 2021-07-13 | Walmart Apollo, Llc | Systems and methods for correcting incorrect product information in an electronic data catalog |
| US20180276726A1 (en)* | 2017-03-23 | 2018-09-27 | Wal-Mart Stores, Inc. | Systems and methods for correcting incorrect product information in an electronic data catalog |
| US11449880B2 (en) | 2018-11-01 | 2022-09-20 | Nielsen Consumer Llc | Methods, systems, apparatus and articles of manufacture to model eCommerce sales |
| US11544653B2 (en)* | 2019-06-24 | 2023-01-03 | Overstock.Com, Inc. | System and method for improving product catalog representations based on product catalog adherence scores |
| US11205214B2 (en) | 2019-07-29 | 2021-12-21 | Luke MARIETTA | Method and system for automatically replenishing consumable items |
| US20230260002A1 (en)* | 2022-02-14 | 2023-08-17 | Target Brands, Inc. | Systems and methods for determining item quality index scores in an online retail environment |
Also Published As
| Publication number | Publication date |
|---|---|
| US20080154843A1 (en) | 2008-06-26 |
| US20080154885A1 (en) | 2008-06-26 |
| WO2005081876A2 (en) | 2005-09-09 |
| US20080136583A1 (en) | 2008-06-12 |
| EP1723588A4 (en) | 2009-07-15 |
| US20080162462A1 (en) | 2008-07-03 |
| US20080256027A1 (en) | 2008-10-16 |
| US20080162465A1 (en) | 2008-07-03 |
| US20080162572A1 (en) | 2008-07-03 |
| US20080140480A1 (en) | 2008-06-12 |
| US20080162571A1 (en) | 2008-07-03 |
| US20080162223A1 (en) | 2008-07-03 |
| US20080162464A1 (en) | 2008-07-03 |
| WO2005081876A3 (en) | 2005-11-17 |
| US20080162466A1 (en) | 2008-07-03 |
| US20080162460A1 (en) | 2008-07-03 |
| EP1723588A2 (en) | 2006-11-22 |
| US20080136582A1 (en) | 2008-06-12 |
| US20080147459A1 (en) | 2008-06-19 |
| US20080162461A1 (en) | 2008-07-03 |
| US20080162463A1 (en) | 2008-07-03 |
| US20080162404A1 (en) | 2008-07-03 |
| US20080143474A1 (en) | 2008-06-19 |
| US20050187972A1 (en) | 2005-08-25 |
| US20080154884A1 (en) | 2008-06-26 |
Similar Documents
| Publication | Publication Date | Title |
|---|---|---|
| US7873529B2 (en) | System and method for analyzing and correcting retail data | |
| US20230316206A1 (en) | Methods and apparatus for the formatting of data values that may be arbitrary or indeterminate collected from a plurality of sources | |
| US20080168027A1 (en) | System and method for analyzing and correcting retail data | |
| US20080256028A1 (en) | System and method for analyzing and correcting retail data | |
| US20080168028A1 (en) | System and method for analyzing and correcting retail data | |
| US20080262900A1 (en) | Methods and apparatus to facilitate sales estimates | |
| US20100070339A1 (en) | Associating an Entity with a Category | |
| US20090319331A1 (en) | Methods and apparatus to respond to recalls | |
| US20080147699A1 (en) | System and method for analyzing and correcting retail data | |
| EP3281167A1 (en) | Qualitatively planning, measuring, making effecient and capitalizing on marketing strategy | |
| US20080168104A1 (en) | System and method for analyzing and correcting retail data | |
| US20090192914A1 (en) | Adaptive Lead Pricing | |
| Nakamura et al. | Sourcing substitution and related price index biases | |
| US20190164180A1 (en) | Methods, systems, apparatus and articles of manufacture to generate projection weights for a panel | |
| US20190355030A1 (en) | Item-specific value optimization tool | |
| Sun et al. | Geo-level bayesian hierarchical media mix modeling | |
| US8660884B2 (en) | Method and system for estimating demand impact on a firm under crisis | |
| US20090313284A1 (en) | Data Integration Method |
Legal Events
| Date | Code | Title | Description |
|---|---|---|---|
| AS | Assignment | Owner name:INFORMATION RESOURCES, INC., ILLINOIS Free format text:ASSIGNMENT OF ASSIGNORS INTEREST;ASSIGNORS:KRUGER, MICHAEL W.;BERGEON, CHERYL G.;JOHNSON, ARVID C.;REEL/FRAME:014680/0978 Effective date:20040316 | |
| AS | Assignment | Owner name:WELLS FARGO FOOTHILL, INC., CALIFORNIA Free format text:AMENDMENT NO. ONE TO SECURITY AGREEMENT;ASSIGNOR:INFORMATION RESOURCES, INC.;REEL/FRAME:015439/0973 Effective date:20041209 | |
| AS | Assignment | Owner name:BANK OF AMERICA, N.A., AS ADMINISTRATIVE AGANT, CA Free format text:SECURITY INTEREST;ASSIGNOR:INFORMATION RESOURCES, INC.;REEL/FRAME:019628/0316 Effective date:20070516 | |
| AS | Assignment | Owner name:SYMPHONYIRI GROUP, INC., ILLINOIS Free format text:CHANGE OF NAME;ASSIGNOR:INFORMATION RESOURCES, INC.;REEL/FRAME:025090/0319 Effective date:20100525 | |
| STCF | Information on status: patent grant | Free format text:PATENTED CASE | |
| AS | Assignment | Owner name:IRI GREEK HOLDINGS, INC., ILLINOIS Free format text:RELEASE BY SECURED PARTY;ASSIGNOR:BANK OF AMERICA, N.A.;REEL/FRAME:026417/0075 Effective date:20110601 Owner name:IRI CYPRUS HOLDINGS, INC., ILLINOIS Free format text:RELEASE BY SECURED PARTY;ASSIGNOR:BANK OF AMERICA, N.A.;REEL/FRAME:026417/0075 Effective date:20110601 Owner name:NORTH CLINTON CORPORATION, ILLINOIS Free format text:RELEASE BY SECURED PARTY;ASSIGNOR:BANK OF AMERICA, N.A.;REEL/FRAME:026417/0075 Effective date:20110601 Owner name:INFORMATION RESOURCES, INC., ILLINOIS Free format text:RELEASE BY SECURED PARTY;ASSIGNOR:BANK OF AMERICA, N.A.;REEL/FRAME:026417/0075 Effective date:20110601 Owner name:564 RANDOLPH CO. #2, ILLINOIS Free format text:RELEASE BY SECURED PARTY;ASSIGNOR:BANK OF AMERICA, N.A.;REEL/FRAME:026417/0075 Effective date:20110601 Owner name:SHOPPERS HOTLINE, INC., ILLINOIS Free format text:RELEASE BY SECURED PARTY;ASSIGNOR:BANK OF AMERICA, N.A.;REEL/FRAME:026417/0075 Effective date:20110601 Owner name:INFORMATION RESOURCES DHC, INC., ILLINOIS Free format text:RELEASE BY SECURED PARTY;ASSIGNOR:BANK OF AMERICA, N.A.;REEL/FRAME:026417/0075 Effective date:20110601 Owner name:IRI BWS HOLDINGS, INC., ILLINOIS Free format text:RELEASE BY SECURED PARTY;ASSIGNOR:BANK OF AMERICA, N.A.;REEL/FRAME:026417/0075 Effective date:20110601 Owner name:IRI GUATEMALA HOLDINGS, INC., ILLINOIS Free format text:RELEASE BY SECURED PARTY;ASSIGNOR:BANK OF AMERICA, N.A.;REEL/FRAME:026417/0075 Effective date:20110601 Owner name:IRI FRENCH HOLDINGS, INC., ILLINOIS Free format text:RELEASE BY SECURED PARTY;ASSIGNOR:BANK OF AMERICA, N.A.;REEL/FRAME:026417/0075 Effective date:20110601 Owner name:IRI ITALY HOLDINGS, INC., ILLINOIS Free format text:RELEASE BY SECURED PARTY;ASSIGNOR:BANK OF AMERICA, N.A.;REEL/FRAME:026417/0075 Effective date:20110601 Owner name:IRI LOGISTICS, INC., ILLINOIS Free format text:RELEASE BY SECURED PARTY;ASSIGNOR:BANK OF AMERICA, N.A.;REEL/FRAME:026417/0075 Effective date:20110601 Owner name:INFOSCAN ITALY HOLDINGS, INC., ILLINOIS Free format text:RELEASE BY SECURED PARTY;ASSIGNOR:BANK OF AMERICA, N.A.;REEL/FRAME:026417/0075 Effective date:20110601 Owner name:BANK OF AMERICA, N.A., CALIFORNIA Free format text:SECURITY AGREEMENT;ASSIGNORS:IRI HOLDINGS, INC.;BLACKCOMB ACQUISITION, INC.;SYMPHONYIRI GROUP, INC. (F/K/A INFORMATION RESOURCES, INC.);AND OTHERS;REEL/FRAME:026418/0382 Effective date:20110601 | |
| AS | Assignment | Owner name:INFORMATION RESOURCES, INC., ILLINOIS Free format text:CHANGE OF NAME;ASSIGNOR:SYMPHONYIRI GROUP, INC.;REEL/FRAME:030303/0944 Effective date:20130412 | |
| AS | Assignment | Owner name:INFORMATION RESOURCES DHC, INC., ILLINOIS Free format text:RELEASE BY SECURED PARTY;ASSIGNOR:BANK OF AMERICA, N.A.;REEL/FRAME:031365/0361 Effective date:20130930 Owner name:IRI GREEK HOLDINGS, INC., ILLINOIS Free format text:RELEASE BY SECURED PARTY;ASSIGNOR:BANK OF AMERICA, N.A.;REEL/FRAME:031365/0361 Effective date:20130930 Owner name:INFORMATION RESOURCES, INC. (FKA SYMPHONYIRI GROUP, INC.), ILLINOIS Free format text:RELEASE BY SECURED PARTY;ASSIGNOR:BANK OF AMERICA, N.A.;REEL/FRAME:031365/0361 Effective date:20130930 Owner name:IRI HOLDINGS INC. (AS SUCCESSOR IN INTEREST TO BLACKCOMB ACQUISITION, INC.), ILLINOIS Free format text:RELEASE BY SECURED PARTY;ASSIGNOR:BANK OF AMERICA, N.A.;REEL/FRAME:031365/0361 Effective date:20130930 Owner name:564 RANDOLPH CO. #2, ILLINOIS Free format text:RELEASE BY SECURED PARTY;ASSIGNOR:BANK OF AMERICA, N.A.;REEL/FRAME:031365/0361 Effective date:20130930 Owner name:INFORMATION RESOURCES, INC. (FKA SYMPHONYIRI GROUP Free format text:RELEASE BY SECURED PARTY;ASSIGNOR:BANK OF AMERICA, N.A.;REEL/FRAME:031365/0361 Effective date:20130930 Owner name:IRI ITALY HOLDINGS, INC., ILLINOIS Free format text:RELEASE BY SECURED PARTY;ASSIGNOR:BANK OF AMERICA, N.A.;REEL/FRAME:031365/0361 Effective date:20130930 Owner name:IRI FRENCH HOLDINGS, INC., ILLINOIS Free format text:RELEASE BY SECURED PARTY;ASSIGNOR:BANK OF AMERICA, N.A.;REEL/FRAME:031365/0361 Effective date:20130930 Owner name:IRI GROUP HOLDINGS, INC., ILLINOIS Free format text:RELEASE BY SECURED PARTY;ASSIGNOR:BANK OF AMERICA, N.A.;REEL/FRAME:031365/0361 Effective date:20130930 Owner name:INFOSCAN ITALY HOLDINGS, INC., ILLINOIS Free format text:RELEASE BY SECURED PARTY;ASSIGNOR:BANK OF AMERICA, N.A.;REEL/FRAME:031365/0361 Effective date:20130930 Owner name:SYMPHONYISG, INC., ILLINOIS Free format text:RELEASE BY SECURED PARTY;ASSIGNOR:BANK OF AMERICA, N.A.;REEL/FRAME:031365/0361 Effective date:20130930 Owner name:IRI HOLDINGS INC. (AS SUCCESSOR IN INTEREST TO BLA Free format text:RELEASE BY SECURED PARTY;ASSIGNOR:BANK OF AMERICA, N.A.;REEL/FRAME:031365/0361 Effective date:20130930 | |
| AS | Assignment | Owner name:BANK OF AMERICA, N.A., NORTH CAROLINA Free format text:SECURITY AGREEMENT;ASSIGNORS:IRI HOLDINGS, INC.;INFORMATION RESOURCES, INC.;INFORMATION RESOURCES DHC, INC.;AND OTHERS;REEL/FRAME:031345/0292 Effective date:20130930 | |
| FPAY | Fee payment | Year of fee payment:4 | |
| AS | Assignment | Owner name:MORGAN STANLEY SENIOR FUNDING, INC., AS ADMINISTRATIVE AGENT, NEW YORK Free format text:SECOND LIEN PATENT SECURITY AGREEMENT;ASSIGNOR:INFORMATION RESOURCES, INC.;REEL/FRAME:041394/0234 Effective date:20170118 Owner name:MORGAN STANLEY SENIOR FUNDING, INC., AS ADMINISTRATIVE AGENT, NEW YORK Free format text:FIRST LIEN PATENT SECURITY AGREEMENT;ASSIGNOR:INFORMATION RESOURCES, INC.;REEL/FRAME:041394/0166 Effective date:20170118 Owner name:INFORMATION RESOURCES DHC, INC., ILLINOIS Free format text:RELEASE BY SECURED PARTY;ASSIGNOR:BANK OF AMERICA, N.A.;REEL/FRAME:041007/0689 Effective date:20170118 Owner name:IRI GREEK HOLDINGS, INC., ILLINOIS Free format text:RELEASE BY SECURED PARTY;ASSIGNOR:BANK OF AMERICA, N.A.;REEL/FRAME:041007/0689 Effective date:20170118 Owner name:IRI FRENCH HOLDINGS, INC., ILLINOIS Free format text:RELEASE BY SECURED PARTY;ASSIGNOR:BANK OF AMERICA, N.A.;REEL/FRAME:041007/0689 Effective date:20170118 Owner name:IRI ITALY HOLDINGS, INC., ILLINOIS Free format text:RELEASE BY SECURED PARTY;ASSIGNOR:BANK OF AMERICA, N.A.;REEL/FRAME:041007/0689 Effective date:20170118 Owner name:FRESHLOOK MARKETING GROUP, LLC, ILLINOIS Free format text:RELEASE BY SECURED PARTY;ASSIGNOR:BANK OF AMERICA, N.A.;REEL/FRAME:041007/0689 Effective date:20170118 Owner name:IRI HOLDINGS, INC., ILLINOIS Free format text:RELEASE BY SECURED PARTY;ASSIGNOR:BANK OF AMERICA, N.A.;REEL/FRAME:041007/0689 Effective date:20170118 Owner name:INFOSCAN ITALY HOLDINGS, INC., ILLINOIS Free format text:RELEASE BY SECURED PARTY;ASSIGNOR:BANK OF AMERICA, N.A.;REEL/FRAME:041007/0689 Effective date:20170118 Owner name:IRI ISG, INC., ILLINOIS Free format text:RELEASE BY SECURED PARTY;ASSIGNOR:BANK OF AMERICA, N.A.;REEL/FRAME:041007/0689 Effective date:20170118 Owner name:INFORMATION RESOURCES, INC., ILLINOIS Free format text:RELEASE BY SECURED PARTY;ASSIGNOR:BANK OF AMERICA, N.A.;REEL/FRAME:041007/0689 Effective date:20170118 Owner name:MORGAN STANLEY SENIOR FUNDING, INC., AS ADMINISTRA Free format text:FIRST LIEN PATENT SECURITY AGREEMENT;ASSIGNOR:INFORMATION RESOURCES, INC.;REEL/FRAME:041394/0166 Effective date:20170118 Owner name:MORGAN STANLEY SENIOR FUNDING, INC., AS ADMINISTRA Free format text:SECOND LIEN PATENT SECURITY AGREEMENT;ASSIGNOR:INFORMATION RESOURCES, INC.;REEL/FRAME:041394/0234 Effective date:20170118 | |
| MAFP | Maintenance fee payment | Free format text:PAYMENT OF MAINTENANCE FEE, 8TH YEAR, LARGE ENTITY (ORIGINAL EVENT CODE: M1552) Year of fee payment:8 | |
| AS | Assignment | Owner name:JEFFERIES FINANCE LLC, AS ADMINISTRATIVE AGENT, NE Free format text:FIRST LIEN PATENT SECURITY AGREEMENT;ASSIGNOR:INFORMATION RESOURCES, INC.;REEL/FRAME:048175/0103 Effective date:20181130 Owner name:JEFFERIES FINANCE LLC, AS ADMINISTRATIVE AGENT, NEW YORK Free format text:SECOND LIEN PATENT SECURITY AGREEMENT;ASSIGNOR:INFORMATION RESOURCES, INC.;REEL/FRAME:047691/0071 Effective date:20181130 Owner name:JEFFERIES FINANCE LLC, AS ADMINISTRATIVE AGENT, NEW YORK Free format text:FIRST LIEN PATENT SECURITY AGREEMENT;ASSIGNOR:INFORMATION RESOURCES, INC.;REEL/FRAME:048175/0103 Effective date:20181130 Owner name:JEFFERIES FINANCE LLC, AS ADMINISTRATIVE AGENT, NE Free format text:SECOND LIEN PATENT SECURITY AGREEMENT;ASSIGNOR:INFORMATION RESOURCES, INC.;REEL/FRAME:047691/0071 Effective date:20181130 | |
| AS | Assignment | Owner name:INFORMATION RESOURCES, INC., ILLINOIS Free format text:RELEASE OF SECURITY INTEREST IN PATENTS RECORDED AT R/F: 041394/0166;ASSIGNOR:MORGAN STANLEY SENIOR FUNDING, INC., AS ADMINISTRATIVE AGENT;REEL/FRAME:048316/0163 Effective date:20181130 Owner name:INFORMATION RESOURCES, INC., ILLINOIS Free format text:RELEASE OF SECURITY INTEREST IN PATENTS RECORDED AT R/F: 041394/0234;ASSIGNOR:MORGAN STANLEY SENIOR FUNDING, INC., AS ADMINISTRATIVE AGENT;REEL/FRAME:048316/0528 Effective date:20181130 | |
| AS | Assignment | Owner name:INFORMATION RESOURCES, INC., ILLINOIS Free format text:RELEASE BY SECURED PARTY;ASSIGNOR:WELLS FARGO FOOTHILL, INC.;REEL/FRAME:060333/0193 Effective date:20070516 | |
| MAFP | Maintenance fee payment | Free format text:PAYMENT OF MAINTENANCE FEE, 12TH YEAR, LARGE ENTITY (ORIGINAL EVENT CODE: M1553); ENTITY STATUS OF PATENT OWNER: LARGE ENTITY Year of fee payment:12 | |
| AS | Assignment | Owner name:WILMINGTON TRUST, NATIONAL ASSOCIATION, AS COLLATERAL AGENT, MINNESOTA Free format text:SECURITY INTEREST;ASSIGNOR:INFORMATION RESOURCES, INC.;REEL/FRAME:060685/0246 Effective date:20220801 | |
| AS | Assignment | Owner name:INFORMATION RESOURCES, INC., ILLINOIS Free format text:RELEASE BY SECURED PARTY;ASSIGNOR:JEFFERIES FINANCE LLC, AS ADMINISTRATIVE AGENT;REEL/FRAME:060940/0260 Effective date:20220801 | |
| AS | Assignment | Owner name:INFORMATION RESOURCES, INC., ILLINOIS Free format text:RELEASE BY SECURED PARTY;ASSIGNOR:JEFFERIES FINANCE LLC, AS ADMINISTRATIVE AGENT;REEL/FRAME:060962/0552 Effective date:20220801 |