US7747055B1 - Virtual endoscopy with improved image segmentation and lesion detection - Google Patents
Virtual endoscopy with improved image segmentation and lesion detectionDownload PDFInfo
- Publication number
- US7747055B1 US7747055B1US09/856,683US85668399AUS7747055B1US 7747055 B1US7747055 B1US 7747055B1US 85668399 AUS85668399 AUS 85668399AUS 7747055 B1US7747055 B1US 7747055B1
- Authority
- US
- United States
- Prior art keywords
- dimensional
- interest
- region
- volume
- wireframe
- Prior art date
- Legal status (The legal status is an assumption and is not a legal conclusion. Google has not performed a legal analysis and makes no representation as to the accuracy of the status listed.)
- Expired - Fee Related
Links
Images


Classifications
- G—PHYSICS
- G06—COMPUTING OR CALCULATING; COUNTING
- G06T—IMAGE DATA PROCESSING OR GENERATION, IN GENERAL
- G06T17/00—Three dimensional [3D] modelling, e.g. data description of 3D objects
- G06T17/20—Finite element generation, e.g. wire-frame surface description, tesselation
- A—HUMAN NECESSITIES
- A61—MEDICAL OR VETERINARY SCIENCE; HYGIENE
- A61B—DIAGNOSIS; SURGERY; IDENTIFICATION
- A61B6/00—Apparatus or devices for radiation diagnosis; Apparatus or devices for radiation diagnosis combined with radiation therapy equipment
- A61B6/46—Arrangements for interfacing with the operator or the patient
- A61B6/461—Displaying means of special interest
- A61B6/466—Displaying means of special interest adapted to display 3D data
- A—HUMAN NECESSITIES
- A61—MEDICAL OR VETERINARY SCIENCE; HYGIENE
- A61B—DIAGNOSIS; SURGERY; IDENTIFICATION
- A61B8/00—Diagnosis using ultrasonic, sonic or infrasonic waves
- A61B8/48—Diagnostic techniques
- A61B8/483—Diagnostic techniques involving the acquisition of a 3D volume of data
- G—PHYSICS
- G06—COMPUTING OR CALCULATING; COUNTING
- G06T—IMAGE DATA PROCESSING OR GENERATION, IN GENERAL
- G06T15/00—3D [Three Dimensional] image rendering
- G06T15/08—Volume rendering
- G—PHYSICS
- G06—COMPUTING OR CALCULATING; COUNTING
- G06T—IMAGE DATA PROCESSING OR GENERATION, IN GENERAL
- G06T19/00—Manipulating 3D models or images for computer graphics
- G06T19/20—Editing of 3D images, e.g. changing shapes or colours, aligning objects or positioning parts
- G—PHYSICS
- G06—COMPUTING OR CALCULATING; COUNTING
- G06T—IMAGE DATA PROCESSING OR GENERATION, IN GENERAL
- G06T7/00—Image analysis
- G06T7/0002—Inspection of images, e.g. flaw detection
- G06T7/0012—Biomedical image inspection
- G—PHYSICS
- G16—INFORMATION AND COMMUNICATION TECHNOLOGY [ICT] SPECIALLY ADAPTED FOR SPECIFIC APPLICATION FIELDS
- G16H—HEALTHCARE INFORMATICS, i.e. INFORMATION AND COMMUNICATION TECHNOLOGY [ICT] SPECIALLY ADAPTED FOR THE HANDLING OR PROCESSING OF MEDICAL OR HEALTHCARE DATA
- G16H30/00—ICT specially adapted for the handling or processing of medical images
- G16H30/20—ICT specially adapted for the handling or processing of medical images for handling medical images, e.g. DICOM, HL7 or PACS
- G—PHYSICS
- G16—INFORMATION AND COMMUNICATION TECHNOLOGY [ICT] SPECIALLY ADAPTED FOR SPECIFIC APPLICATION FIELDS
- G16H—HEALTHCARE INFORMATICS, i.e. INFORMATION AND COMMUNICATION TECHNOLOGY [ICT] SPECIALLY ADAPTED FOR THE HANDLING OR PROCESSING OF MEDICAL OR HEALTHCARE DATA
- G16H50/00—ICT specially adapted for medical diagnosis, medical simulation or medical data mining; ICT specially adapted for detecting, monitoring or modelling epidemics or pandemics
- G16H50/50—ICT specially adapted for medical diagnosis, medical simulation or medical data mining; ICT specially adapted for detecting, monitoring or modelling epidemics or pandemics for simulation or modelling of medical disorders
- G—PHYSICS
- G16—INFORMATION AND COMMUNICATION TECHNOLOGY [ICT] SPECIALLY ADAPTED FOR SPECIFIC APPLICATION FIELDS
- G16Z—INFORMATION AND COMMUNICATION TECHNOLOGY [ICT] SPECIALLY ADAPTED FOR SPECIFIC APPLICATION FIELDS, NOT OTHERWISE PROVIDED FOR
- G16Z99/00—Subject matter not provided for in other main groups of this subclass
- G—PHYSICS
- G06—COMPUTING OR CALCULATING; COUNTING
- G06T—IMAGE DATA PROCESSING OR GENERATION, IN GENERAL
- G06T2200/00—Indexing scheme for image data processing or generation, in general
- G06T2200/04—Indexing scheme for image data processing or generation, in general involving 3D image data
- G—PHYSICS
- G06—COMPUTING OR CALCULATING; COUNTING
- G06T—IMAGE DATA PROCESSING OR GENERATION, IN GENERAL
- G06T2207/00—Indexing scheme for image analysis or image enhancement
- G06T2207/10—Image acquisition modality
- G06T2207/10072—Tomographic images
- G—PHYSICS
- G06—COMPUTING OR CALCULATING; COUNTING
- G06T—IMAGE DATA PROCESSING OR GENERATION, IN GENERAL
- G06T2207/00—Indexing scheme for image analysis or image enhancement
- G06T2207/30—Subject of image; Context of image processing
- G06T2207/30004—Biomedical image processing
- G06T2207/30028—Colon; Small intestine
- G—PHYSICS
- G06—COMPUTING OR CALCULATING; COUNTING
- G06T—IMAGE DATA PROCESSING OR GENERATION, IN GENERAL
- G06T2210/00—Indexing scheme for image generation or computer graphics
- G06T2210/41—Medical
Definitions
- the present inventionrelates to a system and method for interactively displaying a three-dimensional rendering of a structure and, more particularly, to a system and method for automatically analyzing such structures for potential abnormalities.
- Virtual endoscopythat utilizes computer reformation of radiologic cross-sectional images is a minimally invasive alternative to conventional fiberoptic endoscopy.
- Virtual endoscopyreduces the risk of perforation, does not require any sedation, and is considerably less expensive than the fiberoptic endoscopy method.
- virtual colonoscopy techniquesgenerally require bowel cleansing, gas distension of the colon, a 10-60 second helical computed tomography (CT) scan of a patient's abdomen and pelvis, and human visual analysis of multi-planar two-dimensional (2D) and three-dimensional (3D) images created from CT data.
- CTcomputed tomography
- a computer-implemented method and computer systemare provided for interactively displaying a three-dimensional rendering of a structure, generally having a lumen.
- the methodmay be utilized for analyzing regions having certain characteristics of wall structure, such as thickness or shape, to detect, for example, abnormal masses.
- a three-dimensional volume of datais formed from a series of two-dimensional images representing at least one physical property associated with the three-dimensional object.
- a surface of a selected region of interest, optionally an isosurfaceis created in the computer from the volume of data based on selected values of the physical properties representing the selected region of interest.
- a wireframe model of the surfaceis generated by the computer.
- the wireframe modelmay be purposefully deformed by the computer to more accurately match the object of interest.
- the wireframe modelis analyzed to detect, by computer, those sections of the object having the selected characteristic such as abnormal wall structure.
- the wireframe modelincludes a plurality of vertices.
- the computer-implemented methodgroups the vertices of the wireframe model into populations having a characteristic indicating abnormal wall structure.
- the wireframe model with highlighted abnormal portionsis then rendered by the computer into an interactive three-dimensional display on the computer monitor.
- the locations of selected abnormal portionsmay be stored and indexed in the computer without necessity of an interactive display.
- volume formation meansis included for forming a three-dimensional volume of data from a series of two-dimensional images representing at least one physical property associated with a three-dimensional body.
- a wireframe modeling meansis provided for producing a wireframe model of a selected region or object of interest.
- a wireframe deforming meansis provided for deforming the wireframe model to more accurately represent the object of interest.
- rendering meansmay optionally be provided for rendering the wireframe model in an interactive three-dimensional display, therein producing a virtual three-dimensional environment.
- segmentation meansmay be provided for segmenting the object of interest from the volume of data based on selected values of the physical property representing the region of interest.
- modeling meansmay function to produce the wireframe model from the segmented region of interest.
- the wireframe modelmay be produced to include a plurality of vertices, with each vertex having a coordinate position.
- the deforming meansmay include refinement means for refining the wireframe model by adjusting the coordinate positions of the vertices to more accurately represent the object of interest.
- the vertices of the wireframe modelmay be grouped into regions having a characteristic indicating abnormal structure.
- the regions of abnormal structuremay then be analyzed to identify regions having a high degree of abnormality.
- the abnormal structurecan be designated and indexed by the computer either as a comprehensive listing or as a listing dependent on the degree of abnormality.
- the systemmay also include provision for targeting abnormalities and for determining the position of a biopsy needle within the three-dimensional virtual environment.
- an interactive three-dimensional display of a rendered wireframe model of a selected object of interestis displayed from the perspective indicating the position of the biopsy needle within the three-dimensional virtual environment.
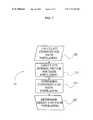
- FIG. 1is a flowchart representing a method in accordance with the present invention of producing an interactive, three-dimensional rendering of a selected organ system, such as an organ containing a lumen, and of detecting potentially abnormal areas of the organ system;
- FIG. 2is a flowchart representing a method for analyzing the shape of a population representing a potentially abnormal area within the selected organ system
- FIGS. 3 a - bare graphical representations of a method for treating evolving surfaces as the level surfaces of an evolving scalar function
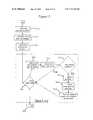
- FIG. 4is a block diagram of a system used in the method of the present invention.
- FIG. 5is a schematic representation of a two-dimensional plane through a wireframe model of an area of abnormal wall structure illustrating a method for determining the convexity of the area;
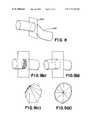
- FIGS. 6 a - dare diagrams illustrating methods of calculating wall thickness at a vertex of a wireframe model by analyzing the intensity profile along the normal vector originated at the vertex;
- FIG. 7is a schematic view of a display window for displaying a volume rendered image, a surface rendered image, and three multiplanar images along three different planes of a selected organ system;
- FIG. 8is a schematic diagram depicting the cross-sectional area of a lumen defined by a plane through the lumen
- FIGS. 9 a - dare diagrams representing methodology for calculating the cross sectional area of the lumen defined by the cutting plane shown in FIG. 8 ;
- FIG. 10is a schematic view of a display window for displaying a volume rendered image, a surface rendered image, and three multiplanar images along three different planes of a selected organ system combined in a single window display;
- FIG. 11is a block diagram of an alternate embodiment of the system used in the method of the present invention.
- FIG. 12is a flowchart representing a method for creating a selected surface of a region of interest
- FIG. 13is a flowchart representing an alternate method for analyzing the shape of a population
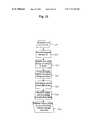
- FIG. 14is a flowchart representing a method for guiding endoscopic biopsy procedures in accordance with the present invention.
- FIG. 15is a schematic representation of section of two-dimensional image data containing hypothetical soft tissue/opacified stool and opacified stool/air interfaces;
- FIG. 16is a schematic representation of a simplified section of two-dimensional image data containing soft tissue/opacified stool and opacified stool/air interfaces.
- FIG. 17is a schematic representation of the section of two-dimensional image data of FIG. 16 showing edge gradient effects resulting from a simple digital subtraction scheme.
- the present inventiongenerally relates to a computer-implemented method and system, as schematically represented in FIGS. 1 , 2 , and 4 for generating interactive, three-dimensional renderings of three-dimensional structures generally having a lumen.
- the structuresare usually in the general form of selected regions of a body and in particular, human or animal body organs which have hollow lumens such as colons, blood vessels, and airways.
- the interactive three-dimensional renderingsare generated in a computer-controlled process from a series of two-dimensional, cross-sectional images of the selected body organ acquired, for example, from a helical computed tomography (CT) scan.
- CTcomputed tomography
- the three-dimensional renderingsare interactive in that such renderings can be manipulated by a user on a visual display of a computer system, such as a computer monitor, to enable movement in, around and through the three-dimensional structure, or slices or cuts of such three-dimensional structure, while simultaneously displaying multiplanar views centered on a point that changes in response to the movement, or on a point selected by the user.
- a computer systemsuch as a computer monitor
- the computer-generated interactive three-dimensional renderingscan be constructed from surface renderings of the organ system or from volume renderings of the organ system and surrounding anatomy and may be presented from surface and volume renderings simultaneously in the same three-dimensional display window.
- a surface rendering of an organcan be incorporated into a volume rendering of the surrounding anatomy using texture memory in order to achieve a combined surface/volume rendering, or a hybrid rendering effect, wherein the surface rendered organ may be highlighted in the context of the volume-rendered surrounding anatomy.
- multiplanar viewssuch as orthogonal (sagittal, coronal, and axial) or oblique views, may be presented simultaneously with a surface-rendered organ and surrounding volume-rendered anatomy in either separate three-dimensional display windows or in a combined single three-dimensional display or window.
- FIG. 4A computer-controlled system 20 in accordance with the present invention is shown schematically in FIG. 4 .
- the system 20is generally as described in U.S. Pat. No. 5,782,762, which is incorporated herein by reference.
- a computer console 24is used to operate a scanner 22 to produce a series of two-dimensional, cross-sectional images of a selected three-dimensional object.
- the two-dimensional imagesare transferred from the console 24 to a computer graphics workstation 26 over a computer network 25.
- the graphics computer 26is used to generate a three-dimensional rendering, such as a three dimensional surface rendering, of the selected object and to automatically identify potentially abnormal regions of the structure.
- the three-dimensional renderingis displayed on a computer monitor 28. Additionally, the displayed rendering can be recorded on a video recorder 30 or photographed and/or digitally recorded for future viewing.
- Various inputs, such as a computer mouse 27,are provided to the graphics computer to permit a user to manipulate the displayed imagery.
- the scanner 22can be a General Electric HiSpeed Advantage Helical CT Scanner (GE Medical Systems, Milwaukee, Wis.). For scanning a patient's lungs, the scanner is typically operated with an X-ray beam collimation of 3 mm, a pitch of 1:1, a 1 mm reconstruction interval, a display field-of-view of 25.6 cm, and a 512 ⁇ 512 matrix. For scanning a patient's colon, the scanner is typically operated with a beam collimation of 5 mm, a pitch of 2:1, a 1 mm reconstruction interval, a display field-of-view of 40 cm, and a 512 ⁇ 512 matrix.
- GE Medical SystemsMilwaukee, Wis.
- protocolstypically result in approximately 200 thoracic CT images or 500 abdominal CT images, which occupy approximately 100 MB and 250 MB of disk storage space, respectively.
- the protocolscan be modified to optimally acquire image data of specific organ systems, or to adapt to advances in scanner technology.
- MR scanningcan be employed, or any future technology that generates image data.
- the image datacan be stored in any of a variety of image formats.
- the image datacan be stored using the digital imaging and communications in medicine (DICOM) standard, or as raw binary slices, or in a variety of volume formats.
- the image datacan be stored in the computer memory in an internal data format which allows the image files to be saved as a single data volume instead of individual image files.
- the internal data formatcan also permit standard compression and uncompression techniques to be incorporated, thereby reducing computer disk storage requirements.
- FIG. 11An alternate arrangement of the system in accordance with the present invention is shown schematically in FIG. 11 .
- the system of FIG. 11is particularly well suited for use with a centralized high-speed graphics computer.
- the scanner 422 , computer console 424 , graphics computer 426 , memory 412 , mouse 427 , monitor 428 , and video recorder 430are essentially the same as the corresponding components of system 20 .
- the mouse 427 , monitor 428 , and video recorder 430are connected to computer console 424 .
- the graphics computer 426is connected to the computer console 424 via a computer network 429 such as an outside network permitting remote connection of the graphics computer.
- the computer network 429enables the graphics computer 426 to both receive image data from the computer console 424 and transmit the results of subsequent image data analysis to the computer console 424 . Accordingly, the graphics computer 426 can be located remotely from computer console 424 . Further, graphics computer 426 can be used to analyze image data received from more than one computer console.
- FIG. 1A method for generating interactive, three-dimensional renderings of a selected structure having a lumen and indicating potentially abnormal regions of the structure in accordance with the present invention is generally set forth in FIG. 1 .
- the methodcan be implemented by computer.
- the steps of patient preparation 32 , acquisition of two-dimensional images 33 , formation of a three-dimensional volume 34 , segmentation of a region of interest 35 , creation of an isosurface of the region of interest 37 a , and generation of a wireframe model of the isosurface 38 amay be effected in the general manner described in U.S. Pat. No. 5,782,762, which is incorporated herein by reference or any comparable methodologies and algorithms.
- the wireframe modelcan be generated at step 38 b after a surface model is identified at step 37 b from the three-dimensional volume formed at step 34 .
- Patient preparation 32will be dictated by the organ system to be examined. For example, if the patient's colon is to be examined, the patient is prepared using bowel cleansing and insufflation with gas to distend the colon. In one embodiment, a hand-operated air bulb may be used to distend the colon. The colon is inflated via a rectal catheter by squeezing the air bulb to instill puffs of room air into the colon.
- the colonmay be inflated with carbon dioxide (CO 2 ) or other gas, such as nitric oxide (NO), which exhibits a high lipid solubility and a high partial pressure gradient across the colonic mucosa.
- CO 2carbon dioxide
- NOnitric oxide
- the combination of properties provided by carbon dioxideresults in less uncomfortable abdominal symptoms for the patient following an examination.
- the high lipid solubility and high partial pressure gradient across the mucosamean that the carbon dioxide is quickly absorbed by the patient. Therefore, the pressure of carbon dioxide within the colon must be continually monitored and maintained at a beneficial level during the course of an examination.
- an electronic carbon dioxide insufflatorsuch as those currently used for laparoscopic surgery procedures, is preferably used to instill the carbon dioxide at a constant flow rate (e.g., 1-15 liters/min) until a preset pressure (e.g., 0.04 atm) is obtained.
- the insufflatorthen maintains a constant pressure during the course of the examination.
- the patientmay be placed on a low-residue diet for a 24 hour period preceding the collection of image data.
- the patientcan be given an oral contrast agent (barium-containing or iodine-containing mixture) to become incorporated in the fecal content to readily distinguish the stool from surrounding soft tissue structures, including the colon wall.
- the contrast agentmay be used in conjunction with a cathartic agent to rid the bowel of the bulk of stool.
- the opacified stoolmay then be digitally removed from the CT image data in order to render an unimpeded colon. Without adequate bowel cleansing or the use of an oral contrast agent, stool and normal colon wall or colon lesions may be indistinguishable in computed tomography or other imaging modalities.
- the contrast agentmay comprise a barium-containing mixture or an iodine-containing compound for opacifying solid or liquid stool.
- the patientcan be administered a bolus of non-ionic intravenous iodinated contrast agent to aid in distinguishing blood vessels from surrounding airways.
- two dimensional, cross-sectional images of the selected structureare acquired at step 33 with the use of a scanner 422 , such as a helical computed tomography (CT) scanner or magnetic resonance imaging (MRI) scanner.
- CTcomputed tomography
- MRImagnetic resonance imaging
- the two-dimensional imagesare arranged in computer memory 421 (i.e., random access memory (RAM)) to create a three-dimensional data volume at step 34 .
- RAMrandom access memory
- an interpolation methodincluding but not limited to trilinear interpolation, may be applied.
- a region of interestis segmented from the three-dimensional data volume.
- the purpose of segmentationis to isolate a region of interest within the three-dimensional data volume prior to three-dimensional rendering.
- medical image segmentationis complicated by image noise, partial volume effects, and the fact that similar intensity values are shared by different anatomical structures.
- segmentation of that structurecan be effectuated by selecting the gas column as the region of interest.
- the gas columncan be effectively segmented because the boundary between gas and soft tissue is relatively distinct and sharp. Further, the outside surface of the gas column corresponds to the inside surface of the organ of interest.
- a thin-walled soft tissue structureencompasses a contrast enhanced blood-filled lumen
- segmentation of that structurecan be effectuated by selecting the contrast-enhanced blood column as the region of interest. Accordingly, a simple thresholding or region growing technique, along with a morphological dilation away from air or blood vessel and towards soft tissue, can be utilized for segmentation purposes.
- segmentation procedurescan be employed.
- One such procedureadaptively adjusts the threshold value defining the region of interest to more accurately segment specific sections of the organ during a region growing process as described in U.S. Pat. No. 5,920,319 incorporated herein by reference.
- the accuracy of segmentationcan be improved by refining (or deforming) the wireframe model generated in steps 38 a and 38 b of FIG. 1 using a geometric deformable model (GDM) at step 40 b.
- GDMgeometric deformable model
- the segmentation step 35includes the step of digitally removing the opacified stool/water from the CT image data in order to render an unimpeded colon.
- Digital removal of opacified fecesis difficult due to the fact that simple digital subtraction leaves behind edge gradients.
- the appearance of edge gradientsis illustrated in FIGS. 15-17 .
- FIG. 15is a schematic representation of a section of image data representing hypothetical CT image data showing the measured X-ray attenuation values associated with a two dimensional array of voxels.
- Soft tissueis represented by a value of 100, opacified stool by a value of 200, and air by a value of 0.
- actual interfaces between different speciesis presumed to lie on the boundary between adjacent voxels. Accordingly, an interface 600 between soft tissue and opacified stool appears as the boundary between the voxels having a value of 100 and those having a value of 200. Similarly, an interface 601 between opacified stool and air appears as the boundary between the voxels having a value of 200 and those having a value of 0.
- FIG. 17The effect of a simple digital removal scheme, whereby all values that are 150 or greater are set to zero, on the section illustrated in FIG. 16 is shown in FIG. 17 . It is readily apparent that a ridge of voxels having a measured value of 90 is left behind and, therefore, will incorrectly be considered part of the soft tissue. In addition, although the true soft tissue/opacified stool interface lies somewhere within the voxels having a value of 120, the removal scheme automatically assumes that all of those voxels belong to the soft tissue. It will of course be appreciated that the edge effects encountered in real image data will be even more complex, due at least in part to inherent fluctuations in the measured values.
- an adaptive thresholding techniqueas previously described in U.S. Pat. No. 5,920,319
- a geometrically deformable model approachcan be used to model both the gas column and the adjacent stool.
- These 3D modelscan then be analyzed separately, or merged to create a contiguous colon model.
- the geometric deformable models initialized separately in the gas column and adjacent stoolcan be allowed to evolve until the boundaries of the two models merge.
- an isosurface of the region of interestis created at step 37 a .
- the isosurfacecan be generated using a variant of a marching cubes algorithm.
- the isosurfaceis used to generate a wireframe model at step 38 a .
- the wireframe modelcomprises a polygonal mesh that corresponds to the surface of the region of interest. Specifically, a plurality of vertices, each vertex having a coordinate position, are interconnected to produce the wireframe model.
- a waltzing cubes algorithmcan be employed as shown in FIG. 12 to first identify a surface model at step 37 b and then to generate a wireframe of the surface model at step 38 b without the help of initial segmentation 35 .
- the generated surfacecan be an isosurface, such as that produced by a marching cubes variant, or it can be a variable-thresholded surface.
- a voxel near the surface of interest within the volume of datais selected at step 500 .
- This selectioncan be automated or explicitly identified by the user.
- the first seed cell and its coordinateare identified at step 502 .
- a cellis defined as the junction of eight adjacent image voxels, four in an upper image plane and four in a lower image plane, such that the eight voxels form a 2 ⁇ 2 ⁇ 2 cubic cell.
- a cell coordinatedefines its exact location within the volume of data.
- the first seed cellis defined as any cell near the selected voxel that produces a surface patch belonging to the surface of interest. The first seed cell can be determined by iteratively examining all cells within an increasing radius centered on the selected voxel.
- each successive iterationexamines all cells that lie on the surface of a sphere centered on the selected voxel as the radius is increased, until the nearest surface patch producing cell is identified.
- This methodis accurate but computationally slow.
- cells that lie along each direction of each coordinate axisi.e. ⁇ X, X, ⁇ Y, Y, ⁇ Z, Z
- This methodis fast but requires a more exactly selected voxel.
- a seed queuestores coordinates of seed cells that are added and removed in subsequent steps.
- the seed queueis queried to see if it is empty. If the seed queue is empty, the waltzing cubes algorithm is terminated at step 520 , since all cells that may produce a connected surface patch of the surface of interest have been analyzed and processed. If it is not empty, then the algorithm proceeds to the next step, and the main loop of the algorithm is entered, because all of the cells which may produce a connected surface patch have not been analyzed. Note that at the start of the algorithm, the only seed coordinate in the seed queue is the first seed cell coordinate added at step 504 .
- a seed coordinateis removed from the seed queue.
- the waltzing cubes cell treeis queried for the corresponding seed cell.
- the cell treeidentifies, organizes and stores all cells within the volume of data that belong to the surface of interest. Additionally, the cell tree maintains cell-to-cell vertex coherency data to ensure that exactly one calculation is made for each shared vertex that lies along the edge between surface patches in two adjacent cells.
- the cell treeis structured to contain a set of buckets.
- a bucketis defined as a linear array of cells where subsequently added cells are appended at the end of the array.
- a bucket search for a particular cellis done in reverse order, starting with the cell at the end of the array and working back to the beginning.
- Alternative search algorithmssuch as binary search, can be used.
- the reverse order linear searchis optimal.
- Each bucket in the cell treerepresents all examined cells within a subset of the volume, called a cell block.
- the volumeis divided into cell blocks of optimal size, the size depending upon the ratio of surface patch producing cells to the total number of cells within the block. An increase in the volume size results in an increase in the number of blocks because the block size remains the same.
- a cell block size of 16 ⁇ 16 ⁇ 16 (4096 cells)is near optimal.
- step 512if the seed cell exists in the cell tree, it has been previously examined, so it is ignored, and the loop continues by returning to step 506 . If the seed cell does not exist in the cell tree, it has not yet been examined and processed, so it is inserted into the cell tree at step 514 .
- a surface patch comprised of triangle primitives for the seed cellis produced.
- the surface patchcan be generated by using the seed cell configuration and the corresponding triangulation table for that configuration.
- the triangulationcan be an isosurface patch that has been pre-constructed for each cell configuration and stored in a triangulation table.
- the triangulationcan be a variable-threshold surface patch that is created dynamically using local thresholds, adaptive thresholding or other criteria.
- the triangulation processuses the cell-to-cell vertex coherency data to reuse vertices computed by other cells and to create new vertices that are not yet computed.
- the triangulationmay produce surface patches that are contained entirely within the seed cell or that span the seed cell and its adjacent cells in the cell tree.
- the adjacent cell coordinatesare determined for the seed cell using the seed cell configuration and the corresponding adjacency table for that configuration.
- An adjacent cell coordinateis the cell coordinate for the corresponding cell that lies adjacent to the seed cell.
- Each seed cellhas up to 6 adjacent cells, and therefore, up to 6 adjacent cell coordinates.
- An adjacency tablecontains, for each seed cell configuration, a pre-analyzed list of adjacent cell coordinates that identify cells that each produce a surface patch that is connected to the surface patch produced by the seed cell. Each of these adjacent cell coordinates is used to query the cell tree to determine whether it has already been examined. If it has been examined, the adjacent cell coordinate is discarded. If it has not been examined, the adjacent cell coordinate is inserted into the seed queue.
- the algorithmloops back to step 506 . When the algorithm terminates at step 520 , a wireframe model of a complete surface is produced.
- the waltzing cubes methodenables the run-time memory required to create the surface of interest to be significantly reduced. Specifically, the memory required is directly proportional to the number of cells that must be analyzed. Since the waltzing cubes method divides the volume of data into cell blocks, entire buckets of cells may be pruned (deleted) once it is known that the cell data is no longer needed. Accordingly, since only those cells which produce surface patches that are a part of the surface of interest are examined, the waltzing cubes method typically examines a small fraction of the total number of cells within the volume, resulting in an algorithm that is fast and efficient.
- connectivity matricesare determined at step 39 .
- the connectivity matricesare data structures which provide information regarding the connectivity between the vertices and polygons which comprise the wireframe model.
- the connectivity matricesare determined by traversing the polygon and vertex lists associated with the wireframe model, generating sets of immediate neighbor vertices and triangles associated with each vertex and polygon in the lists.
- the vertex to polygon connectivity matrixcontains, for each vertex in the wireframe model, a list of all polygons that contain that vertex.
- a polygon to polygon matrixlists all adjacent polygons for each polygon in the model.
- the polygon list of the wireframe modelis then re-ordered.
- the polygons generated using the variant of marching cubesare usually added to, and as such ordered in, the polygon list as the three dimensional volume is traversed. Accordingly, all of the polygons between the first and second images are generated first, followed by the polygons between the second and third images, and so forth.
- This polygon orderingis not intuitive, nor ideal for analysis or manipulation of the geometry at the local connectivity level. Consequently, in order to group vertices into populations and to analyze the populations, it is advantageous to re-order the polygons into the sequence by which they would be encountered while “traveling” through the lumen of the wireframe model.
- the re-orderingfacilitates rapid three-dimensional renderings, since hidden objects or objects outside of the field-of-view can be easily identified and removed, thereby reducing the number of polygons rendered and thus increasing the rendering speed.
- a normal vectoris calculated for each vertex in the wireframe model at step 40 a of FIG. 1 .
- the direction of each normal vectoris perpendicular to a plane that is tangent to the isosurface at each such vertex, typically pointing away from the object or away from the lumen of a body organ.
- the normal vectors at the respective verticescan be computed as the average of the normal vectors associated with each polygon connected to that vertex.
- the normal vector associated with a polygonis calculated using a vector cross product.
- the wireframe modelis refined using a geometric deformable model at step 40 b .
- a geometric deformable modela surface is treated as a wave front that propagates in space over time until a targeted boundary is reached.
- each vertex of the wireframe modelis moved along its normal vector direction at a speed that is a function of both the surface curvature and the doubt (or confidence) level of a boundary estimate at that point.
- the surfaceevolves under this type of motion until the targeted boundary is reached, at which time the speed of motion approaches zero.
- S( 0 )is an initial smooth surface and S(t) is a one-parameter family of surfaces generated by wave front propagation, the surface S should satisfy the following flow equation:
- ⁇ ⁇ ⁇ S ⁇ ⁇ ⁇ t( ⁇ ⁇ ⁇ H - ⁇ ⁇ N ⁇ ) ⁇ N ⁇ ( 1 )
- Hdenotes the mean curvature
- ⁇ right arrow over (N) ⁇is a unit normal vector
- ⁇is a positive differentiable function defined in three-dimensional space that acts as a stopping function (i.e., ⁇ approaches zero as the surface nears the targeted boundary).
- a level-set techniquecan be used, such as the one proposed by Osher and Sethian in “Fronts propagation with curvature dependent speed: algorithms based on Hamilton-Jacobbi formulations”, J. Computational Physics, 1988, 79: 12-49, which is hereby incorporated by reference.
- the evolving family of surfaces S(t)is then generated from the level surface of an evolving family of scalar functions ⁇ (t).
- evolving contoursare treated as zero-level curves of the evolving function F.
- the net effect of shrinking the circular contourFIG. 3( a )
- the circular contourwill appear to split into two smaller segments.
- div ⁇ ( ⁇ ⁇ ⁇ ⁇ ⁇ ⁇ ⁇ )computes the mean curvature H of the embedded level surface from the scalar function ⁇ .
- the constant, vdetermines if the surface evolves inwardly or outwardly.
- the stopping function, ⁇can be defined as:
- G ⁇1 1 + ⁇ ⁇ ⁇ ⁇ ⁇ G ⁇ * I ⁇ ⁇
- G ⁇is a Gaussian filter whose characteristic width is ⁇ and * denotes a convolution operator. Images convoluted with the Gaussian filter before gradient computation are smoother and produce more accurate results. The purpose of the Gaussian filter is to smoothly force the evolution speed to zero at points where high intensity gradients exist.
- the stopping functioncan be characterized as a doubt function that approaches 0 when there is no doubt that the wave has reached a boundary and 1 otherwise. Using this characterization better stopping functions can be designed so that they incorporate not only edge gradient information, as in Eqn (2), but also other critical information such as noise model and scale level. Furthermore, Bayesian statistical models can be used to properly define the doubt function since many factors contribute to one's doubt (or confidence) about any point being on a boundary.
- the deformable model approachmay be applied to a low resolution dataset to produce an intermediate wireframe model.
- the intermediate wireframe modelis then translated to a higher resolution dataset.
- the deformable model approachcan be applied to a subsampled volume (e.g., one-eighth of the original volume of data) to produce an intermediate wireframe model without significantly affecting the shape of the rendered image.
- the intermediate wireframe modelis then applied as a starting point for processing of the complete volume of data.
- the wall thickness of the structure at each vertexis measured at step 41 .
- the wall thickness at a given vertexcan be determined by measuring the distance from the inner surface of the selected object to its outer surface or some other position between the inner and outer surfaces.
- the selected structure's wallis composed of soft tissue and the lumen of the structure comprises gas. Accordingly, the inner surface corresponds to a gas/soft tissue interface.
- the colon and airwaysare typically surrounded by fat, gas, or other non-soft tissue material (i.e., contrast-enhanced blood vessels, bone, or calcification).
- the outer surfacecorresponds to the soft tissue/gas, soft tissue/bone, soft tissue/fat, or other such interface.
- the X-ray attenuation factors for room air(approximately ⁇ 1024 HU to ⁇ 425 HU), fat (about ⁇ 200 HU to ⁇ 20 HU), and other non-soft tissue structures such as contrast-enhanced blood vessels and bone (approximately >100 HU) are distinct from the soft tissue component (about 20 HU to 100 HU) of the airways or colon wall.
- the wall thickness at a vertex on the wireframe modelcan be calculated from the volume data of the selected organ, which can be measured at regularly spaced intervals along each normal vector.
- wall thicknesscan be estimated by analyzing differential characteristics of the intensity profile along the normal direction. For example, the transition from gas-filled lumen to wall tissue and then from wall tissue to fat or other software tissue can be captured by finding the first two peaks in the gradient of the intensity profile.
- a wall thickness at a vertexcan be calculated by analyzing the intensity profile along the normal vector originated at the vertex.
- An intensity profile of a vectoris defined as an array of interpolated x-ray attenuation factors (voxel values) along regularly spaced intervals along a vector originating at the vertex.
- the analysis of the intensity profilemay include several heuristics depending upon the intensity profile type. One simple heuristic is to measure the thickness as the distance between the vertex and the point at which the attenuation factor drops below that of air ( ⁇ 425 HU) as seen in FIG. 6 a .
- Another heuristicis to measure the thickness as the distance between the vertex and the point at which the attenuation factor exceeds above that of soft tissue (60 HU) as seen in FIG. 6 b .
- Yet another heuristicis to measure the thickness as the distance between the vertex and the point at which there is a local minimum as seen in FIG. 6 c .
- These heuristicsare often too basic and are insufficient to accurately determine complex intensity profiles such as that in FIG. 6 d . Therefore, a more mathematical analysis of the intensity profile is required for accurate wall thickness calculation.
- the advanced analysisinclude differential characteristics of the intensity profile, discrete first/second/third degree gradiant profiles, polynomial curve fitting along the intensity profile and solutions to differential equations based on the curve, and other knowledge based methodology.
- a weighted combination of basic and advanced analysisis employed, and the results are averaged and normalized to reduce inaccuracies.
- the wall thickness at the vertex on the wireframe modelcan be calculated from the volume of data of the selected organ near the vertex.
- another approach to estimate wall thicknessis to classify the voxels in the vicinity of the segmented lumen surface into a small number of intensity groups. The shape of the resulting groups can be analyzed to determine the voxels that belong to wall and the wall thickness can then be estimated from these voxels.
- the wall thickness of body structures such as the colonmay be inadvertently or artificially increased, such as during musculature contraction of the colon at certain positions along the colon structure, many of the regions of abnormal thickness may not be indicative of true lesions. Instead, the thickened regions may represent normal structural elements, such as regions where the colon is contracted or where it touches solid organs. Accordingly, it can be beneficial to further analyze and characterize each vertex associated with abnormal thickness to refine the list of potentially abnormal vertices. Additional local shape features, computed at step 42 , can be used to characterize and associate vertices as being abnormal.
- a local convexity value at each of the surface verticescan be determined at step 42 .
- the local convexity valuescan be determined for all vertices, or for only those vertices associated with abnormal wall thickness.
- For each vertexits neighboring vertices within a connected neighborhood of a pre-determined size (e.g., 3), is determined using the connectivity matrices.
- a local convexity value for each vertex, vis computed as:
- Vertices associated with a convexity value of greater than a pre-defined maximumcan be considered abnormal.
- the local curvature at each vertex in a populationcan also be determined at step 42 .
- the curvaturereflects another shape feature of the object's surface at a given vertex. Vertices associated with broad curvatures indicate regions that are relatively flat. Accordingly, if the user wishes to identify only regions having thicknesses that vary significantly over short distances, those vertices with small curvatures may be labeled as abnormal.
- the local curvature at each vertex in a populationcan be determined by summing the scalar distance between each of a user-determined number of levels, N, of adjacent vertices and the plane perpendicular to the normal of the vertex. The result is then normalized by the surface area outlined by the N th level of adjacent vertices. Because the direction of the curvature is ignored, the technique is able to detect areas of small curvature.
- local curvaturecan be computed at each vertex from the wireframe model represented as a level surface.
- the mean curvature at each vertex of the wireframe modelis determined at step 550 .
- the mean curvature H (i.e., the average of the two principal curvatures) of the level surface ⁇is given by:
- This classification schemeenables the vertices to be grouped into patches having vertices having the same characteristic shape at step 556 . Since polyps protrude into the colon lumen, only elliptic patches are labeled as representing likely polyps at step 558 .
- elliptic patches that point outwardly from the colonare eliminated at step 560 using the signs of the two principle curvatures, k 1 and k 2 .
- vertices representing an abnormalityare selected. Those vertices meeting selected criteria can be identified as abnormal vertices. For example, vertices having abnormal thickness and/or convexity and/or curvature criteria may be identified as abnormal vertices.
- the wall thickness values, local convexity values, and local curvature valuescan be used, independently or in conjunction with each other, to either accept or reject vertices as being abnormal.
- the individual parameterscan be combined using a logical AND operation.
- the vertices on the wireframe model associated with abnormal structureare grouped into populations.
- the re-ordered connectivity matricesare used to determine if vertices associated with abnormal parameters are directly connected to other vertices that are also associated with abnormal parameters. Accordingly, each formed population represents a potential abnormal lesion.
- each populationcan be further analyzed and characterized by its size, dimensions, or other statistical quantities.
- a cross sectional area (CSA) of surface modelis defined as the area outlined by the contour formed by the interaction of the surface model 900 with an arbitrary CSA plane 902 as shown in FIG. 8 .
- the cross sectional area at the site of a lesionmay be used to calculate the degree of stenosis, or narrowing, caused by the lesion at that location.
- the cross sectional areamay also be used with a central path algorithm to determine areas of stenosis in a lumen of an organ.
- the surface modelis represented as a wireframe mesh of triangles. Using the connectivity matrices, all triangles in the wireframe which intersect the CSA plane are identified as shown in FIG. 9 a .
- edges of the triangle which intersects the CSA planeare identified, and intersecting vertex point between each edge and the CSA plane are computed.
- the set of these intersecting vertex pointsrepresents an approximation of the cross sectional area which is to be computed, and it is defined as the CSA contour.
- the CSA contourlies completely in the CSA plane as shown in FIG. 9 b .
- the CSA contour verticesare used to triangulate a set of adjacent triangles that span the entire contour. The triangulation may simply define the edges of each triangle as consecutive contour vertices as shown in FIG. 9 c . Alternatively, a centroid point for the contour may be computed and used for a more accurate triangulation as shown in FIG. 9 d . Because the generated triangles span the contour, the cross sectional area of the contour is simply defined as the sum of the areas of each triangle within the contour. This method is a numeric approximation that is sufficiently close to the true cross sectional area.
- Each populationis further analyzed according to aggregate shape features at step 46 to reduce the occurrence of false positive findings. Since the structure of body organs may appear abnormal, either inadvertently or artificially, such as during muscular contraction of the colon at certain positions along the colon's structure, many of the abnormal populations may not be indicative of true lesions. Instead, these populations may represent normal structural elements, such as regions where the colon is contracted or where it touches solid organs. Accordingly, it may be advantageous to further analyze and characterize each population identified as having an abnormal structure to further refine the list of potential lesions and to increase the likelihood that a detected population represents a true abnormality.
- the shapes of the populationscan be analyzed, characterized, and accepted or rejected as being abnormal as illustrated in detail in FIG. 2 .
- a centroid for each populationis calculated.
- the centroidcan be computed as a weighted sum of the positions of each vertex within the population.
- the individual verticescan be weighted by their associated wall thickness values or other parameters.
- a population normal vectoris calculated for each population at step 121 .
- the population normal vectorcan be computed as a sum of the normal vectors at each of the vertices within the population, and the individual vertex normal vectors can be weighted by their corresponding wall thickness values or other parameters.
- the convexity value, (C), for each populationis determined at step 122 .
- the convexityis a measure of the direction and magnitude of the shape of the surface of the population.
- the convexity of a populationis computed as the sum of the distances 94 from vertices 95 in the population to a plane 96 , perpendicular to the population normal vector 97 passing through the centroid 98 , according to the equation:
- the structureis a colon
- populations having a positive convexity value above a minimum valueare reasonably expected to be potential lesions, since some cancerous colon masses are generally manifested by steeply sloped growths that protrude into the lumen of the colon.
- the height (H) of each populationis determined at step 123 .
- the heightprovides an indication as to whether a population is reasonably expected to be a true lesion since populations with large heights are more likely to represent abnormal masses.
- the principal curvatures, k 1 and k 2can also be used to reduce the likelihood of false positive identifications.
- polypsare nearly symmetrical and, accordingly, patches representing true polyps are likely to arise when the two principal curvatures on the top of a potential lesion are similar.
- normal colon haustrahave ridge-like shapes and, therefore, potential lesions having principal curvatures, k 1 and k 2 , which are substantially different are eliminated as likely polyps at step 562 .
- shape featuresmay be used to include or exclude populations in the list of potential lesions. For example, if a population has a long axis dimension that is greater than a multiple (e.g., 10 times) of the short axis dimension, and the short axis dimension is, for example, less than 5 mm wide, then the population might be considered to be normal. Further, a potential lesions “roundness” could be quantified and used to rank potential lesions. Likewise, weighting wall thickness determinations with shape features may provide valuable heuristics for classifying potential lesions. Accordingly, the shape features discussed herein are included only by way of example, and are not intended to limit the scope of the invention.
- populations with abnormal wall structurei.e., wall thickness, convexity, or other shape features
- populations that fail to meet certain criteriaare eliminated as potential lesions at step 48 .
- those populations which are still considered to represent potential lesionsare sorted and arranged in an electronic listing.
- the listingcan be sorted according to such properties as size, convexity, curvature, height, mean wall thickness, standard deviation of wall thickness, other statistical quantities, or a combination of such parameters (e.g., the product of the group convexity value, C, and the group height value, H).
- Each population in the listingcould be linked to a three-dimensional camera position that best illustrates it in the three-dimensional display. Accordingly, the user can choose a population from the listing and thereby be presented with a view of the abnormal area as it appears in the three-dimensional rendering.
- One means of linking the population to a three-dimensional rendering camera positionis by providing the user with a three-dimensional camera view of the population that is parallel to the population normal and centered on the centroid of the population, and set at a chosen distance from the centroid.
- the useris presented with two views of the selected population, one from an external perspective and the other from an internal perspective (i.e., from within the lumen of the structure).
- Lesion locationseither identified manually by a user or by the above algorithms can also be used to generate lesion maps, i.e., two dimensional or three dimensional renderings of entire colon with lesion sites marked.
- a three-dimensional rendering of the wireframe modelis displayed at step 51 .
- the usercan navigate through a three-dimensional rendering of the wireframe model which is displayed on the monitor 28 .
- the detected abnormal populationsare displayed with a contrasting color scheme to distinguish them from the remainder of the rendered structure, so that the abnormal populations can be quickly and easily identified by human visual inspection.
- the color schemecan reflect variations in wall thickness, convexity, or curvature, or some other parameter.
- the normal portions of the rendered structurecan be displayed in shades of pink while the potentially abnormal populations are displayed in a rainbow of colors. More specifically, vertices could be assigned colors ranging from dark blue (for vertices with minimum abnormal thickness) to bright blue (for vertices with maximum abnormal wall thickness) to provide a stark contrast to the pinkish color assigned to the normal portions of the rendered structure.
- volume renderingis a visualization technique that creates a three-dimensional image using all of the volume data, rather than only an extracted surface representation.
- volume renderingis accomplished by projecting a series of rays from the user's viewpoint through the data volume.
- the color at each point (i.e., pixel) in the resulting three-dimensional imageis determined by calculating a weighted sum of all voxels along each ray. This weighting factor is determined by a transfer function that is computed during a process called classification.
- voxels belonging to a lesionmay be selectively enhanced with color and/or opacity values.
- volume datais considered to be a series of two-dimensional textures that are interpolated, projected, and displayed rapidly on a series of polygons using specialized computer hardware.
- the texture mapped volume rendering methoduses high-speed texture memory and blending hardware available on a Silicon Graphics' computer workstation to approximate the results of the more computationally expensive ray-casting algorithm.
- the volume datais first loaded into texture memory.
- the texturesare then semi-transparently mapped onto a series of parallel two-dimensional rectangles that correspond to slices of the volume.
- the texture mapped rectanglesare then drawn and blended to allow the user to see through the volume.
- the colors and transparencies of the resulting three-dimensional objectare controlled by color and opacity transfer functions.
- the entire volumecan then be viewed by stacking the texture mapped rectangles in the proper order and looking toward the stack. Since viewing the stack along one of its edges does not optimally display the volume, a new stack is generated which is orthogonal to the original stack.
- This new stackis then used to display the volume along an edge. Likewise, for any additional viewing angles, additional stacks may be required. Generating the stacks is a dynamic process and each stack can be generated on an as needed basis. Texture mapping can use standard two-dimensional texture memory or faster three-dimensional texture memory.
- the userupon selection of a population from the listing, can be presented with a three-dimensional, surface-rendered wireframe model of the population embedded within a volume-rendered display using texture memory techniques.
- texture memory techniquesSuch a display is useful to show the three-dimensional relationships between the wireframe model and the volume data.
- Embedding a surface-rendered model inside a volume renderingcan be accomplished using texture memory since both techniques use semi-transparent or opaque surfaces to generate their imagery. However, if the surface rendering is semi-transparent, care must be taken to ensure that all objects are blended in the proper order (typically, from back to front). All or part of the volume can be rendered.
- volume renderingFor example, to view a small structure using volume rendering, a subvolume of data surrounding that structure can be rendered, as opposed to displaying the entire volume of data.
- the point about which the subvolume rendering is performedcan be selected manually by the user, or automatically by the above algorithms. It should also be appreciated that the multiplanar views and volume rendering can be combined in a similar manner.
- each display windowcould render using different techniques (i.e., multiplanar display, surface rendering, volume rendering). Accordingly, the user could open a single window with all three rendering techniques and then clone the window three times to view each technique separately. Changes made to the data in any one of the connected windows would be propagated to all the cloned windows. Camera orientations could be synchronized between the separate windows to lock the views together. Position tracking techniques could show the camera position of one viewer in another, so that the user could follow the path of a three-dimensional camera moving inside the structure in one display window from an external perspective using a cloned display window with another three-dimensional camera from an overhead position.
- Position tracking techniquescould show the camera position of one viewer in another, so that the user could follow the path of a three-dimensional camera moving inside the structure in one display window from an external perspective using a cloned display window with another three-dimensional camera from an overhead position.
- FIG. 7An example of a computer console display 100 useful for displaying a three-dimensional rendering of a structure is shown in FIG. 7 .
- the display 100comprises a first window 101 for displaying a volume rendered image of the structure and a second window 102 for displaying a surface rendered image of the structure.
- the second window 102can display a surface rendered image of the structure embedded within a volume rendered display, as described above.
- three multiplanar windows, 103 , 104 , and 105are provided in a third window for displaying axial, coronal, sagittal, or oblique two-dimensional slices through the structure at a user-defined point, or at the centroid of a chosen population.
- a single window display 200can be used to display a three-dimensional rendering of the structure.
- the single window displaycomprises a single three-dimensional display window for presenting a combination of multiplanar images 203 , 204 and 205 with a volume-rendered image 207 centered on a point located within a surface-rendered image 209 .
- the displaypresents a holistic view of all the data that can aid in the visualization and understanding of the inter-relationships of the various rendering techniques (i.e., surface rendering, volume rendering, and intersecting two-dimensional planes).
- the various rendering techniquescan exist together because they are all based on the same patient coordinate system supplied by the image scanner, and they are all rendered using shared three-dimensional graphics techniques (texture memory) and a common graphics library.
- the intersecting planescan be rendered as opaque textures (as opposed to semi-transparent textures used in volume rendering) mapped onto two-dimensional rectangles using texture mapping and drawn in their proper orientation.
- the usercan interactively scroll through slices parallel to any of the intersecting planes and can view any combination of planes (e.g., axial and/or sagittal and/or coronal planes), or the user can create and view an oblique slice plane.
- the planescan be rendered together with the surface data to show the exact relationship between the wireframe model and the volume (by viewing the intersections and orientations of the surface rendered wireframe model and the two-dimensional slices). They can be viewed together because the planes are rendered as any other kind of surface (i.e., a flat, two-dimensional rectangle).
- the method and system of the present inventioncan also be used to guide needle biopsy procedures of diagnosed lesions as illustrated in FIG. 14 .
- One exampleis biopsy guidance of cancerous lymph nodes in patients with lung cancer via transbronchial needle aspirations (TBNA).
- TBNAtransbronchial needle aspirations
- the patient's airway, lymph nodes, blood vessels, and any cancerous massesare segmented and rendered in a three-dimensional display. The rendering is performed as described above.
- spherical “targets”can be manually placed within lesions at lesion locations previously identified on the multiplanar data images to indicate the position and approximate size and shape of the targeted object.
- irregular targetscan be modeled by having the user free-hand draw regions of interest on the multi-planar images from which three-dimensional targets can be rendered.
- each lymph node and cancerous mass which is to be biopsiedis labeled as a “targeted structure” at step 804 .
- a zone, or striking distance,is then defined around each of the targeted structures in step 806 .
- the zonerepresents a volume of space surrounding the targeted structure which is sufficiently close to the structure to enable a biopsy needle to reach the targeted structure and biopsy tissue from the targeted structure.
- blood vessels and other mediastinal tissuesmay be rendered. Rendering of the mediastinal tissues is performed because it is important to avoid puncturing major blood vessels during the needle biopsy procedure.
- An endoscopic biopsy proceduresuch as TBNA, is performed with the actual biopsy needle retracted within the instrument channel of an endoscope while the endoscope is inserted in the airway.
- the needleis extended into the target and then retracted back into the endoscope's instrument channel, hopefully containing a sample of tissue.
- doctorsoften make “blind” biopsies into tissue since they cannot visually see through an opaque organ, hence the purpose of computer-simulated guidance. “Striking distance” is defined as the maximum distance from the target that the endoscope tip can located in order to obtain an adequate sample when the needle is extended.
- this distanceshould be at most half the length of the needle—1 ⁇ 2 cm for a 1 cm needle-so that when the needle is extended a sample of at least 1 ⁇ 2 the needle length is obtained.
- both the scope's position and orientationmust be taken into account to decide if the needle will be able to effectively biopsy the target, otherwise, if the scope tip is within striking distance but pointed away from the target, then the extended needle will not hit the target. If the tip is not pointed directly at the target but is pointed at an oblique angle to the target, the needle may glance off the side of the target and not obtain an adequate tissue sample. And if the target's diameter is smaller than the needle length, there is a chance that the tip may completely penetrate the target and biopsy tissue on the other side of the target.
- the simulated endoscope containing a biopsy needle within its instrument tractis then inserted into and moved within the patient's airway at step 810 .
- the position of the tip of the needleis monitored at step 812 .
- the monitoringcan be done either on a continuous basis or intermittently. If desired, the movement of the simulated endoscope tip through the airway can be recorded and documented at step 811 .
- a rendered image of the needle tip within the rendered imageis displayed at step 814 . Accordingly, the physician performing the biopsy procedure can visually monitor the movement of the simulated needle through the airway in relation to surrounding anatomy. In order to more realistically simulate the view that would be obtained using a conventional bronchoscope, the displayed image can be altered to reflect the distorted camera view of conventional bronchoscopes. In addition to displaying a rendered image of the simulated needle tip within the airway, an external view of the airway showing the position and orientation of the needle can be simultaneously displayed.
- step 816it is determined whether the needle tip is within the zone, or within striking distance, of a targeted structure. If the needle tip is not within the striking distance of a targeted structure, then the distance and trajectory for the needle to reach a targeted structure is determined at step 818 . The needle is then repositioned within the airway at step 810 using the calculated trajectory and distance as a guide for the movement of the needle.
- a ready-to-strike target proximity indicatoris issued at step 820 .
- the indicatorserves to signal the physician to biopsy the targeted structure, at step 822 .
- target proximity indicatorsThere are four types of target proximity indicators: (1) “getting close” indicator that increases in intensity as the endoscope tip approaches the target, (2) “strike zone” indicator that tells when the endoscope tip is within striking distance of the target and in the proper orientation to obtain an adequate tissue sample, (3) “too close” indicator that signals when the scope tip is too close to the target, and (4) “close, but no cigar” indicator that tells when tip is close enough to strike but is not pointing in the right direction for obtaining a good sample.
- a fifth type or alarmcan be activated when the needle is in danger of penetrating vital organs near the target and putting the patient at risk.
Landscapes
- Engineering & Computer Science (AREA)
- Health & Medical Sciences (AREA)
- Medical Informatics (AREA)
- Physics & Mathematics (AREA)
- Life Sciences & Earth Sciences (AREA)
- General Health & Medical Sciences (AREA)
- Public Health (AREA)
- General Physics & Mathematics (AREA)
- Theoretical Computer Science (AREA)
- Nuclear Medicine, Radiotherapy & Molecular Imaging (AREA)
- Radiology & Medical Imaging (AREA)
- Biomedical Technology (AREA)
- Pathology (AREA)
- Computer Graphics (AREA)
- Epidemiology (AREA)
- Veterinary Medicine (AREA)
- Primary Health Care (AREA)
- Surgery (AREA)
- Molecular Biology (AREA)
- Heart & Thoracic Surgery (AREA)
- Software Systems (AREA)
- Biophysics (AREA)
- Animal Behavior & Ethology (AREA)
- Data Mining & Analysis (AREA)
- Computer Vision & Pattern Recognition (AREA)
- Computer Hardware Design (AREA)
- Architecture (AREA)
- Databases & Information Systems (AREA)
- Geometry (AREA)
- Quality & Reliability (AREA)
- General Engineering & Computer Science (AREA)
- Human Computer Interaction (AREA)
- High Energy & Nuclear Physics (AREA)
- Optics & Photonics (AREA)
- Apparatus For Radiation Diagnosis (AREA)
- Magnetic Resonance Imaging Apparatus (AREA)
- Image Processing (AREA)
Abstract
Description
where H denotes the mean curvature, {right arrow over (N)} is a unit normal vector, and φ is a positive differentiable function defined in three-dimensional space that acts as a stopping function (i.e., φ approaches zero as the surface nears the targeted boundary).
The divergence operator
computes the mean curvature H of the embedded level surface from the scalar function Ψ. The constant, v, determines if the surface evolves inwardly or outwardly. The stopping function, φ, can be defined as:
where Gσis a Gaussian filter whose characteristic width is σ and * denotes a convolution operator. Images convoluted with the Gaussian filter before gradient computation are smoother and produce more accurate results. The purpose of the Gaussian filter is to smoothly force the evolution speed to zero at points where high intensity gradients exist.
wherein D(v1) is the distance from the ithneighboring vertex to a plane through v and perpendicular to v's normal vector, and n is the number of neighboring vertices. Vertices associated with a convexity value of greater than a pre-defined maximum (e.g., >2) can be considered abnormal.
The Gaussian curvature K is similarly determined according to the equation at step552:
Each vertex of the wireframe model can be classified as one of four types at
wherein D(vi) is the distance from the ithvertex of the population to the
H=MAXD(vi)−MIND(vi)
The height provides an indication as to whether a population is reasonably expected to be a true lesion since populations with large heights are more likely to represent abnormal masses.
Claims (51)
Applications Claiming Priority (2)
| Application Number | Priority Date | Filing Date | Title |
|---|---|---|---|
| US10996698P | 1998-11-25 | 1998-11-25 | |
| PCT/US1999/028030WO2000032106A1 (en) | 1998-07-02 | 1999-11-24 | Virtual endoscopy with improved image segmentation and lesion detection |
Related Parent Applications (1)
| Application Number | Title | Priority Date | Filing Date |
|---|---|---|---|
| PCT/US1999/028030A-371-Of-InternationalWO2000032106A1 (en) | 1997-02-25 | 1999-11-24 | Virtual endoscopy with improved image segmentation and lesion detection |
Related Child Applications (1)
| Application Number | Title | Priority Date | Filing Date |
|---|---|---|---|
| US12/826,268ContinuationUS8682045B2 (en) | 1997-02-25 | 2010-06-29 | Virtual endoscopy with improved image segmentation and lesion detection |
Publications (1)
| Publication Number | Publication Date |
|---|---|
| US7747055B1true US7747055B1 (en) | 2010-06-29 |
Family
ID=22330546
Family Applications (1)
| Application Number | Title | Priority Date | Filing Date |
|---|---|---|---|
| US09/856,683Expired - Fee RelatedUS7747055B1 (en) | 1998-11-25 | 1999-11-24 | Virtual endoscopy with improved image segmentation and lesion detection |
Country Status (4)
| Country | Link |
|---|---|
| US (1) | US7747055B1 (en) |
| EP (4) | EP2302595A3 (en) |
| AU (1) | AU759501B2 (en) |
| CA (1) | CA2352671A1 (en) |
Cited By (43)
| Publication number | Priority date | Publication date | Assignee | Title |
|---|---|---|---|---|
| US20050131581A1 (en)* | 2003-09-19 | 2005-06-16 | Sony Corporation | Environment recognizing device, environment recognizing method, route planning device, route planning method and robot |
| US20060001664A1 (en)* | 2004-04-19 | 2006-01-05 | Carbonera Carlos D | System and method for smoothing three dimensional images |
| US20060025674A1 (en)* | 2004-08-02 | 2006-02-02 | Kiraly Atilla P | System and method for tree projection for detection of pulmonary embolism |
| US20070297662A1 (en)* | 2006-01-12 | 2007-12-27 | Walter Marzendorfer | Method and apparatus for virtual bowel cleaning |
| US20080228067A1 (en)* | 2005-10-21 | 2008-09-18 | Koninklijke Philips Electronics N.V. | Rendering Method and Apparatus |
| US20080303818A1 (en)* | 2007-06-08 | 2008-12-11 | Yoshiyuki Moriya | Medical image display apparatus and program, and recording medium therefor |
| US20080317321A1 (en)* | 2007-06-25 | 2008-12-25 | Hui Zhang | High quality volume rendering with graphics processing unit |
| US20090196476A1 (en)* | 2006-08-08 | 2009-08-06 | Olympus Medical Systems Corp. | Medical image processing device and medical image processing method |
| US20090303507A1 (en)* | 2008-06-06 | 2009-12-10 | Virginia Venture Industries, Llc | Methods and apparatuses for printing three dimensional images |
| US20100061597A1 (en)* | 2007-06-05 | 2010-03-11 | Olympus Corporation | Image processing device, image processing program and image processing method |
| US20100201880A1 (en)* | 2007-04-13 | 2010-08-12 | Pioneer Corporation | Shot size identifying apparatus and method, electronic apparatus, and computer program |
| US20100316270A1 (en)* | 2007-12-20 | 2010-12-16 | Koninklijke Philips Electronics N.V. | 3d reconstruction of a body and of a body contour |
| US20110135181A1 (en)* | 2008-08-26 | 2011-06-09 | Jiayong Yan | polynomial fitting based segmentation algorithm for pulmonary nodule in chest radiograph |
| US20110144785A1 (en)* | 2007-01-18 | 2011-06-16 | Carbonera Carlos D | System and method for generating instructions for customization |
| US20110213482A1 (en)* | 2010-02-25 | 2011-09-01 | Tim Saarela | Method for digital manufacturing of jewelry items |
| US20110225542A1 (en)* | 2010-03-09 | 2011-09-15 | Microsoft Corporation | Application sharing with occlusion removal |
| US20110235882A1 (en)* | 2006-09-29 | 2011-09-29 | Koninklijke Philips Electronics N.V. | Methods, system and computer program product for detecting a protrusion |
| US20110243409A1 (en)* | 2008-12-04 | 2011-10-06 | Real Imaging Ltd. | Method apparatus and system for determining a thermal signature |
| US20110242097A1 (en)* | 2010-03-31 | 2011-10-06 | Fujifilm Corporation | Projection image generation method, apparatus, and program |
| US8157742B2 (en) | 2010-08-12 | 2012-04-17 | Heartflow, Inc. | Method and system for patient-specific modeling of blood flow |
| US8200466B2 (en) | 2008-07-21 | 2012-06-12 | The Board Of Trustees Of The Leland Stanford Junior University | Method for tuning patient-specific cardiovascular simulations |
| US8249815B2 (en) | 2010-08-12 | 2012-08-21 | Heartflow, Inc. | Method and system for patient-specific modeling of blood flow |
| US20120278711A1 (en)* | 2003-09-16 | 2012-11-01 | Labtest International, Inc. D/B/A Intertek Consumer Goods North America | Haptic response system and method of use |
| US8515713B2 (en) | 2007-03-12 | 2013-08-20 | Jostens, Inc. | System and method for embellishment placement |
| US8548778B1 (en) | 2012-05-14 | 2013-10-01 | Heartflow, Inc. | Method and system for providing information from a patient-specific model of blood flow |
| US20130328874A1 (en)* | 2012-06-06 | 2013-12-12 | Siemens Medical Solutions Usa, Inc. | Clip Surface for Volume Rendering in Three-Dimensional Medical Imaging |
| USRE44696E1 (en) | 2002-12-10 | 2014-01-07 | Jostens, Inc. | Automated engraving of a customized jewelry item |
| US8839112B2 (en) | 2010-08-10 | 2014-09-16 | Microsoft Corporation | Cloning or extending a computer desktop on a wireless display surface |
| US9208265B2 (en) | 2011-12-02 | 2015-12-08 | Jostens, Inc. | System and method for jewelry design |
| WO2016033405A1 (en)* | 2014-08-28 | 2016-03-03 | Mela Sciences, Inc. | Three dimensional tissue imaging system and method |
| US20160292875A1 (en)* | 2013-12-19 | 2016-10-06 | Olympus Corporation | Image processing apparatus, image processing method, and computer-readable recording medium |
| US20170011516A1 (en)* | 2014-02-12 | 2017-01-12 | Koninklijke Philips N.V. | Systems for monitoring lesion size trends and methods of operation thereof |
| US9582615B2 (en) | 2013-01-16 | 2017-02-28 | Jostens, Inc. | Modeling using thin plate spline technology |
| USD789228S1 (en) | 2013-11-25 | 2017-06-13 | Jostens, Inc. | Bezel for a ring |
| US20190026953A1 (en)* | 2016-05-16 | 2019-01-24 | Hewlett-Packard Development Company, L.P. | Generating a shape profile for a 3d object |
| US10354050B2 (en) | 2009-03-17 | 2019-07-16 | The Board Of Trustees Of Leland Stanford Junior University | Image processing method for determining patient-specific cardiovascular information |
| US10515452B2 (en)* | 2014-04-24 | 2019-12-24 | Koninklijke Philips N.V. | System for monitoring lesion size trends and methods of operation thereof |
| CN110867233A (en)* | 2019-11-19 | 2020-03-06 | 西安邮电大学 | System and method for generating electronic laryngoscopy medical test reports |
| CN110990943A (en)* | 2019-11-13 | 2020-04-10 | 上海航天控制技术研究所 | Singular point judgment method based on singular geometric meaning of control moment gyro group |
| CN114049934A (en)* | 2021-11-10 | 2022-02-15 | 富士胶片(中国)投资有限公司 | Auxiliary diagnosis method, device, system, equipment and medium |
| US11481969B2 (en)* | 2017-12-13 | 2022-10-25 | Covidien Lp | Systems, methods, and computer-readable media for automatic computed tomography to computed tomography registration |
| US20240020935A1 (en)* | 2022-07-15 | 2024-01-18 | The Boeing Company | Modeling system for 3d virtual model |
| US12232744B2 (en) | 2019-07-15 | 2025-02-25 | Stryker Corporation | Robotic hand-held surgical instrument systems and methods |
Families Citing this family (1)
| Publication number | Priority date | Publication date | Assignee | Title |
|---|---|---|---|---|
| CN112084853B (en)* | 2020-08-04 | 2023-12-29 | 深圳市优必选科技股份有限公司 | Footprint prediction method, footprint prediction device and humanoid robot |
Citations (107)
| Publication number | Priority date | Publication date | Assignee | Title |
|---|---|---|---|---|
| US4243652A (en) | 1978-07-14 | 1981-01-06 | The Procter & Gamble Company | Gastrointestinal scanning agent |
| US4315309A (en) | 1979-06-25 | 1982-02-09 | Coli Robert D | Integrated medical test data storage and retrieval system |
| US4367216A (en) | 1979-06-28 | 1983-01-04 | Schering Aktiengesellschaft | Triiodinated 5-aminoisophthalic acid derivatives |
| US4391280A (en) | 1980-04-04 | 1983-07-05 | Miller Roscoe E | Enema apparata improvements relating to double contrast studies |
| US4630203A (en) | 1983-12-27 | 1986-12-16 | Thomas Szirtes | Contour radiography: a system for determining 3-dimensional contours of an object from its 2-dimensional images |
| US4668915A (en) | 1985-03-15 | 1987-05-26 | Honda Giken Kogyo Kabushiki Kaisha | Non-uniform field magnetic resonance dual patient imaging system |
| EP0231950A2 (en) | 1986-02-07 | 1987-08-12 | Fuji Photo Film Co., Ltd. | Method of nonlinear A/D conversion |
| US4710876A (en) | 1985-06-05 | 1987-12-01 | General Electric Company | System and method for the display of surface structures contained within the interior region of a solid body |
| US4719585A (en) | 1985-08-28 | 1988-01-12 | General Electric Company | Dividing cubes system and method for the display of surface structures contained within the interior region of a solid body |
| US4729098A (en)* | 1985-06-05 | 1988-03-01 | General Electric Company | System and method employing nonlinear interpolation for the display of surface structures contained within the interior region of a solid body |
| US4737921A (en) | 1985-06-03 | 1988-04-12 | Dynamic Digital Displays, Inc. | Three dimensional medical image display system |
| US4751643A (en) | 1986-08-04 | 1988-06-14 | General Electric Company | Method and apparatus for determining connected substructures within a body |
| US4791567A (en) | 1986-09-15 | 1988-12-13 | General Electric Company | Three dimensional connectivity system employing an equivalence schema for determining connected substructures within a body |
| US4821213A (en) | 1986-12-19 | 1989-04-11 | General Electric Co. | System for the simultaneous display of two or more internal surfaces within a solid object |
| US4823129A (en) | 1987-02-24 | 1989-04-18 | Bison Instruments, Inc. | Analog-to-digital converter |
| US4831528A (en) | 1987-11-09 | 1989-05-16 | General Electric Company | Apparatus and method for improvement of 3D images derived from tomographic data |
| US4879668A (en) | 1986-12-19 | 1989-11-07 | General Electric Company | Method of displaying internal surfaces of three-dimensional medical images |
| US4958932A (en) | 1988-08-18 | 1990-09-25 | Mcdonnell Douglas Corporation | Optical measuring apparatus |
| US4984157A (en) | 1988-09-21 | 1991-01-08 | General Electric Company | System and method for displaying oblique planar cross sections of a solid body using tri-linear interpolation to determine pixel position dataes |
| US4985834A (en) | 1988-11-22 | 1991-01-15 | General Electric Company | System and method employing pipelined parallel circuit architecture for displaying surface structures of the interior region of a solid body |
| US4993415A (en) | 1988-08-19 | 1991-02-19 | Alliance Pharmaceutical Corp. | Magnetic resonance imaging with perfluorocarbon hydrides |
| US5006109A (en) | 1989-09-12 | 1991-04-09 | Donald D. Douglas | Method and device for controlling pressure, volumetric flow rate and temperature during gas insuffication procedures |
| US5023072A (en) | 1988-08-10 | 1991-06-11 | University Of New Mexico | Paramagnetic/superparamagnetic/ferromagnetic sucrose sulfate compositions for magnetic resonance imaging of the gastrointestinal tract |
| US5038302A (en) | 1988-07-26 | 1991-08-06 | The Research Foundation Of State University Of New York | Method of converting continuous three-dimensional geometrical representations into discrete three-dimensional voxel-based representations within a three-dimensional voxel-based system |
| US5047772A (en) | 1990-06-04 | 1991-09-10 | General Electric Company | Digital error correction system for subranging analog-to-digital converters |
| US5056020A (en) | 1988-09-16 | 1991-10-08 | General Electric Cge Sa | Method and system for the correction of image defects of a scanner due to the movements of the latter |
| US5115501A (en) | 1988-11-04 | 1992-05-19 | International Business Machines Corporation | Procedure for automatically customizing the user interface of application programs |
| US5127037A (en) | 1990-08-15 | 1992-06-30 | Bynum David K | Apparatus for forming a three-dimensional reproduction of an object from laminations |
| US5148366A (en) | 1989-10-16 | 1992-09-15 | Medical Documenting Systems, Inc. | Computer-assisted documentation system for enhancing or replacing the process of dictating and transcribing |
| US5166876A (en) | 1991-01-16 | 1992-11-24 | General Electric Company | System and method for detecting internal structures contained within the interior region of a solid object |
| US5170347A (en) | 1987-11-27 | 1992-12-08 | Picker International, Inc. | System to reformat images for three-dimensional display using unique spatial encoding and non-planar bisectioning |
| US5187658A (en) | 1990-01-17 | 1993-02-16 | General Electric Company | System and method for segmenting internal structures contained within the interior region of a solid object |
| US5204625A (en) | 1990-12-20 | 1993-04-20 | General Electric Company | Segmentation of stationary and vascular surfaces in magnetic resonance imaging |
| US5229935A (en) | 1989-07-31 | 1993-07-20 | Kabushiki Kaisha Toshiba | 3-dimensional image display apparatus capable of displaying a 3-D image by manipulating a positioning encoder |
| US5235510A (en) | 1990-11-22 | 1993-08-10 | Kabushiki Kaisha Toshiba | Computer-aided diagnosis system for medical use |
| US5265012A (en) | 1989-06-12 | 1993-11-23 | Commissariat A L'energie Atomique | Method to determine a space from a known discrete space for the reconstruction of bidimensional or tridimensional images, as well as a device to implement and apply the method |
| US5270926A (en) | 1990-12-21 | 1993-12-14 | General Electric Company | Method and apparatus for reconstructing a three-dimensional computerized tomography (CT) image of an object from incomplete cone beam projection data |
| US5283837A (en) | 1991-08-27 | 1994-02-01 | Picker International, Inc. | Accurate estimation of surface normals in 3-D data sets |
| US5295488A (en) | 1992-08-05 | 1994-03-22 | General Electric Company | Method and apparatus for projecting diagnostic images from volumed diagnostic data |
| US5299288A (en) | 1990-05-11 | 1994-03-29 | International Business Machines Corporation | Image-directed robotic system for precise robotic surgery including redundant consistency checking |
| US5313567A (en) | 1991-06-13 | 1994-05-17 | At&T Bell Laboratories | Arrangement for determining and displaying volumetric data in an imaging system |
| US5322070A (en) | 1992-08-21 | 1994-06-21 | E-Z-Em, Inc. | Barium enema insufflation system |
| US5339812A (en) | 1988-12-23 | 1994-08-23 | Medical Instrumentation And Diagnostic Corporation | Three-dimensional computer graphics simulation and computerized numerical optimization for dose delivery and treatment planning |
| US5345490A (en) | 1991-06-28 | 1994-09-06 | General Electric Company | Method and apparatus for converting computed tomography (CT) data into finite element models |
| US5365927A (en) | 1993-11-02 | 1994-11-22 | General Electric Company | Magnetic resonance imaging system with pointing device |
| US5412763A (en) | 1990-05-25 | 1995-05-02 | General Electric Cgr S.A. | Method for displaying an image of a portion of the inside of a three-dimensional physical structure |
| US5412563A (en) | 1993-09-16 | 1995-05-02 | General Electric Company | Gradient image segmentation method |
| US5437278A (en) | 1992-01-10 | 1995-08-01 | Wilk; Peter J. | Medical diagnosis system and method |
| US5452416A (en) | 1992-12-30 | 1995-09-19 | Dominator Radiology, Inc. | Automated system and a method for organizing, presenting, and manipulating medical images |
| US5463548A (en) | 1990-08-28 | 1995-10-31 | Arch Development Corporation | Method and system for differential diagnosis based on clinical and radiological information using artificial neural networks |
| US5506984A (en) | 1993-06-30 | 1996-04-09 | Digital Equipment Corporation | Method and system for data retrieval in a distributed system using linked location references on a plurality of nodes |
| US5517602A (en)* | 1992-12-03 | 1996-05-14 | Hewlett-Packard Company | Method and apparatus for generating a topologically consistent visual representation of a three dimensional surface |
| GB2265775B (en) | 1992-03-30 | 1996-06-12 | Hughes Aircraft Co | Feed forward predictive analog-to-digital converter |
| US5528492A (en) | 1991-09-06 | 1996-06-18 | Kabushiki Kaisha Toshiba | Method of managing medical diagnostic data with reference relationship |
| US5542003A (en) | 1993-09-13 | 1996-07-30 | Eastman Kodak | Method for maximizing fidelity and dynamic range for a region of interest within digitized medical image display |
| US5581671A (en) | 1993-10-18 | 1996-12-03 | Hitachi Medical Corporation | Method and apparatus for moving-picture display of three-dimensional images |
| US5581460A (en) | 1990-11-06 | 1996-12-03 | Kabushiki Kaisha Toshiba | Medical diagnostic report forming apparatus capable of attaching image data on report |
| US5587833A (en) | 1993-07-09 | 1996-12-24 | Compucyte Corporation | Computerized microscope specimen encoder |
| US5608849A (en)* | 1991-08-27 | 1997-03-04 | King, Jr.; Donald | Method of visual guidance for positioning images or data in three-dimensional space |
| US5611025A (en) | 1994-11-23 | 1997-03-11 | General Electric Company | Virtual internal cavity inspection system |
| US5623586A (en) | 1991-05-25 | 1997-04-22 | Hoehne; Karl-Heinz | Method and device for knowledge based representation and display of three dimensional objects |
| US5630034A (en) | 1994-04-05 | 1997-05-13 | Hitachi, Ltd. | Three-dimensional image producing method and apparatus |
| US5666400A (en) | 1994-07-07 | 1997-09-09 | Bell Atlantic Network Services, Inc. | Intelligent recognition |
| US5704367A (en) | 1995-03-28 | 1998-01-06 | Nihon Kohden Corporation | Respiration monitor for monitoring respiration based upon an image signal of a facial region |
| US5715449A (en) | 1994-06-20 | 1998-02-03 | Oceania, Inc. | Method for generating structured medical text through user selection of displayed text and rules |
| US5740267A (en) | 1992-05-29 | 1998-04-14 | Echerer; Scott J. | Radiographic image enhancement comparison and storage requirement reduction system |
| US5742291A (en) | 1995-05-09 | 1998-04-21 | Synthonics Incorporated | Method and apparatus for creation of three-dimensional wire frames |
| US5762608A (en) | 1987-05-15 | 1998-06-09 | Hologic, Inc. | Scanning x-ray imaging system with rotating c-arm |
| US5779634A (en) | 1991-05-10 | 1998-07-14 | Kabushiki Kaisha Toshiba | Medical information processing system for supporting diagnosis |
| US5782762A (en)* | 1994-10-27 | 1998-07-21 | Wake Forest University | Method and system for producing interactive, three-dimensional renderings of selected body organs having hollow lumens to enable simulated movement through the lumen |
| US5793969A (en) | 1993-07-09 | 1998-08-11 | Neopath, Inc. | Network review and analysis of computer encoded slides |
| US5807256A (en) | 1993-03-01 | 1998-09-15 | Kabushiki Kaisha Toshiba | Medical information processing system for supporting diagnosis |
| US5825908A (en) | 1995-12-29 | 1998-10-20 | Medical Media Systems | Anatomical visualization and measurement system |
| EP0514587B1 (en) | 1991-05-24 | 1999-02-03 | Samsung Electronics Co., Ltd. | A process of linearizing non-linear analog-to-digital conversion the process and circuit for performing |
| US5878746A (en) | 1993-08-25 | 1999-03-09 | Lemelson; Jerome H. | Computerized medical diagnostic system |
| US5891030A (en) | 1997-01-24 | 1999-04-06 | Mayo Foundation For Medical Education And Research | System for two dimensional and three dimensional imaging of tubular structures in the human body |
| US5898793A (en) | 1993-04-13 | 1999-04-27 | Karron; Daniel | System and method for surface rendering of internal structures within the interior of a solid object |
| US5898760A (en) | 1997-03-05 | 1999-04-27 | Bellsouth Corporation | Method and apparatus for automating the management of a database |
| US5920317A (en) | 1996-06-11 | 1999-07-06 | Vmi Technologies Incorporated | System and method for storing and displaying ultrasound images |
| US5920319A (en)* | 1994-10-27 | 1999-07-06 | Wake Forest University | Automatic analysis in virtual endoscopy |
| US5957138A (en) | 1997-08-25 | 1999-09-28 | Diasonics Ultrasound, Inc. | Method and apparatus for three-dimensional flow lumen imaging |
| US5971767A (en) | 1996-09-16 | 1999-10-26 | The Research Foundation Of State University Of New York | System and method for performing a three-dimensional virtual examination |
| US5986662A (en) | 1996-10-16 | 1999-11-16 | Vital Images, Inc. | Advanced diagnostic viewer employing automated protocol selection for volume-rendered imaging |
| US6014581A (en) | 1998-03-26 | 2000-01-11 | Ep Technologies, Inc. | Interface for performing a diagnostic or therapeutic procedure on heart tissue with an electrode structure |
| US6058322A (en) | 1997-07-25 | 2000-05-02 | Arch Development Corporation | Methods for improving the accuracy in differential diagnosis on radiologic examinations |
| US6117073A (en) | 1998-03-02 | 2000-09-12 | Jones; Scott J. | Integrated emergency medical transportation database system |
| WO2001011548A1 (en) | 1999-08-09 | 2001-02-15 | Wake Forest University | A method and computer-implemented procedure for creating electronic, multimedia reports |
| US6246784B1 (en)* | 1997-08-19 | 2001-06-12 | The United States Of America As Represented By The Department Of Health And Human Services | Method for segmenting medical images and detecting surface anomalies in anatomical structures |
| US6252979B1 (en) | 1995-06-07 | 2001-06-26 | Tripath Imaging, Inc. | Interactive method and apparatus for sorting biological specimens |
| JP3184327B2 (en) | 1991-09-06 | 2001-07-09 | キヤノン株式会社 | Three-dimensional graphics processing method and apparatus |
| US6282305B1 (en) | 1998-06-05 | 2001-08-28 | Arch Development Corporation | Method and system for the computerized assessment of breast cancer risk |
| US6292577B1 (en) | 1997-05-27 | 2001-09-18 | Mitsubishi Denki Kabsuhiki Kaisha | Resemblance retrieval apparatus, and recording medium for recording resemblance retrieval program |
| US20010025279A1 (en) | 1999-12-16 | 2001-09-27 | Lora Krulak | Method and system for planning customized menu |
| US6317617B1 (en) | 1997-07-25 | 2001-11-13 | Arch Development Corporation | Method, computer program product, and system for the automated analysis of lesions in magnetic resonance, mammogram and ultrasound images |
| US20020004798A1 (en) | 1998-11-25 | 2002-01-10 | Deborah Ann Babula | Centralized medical diagnostic system service method and apparatus |
| US6366683B1 (en) | 1999-03-16 | 2002-04-02 | Curtis P. Langlotz | Apparatus and method for recording image analysis information |
| US6389157B2 (en)* | 1997-08-28 | 2002-05-14 | Qualia Computing, Inc. | Joint optimization of parameters for the detection of clustered microcalcifications in digital mammograms |
| US6415048B1 (en) | 1993-10-12 | 2002-07-02 | Schneider Medical Technologies, Inc. | Compositional analysis system |
| US6490370B1 (en) | 1999-01-28 | 2002-12-03 | Koninklijke Philips Electronics N.V. | System and method for describing multimedia content |
| AU757981B2 (en) | 1997-02-25 | 2003-03-13 | Wake Forest University | Automatic analysis in virtual endoscopy |
| US6551243B2 (en) | 2001-01-24 | 2003-04-22 | Siemens Medical Solutions Health Services Corporation | System and user interface for use in providing medical information and health care delivery support |
| US6630937B2 (en) | 1997-10-30 | 2003-10-07 | University Of South Florida | Workstation interface for use in digital mammography and associated methods |
| US6694163B1 (en)* | 1994-10-27 | 2004-02-17 | Wake Forest University Health Sciences | Method and system for producing interactive, three-dimensional renderings of selected body organs having hollow lumens to enable simulated movement through the lumen |
| US6813373B1 (en)* | 2001-04-03 | 2004-11-02 | Koninklijke Philips Electronics, N.V. | Image segmentation of embedded shapes using constrained morphing |
| US6879668B2 (en) | 2002-05-01 | 2005-04-12 | Sbc Technology Resources, Inc. | System and method for communicating with an out of service telephone number |
| CN1239253C (en) | 2001-08-29 | 2006-02-01 | 日本酸素株式会社 | Adsorbent for separating nitrogen from oxygen-nitrogen mixed gas and method for producing nitrogen using the same |
| US7289651B2 (en) | 1999-08-09 | 2007-10-30 | Wake Forest University Health Science | Image reporting method and system |
- 1999
- 1999-11-24CACA002352671Apatent/CA2352671A1/ennot_activeAbandoned
- 1999-11-24AUAU15263/00Apatent/AU759501B2/ennot_activeCeased
- 1999-11-24EPEP10188920Apatent/EP2302595A3/ennot_activeWithdrawn
- 1999-11-24USUS09/856,683patent/US7747055B1/ennot_activeExpired - Fee Related
- 1999-11-24EPEP99957586Apatent/EP1133257A4/ennot_activeWithdrawn
- 1999-11-24EPEP10188932Apatent/EP2302596A1/ennot_activeWithdrawn
- 1999-11-24EPEP10188916Apatent/EP2302594A3/ennot_activeWithdrawn
Patent Citations (117)
| Publication number | Priority date | Publication date | Assignee | Title |
|---|---|---|---|---|
| US4243652A (en) | 1978-07-14 | 1981-01-06 | The Procter & Gamble Company | Gastrointestinal scanning agent |
| US4315309A (en) | 1979-06-25 | 1982-02-09 | Coli Robert D | Integrated medical test data storage and retrieval system |
| US4367216A (en) | 1979-06-28 | 1983-01-04 | Schering Aktiengesellschaft | Triiodinated 5-aminoisophthalic acid derivatives |
| US4391280A (en) | 1980-04-04 | 1983-07-05 | Miller Roscoe E | Enema apparata improvements relating to double contrast studies |
| US4630203A (en) | 1983-12-27 | 1986-12-16 | Thomas Szirtes | Contour radiography: a system for determining 3-dimensional contours of an object from its 2-dimensional images |
| US4668915A (en) | 1985-03-15 | 1987-05-26 | Honda Giken Kogyo Kabushiki Kaisha | Non-uniform field magnetic resonance dual patient imaging system |
| US4737921A (en) | 1985-06-03 | 1988-04-12 | Dynamic Digital Displays, Inc. | Three dimensional medical image display system |
| US4729098A (en)* | 1985-06-05 | 1988-03-01 | General Electric Company | System and method employing nonlinear interpolation for the display of surface structures contained within the interior region of a solid body |
| US4710876A (en) | 1985-06-05 | 1987-12-01 | General Electric Company | System and method for the display of surface structures contained within the interior region of a solid body |
| US4719585A (en) | 1985-08-28 | 1988-01-12 | General Electric Company | Dividing cubes system and method for the display of surface structures contained within the interior region of a solid body |
| EP0231950A2 (en) | 1986-02-07 | 1987-08-12 | Fuji Photo Film Co., Ltd. | Method of nonlinear A/D conversion |
| US4751643A (en) | 1986-08-04 | 1988-06-14 | General Electric Company | Method and apparatus for determining connected substructures within a body |
| US4791567A (en) | 1986-09-15 | 1988-12-13 | General Electric Company | Three dimensional connectivity system employing an equivalence schema for determining connected substructures within a body |
| US4879668A (en) | 1986-12-19 | 1989-11-07 | General Electric Company | Method of displaying internal surfaces of three-dimensional medical images |
| US4821213A (en) | 1986-12-19 | 1989-04-11 | General Electric Co. | System for the simultaneous display of two or more internal surfaces within a solid object |
| US4823129A (en) | 1987-02-24 | 1989-04-18 | Bison Instruments, Inc. | Analog-to-digital converter |
| US5762608A (en) | 1987-05-15 | 1998-06-09 | Hologic, Inc. | Scanning x-ray imaging system with rotating c-arm |
| US4831528A (en) | 1987-11-09 | 1989-05-16 | General Electric Company | Apparatus and method for improvement of 3D images derived from tomographic data |
| US5170347A (en) | 1987-11-27 | 1992-12-08 | Picker International, Inc. | System to reformat images for three-dimensional display using unique spatial encoding and non-planar bisectioning |
| US5038302A (en) | 1988-07-26 | 1991-08-06 | The Research Foundation Of State University Of New York | Method of converting continuous three-dimensional geometrical representations into discrete three-dimensional voxel-based representations within a three-dimensional voxel-based system |
| US5023072A (en) | 1988-08-10 | 1991-06-11 | University Of New Mexico | Paramagnetic/superparamagnetic/ferromagnetic sucrose sulfate compositions for magnetic resonance imaging of the gastrointestinal tract |
| US4958932A (en) | 1988-08-18 | 1990-09-25 | Mcdonnell Douglas Corporation | Optical measuring apparatus |
| US4993415A (en) | 1988-08-19 | 1991-02-19 | Alliance Pharmaceutical Corp. | Magnetic resonance imaging with perfluorocarbon hydrides |
| US5056020A (en) | 1988-09-16 | 1991-10-08 | General Electric Cge Sa | Method and system for the correction of image defects of a scanner due to the movements of the latter |
| US4984157A (en) | 1988-09-21 | 1991-01-08 | General Electric Company | System and method for displaying oblique planar cross sections of a solid body using tri-linear interpolation to determine pixel position dataes |
| US5115501A (en) | 1988-11-04 | 1992-05-19 | International Business Machines Corporation | Procedure for automatically customizing the user interface of application programs |
| US4985834A (en) | 1988-11-22 | 1991-01-15 | General Electric Company | System and method employing pipelined parallel circuit architecture for displaying surface structures of the interior region of a solid body |
| US5339812A (en) | 1988-12-23 | 1994-08-23 | Medical Instrumentation And Diagnostic Corporation | Three-dimensional computer graphics simulation and computerized numerical optimization for dose delivery and treatment planning |
| US5265012A (en) | 1989-06-12 | 1993-11-23 | Commissariat A L'energie Atomique | Method to determine a space from a known discrete space for the reconstruction of bidimensional or tridimensional images, as well as a device to implement and apply the method |
| US5229935A (en) | 1989-07-31 | 1993-07-20 | Kabushiki Kaisha Toshiba | 3-dimensional image display apparatus capable of displaying a 3-D image by manipulating a positioning encoder |
| US5006109A (en) | 1989-09-12 | 1991-04-09 | Donald D. Douglas | Method and device for controlling pressure, volumetric flow rate and temperature during gas insuffication procedures |
| US5267155A (en) | 1989-10-16 | 1993-11-30 | Medical Documenting Systems, Inc. | Apparatus and method for computer-assisted document generation |
| US5148366A (en) | 1989-10-16 | 1992-09-15 | Medical Documenting Systems, Inc. | Computer-assisted documentation system for enhancing or replacing the process of dictating and transcribing |
| US5187658A (en) | 1990-01-17 | 1993-02-16 | General Electric Company | System and method for segmenting internal structures contained within the interior region of a solid object |
| US5299288A (en) | 1990-05-11 | 1994-03-29 | International Business Machines Corporation | Image-directed robotic system for precise robotic surgery including redundant consistency checking |
| US5412763A (en) | 1990-05-25 | 1995-05-02 | General Electric Cgr S.A. | Method for displaying an image of a portion of the inside of a three-dimensional physical structure |
| US5047772A (en) | 1990-06-04 | 1991-09-10 | General Electric Company | Digital error correction system for subranging analog-to-digital converters |
| US5127037A (en) | 1990-08-15 | 1992-06-30 | Bynum David K | Apparatus for forming a three-dimensional reproduction of an object from laminations |
| US5463548A (en) | 1990-08-28 | 1995-10-31 | Arch Development Corporation | Method and system for differential diagnosis based on clinical and radiological information using artificial neural networks |
| US5581460A (en) | 1990-11-06 | 1996-12-03 | Kabushiki Kaisha Toshiba | Medical diagnostic report forming apparatus capable of attaching image data on report |
| US5235510A (en) | 1990-11-22 | 1993-08-10 | Kabushiki Kaisha Toshiba | Computer-aided diagnosis system for medical use |
| US5204625A (en) | 1990-12-20 | 1993-04-20 | General Electric Company | Segmentation of stationary and vascular surfaces in magnetic resonance imaging |
| US5270926A (en) | 1990-12-21 | 1993-12-14 | General Electric Company | Method and apparatus for reconstructing a three-dimensional computerized tomography (CT) image of an object from incomplete cone beam projection data |
| US5166876A (en) | 1991-01-16 | 1992-11-24 | General Electric Company | System and method for detecting internal structures contained within the interior region of a solid object |
| US5779634A (en) | 1991-05-10 | 1998-07-14 | Kabushiki Kaisha Toshiba | Medical information processing system for supporting diagnosis |
| EP0514587B1 (en) | 1991-05-24 | 1999-02-03 | Samsung Electronics Co., Ltd. | A process of linearizing non-linear analog-to-digital conversion the process and circuit for performing |
| US5623586A (en) | 1991-05-25 | 1997-04-22 | Hoehne; Karl-Heinz | Method and device for knowledge based representation and display of three dimensional objects |
| US5313567A (en) | 1991-06-13 | 1994-05-17 | At&T Bell Laboratories | Arrangement for determining and displaying volumetric data in an imaging system |
| US5345490A (en) | 1991-06-28 | 1994-09-06 | General Electric Company | Method and apparatus for converting computed tomography (CT) data into finite element models |
| US5608849A (en)* | 1991-08-27 | 1997-03-04 | King, Jr.; Donald | Method of visual guidance for positioning images or data in three-dimensional space |
| US5283837A (en) | 1991-08-27 | 1994-02-01 | Picker International, Inc. | Accurate estimation of surface normals in 3-D data sets |
| JP3184327B2 (en) | 1991-09-06 | 2001-07-09 | キヤノン株式会社 | Three-dimensional graphics processing method and apparatus |
| US5528492A (en) | 1991-09-06 | 1996-06-18 | Kabushiki Kaisha Toshiba | Method of managing medical diagnostic data with reference relationship |
| US5437278A (en) | 1992-01-10 | 1995-08-01 | Wilk; Peter J. | Medical diagnosis system and method |
| GB2265775B (en) | 1992-03-30 | 1996-06-12 | Hughes Aircraft Co | Feed forward predictive analog-to-digital converter |
| US5740267A (en) | 1992-05-29 | 1998-04-14 | Echerer; Scott J. | Radiographic image enhancement comparison and storage requirement reduction system |
| US5295488A (en) | 1992-08-05 | 1994-03-22 | General Electric Company | Method and apparatus for projecting diagnostic images from volumed diagnostic data |
| US5322070A (en) | 1992-08-21 | 1994-06-21 | E-Z-Em, Inc. | Barium enema insufflation system |
| US5517602A (en)* | 1992-12-03 | 1996-05-14 | Hewlett-Packard Company | Method and apparatus for generating a topologically consistent visual representation of a three dimensional surface |
| US5452416A (en) | 1992-12-30 | 1995-09-19 | Dominator Radiology, Inc. | Automated system and a method for organizing, presenting, and manipulating medical images |
| US5807256A (en) | 1993-03-01 | 1998-09-15 | Kabushiki Kaisha Toshiba | Medical information processing system for supporting diagnosis |
| US5898793A (en) | 1993-04-13 | 1999-04-27 | Karron; Daniel | System and method for surface rendering of internal structures within the interior of a solid object |
| US5506984A (en) | 1993-06-30 | 1996-04-09 | Digital Equipment Corporation | Method and system for data retrieval in a distributed system using linked location references on a plurality of nodes |
| US5793969A (en) | 1993-07-09 | 1998-08-11 | Neopath, Inc. | Network review and analysis of computer encoded slides |
| US5587833A (en) | 1993-07-09 | 1996-12-24 | Compucyte Corporation | Computerized microscope specimen encoder |
| US5878746A (en) | 1993-08-25 | 1999-03-09 | Lemelson; Jerome H. | Computerized medical diagnostic system |
| US5542003A (en) | 1993-09-13 | 1996-07-30 | Eastman Kodak | Method for maximizing fidelity and dynamic range for a region of interest within digitized medical image display |
| US5412563A (en) | 1993-09-16 | 1995-05-02 | General Electric Company | Gradient image segmentation method |
| US6415048B1 (en) | 1993-10-12 | 2002-07-02 | Schneider Medical Technologies, Inc. | Compositional analysis system |
| US5581671A (en) | 1993-10-18 | 1996-12-03 | Hitachi Medical Corporation | Method and apparatus for moving-picture display of three-dimensional images |
| US5365927A (en) | 1993-11-02 | 1994-11-22 | General Electric Company | Magnetic resonance imaging system with pointing device |
| US5630034A (en) | 1994-04-05 | 1997-05-13 | Hitachi, Ltd. | Three-dimensional image producing method and apparatus |
| US5715449A (en) | 1994-06-20 | 1998-02-03 | Oceania, Inc. | Method for generating structured medical text through user selection of displayed text and rules |
| US5666400A (en) | 1994-07-07 | 1997-09-09 | Bell Atlantic Network Services, Inc. | Intelligent recognition |
| US6366800B1 (en) | 1994-10-27 | 2002-04-02 | Wake Forest University | Automatic analysis in virtual endoscopy |
| US5782762A (en)* | 1994-10-27 | 1998-07-21 | Wake Forest University | Method and system for producing interactive, three-dimensional renderings of selected body organs having hollow lumens to enable simulated movement through the lumen |
| US7149564B2 (en) | 1994-10-27 | 2006-12-12 | Wake Forest University Health Sciences | Automatic analysis in virtual endoscopy |
| US6083162A (en)* | 1994-10-27 | 2000-07-04 | Wake Forest University | Method and system for producing interactive, three-dimensional renderings of selected body organs having hollow lumens to enable simulated movement through the lumen |
| US20060023966A1 (en) | 1994-10-27 | 2006-02-02 | Vining David J | Method and system for producing interactive, three-dimensional renderings of selected body organs having hollow lumens to enable simulated movement through the lumen |
| AU706280B2 (en) | 1994-10-27 | 1999-06-10 | Wake Forest University | Method and system for producing interactive, three-dimensional renderings of selected body organs having hollow lumens to enable simulated movement through the lumen |
| US6694163B1 (en)* | 1994-10-27 | 2004-02-17 | Wake Forest University Health Sciences | Method and system for producing interactive, three-dimensional renderings of selected body organs having hollow lumens to enable simulated movement through the lumen |
| US5920319A (en)* | 1994-10-27 | 1999-07-06 | Wake Forest University | Automatic analysis in virtual endoscopy |
| US6909913B2 (en) | 1994-10-27 | 2005-06-21 | Wake Forest University Health Sciences | Method and system for producing interactive three-dimensional renderings of selected body organs having hollow lumens to enable simulated movement through the lumen |
| US6272366B1 (en) | 1994-10-27 | 2001-08-07 | Wake Forest University | Method and system for producing interactive three-dimensional renderings of selected body organs having hollow lumens to enable simulated movement through the lumen |
| US5611025A (en) | 1994-11-23 | 1997-03-11 | General Electric Company | Virtual internal cavity inspection system |
| US5704367A (en) | 1995-03-28 | 1998-01-06 | Nihon Kohden Corporation | Respiration monitor for monitoring respiration based upon an image signal of a facial region |
| US5742291A (en) | 1995-05-09 | 1998-04-21 | Synthonics Incorporated | Method and apparatus for creation of three-dimensional wire frames |
| US6252979B1 (en) | 1995-06-07 | 2001-06-26 | Tripath Imaging, Inc. | Interactive method and apparatus for sorting biological specimens |
| US5825908A (en) | 1995-12-29 | 1998-10-20 | Medical Media Systems | Anatomical visualization and measurement system |
| US5920317A (en) | 1996-06-11 | 1999-07-06 | Vmi Technologies Incorporated | System and method for storing and displaying ultrasound images |
| US5971767A (en) | 1996-09-16 | 1999-10-26 | The Research Foundation Of State University Of New York | System and method for performing a three-dimensional virtual examination |
| US5986662A (en) | 1996-10-16 | 1999-11-16 | Vital Images, Inc. | Advanced diagnostic viewer employing automated protocol selection for volume-rendered imaging |
| US5891030A (en) | 1997-01-24 | 1999-04-06 | Mayo Foundation For Medical Education And Research | System for two dimensional and three dimensional imaging of tubular structures in the human body |
| EP0961993B1 (en) | 1997-02-25 | 2005-02-09 | Wake Forest University | Automatic analysis in virtual endoscopy |
| AU757981B2 (en) | 1997-02-25 | 2003-03-13 | Wake Forest University | Automatic analysis in virtual endoscopy |
| US5898760A (en) | 1997-03-05 | 1999-04-27 | Bellsouth Corporation | Method and apparatus for automating the management of a database |
| US6292577B1 (en) | 1997-05-27 | 2001-09-18 | Mitsubishi Denki Kabsuhiki Kaisha | Resemblance retrieval apparatus, and recording medium for recording resemblance retrieval program |
| US6058322A (en) | 1997-07-25 | 2000-05-02 | Arch Development Corporation | Methods for improving the accuracy in differential diagnosis on radiologic examinations |
| US6317617B1 (en) | 1997-07-25 | 2001-11-13 | Arch Development Corporation | Method, computer program product, and system for the automated analysis of lesions in magnetic resonance, mammogram and ultrasound images |
| US6246784B1 (en)* | 1997-08-19 | 2001-06-12 | The United States Of America As Represented By The Department Of Health And Human Services | Method for segmenting medical images and detecting surface anomalies in anatomical structures |
| US5957138A (en) | 1997-08-25 | 1999-09-28 | Diasonics Ultrasound, Inc. | Method and apparatus for three-dimensional flow lumen imaging |
| US6389157B2 (en)* | 1997-08-28 | 2002-05-14 | Qualia Computing, Inc. | Joint optimization of parameters for the detection of clustered microcalcifications in digital mammograms |
| US6630937B2 (en) | 1997-10-30 | 2003-10-07 | University Of South Florida | Workstation interface for use in digital mammography and associated methods |
| US6117073A (en) | 1998-03-02 | 2000-09-12 | Jones; Scott J. | Integrated emergency medical transportation database system |
| US6014581A (en) | 1998-03-26 | 2000-01-11 | Ep Technologies, Inc. | Interface for performing a diagnostic or therapeutic procedure on heart tissue with an electrode structure |
| US6282305B1 (en) | 1998-06-05 | 2001-08-28 | Arch Development Corporation | Method and system for the computerized assessment of breast cancer risk |
| US20020004798A1 (en) | 1998-11-25 | 2002-01-10 | Deborah Ann Babula | Centralized medical diagnostic system service method and apparatus |
| US6490370B1 (en) | 1999-01-28 | 2002-12-03 | Koninklijke Philips Electronics N.V. | System and method for describing multimedia content |
| US6366683B1 (en) | 1999-03-16 | 2002-04-02 | Curtis P. Langlotz | Apparatus and method for recording image analysis information |
| AU777440B2 (en) | 1999-08-09 | 2004-10-14 | Wake Forest University | A method and computer-implemented procedure for creating electronic, multimedia reports |
| WO2001011548A1 (en) | 1999-08-09 | 2001-02-15 | Wake Forest University | A method and computer-implemented procedure for creating electronic, multimedia reports |
| US7289651B2 (en) | 1999-08-09 | 2007-10-30 | Wake Forest University Health Science | Image reporting method and system |
| US20010025279A1 (en) | 1999-12-16 | 2001-09-27 | Lora Krulak | Method and system for planning customized menu |
| US6551243B2 (en) | 2001-01-24 | 2003-04-22 | Siemens Medical Solutions Health Services Corporation | System and user interface for use in providing medical information and health care delivery support |
| US6813373B1 (en)* | 2001-04-03 | 2004-11-02 | Koninklijke Philips Electronics, N.V. | Image segmentation of embedded shapes using constrained morphing |
| CN1239253C (en) | 2001-08-29 | 2006-02-01 | 日本酸素株式会社 | Adsorbent for separating nitrogen from oxygen-nitrogen mixed gas and method for producing nitrogen using the same |
| US6879668B2 (en) | 2002-05-01 | 2005-04-12 | Sbc Technology Resources, Inc. | System and method for communicating with an out of service telephone number |
Non-Patent Citations (56)
| Title |
|---|
| "The ACR Breast Imaging Reporting and Data System (BI-RADS®)", Copyright © 1994-2002 American College of Radiology, Revised Jun. 1, 2000. |
| Barnhard, et al., "Computer Autocoding, Selecting and Correlating of Radiologic Diagnostic Cases". |
| Bell, D.S.., et al., "Evaluation of UItraSTAR: Performance of a Collaborative Structured Data Entry System", 1994, AMIA, Inc.; Symposium Supplement, pp. 216-222. |
| Bell, et al., "Experiments in Concept Modeling for Radiographic Image Reports", J Am Med Informatics Assoc. 1994;1:249-262, Jan. 1994. |
| Bidgood, W. Dean, Jr., "Clinical Importance of the DICOM Structured Reporting Standard", International Journal of Cardiac Imaging 14: 307-315, 1998. |
| Bidgood, W. Dean, Jr., "Documenting the Information Content of Images". |
| Bluemke, et al., "An Automated Radiology Reporting System That Uses HyperCard", Computers in Radiology, AJR 1993; 160:185-187 0361-803X/93/1601-0185 American Roentgen Ray Society, Jul. 23, 1992. |
| Brolin, "MEDELA: An Electronic Data-Processing System for Radiological Reporting", Radiology 103:249-255, May 1972. |
| Campbell, K.E., et al., "A Computer-Based Tool for Generation of Progress Notes", 1993; Symposium Supplement 284-288. |
| Cavaye, et al., "A New Technique for Intraluminal Hollow Organ Imaging: Three-Dimensional Ultrasound", Journal of Laparoendoscopic Surgery, vol. 1, No. 5, 1991, Mary Ann Liebert, Inc., Publishers. |
| Chen, et al., "A Distributed and Interactive Three Dimensional Medical Imaging System", Comput Med Imaging Graph, Sep.-Oct. 1994; 18(5):325-37. |
| Chronaki, C. et al., "I2Cnet Medical Image Annotation Service", Medical Informatics, Online!, vol. 22, No. 4, 1997, pp. 337-347. |
| Dietrich, "Knowledge-Based Computer-Assisted Diagnosis of Chest Radiographs", Radiologic Clinics of Noth America-ol. XVI, No. 3, Dec. 1978. |
| Dockray, Karl T., "Solo Practice Management: Value of a Computerized Reporting System", Computers in Radiology, JR 1994, 162:1439-1441. |
| Du-Yih Tsai, et al., "Computer-based Measurement of Right and Left Ventricular Volumes in Magnetic Resonance Imaging", IMTC/94, Advanced Technologies in I & M, 1994 IEEE Hamamatsu, Japan May 10-12, 1994, New York, NY, USA IEEE, May 10, 1994, pp. 971-974, XP010121821. |
| eDict Systems, Inc., www.edictation.com printed website on Nov. 21, 2000. |
| European Partial Supplementary Search Report dated Aug. 24, 2007. |
| Friedman, C., et al., "A Schema for Representing Medical Language Applied to Clinical Radiology", Journal of the American Medical Informatics Assoc., vol. 1, No. 3, May./Jun. 1994, 1:233-248. |
| Geiger, B., et al., "Simulation of Endoscopy", Joint Conference, Computer Vision, Virtual Reality and Robotics in Medicine and Medical Robotics and Computer-Assisted Surgery Proceedings, Apr. 1995, pp. 277-281. |
| General Electric Medical Systems, "3D Navigator for CT or MR Advanced Visualization Software", 1996. |
| General Electric Medical Systems, "K1031L/LA/N/NA AdvantageTM Workstation 3.1" Product Data 1-98 p. 1-7. |
| Gonzalez, R., et al.. "Digital Image Processing", 8.4 Morphology, 1992, pp. 518-521. |
| Hundt, W., et al., "A Computer-based reporting system in radiology of the chest", European Radiology, 8, 1002-1008 (1998), Springer-Verlag 1998, 8:1002-1008. |
| Jolesz, F.A., et al., "Interactive Virtual Endoscopy", Amerial Journal of Roentegenology, V. 169, 1997, pp. 1229-1235. |
| Jost, "Radiology Reporting", Radiologic Clinics of North America-vol. 24, No. 1, Mar. 1986. |
| Kahn, Jr., et al., "Structed Entry of Radiology Reports Using World Wide Web Technology", RadioGraphics 1996; 16:683-691, RSNA, 1996. |
| Kobayashi, et al., "Endoscopic Visualisation of Luminal Organs and Great Vessels with a Three-Dimensional CT Scanner: A New Trial using Volumetric CT", Nippon Acta Radiologica, vol. 52, No. 8, pp. 1195-1197 (1992). |
| Langlotz, "Enhancing the Expressiveness of Structured Reporting Systems", Journal of Digital Imaging, vol. 13, No. 2, Suppl. 1 May 2000: pp. 49-53. |
| Langlotz, G.P., MD, PhD, "A Graphical Speech-guided Structured Reporting System", 1999 Scientific Program Radiological Society of North America 56th Scientific Assembly and Annual Meeting, Supplement Nov. 1999, v213(p), p. 578. |
| Leeming, et al., "Advances in Radiologic Reporting with Computerized Language Information Processing", Radiology 133:349-353, Nov. 1979. |
| Lorensen, et al., "Marching Cubes: A High Resolution 3D Surface Construction Algorithm", Siam Journal on Computing, Society for Industrial and Applied Mathematics, US, vol. 21, No. 4, Jul. 1, 1987, pp. 163-169, XP000576999. |
| Mani, et al., "A Computer-Assisted Radiologic Reporting System", Radiology 108:587-596, Sep. 1973. |
| Noboru Maki, "Image Processing Expanding Particularly in the Medical and the Mapping Fields", Nikkei Computer Graphics, Jan. 1990, p. 63 (English translation: Transmittal No. 574154). |
| Official Action dated Dec. 8, 2009 for U.S. Appl. No. 11/637,207. |
| Official Action dated Feb. 5, 2009 for U.S. Appl. No. 11/637,207. |
| Official Action dated Nov. 13, 2009 for U.S. Appl. No. 11/157,136. |
| Official Action dated Oct. 1, 2009 for U.S. Appl. No. 11/157,136. |
| Oikarinen et al., "Rendering System for Tomographic Images" 0-7803-1377-1/93 IEEE. |
| Pendergrass, et al., "An On-Line Computer Facility for Systematized Input of Radiology Reports". |
| Picker International VoyagerTM Product Data, "VoyagerTM Visualization Tools for the Q-series Scanner", 1997. |
| Poon, A.D., et al., "PEN-Ivory: The Design and Evaluation of a Pen-Based Computer System for Structured Data Entry", Stanford University School of Medicine, Journal of the American Medical Informatics Assoc., 1994; (Symposium Supplement) 447-451. |
| Puerta, A., et al., "Towards a General Computational Framework for Model-Based Interface Development Systems", Stanford University, Proceeding of the International Conference on Intelligent User Interface Design, Calif. 1999. |
| Robb, et al., "A Software System for Interactive and Quantitative Visualization of Multidimensional Biomedical Images", Australasian Physical & Engineering Sciences in Medicine (1991), vol. 14, No. 1. |
| Rubin, et al., "Perspective Volume Rendering of CT and MR Images: Applications for Endoscopic Imaging", Radiology, Oak Brook, IL, US, vol. 199, No. 2, May 1, 1996, pp. 321-330, XP002083446. |
| Rusinek, et al., "Volumetric Rendering of MR Images", Radiology Apr. 1989;17(1):269-72. |
| Sahoo, P.K., "A Survey of Thresholding Techniques", Computer, Vision, Graphics, and Image Processing (1988), No. 2, Duluth, MN, USA, pp. 233-260. |
| Shapiro, et al., "Preliminary Results of a Modified Surface Redering Technique in the Display of MR Angiography Images", Magn Reson Imaging, 1994;12(3):461-8. |
| Shinagawa, Y., et al., "Automating View Function Generation for Walk-through Animation Using a Reeb Graph", Proceedings Computer Animation '90, at pp. 227-237 (Springer-Verlag 1990). |
| Strong et al., "Applications of Three-Dimensional Display Techniques in Medical Imaging," J. Biomed. Eng. 1990, vol. 12. May, pp. 233-238. |
| T.L. Schulley, et al. "A High Resolution Nonlinearity Correcting A/D Converter Architecture," Jun. 3-6, 1993, pp. 1212-1215, 1993 IEEE International Symposium on Circuits and Systems. |
| Vining, D.J., Padhani, A.R., Wood, S., Zerhouni, E.A., Fishman, E.K., and Kuhlman, J.E., "Virtual Bronchoscopy: A New Perspective for Viewing the Tracheobronchial Tree." Radiology. Nov. 1993, vol. 189 (P). |
| Vining, et al., "Freeflight", Digestive Disease Week and the 100th Annual Meeting of the Gastroenterological Assoc., May 16-19, 1999, Orlando, FL, program v116, n4, p. 2. |
| Vining, et al., "New Paradigm for Virtual Colonoscopy Processing and Reporting", and "New Paradigm for Digital Image Reporting", 1999 Scientific Program Radiological Society of North America 85th Scientific Assembly and Annual Meeting, Supplement Nov. 1999, v213(p), p. 577 and p. 579. |
| Watt, Alan. "3D Computer Graphics." 2nd Edition, Addison-Wesley Pub. Co., 1993, pp. 320-323. |
| Wheeler, et al., "The John Hopkins Radiology Reporting System", Radiology 119:315-319, May 1976. |
| Wiegand, et al., "The Surgical Workstation: Surgical Planning using Generic Software", Otolaryngol Head Neck Surg, Sep. 1993; 1093 (3 Pt 1): 434-40. |
Cited By (155)
| Publication number | Priority date | Publication date | Assignee | Title |
|---|---|---|---|---|
| USRE44696E1 (en) | 2002-12-10 | 2014-01-07 | Jostens, Inc. | Automated engraving of a customized jewelry item |
| US20120278711A1 (en)* | 2003-09-16 | 2012-11-01 | Labtest International, Inc. D/B/A Intertek Consumer Goods North America | Haptic response system and method of use |
| US20050131581A1 (en)* | 2003-09-19 | 2005-06-16 | Sony Corporation | Environment recognizing device, environment recognizing method, route planning device, route planning method and robot |
| US7865267B2 (en)* | 2003-09-19 | 2011-01-04 | Sony Corporation | Environment recognizing device, environment recognizing method, route planning device, route planning method and robot |
| US20120075297A1 (en)* | 2004-04-19 | 2012-03-29 | Carbonera Carlos D | System and method for smoothing three dimensional images |
| US20060001664A1 (en)* | 2004-04-19 | 2006-01-05 | Carbonera Carlos D | System and method for smoothing three dimensional images |
| US8085266B2 (en)* | 2004-04-19 | 2011-12-27 | Jostens, Inc. | System and method for smoothing three dimensional images |
| US20060025674A1 (en)* | 2004-08-02 | 2006-02-02 | Kiraly Atilla P | System and method for tree projection for detection of pulmonary embolism |
| US8170640B2 (en)* | 2004-08-02 | 2012-05-01 | Siemens Medical Solutions Usa, Inc. | System and method for tree projection for detection of pulmonary embolism |
| US8548566B2 (en)* | 2005-10-21 | 2013-10-01 | Koninklijke Philips N.V. | Rendering method and apparatus |
| US20080228067A1 (en)* | 2005-10-21 | 2008-09-18 | Koninklijke Philips Electronics N.V. | Rendering Method and Apparatus |
| US7844095B2 (en)* | 2006-01-12 | 2010-11-30 | Siemens Aktiengesellschaft | Method and apparatus for virtual bowel cleaning |
| US20070297662A1 (en)* | 2006-01-12 | 2007-12-27 | Walter Marzendorfer | Method and apparatus for virtual bowel cleaning |
| US8160329B2 (en)* | 2006-08-08 | 2012-04-17 | Olympus Medical Systems Corp. | Medical image processing device and medical image processing method |
| US20090196476A1 (en)* | 2006-08-08 | 2009-08-06 | Olympus Medical Systems Corp. | Medical image processing device and medical image processing method |
| US8712117B2 (en)* | 2006-09-29 | 2014-04-29 | Koninklijke Philips N.V. | Methods, systems, and computer program product for virtually modifying surface region curvature to detect protrusions |
| US20110235882A1 (en)* | 2006-09-29 | 2011-09-29 | Koninklijke Philips Electronics N.V. | Methods, system and computer program product for detecting a protrusion |
| US20110144785A1 (en)* | 2007-01-18 | 2011-06-16 | Carbonera Carlos D | System and method for generating instructions for customization |
| US8473088B2 (en) | 2007-01-18 | 2013-06-25 | Jostens, Inc. | System and method for generating instructions for customization |
| US9434035B2 (en) | 2007-03-12 | 2016-09-06 | Jostens, Inc. | System and method for embellishment placement |
| US8515713B2 (en) | 2007-03-12 | 2013-08-20 | Jostens, Inc. | System and method for embellishment placement |
| US20100201880A1 (en)* | 2007-04-13 | 2010-08-12 | Pioneer Corporation | Shot size identifying apparatus and method, electronic apparatus, and computer program |
| US8107704B2 (en)* | 2007-06-05 | 2012-01-31 | Olympus Corporation | Image processing device, image processing program and image processing method |
| US20100061597A1 (en)* | 2007-06-05 | 2010-03-11 | Olympus Corporation | Image processing device, image processing program and image processing method |
| US20080303818A1 (en)* | 2007-06-08 | 2008-12-11 | Yoshiyuki Moriya | Medical image display apparatus and program, and recording medium therefor |
| US7889902B2 (en)* | 2007-06-25 | 2011-02-15 | Accuray Incorporated | High quality volume rendering with graphics processing unit |
| US20080317321A1 (en)* | 2007-06-25 | 2008-12-25 | Hui Zhang | High quality volume rendering with graphics processing unit |
| US20100316270A1 (en)* | 2007-12-20 | 2010-12-16 | Koninklijke Philips Electronics N.V. | 3d reconstruction of a body and of a body contour |
| US8488197B2 (en) | 2008-06-06 | 2013-07-16 | Virginia Venture Industries, Llc | Methods and apparatuses for printing three dimensional images |
| US8243334B2 (en)* | 2008-06-06 | 2012-08-14 | Virginia Venture Industries, Llc | Methods and apparatuses for printing three dimensional images |
| US8693056B2 (en) | 2008-06-06 | 2014-04-08 | Virginia Venture Industries, Llc | Methods and apparatuses for printing three dimensional images |
| US20090303507A1 (en)* | 2008-06-06 | 2009-12-10 | Virginia Venture Industries, Llc | Methods and apparatuses for printing three dimensional images |
| US9047553B2 (en) | 2008-06-06 | 2015-06-02 | Virginia Venture Industries, Llc | Methods and apparatuses for printing three dimensional images |
| US9457519B2 (en) | 2008-06-06 | 2016-10-04 | Virginia Venture Industries, Llc | Methods and apparatuses for printing three dimensional images |
| US11107587B2 (en) | 2008-07-21 | 2021-08-31 | The Board Of Trustees Of The Leland Stanford Junior University | Method for tuning patient-specific cardiovascular simulations |
| US8200466B2 (en) | 2008-07-21 | 2012-06-12 | The Board Of Trustees Of The Leland Stanford Junior University | Method for tuning patient-specific cardiovascular simulations |
| US20110135181A1 (en)* | 2008-08-26 | 2011-06-09 | Jiayong Yan | polynomial fitting based segmentation algorithm for pulmonary nodule in chest radiograph |
| US9144397B2 (en)* | 2008-12-04 | 2015-09-29 | Real Imaging Ltd. | Method apparatus and system for determining a thermal signature |
| US10264980B2 (en) | 2008-12-04 | 2019-04-23 | Real Imaging Ltd. | Method apparatus and system for determining a data signature of 3D image |
| US20110243409A1 (en)* | 2008-12-04 | 2011-10-06 | Real Imaging Ltd. | Method apparatus and system for determining a thermal signature |
| US12176094B2 (en) | 2009-03-17 | 2024-12-24 | The Board Of Trustees Of Leland Stanford Junior University | Systems and methods for processing electronic images |
| US10354050B2 (en) | 2009-03-17 | 2019-07-16 | The Board Of Trustees Of Leland Stanford Junior University | Image processing method for determining patient-specific cardiovascular information |
| US9217996B2 (en) | 2010-02-25 | 2015-12-22 | Jostens, Inc. | Method for digital manufacturing of jewelry items |
| US20110213482A1 (en)* | 2010-02-25 | 2011-09-01 | Tim Saarela | Method for digital manufacturing of jewelry items |
| US8977377B2 (en) | 2010-02-25 | 2015-03-10 | Jostens, Inc. | Method for digital manufacturing of jewelry items |
| US20110225542A1 (en)* | 2010-03-09 | 2011-09-15 | Microsoft Corporation | Application sharing with occlusion removal |
| US8898577B2 (en) | 2010-03-09 | 2014-11-25 | Microsoft Corporation | Application sharing with occlusion removal |
| US20110242097A1 (en)* | 2010-03-31 | 2011-10-06 | Fujifilm Corporation | Projection image generation method, apparatus, and program |
| US9865079B2 (en)* | 2010-03-31 | 2018-01-09 | Fujifilm Corporation | Virtual endoscopic image generated using an opacity curve |
| US8839112B2 (en) | 2010-08-10 | 2014-09-16 | Microsoft Corporation | Cloning or extending a computer desktop on a wireless display surface |
| US10179030B2 (en) | 2010-08-12 | 2019-01-15 | Heartflow, Inc. | Method and system for patient-specific modeling of blood flow |
| US8315812B2 (en) | 2010-08-12 | 2012-11-20 | Heartflow, Inc. | Method and system for patient-specific modeling of blood flow |
| US12357387B2 (en) | 2010-08-12 | 2025-07-15 | Heartflow, Inc. | Method and system for image processing to determine blood flow |
| US8157742B2 (en) | 2010-08-12 | 2012-04-17 | Heartflow, Inc. | Method and system for patient-specific modeling of blood flow |
| US8606530B2 (en) | 2010-08-12 | 2013-12-10 | Heartflow, Inc. | Method and system for patient-specific modeling of blood flow |
| US8734356B2 (en) | 2010-08-12 | 2014-05-27 | Heartflow, Inc. | Method and system for patient-specific modeling of blood flow |
| US8734357B2 (en) | 2010-08-12 | 2014-05-27 | Heartflow, Inc. | Method and system for patient-specific modeling of blood flow |
| US12029494B2 (en) | 2010-08-12 | 2024-07-09 | Heartflow, Inc. | Method and system for image processing to determine blood flow |
| US12016635B2 (en) | 2010-08-12 | 2024-06-25 | Heartflow, Inc. | Method and system for image processing to determine blood flow |
| US8812246B2 (en) | 2010-08-12 | 2014-08-19 | Heartflow, Inc. | Method and system for patient-specific modeling of blood flow |
| US8812245B2 (en) | 2010-08-12 | 2014-08-19 | Heartflow, Inc. | Method and system for patient-specific modeling of blood flow |
| US8594950B2 (en) | 2010-08-12 | 2013-11-26 | Heartflow, Inc. | Method and system for patient-specific modeling of blood flow |
| US11793575B2 (en) | 2010-08-12 | 2023-10-24 | Heartflow, Inc. | Method and system for image processing to determine blood flow |
| US11583340B2 (en) | 2010-08-12 | 2023-02-21 | Heartflow, Inc. | Method and system for image processing to determine blood flow |
| US11298187B2 (en) | 2010-08-12 | 2022-04-12 | Heartflow, Inc. | Method and system for image processing to determine patient-specific blood flow characteristics |
| US8523779B2 (en) | 2010-08-12 | 2013-09-03 | Heartflow, Inc. | Method and system for patient-specific modeling of blood flow |
| US11154361B2 (en) | 2010-08-12 | 2021-10-26 | Heartflow, Inc. | Method and system for image processing to determine blood flow |
| US8496594B2 (en) | 2010-08-12 | 2013-07-30 | Heartflow, Inc. | Method and system for patient-specific modeling of blood flow |
| US11135012B2 (en) | 2010-08-12 | 2021-10-05 | Heartflow, Inc. | Method and system for image processing to determine patient-specific blood flow characteristics |
| US11116575B2 (en) | 2010-08-12 | 2021-09-14 | Heartflow, Inc. | Method and system for image processing to determine blood flow |
| US9081882B2 (en) | 2010-08-12 | 2015-07-14 | HeartFlow, Inc | Method and system for patient-specific modeling of blood flow |
| US9078564B2 (en) | 2010-08-12 | 2015-07-14 | Heartflow, Inc. | Method and system for patient-specific modeling of blood flow |
| US8386188B2 (en) | 2010-08-12 | 2013-02-26 | Heartflow, Inc. | Method and system for patient-specific modeling of blood flow |
| US9152757B2 (en) | 2010-08-12 | 2015-10-06 | Heartflow, Inc. | Method and system for patient-specific modeling of blood flow |
| US9149197B2 (en) | 2010-08-12 | 2015-10-06 | Heartflow, Inc. | Method and system for patient-specific modeling of blood flow |
| US9167974B2 (en) | 2010-08-12 | 2015-10-27 | Heartflow, Inc. | Method and system for patient-specific modeling of blood flow |
| US8249815B2 (en) | 2010-08-12 | 2012-08-21 | Heartflow, Inc. | Method and system for patient-specific modeling of blood flow |
| US8630812B2 (en) | 2010-08-12 | 2014-01-14 | Heartflow, Inc. | Method and system for patient-specific modeling of blood flow |
| US8321150B2 (en) | 2010-08-12 | 2012-11-27 | Heartflow, Inc. | Method and system for patient-specific modeling of blood flow |
| US9226672B2 (en) | 2010-08-12 | 2016-01-05 | Heartflow, Inc. | Method and system for patient-specific modeling of blood flow |
| US9235679B2 (en) | 2010-08-12 | 2016-01-12 | Heartflow, Inc. | Method and system for patient-specific modeling of blood flow |
| US9268902B2 (en) | 2010-08-12 | 2016-02-23 | Heartflow, Inc. | Method and system for patient-specific modeling of blood flow |
| US9271657B2 (en) | 2010-08-12 | 2016-03-01 | Heartflow, Inc. | Method and system for patient-specific modeling of blood flow |
| US11090118B2 (en) | 2010-08-12 | 2021-08-17 | Heartflow, Inc. | Method and system for image processing and patient-specific modeling of blood flow |
| US11083524B2 (en) | 2010-08-12 | 2021-08-10 | Heartflow, Inc. | Method and system for patient-specific modeling of blood flow |
| US8311748B2 (en) | 2010-08-12 | 2012-11-13 | Heartflow, Inc. | Method and system for patient-specific modeling of blood flow |
| US9449147B2 (en) | 2010-08-12 | 2016-09-20 | Heartflow, Inc. | Method and system for patient-specific modeling of blood flow |
| US8315813B2 (en) | 2010-08-12 | 2012-11-20 | Heartflow, Inc. | Method and system for patient-specific modeling of blood flow |
| US11033332B2 (en) | 2010-08-12 | 2021-06-15 | Heartflow, Inc. | Method and system for image processing to determine blood flow |
| US10702339B2 (en) | 2010-08-12 | 2020-07-07 | Heartflow, Inc. | Method and system for patient-specific modeling of blood flow |
| US10702340B2 (en) | 2010-08-12 | 2020-07-07 | Heartflow, Inc. | Image processing and patient-specific modeling of blood flow |
| US10682180B2 (en) | 2010-08-12 | 2020-06-16 | Heartflow, Inc. | Method and system for patient-specific modeling of blood flow |
| US9585723B2 (en) | 2010-08-12 | 2017-03-07 | Heartflow, Inc. | Method and system for image processing to determine patient-specific blood flow characteristics |
| US10531923B2 (en) | 2010-08-12 | 2020-01-14 | Heartflow, Inc. | Method and system for image processing to determine blood flow |
| US9697330B2 (en) | 2010-08-12 | 2017-07-04 | Heartflow, Inc. | Method and system for image processing to determine patient-specific blood flow characteristics |
| US9706925B2 (en) | 2010-08-12 | 2017-07-18 | Heartflow, Inc. | Method and system for image processing to determine patient-specific blood flow characteristics |
| US9743835B2 (en) | 2010-08-12 | 2017-08-29 | Heartflow, Inc. | Method and system for image processing to determine patient-specific blood flow characteristics |
| US9801689B2 (en) | 2010-08-12 | 2017-10-31 | Heartflow, Inc. | Method and system for patient-specific modeling of blood flow |
| US9839484B2 (en) | 2010-08-12 | 2017-12-12 | Heartflow, Inc. | Method and system for image processing and patient-specific modeling of blood flow |
| US9855105B2 (en) | 2010-08-12 | 2018-01-02 | Heartflow, Inc. | Method and system for image processing to determine patient-specific blood flow characteristics |
| US9861284B2 (en) | 2010-08-12 | 2018-01-09 | Heartflow, Inc. | Method and system for image processing to determine patient-specific blood flow characteristics |
| US8315814B2 (en) | 2010-08-12 | 2012-11-20 | Heartflow, Inc. | Method and system for patient-specific modeling of blood flow |
| US10492866B2 (en) | 2010-08-12 | 2019-12-03 | Heartflow, Inc. | Method and system for image processing to determine blood flow |
| US9888971B2 (en) | 2010-08-12 | 2018-02-13 | Heartflow, Inc. | Method and system for image processing to determine patient-specific blood flow characteristics |
| US10478252B2 (en) | 2010-08-12 | 2019-11-19 | Heartflow, Inc. | Method and system for patient-specific modeling of blood flow |
| US10052158B2 (en) | 2010-08-12 | 2018-08-21 | Heartflow, Inc. | Method and system for image processing to determine patient-specific blood flow characteristics |
| US10080613B2 (en) | 2010-08-12 | 2018-09-25 | Heartflow, Inc. | Systems and methods for determining and visualizing perfusion of myocardial muscle |
| US10080614B2 (en) | 2010-08-12 | 2018-09-25 | Heartflow, Inc. | Method and system for image processing to determine patient-specific blood flow characteristics |
| US10092360B2 (en) | 2010-08-12 | 2018-10-09 | Heartflow, Inc. | Method and system for image processing and patient-specific modeling of blood flow |
| US10441361B2 (en) | 2010-08-12 | 2019-10-15 | Heartflow, Inc. | Method and system for image processing and patient-specific modeling of blood flow |
| US10149723B2 (en) | 2010-08-12 | 2018-12-11 | Heartflow, Inc. | Method and system for image processing and patient-specific modeling of blood flow |
| US10154883B2 (en) | 2010-08-12 | 2018-12-18 | Heartflow, Inc. | Method and system for image processing and patient-specific modeling of blood flow |
| US10159529B2 (en) | 2010-08-12 | 2018-12-25 | Heartflow, Inc. | Method and system for patient-specific modeling of blood flow |
| US10166077B2 (en) | 2010-08-12 | 2019-01-01 | Heartflow, Inc. | Method and system for image processing to determine patient-specific blood flow characteristics |
| US8311747B2 (en) | 2010-08-12 | 2012-11-13 | Heartflow, Inc. | Method and system for patient-specific modeling of blood flow |
| US10376317B2 (en) | 2010-08-12 | 2019-08-13 | Heartflow, Inc. | Method and system for image processing and patient-specific modeling of blood flow |
| US8311750B2 (en) | 2010-08-12 | 2012-11-13 | Heartflow, Inc. | Method and system for patient-specific modeling of blood flow |
| US10321958B2 (en) | 2010-08-12 | 2019-06-18 | Heartflow, Inc. | Method and system for image processing to determine patient-specific blood flow characteristics |
| US10327847B2 (en) | 2010-08-12 | 2019-06-25 | Heartflow, Inc. | Method and system for patient-specific modeling of blood flow |
| US9208265B2 (en) | 2011-12-02 | 2015-12-08 | Jostens, Inc. | System and method for jewelry design |
| US8855984B2 (en) | 2012-05-14 | 2014-10-07 | Heartflow, Inc. | Method and system for providing information from a patient-specific model of blood flow |
| US9063635B2 (en) | 2012-05-14 | 2015-06-23 | Heartflow, Inc. | Method and system for providing information from a patient-specific model of blood flow |
| US8706457B2 (en) | 2012-05-14 | 2014-04-22 | Heartflow, Inc. | Method and system for providing information from a patient-specific model of blood flow |
| US8768669B1 (en) | 2012-05-14 | 2014-07-01 | Heartflow, Inc. | Method and system for providing information from a patient-specific model of blood flow |
| US8768670B1 (en) | 2012-05-14 | 2014-07-01 | Heartflow, Inc. | Method and system for providing information from a patient-specific model of blood flow |
| US11826106B2 (en) | 2012-05-14 | 2023-11-28 | Heartflow, Inc. | Method and system for providing information from a patient-specific model of blood flow |
| US8914264B1 (en) | 2012-05-14 | 2014-12-16 | Heartflow, Inc. | Method and system for providing information from a patient-specific model of blood flow |
| US9168012B2 (en) | 2012-05-14 | 2015-10-27 | Heartflow, Inc. | Method and system for providing information from a patient-specific model of blood flow |
| US9063634B2 (en) | 2012-05-14 | 2015-06-23 | Heartflow, Inc. | Method and system for providing information from a patient-specific model of blood flow |
| US9002690B2 (en) | 2012-05-14 | 2015-04-07 | Heartflow, Inc. | Method and system for providing information from a patient-specific model of blood flow |
| US9517040B2 (en) | 2012-05-14 | 2016-12-13 | Heartflow, Inc. | Method and system for providing information from a patient-specific model of blood flow |
| US10842568B2 (en) | 2012-05-14 | 2020-11-24 | Heartflow, Inc. | Method and system for providing information from a patient-specific model of blood flow |
| US8548778B1 (en) | 2012-05-14 | 2013-10-01 | Heartflow, Inc. | Method and system for providing information from a patient-specific model of blood flow |
| US20130328874A1 (en)* | 2012-06-06 | 2013-12-12 | Siemens Medical Solutions Usa, Inc. | Clip Surface for Volume Rendering in Three-Dimensional Medical Imaging |
| US9582615B2 (en) | 2013-01-16 | 2017-02-28 | Jostens, Inc. | Modeling using thin plate spline technology |
| USD789228S1 (en) | 2013-11-25 | 2017-06-13 | Jostens, Inc. | Bezel for a ring |
| US9881381B2 (en)* | 2013-12-19 | 2018-01-30 | Olympus Corporation | Image processing apparatus, image processing method, and computer-readable recording medium |
| US20160292875A1 (en)* | 2013-12-19 | 2016-10-06 | Olympus Corporation | Image processing apparatus, image processing method, and computer-readable recording medium |
| US20170011516A1 (en)* | 2014-02-12 | 2017-01-12 | Koninklijke Philips N.V. | Systems for monitoring lesion size trends and methods of operation thereof |
| US10140714B2 (en)* | 2014-02-12 | 2018-11-27 | Koninklijke Philips N.V. | Systems for monitoring lesion size trends and methods of operation thereof |
| US10515452B2 (en)* | 2014-04-24 | 2019-12-24 | Koninklijke Philips N.V. | System for monitoring lesion size trends and methods of operation thereof |
| WO2016033405A1 (en)* | 2014-08-28 | 2016-03-03 | Mela Sciences, Inc. | Three dimensional tissue imaging system and method |
| US20160058288A1 (en)* | 2014-08-28 | 2016-03-03 | Mela Sciences, Inc. | Three dimensional tissue imaging system and method |
| US10004403B2 (en)* | 2014-08-28 | 2018-06-26 | Mela Sciences, Inc. | Three dimensional tissue imaging system and method |
| US11043042B2 (en)* | 2016-05-16 | 2021-06-22 | Hewlett-Packard Development Company, L.P. | Generating a shape profile for a 3D object |
| US20190026953A1 (en)* | 2016-05-16 | 2019-01-24 | Hewlett-Packard Development Company, L.P. | Generating a shape profile for a 3d object |
| US11481969B2 (en)* | 2017-12-13 | 2022-10-25 | Covidien Lp | Systems, methods, and computer-readable media for automatic computed tomography to computed tomography registration |
| US12086930B2 (en) | 2017-12-13 | 2024-09-10 | Covidien Lp | Systems, methods, and computer-readable media for automatic computed tomography to computed tomography registration |
| US12232744B2 (en) | 2019-07-15 | 2025-02-25 | Stryker Corporation | Robotic hand-held surgical instrument systems and methods |
| CN110990943B (en)* | 2019-11-13 | 2023-10-20 | 上海航天控制技术研究所 | Singular point judgment method based on singular geometric meaning of control moment gyro group |
| CN110990943A (en)* | 2019-11-13 | 2020-04-10 | 上海航天控制技术研究所 | Singular point judgment method based on singular geometric meaning of control moment gyro group |
| CN110867233A (en)* | 2019-11-19 | 2020-03-06 | 西安邮电大学 | System and method for generating electronic laryngoscopy medical test reports |
| CN114049934A (en)* | 2021-11-10 | 2022-02-15 | 富士胶片(中国)投资有限公司 | Auxiliary diagnosis method, device, system, equipment and medium |
| US20240020935A1 (en)* | 2022-07-15 | 2024-01-18 | The Boeing Company | Modeling system for 3d virtual model |
| US12272018B2 (en)* | 2022-07-15 | 2025-04-08 | The Boeing Company | Modeling system for 3D virtual model |
Also Published As
| Publication number | Publication date |
|---|---|
| AU1526300A (en) | 2000-06-19 |
| AU759501B2 (en) | 2003-04-17 |
| EP1133257A1 (en) | 2001-09-19 |
| EP2302595A2 (en) | 2011-03-30 |
| EP2302596A1 (en) | 2011-03-30 |
| EP1133257A4 (en) | 2007-12-26 |
| EP2302594A3 (en) | 2011-04-06 |
| EP2302594A2 (en) | 2011-03-30 |
| EP2302595A3 (en) | 2011-04-06 |
| CA2352671A1 (en) | 2000-06-08 |
Similar Documents
| Publication | Publication Date | Title |
|---|---|---|
| US7747055B1 (en) | Virtual endoscopy with improved image segmentation and lesion detection | |
| US8682045B2 (en) | Virtual endoscopy with improved image segmentation and lesion detection | |
| WO2000032106A1 (en) | Virtual endoscopy with improved image segmentation and lesion detection | |
| US6366800B1 (en) | Automatic analysis in virtual endoscopy | |
| EP1487333B1 (en) | System and method for analyzing and displaying computed tomography data | |
| US7474776B2 (en) | System and method for performing a three-dimensional virtual examination of objects, such as internal organs | |
| US20080117210A1 (en) | Virtual endoscopy | |
| AU757981B2 (en) | Automatic analysis in virtual endoscopy | |
| HK1156137A (en) | Virtual endoscopy with improved image segmentation and lesion detection | |
| HK1156135A (en) | Virtual endoscopy with improved image segmentation and lesion detection | |
| HK1156136A (en) | Virtual endoscopy with improved image segmentation and lesion detection | |
| AU742919B2 (en) | Automatic analysis in virtual endoscopy | |
| WO2006112895A1 (en) | Display and analysis of vessel lumen interiors |
Legal Events
| Date | Code | Title | Description |
|---|---|---|---|
| AS | Assignment | Owner name:WAKE FOREST UNIVERSITY HEALTH SCIENCES,NORTH CAROL Free format text:ASSIGNMENT OF ASSIGNORS INTEREST;ASSIGNOR:WAKE FOREST UNIVERSITY;REEL/FRAME:014484/0839 Effective date:20020701 | |
| AS | Assignment | Owner name:WAKE FOREST UNIVERSITY HEALTH SCIENCES,NORTH CAROL Free format text:ASSIGNMENT OF ASSIGNORS INTEREST;ASSIGNORS:VINING, DAVID J.;GE, YAORONG;HEMLER, PAUL F.;AND OTHERS;SIGNING DATES FROM 19990513 TO 19990526;REEL/FRAME:016299/0825 | |
| FEPP | Fee payment procedure | Free format text:PAYOR NUMBER ASSIGNED (ORIGINAL EVENT CODE: ASPN); ENTITY STATUS OF PATENT OWNER: LARGE ENTITY | |
| STCF | Information on status: patent grant | Free format text:PATENTED CASE | |
| FEPP | Fee payment procedure | Free format text:PAT HOLDER CLAIMS SMALL ENTITY STATUS, ENTITY STATUS SET TO SMALL (ORIGINAL EVENT CODE: LTOS); ENTITY STATUS OF PATENT OWNER: LARGE ENTITY | |
| REFU | Refund | Free format text:REFUND - PAYMENT OF MAINTENANCE FEE, 4TH YEAR, LARGE ENTITY (ORIGINAL EVENT CODE: R1551); ENTITY STATUS OF PATENT OWNER: LARGE ENTITY | |
| FPAY | Fee payment | Year of fee payment:4 | |
| FEPP | Fee payment procedure | Free format text:PAT HOLDER NO LONGER CLAIMS SMALL ENTITY STATUS, ENTITY STATUS SET TO UNDISCOUNTED (ORIGINAL EVENT CODE: STOL); ENTITY STATUS OF PATENT OWNER: LARGE ENTITY | |
| SULP | Surcharge for late payment | ||
| FEPP | Fee payment procedure | Free format text:MAINTENANCE FEE REMINDER MAILED (ORIGINAL EVENT CODE: REM.) | |
| LAPS | Lapse for failure to pay maintenance fees | Free format text:PATENT EXPIRED FOR FAILURE TO PAY MAINTENANCE FEES (ORIGINAL EVENT CODE: EXP.); ENTITY STATUS OF PATENT OWNER: LARGE ENTITY | |
| STCH | Information on status: patent discontinuation | Free format text:PATENT EXPIRED DUE TO NONPAYMENT OF MAINTENANCE FEES UNDER 37 CFR 1.362 | |
| FP | Lapsed due to failure to pay maintenance fee | Effective date:20220629 |