US7720857B2 - Method and system for providing an invisible attractor in a predetermined sector, which attracts a subset of entities depending on an entity type - Google Patents
Method and system for providing an invisible attractor in a predetermined sector, which attracts a subset of entities depending on an entity typeDownload PDFInfo
- Publication number
- US7720857B2 US7720857B2US10/927,316US92731604AUS7720857B2US 7720857 B2US7720857 B2US 7720857B2US 92731604 AUS92731604 AUS 92731604AUS 7720857 B2US7720857 B2US 7720857B2
- Authority
- US
- United States
- Prior art keywords
- entities
- entity
- graph
- predetermined
- sector
- Prior art date
- Legal status (The legal status is an assumption and is not a legal conclusion. Google has not performed a legal analysis and makes no representation as to the accuracy of the status listed.)
- Active, expires
Links
Images


Classifications
- G—PHYSICS
- G06—COMPUTING OR CALCULATING; COUNTING
- G06F—ELECTRIC DIGITAL DATA PROCESSING
- G06F16/00—Information retrieval; Database structures therefor; File system structures therefor
- G06F16/90—Details of database functions independent of the retrieved data types
- G06F16/903—Querying
- G06F16/9038—Presentation of query results
Definitions
- the present inventionrelates to a methods and systems for providing a visualization graph on a computer.
- Visualization graphsare tools that allow data to be handled and displayed on a display device according to certain criteria.
- the primary objective of navigation graphsis to display systems of complex interrelationships between entities, such as in a database or on the World Wide Web.
- Visualization graphscan be based on a semantic net including all entity types that occur where the considered entities are linked to each other by various kinds of relations.
- a visualization graphrepresents entities as boxes, often referred to as “nodes” of the graph, and relations as lines between the boxes.
- a common way of solving the problem of graphical layoutis to apply a physical simulation where all entities are treated as masses repulsing each other and the relations are treated as elastic lines trying to pull connected entities together.
- By double-clicking on a boxother entities that are directly related to the corresponding entity (but which may not yet in the graph) and their relations to other entities in the graph are included.
- the double-clicked entitythen moves to the center of the graph (it becomes the “focus” entity) and other nodes, which are too distant (measured in number of relations on the shortest path) from it are removed from the graph.
- a method of providing a visualization graph on a computercomprises storing data corresponding to a plurality of entities having a particular type, wherein a semantic net includes the entities and wherein the entities are linked to each other by a plurality of relations; in response to a query with respect to an entity selected from the plurality of entities, providing a visualization graph having a plurality of sectors representing the results of the query; and allocating the entities to a predetermined sector of the graph depending on their entity type. By allocating entities to a predetermined sector of the graph depending on their entity type, the location of the entity types can be predicted.
- a computer for providing a visualization graphcomprises a storage medium having recorded therein processor readable code processable to provide a visualization graph; a database for storing data corresponding to a plurality of entities having a particular type, wherein a semantic net includes the entities and wherein the entities are linked to each other by a plurality of relations; a query interface adapted, so that in response to a query with respect to an entity selected from the plurality of entities, a visualization graph is provided representing the results of the query, wherein the code comprises a plurality of attractor codes processable to attract the entities to a predetermined sector of the graph depending on their entity type.
- FIG. 1shows a grouping in a visualization graph
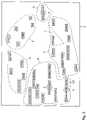
- FIG. 2shows further details of the visualization graph shown in FIG. 1 ;
- FIGS. 3-6show visualization graphs according to embodiments of the present invention.
- FIG. 7shows a visualization graph according to a further embodiment of the present invention.
- FIG. 8shows further details of the visualization graph shown in FIG. 7 ;
- FIG. 9shows an exemplary computer for carrying out the methods according to embodiments of the invention.
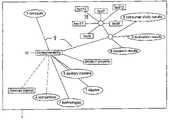
- FIGS. 1 and 2show examples of embodiments of the present invention.
- FIG. 1shows the position of attractors for top-level entity types, also referred to as “types” and FIG. 2 shows the approximate position of attractors for second-level entity types, also referred to as “sub-types.”
- FIG. 1shows details of a visualization graph 1 wherein a plurality of entities 2 are displayed. Associated with each entity is an attractor 3 . The attractors do not appear on the graph to a user, but are schematically depicted as dotted circles 3 .
- the entities 2are typically modelled as a mass. There is a repulsive force exerted by a repulsor between each pair of entities. The repulsive force may be inversely proportional to the distance or the square of the distance, or any other inverse relationship.
- the relations between entities(not shown in FIG. 1 ) are modelled as springs, typically linear springs. The model provides damping to ensure that the system converges.
- energyis put into the system, for example, when entities 2 are introduced into the graph or moved, the system is modelled to adopt the lowest energy level.
- the distance and repulsive forceis calculated from other entities and nodes. The forces are added to obtain a force vector.
- the reaction of the system in terms of acceleration and decelerationis dependent on the force vector.
- certain types (or kinds) of entities 2are arranged to appear in the same sector 4 of the graph 1 .
- a first embodimentis based on a non-deterministic approach, using attractors and repulsors.
- a second embodimentis based on a deterministic approach using a dynamic, but deterministic, subdivision of the screen and screen areas into sectors and sub-sectors, wherein entity types are allocated to sectors and entity sub-types are allocated to sub-sectors, respectively.
- the first non-deterministic embodimentis now described.
- certain kinds, that is types, of entities 2are arranged to appear in the same sector 4 of the graph.
- Invisible attractors 3that are not visible to a user of the graph are introduced for each entity type.
- the typesare “attribute,” “knowledge,” “property,” “real world object,” and “activity”. These may be referred to as top-level entity types.
- the angle theta 1 -theta 4 of each attractor 3 with respect to a referencemay be set by customizing and is inherited by all subtypes (refer to FIG. 2 which depicts subtypes 6 , wherein subtypes are entities 2 which have a type falling within the scope of a top-level type.
- FIG. 2“strategic business planning” is a sub-type of “activity.”
- FIGS. 1 and 2show the approximate location of the attractors 3 as dotted lines.
- the displaywhich is typically a computer screen, is divided into sectors 4 assigned to the respective top-level entity types 2 .
- the size of each sectordepends on the number of entities or nodes it contains, including all visible subtypes 6 . For example, if a larger number of entities are to be placed in a particular sector, that sector will become larger.
- the sectorsare recursively divided into subtype sectors 7 and again, their relative size depends on the number of entities they contain.
- the segmentation of the screenis repeated each time that entities are added to or removed from the graph 1 .
- the distance of the entities or nodes to the center of the graphis an oscillating function of the angle in order to avoid collisions (which in the simulative approach are avoided by the repulsive force between entities).
- the location on the graph of the allocated entitiesis adapted in accordance with the additional entity. In this way, the graph becomes dynamic and more versatile.
- the methodmay include the further step of providing attractors 3 which attract the entities to the predetermined sector in accordance with their entity types. In doing so, a so-called “360° Navigation Graph” is achieved, whereby the location of each entity can be predicted without having to carry out a complete, and thus, very complex deterministic approach.
- the methodmay include the further step of providing repulsors to repulse the entities allocated to the predetermined sector 4 from one another. This achieves an optimization of the distribution of entities 2 within a sector 4 . Further, the location of an entity 2 on the graph 1 may be determined by the sum of the influence exerted on the entity 2 by the attractor 3 and the repulsors.
- the methodmay include the steps of: dividing the graph into sectors 4 , wherein an entity 2 is allocated to one of the sectors 4 according to its entity type, and dividing the sectors 4 into sub-sectors 7 , wherein an entity 2 is allocated to one of the sub-sectors 7 in accordance with its entity sub-type, wherein the size of the sectors 4 and the sub-sectors 7 is determined in accordance with the number of entities of a particular type allocated to the sector 4 and the number of entities of a particular sub-type allocated to the sub-sector 7 , respectively.
- the methodmay include the step of: repeating the dividing steps if the number of entities 2 to be displayed on the graph 1 changes.
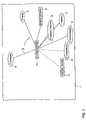
- FIG. 3shows a visualization graph according to further embodiments of the present invention.
- FIG. 3shows a focus entity 10 with related entities 2 and those comprised in nodes 9 , clustered by entity type.
- the dashed linesindicate indirectly related items, “competitors”, “market”, selected due to user preferences.
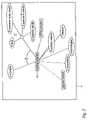
- FIG. 4shows further details of the visualization graph shown in FIG. 3 .
- FIG. 4depicts a display of a group's common relations 8 as indicated when a mouse, or other indicator adapted for use with a computer, is passed over the desired node (MouseOver).
- groups of entities 9 with common relations 8are bundled and displayed as group nodes 9 ( FIG. 3 ). Of all possible groupings those are selected which result in the most even distribution of entities 2 (also referred as elements) over the groups and which form groups of entities 2 (elements) which have at least two relations 8 in common.
- the common relations 8may be explicitly assigned to each entity in a group, but they may also be abstractions of the individual relations 8 .
- This embodimentis shown in FIG. 4 , where the common relations 8 of the group “sanitary napkins” are displayed: each of these products has got a relation 8 “refers to German market” and a relation 8 “has property biodegradability.” These are direct relations 8 .
- a company having access to the graphsells two products in the group and competing companies sell the remaining products. Since the semantic net contains the information that all those are companies, a common abstract relation 8 “is sold by some company” is created, which also characterizes the elements of the group.
- the selection codeis dynamic resulting in a dynamic grouping of the entities. That is, depending on certain criteria such as the context, the selection and abstraction, if applied, may at different times provide different groupings.
- the methodcomprises the further step of selecting those entities from the plurality of entities having at least one common relation 8 and storing the selected entities as a plurality of groups, representing the groups on the graph as a plurality of nodes 9 , and representing only those relations 8 which all of the nodes 9 have in common.
- a selecting stepincludes abstracting the relations 8 to find the common relation 8 .
- characteristicsare used to identify common relations 8 . In such a way that an even distribution of nodes in the graph is achieved.
- facetsare introduced.
- the usermay define facets for each entity type. Facets are predefined groups that are characterized by the entity type of their elements or the kind of relation 8 that connects their elements to the focus entity.
- facetshave been defined for product properties knowledge, products, technologies, persons, life cycle phases, companies, ideas, insights, facts, concepts, approaches, activities. If facets are defined, all entities related to the focus entity will be sorted into the corresponding facets (groups) and the dynamic grouping algorithm is used only to subdivide these facets into smaller groups (if possible).
- FIGS. 5-8show visualization graphs according to examples of further embodiments of the present invention.
- FIG. 5depicts an exploding group 15 , wherein association of members to group remains visible.
- FIG. 6depicts a display of entity type 16 as viewed with the MouseOver function.
- FIG. 7depicts an explosion of a group into subgroups 17 .
- FIG. 8depicts the explosion of a subgroup 18 .
- an aspect of the present inventionallows the formation of groups in a 2D visualization graph whilst keeping it clear. According to an embodiment of the present invention this is achieved by keeping the space required for the nodes minimal and the origin of the added nodes traceable. Further, the graph is rearranged in a smooth way to avoid confusion of the user.
- the group nodeincreases repulsive force proportionally to the number of entities to be inserted in order to make room for the new nodes.
- the actual insertionbegins, when the neighbor nodes have moved sufficiently far away.
- this relation 8is only displayed indirectly: the new entities are connected to the group node which remains in the graph as “bundler” without label and establishes the relation 8 to the “focus” node 10 .
- the number of lines connected to the center node 10remains low.
- Double-clicking a “bundler” node 11causes group to collapse again into one node.
- the recursive explosion and collapsing of subgroups 18is also possible (FIG. 7 , 8 ).
- the resulting representationlooks and behaves similar to a “tree view control”.
- the main differenceis that a tree view represents an existing hierarchical structure, whereas the group nodes in the graph dynamically create a hierarchy-like structure in order to get a clearer graph layout. Also the problem of finding a 2D graph layout does not exist for conventional tree view controls.
- the methodmay include step of: representing a plurality of entities 2 having a common relation 8 as a first node 9 on the visualization graph 1 , and in response to a predetermined stimulus causing the entities 2 comprised at the first node 9 to be displayed, and in response to a further predetermined stimulus causing the graph to restructure so that the entities displayed are replaced by the node 9 .
- the node 9in response to the first predetermined stimulus, the node 9 remains in the graph to represent the common relation 8 .
- the “group node”is kept in the graph and represents the common relations 8 , while the single group members (entities) have a link to the group node.
- the entitiesmay be linked to a further entity or node via a link which represents a relation 8 which may not be common to all entities linked to the first node 9 .
- certain embodiments of the present inventionprovide a visualization graph layout such that the number of nodes is kept low without missing out potentially relevant information.
- thisis achieved in the following way: when the focus of a graph changes, new related entities are inserted, and therefore other entities have to be removed.
- d ⁇ d maxthe distance is the number of relations 8 on the shortest path between a node and the focus node. Since the number of nodes usually increases exponentially with d max , a value of 1 or 2 is appropriate for most purposes.
- entities of certain typesmay be included in the graph even if they are far more distant to the focus, if they are considered to be of special interest in the current context either due to their entity type or due to the kind of relations 8 linking them to the focus node.
- the context information in this casecan be made up, but is not limited, from the following components current user's general preferences, context information attached to the “focus” node, and current user's current role and/or session history.
- the entity 2 “German market” and a group of “four competitors” 12appear in the graph connected with dashed lines to the focus node 10 .
- These entities 12have no direct relation 8 to the product property “biodegradability,” but are related via some products.
- the systemhas been told that if an entity of the type “product property” is in the focus, markets and competitors are of special interest. So all markets and competitors in a certain distance d ⁇ 4 to the entity “biodegradability” are selected and inserted into the graph. More sophisticated algorithms may be applied to find entities of special interest and it is even possible to let the user create context specific algorithms by means of a scripting language or macro recorder.
- the methodmay comprise the further steps of: storing 24 data corresponding to a plurality of entities and/or nodes 2 , 9 , wherein a semantic net includes the entities and/or nodes 2 , 9 and wherein the entities and/or nodes 2 , 9 are linked to each other by a plurality of relations 8 , generating a query, performing the query on the data, and outputting at least two of the plurality of data in the form of a visualization graph 1 representing the results of the query, wherein the graph 1 has a focus entity or node 10 defined by a user or the query, and using context information to determine at least one entity and/or node to be output in the results which is indirectly related to the focus 10 .
- the userBy providing the possibility to display entities that are indirectly related to the “focus” entity based on the current context and user preferences, the user is able to collect additional information even if there is no direct relationship between entities. Thus, allowing the user to “jump” from context to context within the graph.
- This embodiment of the present inventionallows a user to find how large amounts of data are related. The user is able to navigate and explore knowledge domains in a visual way.
- FIG. 9shows a typical computer arrangement for carrying out the methods according to embodiments of the invention.
- FIG. 5shows a computer 20 including a central processing unit (CPU) 22 .
- the computerfurther includes a storage medium, which may be located in the CPU 22 and/or elsewhere.
- processor readable codeis stored, which may be read by the CPU 22 to provide a visualization graph.
- Various codesmay be stored an allocator code processable to allocate the entities to a predetermined sector of the graph depending on their entity type, additional entity allocator code processable so that if an additional entity of a particular entity type is stored in a storing step, the location on the graph of the allocated entities is adapted in accordance with the additional entity.
- the allocator codemay include a plurality of attractor codes processable to attract the entities to a predetermined sector of the graph depending on their entity type, respectively, a plurality of repulsor codes processable to repulse the entities allocated to the predetermined sector from one another.
- the attractor codes and the repulsor codesare processable so that the location of an entity on a graph is determined by the sum of the influence exerted on the entity by the attractor code and the repulsor codes.
- the allocator codemay further comprise dividing code processable to divide the graph into sectors, wherein an entity is allocated to one of the sectors according to its entity type, and further dividing code processable to further divide the sectors into sub-sectors, wherein an entity is allocated to one of the sub-sectors in accordance with its entity sub-type, wherein the size of the sectors and the sub-sectors is determined in accordance with the number of entities of a particular type allocated to the sector and the number of entities of a particular sub-type allocated to the sub-sector, respectively.
- the allocator codemay also include repeater code processable to activate the dividing code if the number of entities to be displayed on a graph changes.
- the processable codemay further comprise selection code processable to select those entities from the plurality of entities having a common relation 8 and storing the selected entities as a plurality of groups, representation code processable to represent the groups on the graph as a plurality of nodes, wherein only those relations 8 which all of the nodes have in common are represented.
- the codemay also include representation code processable to represent a plurality of entities having a common relation 8 as a node on a visualization graph, and in response to a predetermined stimulus causing the entities comprised at the node to be displayed, and in response to a further predetermined stimulus causing a graph to restructure so that the entities displayed are replaced by the node.
- a display device 30such as a screen, for displaying a visualization graph 1 .
- the usermay use a keyboard 40 , mouse 42 or other operating device to communicate with the computer 20 and to instruct the computer to perform a query.
- the querymay be generated automatically or by a user.
- Context informationmay be defined in the query. Alternatively, it may not form part of the query, and may be defined in some other way, for example, by user preferences.
- a computer 20for providing a visualization graph 1
- the computer 20may comprise: a database 24 , 60 for storing data corresponding to a plurality of entities and/or nodes 2 , 9 , wherein a semantic net includes the entities and/or nodes 2 , 9 and wherein the entities and/or nodes 2 , 9 are linked to each other by a plurality of relations 8 , a storage medium 22 having recorded therein processor readable code processable to provide a visualization graph 1 , the code including a query code processable to perform a query on the database, an output device 30 for outputting at least two of the plurality of data in the form of a visualization graph 1 representing the results of the query, wherein the graph 1 has a focus entity or node 10 defined by a user or the query, wherein the code further includes context code processable to express context information which is processable to determine at least one entity and/or node to be output in the results which is indirectly related to the focus 10 .
- the context codemay be processable to allow at least one entity 2 and/or node 9 to be output in the results that are indirectly related by more than two relations 8 .
- the context codemay also be processable to enable identification of at least one entity and/or node 2 , 9 having a particular interest with respect to the focus 10 , and/or may be processable to identify a particular interest on the basis of an entity 2 or node 9 type or due to the relations 8 linking the entity and/or node 2 , 9 to the focus 10 .
- the context codemay be determined by any or a combination of: at least one predetermined user preference, information associated with the focus, or a user's current role and/or session history query.
- the database 24 in which data for building the graph is storedmay be located locally at the computer 20 .
- the database 60 or an additional databasemay be located remotely from the computer 20 .
- the computeris provided with means to remotely access a remote database.
- a modem 26connected via the Internet 50 or other network or communications link to the remote database 60 .
- FIG. 9is a typical Internet configuration, other configurations may also be possible.
- a stand-alone configurationis also envisaged.
- the databasemay be distributed over more than one computer. While parts of the processing may be performed on the user's computer, other parts of the processing may be performed remotely at a remote computer.
- the visualization graphis concerned with aspects of company dealing with personal hygiene products.
- the inventionis not limited in this respect.
- the present inventionfinds application in any sphere where data is to be navigated. In particular, where complex interrelationships of data are to be navigated.
- Further applicationsare found where data in one or more databases is somehow related to one another. Further applications include Internet applications, where metadata is accessed and used.
- the expression “visualization graph”is intended to cover visual representations, such as navigation graphs and other such tools.
Landscapes
- Engineering & Computer Science (AREA)
- Databases & Information Systems (AREA)
- Theoretical Computer Science (AREA)
- Computational Linguistics (AREA)
- Data Mining & Analysis (AREA)
- Physics & Mathematics (AREA)
- General Engineering & Computer Science (AREA)
- General Physics & Mathematics (AREA)
- User Interface Of Digital Computer (AREA)
- Information Retrieval, Db Structures And Fs Structures Therefor (AREA)
Abstract
Description
Claims (20)
Applications Claiming Priority (6)
| Application Number | Priority Date | Filing Date | Title |
|---|---|---|---|
| EP03077697 | 2003-08-29 | ||
| EP03077697.5 | 2003-08-29 | ||
| EP03077697AEP1510937A1 (en) | 2003-08-29 | 2003-08-29 | A method of providing a visualisation graph on a computer and a computer for providing a visualisation graph |
| EP03078585 | 2003-11-14 | ||
| EP03078585.1 | 2003-11-14 | ||
| EP03078585AEP1510940A1 (en) | 2003-08-29 | 2003-11-14 | A method of providing a visualisation graph on a computer and a computer for providing a visualisation graph |
Publications (2)
| Publication Number | Publication Date |
|---|---|
| US20050114384A1 US20050114384A1 (en) | 2005-05-26 |
| US7720857B2true US7720857B2 (en) | 2010-05-18 |
Family
ID=34105748
Family Applications (1)
| Application Number | Title | Priority Date | Filing Date |
|---|---|---|---|
| US10/927,316Active2025-11-29US7720857B2 (en) | 2003-08-29 | 2004-08-27 | Method and system for providing an invisible attractor in a predetermined sector, which attracts a subset of entities depending on an entity type |
Country Status (3)
| Country | Link |
|---|---|
| US (1) | US7720857B2 (en) |
| EP (1) | EP1510940A1 (en) |
| JP (1) | JP2005100375A (en) |
Cited By (36)
| Publication number | Priority date | Publication date | Assignee | Title |
|---|---|---|---|---|
| US20090317061A1 (en)* | 2008-06-24 | 2009-12-24 | Samsung Electronics Co., Ltd. | Image generating method and apparatus and image processing method and apparatus |
| US20090317062A1 (en)* | 2008-06-24 | 2009-12-24 | Samsung Electronics Co., Ltd. | Image processing method and apparatus |
| US20100049766A1 (en)* | 2006-08-31 | 2010-02-25 | Peter Sweeney | System, Method, and Computer Program for a Consumer Defined Information Architecture |
| US20100057664A1 (en)* | 2008-08-29 | 2010-03-04 | Peter Sweeney | Systems and methods for semantic concept definition and semantic concept relationship synthesis utilizing existing domain definitions |
| US20100235307A1 (en)* | 2008-05-01 | 2010-09-16 | Peter Sweeney | Method, system, and computer program for user-driven dynamic generation of semantic networks and media synthesis |
| US20110060645A1 (en)* | 2009-09-08 | 2011-03-10 | Peter Sweeney | Synthesizing messaging using context provided by consumers |
| US20110060794A1 (en)* | 2009-09-08 | 2011-03-10 | Peter Sweeney | Synthesizing messaging using context provided by consumers |
| US20110060644A1 (en)* | 2009-09-08 | 2011-03-10 | Peter Sweeney | Synthesizing messaging using context provided by consumers |
| US20110113386A1 (en)* | 2009-11-10 | 2011-05-12 | Peter Sweeney | System, method and computer program for creating and manipulating data structures using an interactive graphical interface |
| US20120272168A1 (en)* | 2011-04-20 | 2012-10-25 | Panafold | Methods, apparatus, and systems for visually representing a relative relevance of content elements to an attractor |
| US8332782B1 (en)* | 2008-02-22 | 2012-12-11 | Adobe Systems Incorporated | Network visualization and navigation |
| US8386495B1 (en)* | 2010-04-23 | 2013-02-26 | Google Inc. | Augmented resource graph for scoring resources |
| US8676732B2 (en) | 2008-05-01 | 2014-03-18 | Primal Fusion Inc. | Methods and apparatus for providing information of interest to one or more users |
| US20140129595A1 (en)* | 2012-11-07 | 2014-05-08 | Sap Ag | 2-dimensional multi-hierarchy display |
| US8849860B2 (en) | 2005-03-30 | 2014-09-30 | Primal Fusion Inc. | Systems and methods for applying statistical inference techniques to knowledge representations |
| US20150135048A1 (en)* | 2011-04-20 | 2015-05-14 | Panafold | Methods, apparatus, and systems for visually representing a relative relevance of content elements to an attractor |
| US9087296B2 (en) | 2008-02-22 | 2015-07-21 | Adobe Systems Incorporated | Navigable semantic network that processes a specification to and uses a set of declaritive statements to produce a semantic network model |
| US9092516B2 (en) | 2011-06-20 | 2015-07-28 | Primal Fusion Inc. | Identifying information of interest based on user preferences |
| US9104779B2 (en) | 2005-03-30 | 2015-08-11 | Primal Fusion Inc. | Systems and methods for analyzing and synthesizing complex knowledge representations |
| US20150248190A1 (en)* | 2012-10-12 | 2015-09-03 | Mitsubishi Electric Corporation | Screen transition diagram creator |
| US9177248B2 (en) | 2005-03-30 | 2015-11-03 | Primal Fusion Inc. | Knowledge representation systems and methods incorporating customization |
| US9235806B2 (en) | 2010-06-22 | 2016-01-12 | Primal Fusion Inc. | Methods and devices for customizing knowledge representation systems |
| US9262520B2 (en) | 2009-11-10 | 2016-02-16 | Primal Fusion Inc. | System, method and computer program for creating and manipulating data structures using an interactive graphical interface |
| US20160055261A1 (en)* | 2014-08-22 | 2016-02-25 | Cray Inc. | User-controlled graph analysis system |
| US9361365B2 (en) | 2008-05-01 | 2016-06-07 | Primal Fusion Inc. | Methods and apparatus for searching of content using semantic synthesis |
| US9378203B2 (en) | 2008-05-01 | 2016-06-28 | Primal Fusion Inc. | Methods and apparatus for providing information of interest to one or more users |
| US9836183B1 (en)* | 2016-09-14 | 2017-12-05 | Quid, Inc. | Summarized network graph for semantic similarity graphs of large corpora |
| WO2018042204A1 (en)* | 2016-09-05 | 2018-03-08 | SimCentric Limited | Method of displaying search results |
| US10002325B2 (en) | 2005-03-30 | 2018-06-19 | Primal Fusion Inc. | Knowledge representation systems and methods incorporating inference rules |
| US20190065376A1 (en)* | 2017-08-30 | 2019-02-28 | Oracle International Corporation | Utilization-based throttling of hardware prefetchers |
| US10248669B2 (en) | 2010-06-22 | 2019-04-02 | Primal Fusion Inc. | Methods and devices for customizing knowledge representation systems |
| US10394778B2 (en) | 2010-09-03 | 2019-08-27 | Robert Lewis Jackson, JR. | Minimal representation of connecting walks |
| US10503779B2 (en) | 2012-04-18 | 2019-12-10 | Ganalila, Llc | Association mapping game |
| US11023481B2 (en) | 2018-08-08 | 2021-06-01 | commos inc. | Navigation platform for performing search queries |
| US11079901B2 (en) | 2013-03-13 | 2021-08-03 | Ganalila, Llc | Systems and methods for presenting and discovering relationships between information units |
| US11294977B2 (en) | 2011-06-20 | 2022-04-05 | Primal Fusion Inc. | Techniques for presenting content to a user based on the user's preferences |
Families Citing this family (6)
| Publication number | Priority date | Publication date | Assignee | Title |
|---|---|---|---|---|
| EP1510938B1 (en)* | 2003-08-29 | 2014-06-18 | Sap Ag | A method of providing a visualisation graph on a computer and a computer for providing a visualisation graph |
| US8775955B2 (en)* | 2010-12-02 | 2014-07-08 | Sap Ag | Attraction-based data visualization |
| US8970595B2 (en)* | 2011-10-26 | 2015-03-03 | Microsoft Corporation | Display and interaction with multidimensional data |
| US9836551B2 (en)* | 2013-01-08 | 2017-12-05 | International Business Machines Corporation | GUI for viewing and manipulating connected tag clouds |
| CN110647574B (en)* | 2019-09-24 | 2022-05-03 | 厦门市美亚柏科信息股份有限公司 | Social network data display method, terminal device and storage medium |
| WO2022013873A1 (en) | 2020-07-16 | 2022-01-20 | Wp Semantix Ltd | System and method for implementing ontologies in sql |
Citations (69)
| Publication number | Priority date | Publication date | Assignee | Title |
|---|---|---|---|---|
| WO1992011724A1 (en) | 1990-12-18 | 1992-07-09 | Bell Communications Research, Inc. | Visual programming of telephone network call processing logic |
| US5590250A (en) | 1994-09-14 | 1996-12-31 | Xerox Corporation | Layout of node-link structures in space with negative curvature |
| US5619632A (en) | 1994-09-14 | 1997-04-08 | Xerox Corporation | Displaying node-link structure with region of greater spacings and peripheral branches |
| US5740440A (en) | 1995-01-06 | 1998-04-14 | Objective Software Technology | Dynamic object visualization and browsing system |
| US5777622A (en)* | 1996-01-05 | 1998-07-07 | International Business Machines Corporation | Method for identifying invisible objects ordered in a tree-like data structure by finding adjoining hidden objects |
| US6144962A (en) | 1996-10-15 | 2000-11-07 | Mercury Interactive Corporation | Visualization of web sites and hierarchical data structures |
| EP1050829A2 (en) | 1999-04-22 | 2000-11-08 | International Business Machines Corporation | Visualization of graph-structured name spaces |
| US6154220A (en) | 1998-10-19 | 2000-11-28 | Microsoft Corporation | Rectilinear layout |
| US6154213A (en) | 1997-05-30 | 2000-11-28 | Rennison; Earl F. | Immersive movement-based interaction with large complex information structures |
| US6216134B1 (en) | 1998-06-25 | 2001-04-10 | Microsoft Corporation | Method and system for visualization of clusters and classifications |
| US6263339B1 (en)* | 1998-08-25 | 2001-07-17 | Informix Software, Inc. | Dynamic object visualization and code generation |
| US6266805B1 (en) | 1997-07-25 | 2001-07-24 | British Telecommunications Plc | Visualization in a modular software system |
| US6285951B1 (en) | 1999-07-02 | 2001-09-04 | Pri Automation, Inc. | Dynamic traffic based routing algorithm |
| WO2001088751A1 (en) | 2000-05-12 | 2001-11-22 | Vast Video, Incorporated | Method and apparatus for aiding consistent, high-quality input of meta-information associated with items inserted into a database |
| US6356285B1 (en) | 1997-12-17 | 2002-03-12 | Lucent Technologies, Inc | System for visually representing modification information about an characteristic-dependent information processing system |
| US6369819B1 (en) | 1998-04-17 | 2002-04-09 | Xerox Corporation | Methods for visualizing transformations among related series of graphs |
| US6373484B1 (en) | 1999-01-21 | 2002-04-16 | International Business Machines Corporation | Method and system for presenting data structures graphically |
| US6377287B1 (en)* | 1999-04-19 | 2002-04-23 | Hewlett-Packard Company | Technique for visualizing large web-based hierarchical hyperbolic space with multi-paths |
| US20020087275A1 (en) | 2000-07-31 | 2002-07-04 | Junhyong Kim | Visualization and manipulation of biomolecular relationships using graph operators |
| US6434556B1 (en) | 1999-04-16 | 2002-08-13 | Board Of Trustees Of The University Of Illinois | Visualization of Internet search information |
| WO2002069192A1 (en) | 2001-02-26 | 2002-09-06 | Compudigm International Limited | Data visualisation system and method |
| US20020130907A1 (en) | 2001-03-15 | 2002-09-19 | Chi Ed H. | Method for visualizing user path through a web site and a path's associated information scent |
| US20020133392A1 (en) | 2001-02-22 | 2002-09-19 | Angel Mark A. | Distributed customer relationship management systems and methods |
| US20020154175A1 (en) | 2001-01-04 | 2002-10-24 | James Abello | System and method for visualizing massive multi-digraphs |
| US20020158918A1 (en) | 2001-03-28 | 2002-10-31 | Sarnoff Corporation | Method and apparatus for visualizing correlations among and between objects and events |
| US6480843B2 (en) | 1998-11-03 | 2002-11-12 | Nec Usa, Inc. | Supporting web-query expansion efficiently using multi-granularity indexing and query processing |
| US6496832B2 (en)* | 1998-10-20 | 2002-12-17 | University Of Minnesota | Visualization spreadsheet |
| US20020196292A1 (en) | 2001-04-06 | 2002-12-26 | International Business Machines Corporation | Graph data visualization and graphics preparation |
| US20030011601A1 (en) | 2001-06-19 | 2003-01-16 | International Business Machines Corporation | Graphics image creation apparatus, and method and program therefor |
| US6556983B1 (en) | 2000-01-12 | 2003-04-29 | Microsoft Corporation | Methods and apparatus for finding semantic information, such as usage logs, similar to a query using a pattern lattice data space |
| US20030085931A1 (en) | 2000-12-21 | 2003-05-08 | Xerox Corporation | System and method for browsing hierarchically based node-link structures based on an estimated degree of interest |
| US6583794B1 (en)* | 1999-07-01 | 2003-06-24 | Smart Money | Interface system for information mapping |
| WO2003069506A2 (en) | 2002-02-12 | 2003-08-21 | Accenture Global Services Gmbh | Display of data element indicia based on data types |
| US20030167324A1 (en)* | 2002-02-20 | 2003-09-04 | Farnham Shelly D. | Social mapping of contacts from computer communication information |
| US6646652B2 (en) | 2000-12-21 | 2003-11-11 | Xerox Corporation | System and method for browsing node-link structures based on an estimated degree of interest |
| US6654761B2 (en) | 1998-07-29 | 2003-11-25 | Inxight Software, Inc. | Controlling which part of data defining a node-link structure is in memory |
| US20030220928A1 (en) | 2002-05-21 | 2003-11-27 | Patrick Durand | Method for organizing and querying a genomic and proteomic databases |
| US20040024533A1 (en) | 2002-08-05 | 2004-02-05 | Hitachi, Ltd. | Method for node mapping, network visualizing and screening |
| US20040030741A1 (en) | 2001-04-02 | 2004-02-12 | Wolton Richard Ernest | Method and apparatus for search, visual navigation, analysis and retrieval of information from networks with remote notification and content delivery |
| US20040059521A1 (en) | 2002-09-23 | 2004-03-25 | Han Kyung Sook | Method for visualizing large-scale protein interaction data |
| US6714936B1 (en) | 1999-05-25 | 2004-03-30 | Nevin, Iii Rocky Harry W. | Method and apparatus for displaying data stored in linked nodes |
| US20040088678A1 (en) | 2002-11-05 | 2004-05-06 | International Business Machines Corporation | System and method for visualizing process flows |
| US20040111255A1 (en) | 2002-12-10 | 2004-06-10 | International Business Machines Corporation | Graph-based method for design, representation, and manipulation of NLU parser domains |
| US20040113953A1 (en) | 2002-12-16 | 2004-06-17 | Palo Alto Research Center, Incorporated | Method and apparatus for displaying hierarchical information |
| US20040133433A1 (en) | 2001-08-01 | 2004-07-08 | Young-Gyun Lee | Method for analyzing and providing of inter-relations between patents from the patent database |
| US20040150644A1 (en) | 2003-01-30 | 2004-08-05 | Robert Kincaid | Systems and methods for providing visualization and network diagrams |
| US6789054B1 (en)* | 1999-04-25 | 2004-09-07 | Mahmoud A. Makhlouf | Geometric display tools and methods for the visual specification, design automation, and control of adaptive real systems |
| US6792400B2 (en)* | 2000-12-18 | 2004-09-14 | General Motors Corporation | Visualization of complex system interactions |
| US6795825B2 (en) | 2000-09-12 | 2004-09-21 | Naphtali David Rishe | Database querying system and method |
| US20040243938A1 (en) | 2003-04-08 | 2004-12-02 | Thomas Weise | Interface and method for exploring a collection of data |
| US6868525B1 (en) | 2000-02-01 | 2005-03-15 | Alberti Anemometer Llc | Computer graphic display visualization system and method |
| US6888548B1 (en)* | 2001-08-31 | 2005-05-03 | Attenex Corporation | System and method for generating a visualized data representation preserving independent variable geometric relationships |
| US6897885B1 (en)* | 2000-06-19 | 2005-05-24 | Hewlett-Packard Development Company, L.P. | Invisible link visualization method and system in a hyperbolic space |
| US20050114802A1 (en)* | 2003-08-29 | 2005-05-26 | Joerg Beringer | Methods and systems for providing a visualization graph |
| US6901555B2 (en) | 2001-07-09 | 2005-05-31 | Inxight Software, Inc. | Tree visualization system and method based upon a compressed half-plane model of hyperbolic geometry |
| US6981228B1 (en) | 2000-09-29 | 2005-12-27 | Sbc Technology Resources, Inc. | Interactive topology graphs for visualization and characterization of SONET consumption patterns |
| US20060037019A1 (en)* | 2004-07-23 | 2006-02-16 | Austin Mark A | Tree-to-graph folding procedure for systems engineering requirements |
| US20060044319A1 (en) | 2004-08-31 | 2006-03-02 | Oracle International Corporation | Displaying information using nodes in a graph |
| US20060106847A1 (en) | 2004-05-04 | 2006-05-18 | Boston Consulting Group, Inc. | Method and apparatus for selecting, analyzing, and visualizing related database records as a network |
| US7089266B2 (en) | 2003-06-02 | 2006-08-08 | The Board Of Trustees Of The Leland Stanford Jr. University | Computer systems and methods for the query and visualization of multidimensional databases |
| US20060288311A1 (en)* | 2005-05-20 | 2006-12-21 | Palo Alto Research Center | Method, apparatus, and program product for visualizing tree structured information |
| US7167865B1 (en)* | 2003-06-30 | 2007-01-23 | Mvalent, Inc. | Collaborative environment for producing software products |
| US7203701B1 (en) | 2002-02-20 | 2007-04-10 | Trilogy Development Group, Inc. | System and method for an interface to provide visualization and navigation of a directed graph |
| US20070124291A1 (en) | 2005-11-29 | 2007-05-31 | Hassan Hany M | Method and system for extracting and visualizing graph-structured relations from unstructured text |
| US7421665B2 (en) | 2004-08-31 | 2008-09-02 | Oracle International Corporation | Node scrollers |
| US7468727B2 (en) | 2005-04-19 | 2008-12-23 | Wong Pak C | Methods of visualizing graphs |
| US7549309B2 (en)* | 2003-08-29 | 2009-06-23 | Sap Ag | Method and system for restructuring a visualization graph so that entities linked to a common node are replaced by the common node in response to a predetermined stimulus |
| US20090265324A1 (en)* | 2008-04-16 | 2009-10-22 | Cognos Ulc | Query processing visualization system and method of visualizing query processing |
| US7617185B2 (en)* | 2003-08-29 | 2009-11-10 | Sap Ag | Methods and systems for providing a visualization graph |
- 2003
- 2003-11-14EPEP03078585Apatent/EP1510940A1/ennot_activeCeased
- 2004
- 2004-08-26JPJP2004246055Apatent/JP2005100375A/enactivePending
- 2004-08-27USUS10/927,316patent/US7720857B2/enactiveActive
Patent Citations (72)
| Publication number | Priority date | Publication date | Assignee | Title |
|---|---|---|---|---|
| WO1992011724A1 (en) | 1990-12-18 | 1992-07-09 | Bell Communications Research, Inc. | Visual programming of telephone network call processing logic |
| US5590250A (en) | 1994-09-14 | 1996-12-31 | Xerox Corporation | Layout of node-link structures in space with negative curvature |
| US5619632A (en) | 1994-09-14 | 1997-04-08 | Xerox Corporation | Displaying node-link structure with region of greater spacings and peripheral branches |
| US5740440A (en) | 1995-01-06 | 1998-04-14 | Objective Software Technology | Dynamic object visualization and browsing system |
| US5777622A (en)* | 1996-01-05 | 1998-07-07 | International Business Machines Corporation | Method for identifying invisible objects ordered in a tree-like data structure by finding adjoining hidden objects |
| US6144962A (en) | 1996-10-15 | 2000-11-07 | Mercury Interactive Corporation | Visualization of web sites and hierarchical data structures |
| US6154213A (en) | 1997-05-30 | 2000-11-28 | Rennison; Earl F. | Immersive movement-based interaction with large complex information structures |
| US6266805B1 (en) | 1997-07-25 | 2001-07-24 | British Telecommunications Plc | Visualization in a modular software system |
| US6356285B1 (en) | 1997-12-17 | 2002-03-12 | Lucent Technologies, Inc | System for visually representing modification information about an characteristic-dependent information processing system |
| US6369819B1 (en) | 1998-04-17 | 2002-04-09 | Xerox Corporation | Methods for visualizing transformations among related series of graphs |
| US6216134B1 (en) | 1998-06-25 | 2001-04-10 | Microsoft Corporation | Method and system for visualization of clusters and classifications |
| US6654761B2 (en) | 1998-07-29 | 2003-11-25 | Inxight Software, Inc. | Controlling which part of data defining a node-link structure is in memory |
| US6263339B1 (en)* | 1998-08-25 | 2001-07-17 | Informix Software, Inc. | Dynamic object visualization and code generation |
| US6154220A (en) | 1998-10-19 | 2000-11-28 | Microsoft Corporation | Rectilinear layout |
| US6496832B2 (en)* | 1998-10-20 | 2002-12-17 | University Of Minnesota | Visualization spreadsheet |
| US6480843B2 (en) | 1998-11-03 | 2002-11-12 | Nec Usa, Inc. | Supporting web-query expansion efficiently using multi-granularity indexing and query processing |
| US6373484B1 (en) | 1999-01-21 | 2002-04-16 | International Business Machines Corporation | Method and system for presenting data structures graphically |
| US6434556B1 (en) | 1999-04-16 | 2002-08-13 | Board Of Trustees Of The University Of Illinois | Visualization of Internet search information |
| US6377287B1 (en)* | 1999-04-19 | 2002-04-23 | Hewlett-Packard Company | Technique for visualizing large web-based hierarchical hyperbolic space with multi-paths |
| EP1050829A2 (en) | 1999-04-22 | 2000-11-08 | International Business Machines Corporation | Visualization of graph-structured name spaces |
| US6789054B1 (en)* | 1999-04-25 | 2004-09-07 | Mahmoud A. Makhlouf | Geometric display tools and methods for the visual specification, design automation, and control of adaptive real systems |
| US6714936B1 (en) | 1999-05-25 | 2004-03-30 | Nevin, Iii Rocky Harry W. | Method and apparatus for displaying data stored in linked nodes |
| US6583794B1 (en)* | 1999-07-01 | 2003-06-24 | Smart Money | Interface system for information mapping |
| US6285951B1 (en) | 1999-07-02 | 2001-09-04 | Pri Automation, Inc. | Dynamic traffic based routing algorithm |
| US6556983B1 (en) | 2000-01-12 | 2003-04-29 | Microsoft Corporation | Methods and apparatus for finding semantic information, such as usage logs, similar to a query using a pattern lattice data space |
| US6868525B1 (en) | 2000-02-01 | 2005-03-15 | Alberti Anemometer Llc | Computer graphic display visualization system and method |
| US7574659B2 (en)* | 2000-02-01 | 2009-08-11 | Andrew Szabo | Computer graphic display visualization system and method |
| WO2001088751A1 (en) | 2000-05-12 | 2001-11-22 | Vast Video, Incorporated | Method and apparatus for aiding consistent, high-quality input of meta-information associated with items inserted into a database |
| US6897885B1 (en)* | 2000-06-19 | 2005-05-24 | Hewlett-Packard Development Company, L.P. | Invisible link visualization method and system in a hyperbolic space |
| US20020087275A1 (en) | 2000-07-31 | 2002-07-04 | Junhyong Kim | Visualization and manipulation of biomolecular relationships using graph operators |
| US6795825B2 (en) | 2000-09-12 | 2004-09-21 | Naphtali David Rishe | Database querying system and method |
| US6981228B1 (en) | 2000-09-29 | 2005-12-27 | Sbc Technology Resources, Inc. | Interactive topology graphs for visualization and characterization of SONET consumption patterns |
| US6792400B2 (en)* | 2000-12-18 | 2004-09-14 | General Motors Corporation | Visualization of complex system interactions |
| US6646652B2 (en) | 2000-12-21 | 2003-11-11 | Xerox Corporation | System and method for browsing node-link structures based on an estimated degree of interest |
| US20030085931A1 (en) | 2000-12-21 | 2003-05-08 | Xerox Corporation | System and method for browsing hierarchically based node-link structures based on an estimated degree of interest |
| US20020154175A1 (en) | 2001-01-04 | 2002-10-24 | James Abello | System and method for visualizing massive multi-digraphs |
| US20020133392A1 (en) | 2001-02-22 | 2002-09-19 | Angel Mark A. | Distributed customer relationship management systems and methods |
| WO2002069192A1 (en) | 2001-02-26 | 2002-09-06 | Compudigm International Limited | Data visualisation system and method |
| US20020130907A1 (en) | 2001-03-15 | 2002-09-19 | Chi Ed H. | Method for visualizing user path through a web site and a path's associated information scent |
| US20020158918A1 (en) | 2001-03-28 | 2002-10-31 | Sarnoff Corporation | Method and apparatus for visualizing correlations among and between objects and events |
| US20040030741A1 (en) | 2001-04-02 | 2004-02-12 | Wolton Richard Ernest | Method and apparatus for search, visual navigation, analysis and retrieval of information from networks with remote notification and content delivery |
| US20020196292A1 (en) | 2001-04-06 | 2002-12-26 | International Business Machines Corporation | Graph data visualization and graphics preparation |
| US20030011601A1 (en) | 2001-06-19 | 2003-01-16 | International Business Machines Corporation | Graphics image creation apparatus, and method and program therefor |
| US6901555B2 (en) | 2001-07-09 | 2005-05-31 | Inxight Software, Inc. | Tree visualization system and method based upon a compressed half-plane model of hyperbolic geometry |
| US20040133433A1 (en) | 2001-08-01 | 2004-07-08 | Young-Gyun Lee | Method for analyzing and providing of inter-relations between patents from the patent database |
| US6888548B1 (en)* | 2001-08-31 | 2005-05-03 | Attenex Corporation | System and method for generating a visualized data representation preserving independent variable geometric relationships |
| US20050116953A1 (en)* | 2002-02-12 | 2005-06-02 | Accenture Global Services | Display of data element indicia based on data types |
| WO2003069506A2 (en) | 2002-02-12 | 2003-08-21 | Accenture Global Services Gmbh | Display of data element indicia based on data types |
| US20030167324A1 (en)* | 2002-02-20 | 2003-09-04 | Farnham Shelly D. | Social mapping of contacts from computer communication information |
| US7203701B1 (en) | 2002-02-20 | 2007-04-10 | Trilogy Development Group, Inc. | System and method for an interface to provide visualization and navigation of a directed graph |
| US20030220928A1 (en) | 2002-05-21 | 2003-11-27 | Patrick Durand | Method for organizing and querying a genomic and proteomic databases |
| US20040024533A1 (en) | 2002-08-05 | 2004-02-05 | Hitachi, Ltd. | Method for node mapping, network visualizing and screening |
| US20040059521A1 (en) | 2002-09-23 | 2004-03-25 | Han Kyung Sook | Method for visualizing large-scale protein interaction data |
| US20040088678A1 (en) | 2002-11-05 | 2004-05-06 | International Business Machines Corporation | System and method for visualizing process flows |
| US20040111255A1 (en) | 2002-12-10 | 2004-06-10 | International Business Machines Corporation | Graph-based method for design, representation, and manipulation of NLU parser domains |
| US20040113953A1 (en) | 2002-12-16 | 2004-06-17 | Palo Alto Research Center, Incorporated | Method and apparatus for displaying hierarchical information |
| US20040150644A1 (en) | 2003-01-30 | 2004-08-05 | Robert Kincaid | Systems and methods for providing visualization and network diagrams |
| US20040243938A1 (en) | 2003-04-08 | 2004-12-02 | Thomas Weise | Interface and method for exploring a collection of data |
| US7089266B2 (en) | 2003-06-02 | 2006-08-08 | The Board Of Trustees Of The Leland Stanford Jr. University | Computer systems and methods for the query and visualization of multidimensional databases |
| US7167865B1 (en)* | 2003-06-30 | 2007-01-23 | Mvalent, Inc. | Collaborative environment for producing software products |
| US20050114802A1 (en)* | 2003-08-29 | 2005-05-26 | Joerg Beringer | Methods and systems for providing a visualization graph |
| US7617185B2 (en)* | 2003-08-29 | 2009-11-10 | Sap Ag | Methods and systems for providing a visualization graph |
| US7549309B2 (en)* | 2003-08-29 | 2009-06-23 | Sap Ag | Method and system for restructuring a visualization graph so that entities linked to a common node are replaced by the common node in response to a predetermined stimulus |
| US20060106847A1 (en) | 2004-05-04 | 2006-05-18 | Boston Consulting Group, Inc. | Method and apparatus for selecting, analyzing, and visualizing related database records as a network |
| US20060037019A1 (en)* | 2004-07-23 | 2006-02-16 | Austin Mark A | Tree-to-graph folding procedure for systems engineering requirements |
| US7421665B2 (en) | 2004-08-31 | 2008-09-02 | Oracle International Corporation | Node scrollers |
| US20060044319A1 (en) | 2004-08-31 | 2006-03-02 | Oracle International Corporation | Displaying information using nodes in a graph |
| US7468727B2 (en) | 2005-04-19 | 2008-12-23 | Wong Pak C | Methods of visualizing graphs |
| US20060288311A1 (en)* | 2005-05-20 | 2006-12-21 | Palo Alto Research Center | Method, apparatus, and program product for visualizing tree structured information |
| US20070124291A1 (en) | 2005-11-29 | 2007-05-31 | Hassan Hany M | Method and system for extracting and visualizing graph-structured relations from unstructured text |
| WO2007062885A1 (en) | 2005-11-29 | 2007-06-07 | International Business Machines Corporation | Method and system for extracting and visualizing graph-structured relations from unstructured text |
| US20090265324A1 (en)* | 2008-04-16 | 2009-10-22 | Cognos Ulc | Query processing visualization system and method of visualizing query processing |
Non-Patent Citations (38)
| Title |
|---|
| "Chapter 15: Topic Maps in Knowledge Organization," Jul. 16, 2002, XML Topic Maps: Creating and Using Topic Maps for the Web, Addison Wesley Professional, 43 pages. |
| Baumgartner, Jason L., et al., "Roget2000: A 2D Hyperbolic Tree Visualization of Roget's Thesaurus," SPIE Conference on Visualization and Data Analysis, Jan. 2002, pp. 1-8. |
| Butler, Greg et al., "A Graph Database With Visual Queries for Genomics," Proceedings Trim Size: 9.75 in x 6.5 in., Sep. 28, 2004, 10 pages. |
| Communication from the EPO, dated Jan. 16, 2007 for European Application No. 03 078 583.6-1225, 8 pages. |
| Communication from the EPO, dated Jan. 17, 2007 for European Application No. 03 078 584.4-1225, 8 pages. |
| Communication from the EPO, dated Jan. 17, 2007 for European Application No. 03 078 586.9-1225, 8 pages. |
| Communication from the EPO, dated Jan. 19, 2009 for European Application No. 03 078 583.6-2221, 9 pages. |
| Communication from the EPO, dated Jan. 20, 2009 for European Application No. 03 077 697.5-2221, 9 pages. |
| Communication from the EPO, dated Jan. 20, 2009 for European Application No. 03 078 584.4-2221, 10 pages. |
| Communication from the EPO, dated Jan. 20, 2009 for European Application No. 03 078 585.1-2221, 9 pages. |
| Communication from the EPO, dated Jan. 20, 2009 for European Application No. 03 078 586.9-2221, 9 pages. |
| Communication from the EPO, dated Jul. 5, 2004 for European Application No. 03 078 585.1-1225, 4 pages. |
| Communication from the EPO, dated Nov. 8, 2006 for European Application No. 03 078 585.1-1225, 9 pages. |
| Communication from the EPO, dated Oct. 26, 2006 for European Application No. 03 077 697.5-1225, 6 pages. |
| Edward PF Chan et al. "On multi-scale display of geometric objects", Data and Knowledge Engineering, 40 (2002)91-119.* |
| Fluit et al. ("Ontology-based Information Visualisation", Springer Verlag, 2002, retrieved from http://www.cs.vu.n1/~frankh/abstracts/VSW02.html, on Jan. 18, 2007).* |
| Fluit et al. ("Ontology-based Information Visualisation", Springer Verlag, 2002, retrieved from http://www.cs.vu.n1/˜frankh/abstracts/VSW02.html, on Jan. 18, 2007).* |
| Gansner, Emden R., et al., "An open graph visualization system and its applications to software engineering," Prepared using speauth.cls [Version: 1999/06/11 v1. 1a], Software-Practice and Experience, 1999, pp. 1-29. |
| Golovchinsky, G. et al., "Subverting structure: data-driven diagram generation," Visualization, 1995, Visualization '95. Proceedings, IEEE Conference in Atlanta, Georgia, Oct. 29-Nov. 3, 1995, Los Alamitos, California, pp. 217-223. |
| Groth, Dennis P., "Visual Representation of Database Queries Using Structural Similarity," Proceedings of the Seventh International Conference on Information Visualization (Iv'03), 2003, IEEE, 6 pages. |
| Halin, Gilles, "An interactive graph visualization for handling cooperative design activity context," The 11th International Conference on CSCW in Design, Melbourne, Australia, 2007, pp. 1-5. |
| Herman et al., "Graph Visualization and Navigation in Information Visualization: A Survey," IEEE, Jan.-Mar. 2000, pp. 24-43. |
| Huang, Mao Lin, "Information Visualization of Attributed Relational Data," 2001, Australian Computer Society, Inc. This paper appeared at the Australian Symposium on Information Visualization, Sydney, Dec. 2001. Conferences in Research and Practice in Information Technology, vol. 9, 7 pages. |
| Hull, R. et al., "Semantic database modeling: survey, applications and research issues," ACM Computing Surveys, ACM, New York, NY, Sep. 1, 1987, pp. 201-260. |
| Lamping, John et al., "A Focus + Context Technique Based on Hyperbolic Geometry for Visualizing Large Hierarchies," Proceedings of the ACM SIGCHI Conference on Human Factors in Computing Systems, Denver, May 1995, ACM., pp. 1-8. |
| Marshall, Scott, "Methods and Tools for the Visualization and Navigation of Graphs," 2001, Universite Bordeau 1, Bordeaux, France, 78 pages. |
| Ming C Hao et al. [hereafter Ming], Web-based visualization of large hierarchical graphs using invisible links in a Hyperbolic space, HP Lab. published on Jan. 2000.* |
| Moreland, Kenneth et al., "Massive Graph Visualization: LDRD Final Report," Oct. 2007, 48 pages. |
| Mutton, Paul et al., "Visualization of Semantic Metadata and Ontologies," Proceedings of the Seventh International Conference on Information Visualization (IV'03), 2003, IEEE, 6 pages. |
| Nguyen, Quant Vinh, et al., "A space-optimized tree visualization," Information Visualization, 2002, INFOVIS 2002, IEEE Symposium, Oct. 28-29, 2002, 8 pages. |
| Nihar Sheth et al. "Visualizing MeSH Dataset using Radial Tree Layout", Published on Apr. 29,2003, pp. 1-11.* |
| Partial European Search Report for European Application No. 03 077 697.5-1225, dated Jun. 18, 2004, 5 pages. |
| Sonia Fernandes Silva et al. "Formalizing visual interaction withh istorical databases", Information Systems 27 (2002) 487-521.* |
| Staszak, C., "Semantic Network Picture Book," 2002, pp. 1-14. |
| U.S. Appl. No. 10/927,313, filed Aug. 27, 2004, entitled "Methods and Systems for Providing a Visualization Graph." |
| U.S. Appl. No. 10/927,315, filed Aug. 27, 2004, entitled "Methods and Systems for Providing a Visualization Graph." |
| U.S. Appl. No. 10/927,458, filed Aug. 27, 2004, entitled "Methods and Systems for Providing a Visualization Graph." |
| Wills, Graham J., "NicheWorks-Interactive Visualization of Very Large Graphs," 1999, pp. 190-212, XP007906624, Retrieved from the Internet: URL:http://www.amstat.org/Publications/jcgs/pdf99/wills.pdf>. |
Cited By (64)
| Publication number | Priority date | Publication date | Assignee | Title |
|---|---|---|---|---|
| US9934465B2 (en) | 2005-03-30 | 2018-04-03 | Primal Fusion Inc. | Systems and methods for analyzing and synthesizing complex knowledge representations |
| US9104779B2 (en) | 2005-03-30 | 2015-08-11 | Primal Fusion Inc. | Systems and methods for analyzing and synthesizing complex knowledge representations |
| US8849860B2 (en) | 2005-03-30 | 2014-09-30 | Primal Fusion Inc. | Systems and methods for applying statistical inference techniques to knowledge representations |
| US9177248B2 (en) | 2005-03-30 | 2015-11-03 | Primal Fusion Inc. | Knowledge representation systems and methods incorporating customization |
| US9904729B2 (en) | 2005-03-30 | 2018-02-27 | Primal Fusion Inc. | System, method, and computer program for a consumer defined information architecture |
| US10002325B2 (en) | 2005-03-30 | 2018-06-19 | Primal Fusion Inc. | Knowledge representation systems and methods incorporating inference rules |
| US20100049766A1 (en)* | 2006-08-31 | 2010-02-25 | Peter Sweeney | System, Method, and Computer Program for a Consumer Defined Information Architecture |
| US8510302B2 (en) | 2006-08-31 | 2013-08-13 | Primal Fusion Inc. | System, method, and computer program for a consumer defined information architecture |
| US9087296B2 (en) | 2008-02-22 | 2015-07-21 | Adobe Systems Incorporated | Navigable semantic network that processes a specification to and uses a set of declaritive statements to produce a semantic network model |
| US8332782B1 (en)* | 2008-02-22 | 2012-12-11 | Adobe Systems Incorporated | Network visualization and navigation |
| US11868903B2 (en) | 2008-05-01 | 2024-01-09 | Primal Fusion Inc. | Method, system, and computer program for user-driven dynamic generation of semantic networks and media synthesis |
| US9792550B2 (en) | 2008-05-01 | 2017-10-17 | Primal Fusion Inc. | Methods and apparatus for providing information of interest to one or more users |
| US9361365B2 (en) | 2008-05-01 | 2016-06-07 | Primal Fusion Inc. | Methods and apparatus for searching of content using semantic synthesis |
| US9378203B2 (en) | 2008-05-01 | 2016-06-28 | Primal Fusion Inc. | Methods and apparatus for providing information of interest to one or more users |
| US11182440B2 (en) | 2008-05-01 | 2021-11-23 | Primal Fusion Inc. | Methods and apparatus for searching of content using semantic synthesis |
| US20100235307A1 (en)* | 2008-05-01 | 2010-09-16 | Peter Sweeney | Method, system, and computer program for user-driven dynamic generation of semantic networks and media synthesis |
| US8676722B2 (en) | 2008-05-01 | 2014-03-18 | Primal Fusion Inc. | Method, system, and computer program for user-driven dynamic generation of semantic networks and media synthesis |
| US8676732B2 (en) | 2008-05-01 | 2014-03-18 | Primal Fusion Inc. | Methods and apparatus for providing information of interest to one or more users |
| US20090315884A1 (en)* | 2008-06-24 | 2009-12-24 | Samsung Electronics Co., Ltd. | Method and apparatus for outputting and displaying image data |
| US20090317061A1 (en)* | 2008-06-24 | 2009-12-24 | Samsung Electronics Co., Ltd. | Image generating method and apparatus and image processing method and apparatus |
| US20090317062A1 (en)* | 2008-06-24 | 2009-12-24 | Samsung Electronics Co., Ltd. | Image processing method and apparatus |
| US9595004B2 (en) | 2008-08-29 | 2017-03-14 | Primal Fusion Inc. | Systems and methods for semantic concept definition and semantic concept relationship synthesis utilizing existing domain definitions |
| US20100057664A1 (en)* | 2008-08-29 | 2010-03-04 | Peter Sweeney | Systems and methods for semantic concept definition and semantic concept relationship synthesis utilizing existing domain definitions |
| US8943016B2 (en) | 2008-08-29 | 2015-01-27 | Primal Fusion Inc. | Systems and methods for semantic concept definition and semantic concept relationship synthesis utilizing existing domain definitions |
| US8495001B2 (en) | 2008-08-29 | 2013-07-23 | Primal Fusion Inc. | Systems and methods for semantic concept definition and semantic concept relationship synthesis utilizing existing domain definitions |
| US12032616B2 (en) | 2008-08-29 | 2024-07-09 | Primal Fusion Inc. | Systems and methods for semantic concept definition and semantic concept relationship synthesis utilizing existing domain definitions |
| US10803107B2 (en) | 2008-08-29 | 2020-10-13 | Primal Fusion Inc. | Systems and methods for semantic concept definition and semantic concept relationship synthesis utilizing existing domain definitions |
| US10181137B2 (en) | 2009-09-08 | 2019-01-15 | Primal Fusion Inc. | Synthesizing messaging using context provided by consumers |
| US9292855B2 (en) | 2009-09-08 | 2016-03-22 | Primal Fusion Inc. | Synthesizing messaging using context provided by consumers |
| US20110060644A1 (en)* | 2009-09-08 | 2011-03-10 | Peter Sweeney | Synthesizing messaging using context provided by consumers |
| US20110060794A1 (en)* | 2009-09-08 | 2011-03-10 | Peter Sweeney | Synthesizing messaging using context provided by consumers |
| US20110060645A1 (en)* | 2009-09-08 | 2011-03-10 | Peter Sweeney | Synthesizing messaging using context provided by consumers |
| US10146843B2 (en) | 2009-11-10 | 2018-12-04 | Primal Fusion Inc. | System, method and computer program for creating and manipulating data structures using an interactive graphical interface |
| US9262520B2 (en) | 2009-11-10 | 2016-02-16 | Primal Fusion Inc. | System, method and computer program for creating and manipulating data structures using an interactive graphical interface |
| US8281238B2 (en)* | 2009-11-10 | 2012-10-02 | Primal Fusion Inc. | System, method and computer program for creating and manipulating data structures using an interactive graphical interface |
| US20110113386A1 (en)* | 2009-11-10 | 2011-05-12 | Peter Sweeney | System, method and computer program for creating and manipulating data structures using an interactive graphical interface |
| US8812520B1 (en) | 2010-04-23 | 2014-08-19 | Google Inc. | Augmented resource graph for scoring resources |
| US8386495B1 (en)* | 2010-04-23 | 2013-02-26 | Google Inc. | Augmented resource graph for scoring resources |
| US10248669B2 (en) | 2010-06-22 | 2019-04-02 | Primal Fusion Inc. | Methods and devices for customizing knowledge representation systems |
| US9235806B2 (en) | 2010-06-22 | 2016-01-12 | Primal Fusion Inc. | Methods and devices for customizing knowledge representation systems |
| US10474647B2 (en) | 2010-06-22 | 2019-11-12 | Primal Fusion Inc. | Methods and devices for customizing knowledge representation systems |
| US9576241B2 (en) | 2010-06-22 | 2017-02-21 | Primal Fusion Inc. | Methods and devices for customizing knowledge representation systems |
| US11474979B2 (en) | 2010-06-22 | 2022-10-18 | Primal Fusion Inc. | Methods and devices for customizing knowledge representation systems |
| US10394778B2 (en) | 2010-09-03 | 2019-08-27 | Robert Lewis Jackson, JR. | Minimal representation of connecting walks |
| US20150135048A1 (en)* | 2011-04-20 | 2015-05-14 | Panafold | Methods, apparatus, and systems for visually representing a relative relevance of content elements to an attractor |
| US20120272168A1 (en)* | 2011-04-20 | 2012-10-25 | Panafold | Methods, apparatus, and systems for visually representing a relative relevance of content elements to an attractor |
| US11294977B2 (en) | 2011-06-20 | 2022-04-05 | Primal Fusion Inc. | Techniques for presenting content to a user based on the user's preferences |
| US9098575B2 (en) | 2011-06-20 | 2015-08-04 | Primal Fusion Inc. | Preference-guided semantic processing |
| US10409880B2 (en) | 2011-06-20 | 2019-09-10 | Primal Fusion Inc. | Techniques for presenting content to a user based on the user's preferences |
| US9092516B2 (en) | 2011-06-20 | 2015-07-28 | Primal Fusion Inc. | Identifying information of interest based on user preferences |
| US9715552B2 (en) | 2011-06-20 | 2017-07-25 | Primal Fusion Inc. | Techniques for presenting content to a user based on the user's preferences |
| US10503779B2 (en) | 2012-04-18 | 2019-12-10 | Ganalila, Llc | Association mapping game |
| US9778812B2 (en)* | 2012-10-12 | 2017-10-03 | Mitsubishi Electric Corporation | Screen transition diagram creator |
| US20150248190A1 (en)* | 2012-10-12 | 2015-09-03 | Mitsubishi Electric Corporation | Screen transition diagram creator |
| US9262488B2 (en)* | 2012-11-07 | 2016-02-16 | Sap Se | 2-dimensional multi-hierarchy display |
| US20140129595A1 (en)* | 2012-11-07 | 2014-05-08 | Sap Ag | 2-dimensional multi-hierarchy display |
| US11079901B2 (en) | 2013-03-13 | 2021-08-03 | Ganalila, Llc | Systems and methods for presenting and discovering relationships between information units |
| US10657178B2 (en)* | 2014-08-22 | 2020-05-19 | Hewlett Packard Enterprise Development Lp | Processing of a generate entity type graph component of a graph analysis system |
| US20160055261A1 (en)* | 2014-08-22 | 2016-02-25 | Cray Inc. | User-controlled graph analysis system |
| WO2018042204A1 (en)* | 2016-09-05 | 2018-03-08 | SimCentric Limited | Method of displaying search results |
| US9836183B1 (en)* | 2016-09-14 | 2017-12-05 | Quid, Inc. | Summarized network graph for semantic similarity graphs of large corpora |
| US10474578B2 (en)* | 2017-08-30 | 2019-11-12 | Oracle International Corporation | Utilization-based throttling of hardware prefetchers |
| US20190065376A1 (en)* | 2017-08-30 | 2019-02-28 | Oracle International Corporation | Utilization-based throttling of hardware prefetchers |
| US11023481B2 (en) | 2018-08-08 | 2021-06-01 | commos inc. | Navigation platform for performing search queries |
Also Published As
| Publication number | Publication date |
|---|---|
| EP1510940A1 (en) | 2005-03-02 |
| JP2005100375A (en) | 2005-04-14 |
| US20050114384A1 (en) | 2005-05-26 |
Similar Documents
| Publication | Publication Date | Title |
|---|---|---|
| US7720857B2 (en) | Method and system for providing an invisible attractor in a predetermined sector, which attracts a subset of entities depending on an entity type | |
| US7549309B2 (en) | Method and system for restructuring a visualization graph so that entities linked to a common node are replaced by the common node in response to a predetermined stimulus | |
| US7853552B2 (en) | Method and system for increasing a repulsive force between a first node and surrounding nodes in proportion to a number of entities and adding nodes to a visualization graph | |
| US7617185B2 (en) | Methods and systems for providing a visualization graph | |
| US9262846B2 (en) | System and method for labeling maps | |
| JP4355050B2 (en) | Method, apparatus and medium for visualizing deformation between a series of related graphs | |
| JP3747404B2 (en) | Graphics image creating apparatus, method and program thereof | |
| US6154220A (en) | Rectilinear layout | |
| JP2020523650A (en) | Method and apparatus for determining a geofence index grid | |
| Mei et al. | Evolving time-invariant dispatching rules in job shop scheduling with genetic programming | |
| JP2016167303A (en) | Data visualization based on attraction | |
| Rüegg et al. | A generalization of the directed graph layering problem | |
| CN110020018A (en) | Data visualization methods of exhibiting and device | |
| EP1510937A1 (en) | A method of providing a visualisation graph on a computer and a computer for providing a visualisation graph | |
| Padgham et al. | A unified graphical notation for AOSE | |
| Huynh et al. | Sequential pattern mining using idlists | |
| Hosseinian et al. | Algorithms for the generalized independent set problem based on a quadratic optimization approach | |
| CN112685661B (en) | Information organization method, device and equipment based on information granule space | |
| de Vries et al. | Relative neighborhood graphs uncover the dynamics of social media engagement | |
| Ras et al. | Discovering semantic inconsistencies to improve action rules mining | |
| Held et al. | Cluster-based Visualization of Dynamic Graphs | |
| Cordasco et al. | Efficient on-line algorithms for Euler diagram region computation | |
| Hussin et al. | Hybrid simulated annealing for the bi-objective quadratic assignment problem | |
| Eremeev | The spanning tree based approach for solving the shortest path problem in social graphs | |
| Apanovich et al. | Using floorplans for software visualization |
Legal Events
| Date | Code | Title | Description |
|---|---|---|---|
| AS | Assignment | Owner name:SAP AKTIENGESELLSCHAFT, GERMANY Free format text:ASSIGNMENT OF ASSIGNORS INTEREST;ASSIGNORS:BERINGER, JOERG;HATSCHER, MICHAEL;WERNER, HORST;REEL/FRAME:016196/0669;SIGNING DATES FROM 20041112 TO 20041115 Owner name:SAP AKTIENGESELLSCHAFT,GERMANY Free format text:ASSIGNMENT OF ASSIGNORS INTEREST;ASSIGNORS:BERINGER, JOERG;HATSCHER, MICHAEL;WERNER, HORST;SIGNING DATES FROM 20041112 TO 20041115;REEL/FRAME:016196/0669 | |
| AS | Assignment | Owner name:SAP AG,GERMANY Free format text:ASSIGNMENT OF ASSIGNORS INTEREST;ASSIGNOR:SAP AKTIENGESELLSCHAFT;REEL/FRAME:017347/0220 Effective date:20050609 Owner name:SAP AG, GERMANY Free format text:ASSIGNMENT OF ASSIGNORS INTEREST;ASSIGNOR:SAP AKTIENGESELLSCHAFT;REEL/FRAME:017347/0220 Effective date:20050609 | |
| FEPP | Fee payment procedure | Free format text:PAYOR NUMBER ASSIGNED (ORIGINAL EVENT CODE: ASPN); ENTITY STATUS OF PATENT OWNER: LARGE ENTITY | |
| STCF | Information on status: patent grant | Free format text:PATENTED CASE | |
| FPAY | Fee payment | Year of fee payment:4 | |
| AS | Assignment | Owner name:SAP SE, GERMANY Free format text:CHANGE OF NAME;ASSIGNOR:SAP AG;REEL/FRAME:033625/0334 Effective date:20140707 | |
| MAFP | Maintenance fee payment | Free format text:PAYMENT OF MAINTENANCE FEE, 8TH YEAR, LARGE ENTITY (ORIGINAL EVENT CODE: M1552) Year of fee payment:8 | |
| MAFP | Maintenance fee payment | Free format text:PAYMENT OF MAINTENANCE FEE, 12TH YEAR, LARGE ENTITY (ORIGINAL EVENT CODE: M1553); ENTITY STATUS OF PATENT OWNER: LARGE ENTITY Year of fee payment:12 |