US7714876B1 - Method and system for creating visualizations - Google Patents
Method and system for creating visualizationsDownload PDFInfo
- Publication number
- US7714876B1 US7714876B1US11/076,700US7670005AUS7714876B1US 7714876 B1US7714876 B1US 7714876B1US 7670005 AUS7670005 AUS 7670005AUS 7714876 B1US7714876 B1US 7714876B1
- Authority
- US
- United States
- Prior art keywords
- data
- visualizations
- visualization
- display
- creating
- Prior art date
- Legal status (The legal status is an assumption and is not a legal conclusion. Google has not performed a legal analysis and makes no representation as to the accuracy of the status listed.)
- Expired - Fee Related, expires
Links
Images


Classifications
- G—PHYSICS
- G06—COMPUTING OR CALCULATING; COUNTING
- G06F—ELECTRIC DIGITAL DATA PROCESSING
- G06F9/00—Arrangements for program control, e.g. control units
- G06F9/06—Arrangements for program control, e.g. control units using stored programs, i.e. using an internal store of processing equipment to receive or retain programs
- G06F9/44—Arrangements for executing specific programs
- G06F9/451—Execution arrangements for user interfaces
Definitions
- Graphical visualizationssuch as bar charts or line charts are commonly used to display data streams.
- Financial datasuch as stock market information and status information about a computer network are two examples of data that a user may desire to view graphically.
- first layer visualizationsare typically not detailed enough to effectively display the data stream.
- second layer, third layer, or even lower layer (i.e. more detailed) visualizationscan also be created to provide increased resolution of the data within the data stream.
- the creation of meaningful visualizationsis often difficult and burdensome.
- the lower layer visualizationscan be created by pre-programming a software program to display a pre-defined sequence of visualizations. For example, in a financial context, the user programs the software to display a first layer visualization of stock market performance and then to display lower layer visualizations of certain pre-selected stocks. While this technique permits display of detailed information from the data stream, it disadvantageously limits the display to only the pre-selected data (i.e., the specific stocks pre-selected by the user).
- a second type of sequence of visualizationspermits a user to manually drill down to a lower layer visualizations by selecting a portion of the first layer (or lower layer) visualization to expand. While this technique permits the creation of lower layer visualizations that display the specific information desired by a user, this technique often involves manual interaction with the first layer visualization and thus is not often suitable for automated reporting.
- FIG. 1is a block diagram of a computer system illustrating one embodiment of the present invention
- FIG. 2is a process flow illustrating one embodiment of a process for creating a sequence of visualizations
- FIG. 3illustrates one embodiment of a data stream displayed as a spreadsheet
- FIG. 4illustrates one embodiment of a graphical user interface displaying an exemplary first layer visualization
- FIG. 5illustrates one embodiment of a graphical user interface displaying an exemplary second layer visualization
- FIG. 6illustrates one embodiment of a graphical user interface displaying an exemplary third layer visualization
- FIG. 7illustrates one embodiment of a graphical user interface displaying an exemplary third layer visualization
- FIG. 8illustrates one embodiment of a graphical user interface displaying an exemplary first layer visualization
- FIG. 9illustrates one embodiment of a graphical user interface displaying an exemplary first layer visualization.
- the present applicationis directed towards a system that can create visualizations based on interaction rules instead of pre-selected data. These interaction rules interact with the data in the data stream to create a sequence of visualizations that are customized to the particular data in the data stream. This feature is particular advantageous in the context of automated, periodic reporting because the system interacts with the data with each periodic reporting to create visualizations that display the information that is most important to a particular user.
- FIG. 1is a block diagram illustrating one embodiment of a computer system 10 .
- the computer system 10includes a processor 11 , an intelligent interface 12 , a visualization constructor 14 , and an image compositor 16 .
- the processor 11comprises the intelligent interface 12 , the visualization constructor 14 , and the image compositor 16 .
- the processor 11interacts with the intelligent interface 12 , the visualization constructor 14 , and the image compositor 16 .
- the processor 11comprises any one of a number of suitable processors.
- the processor 11is located within a computer system.
- the intelligent interface 12interacts with the visualization constructor 14 to generate a sequence of data-driven multi-layered visualizations.
- the intelligent interface 12is configured to import incoming data at a specified time interval.
- the intelligent interface 12also interfaces with the visualization constructor 14 to set a color scale for the visualization and to lay out for the visualizations.
- application interfaces (“APIs”) within the intelligent interface 12perform this task.
- the intelligent interface 12generates a set of interaction rules to guide the visualization constructor 14 in creating the sequence of data-driven visualizations
- the visualization constructor 14constructs a sequence of multi-layered data-driven graphs and images for real-time data exploration without user interaction. This visualization technique is driven by the data instead of the user.
- the visualization constructor 14generates the sequence of graphical visualizations by simulating window-like properties, such as window height, window width, window framing, and window panels.
- the visualization constructor 14creates the sequence of graphical visualizations with a default window configuration that is based on the origin and dimensions of the computer screen.
- the visualization constructor 14can create the sequence of visualization as a rectangle with an origin and dimensions of 10, 50, 1000, and 6000. In alternate embodiments, however, other window configuration based on the incoming data can be used.
- the visualization constructor 14can also use drilldowns, filtering, or zooming to generate different types and levels of visualization to most efficiently display the data stream.
- the image compositor 16transforms the visualizations generated by the visualization constructor 14 into an image file, such as JPG file. In one embodiment, the image compositor 16 also exports the image files to a storage medium. In another embodiment, the image compositor 16 composes the image files into a computer slideshow. In yet another embodiment, the image compositor 16 creates an image file that permits a user to get more detailed information by pointing a graphical pointer at part of the image. In still another embodiment, the image compositor 16 composes the image files on a web page.
- the intelligent interface 12 , the visualization constructor 14 , and the image compositor 16can be hardware, firmware, software, or some combination of hardware, firmware, and software.
- the intelligent interface 12 , the visualization constructor 14 , and the image compositor 16do not necessarily solely comprise the functions as illustrated.
- the functions attributed to the intelligent interface 12 , the visualization constructor 14 , and the image compositor 16are merely one example and other embodiments can be envisaged wherein the functions described above are split up differently or wherein some components are not included or other components are included.
- FIG. 2is a process flow illustrating one embodiment of an exemplary process 50 for creating a sequence of data-driven visualizations.
- the process 50begins by importing a data stream, as indicated in block 52 .
- importing the data streamcomprises receiving a transmission from a data collection source.
- importing the data streamcomprises communicating with a storage medium to download the data.
- datais imported periodically. For example, the computer system 10 can download the data stream once every fifteen minutes.
- Data selectionis employed because the data stream can comprise more data than the user wishes to display in the sequence of graphical visualizations. For this reason, during this step of the process 50 , the intelligent interface 12 can select a subset of information from the data stream to be displayed. For example, in one embodiment, data selection comprises selecting all of the data in the data stream. In alternate embodiments, data selection comprises selecting only a subset of the data in the data stream. In one embodiment, this selection is performed by a set of application interfaces (“APIs”) that interface with the visualization constructor 14 to limit what data is displayed in the sequence of graphical visualizations.
- APIsapplication interfaces
- the intelligent interface 12uses the set of APIs to set a color scale and lay out a structure for the sequence of graphical visualizations.
- the color scale and structure for the sequence of visualizationsare either be programmed in advance by the user or generated by the intelligent interface 12 based on the selected data.
- the interaction rulesspecify which visualizations will comprise the sequence of visualizations and in what order the sequence of visualizations will be displayed.
- the interaction rulesare based both on the structure of the selected data and the selected data itself.
- the interaction rulesare generated by accessing a list of stored user preferences, determining how the data corresponds to the stored user preferences, and generating the interaction rules based on the correspondence between the data and the stored user preferences.
- the user preferencescould specify creating a sequence of visualizations comprising a graphical visualization of overall performance of the stock market and creating lower layer graphical visualizations for the three stocks that increased in value the most during the previous 24 hours.
- the intelligent interface 12employs these user preferences to generate the interaction rules, which provide a framework that permits the visualization constructor 14 to create visualizations that are based on the data itself.
- This sequence of visualizationsdisplays detailed information that is of interest to the user (i.e., information about the three stocks with the greatest increase in value) without the user having to manually select the particular stocks to be displayed.
- the interaction rulesprovide detailed information about what data is to be displayed in the sequence of visualizations, and thus, the interaction rules serve as a guide to the visualization constructor 14 in constructing the sequence of visualizations.
- the interaction rulescan be generated based on instructions pre-programmed into the intelligent interface 12 .
- the interaction rulesare generated by the intelligent interface 12 , itself based on the data selected.
- the visualization constructor 14simulates a window in which to construct the sequence of visualizations.
- the visualization constructor 14simulates a window that resembles windows created in the Microsoft WindowsTM operating system.
- this windowhas a height and a width that corresponds to the edges of a display and includes frames and panels that create boundaries for the window.
- all of the visualizations in the sequence of visualizationsemploy windows that have similar properties. In alternate embodiments, however, the properties of the individual window will vary depending on the properties of the data being displayed in the particular graphical visualization.
- the visualization constructor 14can create the lower level visualizations, as indicated by block 62 .
- the visualization constructor 14employs the set of interaction rules generated by the intelligent interface 12 to guide the construction of the lower level visualizations.
- the visualization constructor 14creates lower level visualizations to display any data or class of data specified in the interaction rules.
- the visualization constructor 14creates the first layer visualization, as illustrated in block 60 .
- the first layer visualizationis created in the window simulated by the visualization constructor 14 .
- the first layer visualizationcomprises virtually any type of visualization, including, but not limited to, an icon, a graphic, a bar graph, a pie chart, a pistol chart, or a line chart.
- the first layer visualizationemploys color to more effectively present data.
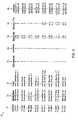
- FIG. 3illustrates one embodiment of an exemplary data stream 70 displayed as a spreadsheet.
- the data stream 70comprises a collection of information relating to requests for Internet service.
- the data stream 70comprises information relating to one or more customers, one or more services provided to the customers, and one or more websites supported.
- the data stream 70also comprises information on the number of service level object (“SLO”) violations (i.e., when service was not provided within a pre-determined time threshold) for each website that was provided service (column 78 ).
- SLOservice level object
- a “one”represents a SLO violation and a “zero” represents the absence of an SLO violation.
- the column 80represents availability, column 82 setup time, and column 84 response time.
- column 86represents a date/time stamp for the particular service request.
- the data stream 70is illustrated in FIG. 3 as a spreadsheet, those skilled in the art will appreciate that in alternate embodiments, the data stream can be stored or represented in a variety of forms, including, but not limited to, a database and a linked list. Further, it will be appreciated that the data stream is shown in an abbreviated form for illustrative purposes. In alternate embodiments, the data stream comprises a thousand or more data entries.
- the interaction rulesspecify which providers or which websites will be displayed in the sequence of graphical graphs.
- the interaction rulesspecify creating a first layer visualization that displays the volume of service for each of the providers 1 and 2 along with the number of SLO violation ( FIG. 4 ).
- the interaction rulesspecify creating lower layer visualizations to display response time for the provider with most SLO violations ( FIG. 5 ) and the set-up time and availability of the individual website from that provider with the worst response time ( FIGS. 6 and 7 ).
- FIG. 4illustrates one embodiment of a graphical user interface displaying an exemplary first layer visualization 100 .
- the first layer visualization 100is based on the data stream 70 described in regard to FIG. 3 . Further, the first layer visualization is created by employing the exemplary interaction rules discussed above. Specifically, the first layer visualization 100 displays a visualization of the total volume of service for each of the providers from the data stream 70 along with a visualization of the number of SLO violations.
- the volume of serviceis arrayed along a y-axis 102 , and the two service providers are displayed as graphical bars 104 and 106 .
- Each of the graphical bars 104 and 106is subdivided into two regions to represent the number of service requests to each provider that resulted in SLO violations versus the number of requests that did not result in an SLO violation.
- the graphical bar 104is divided into a region 108 which displays the number of requests that resulted in an SLO violation and a region 110 which represents the number of requests that were provided service.
- graphical bar 106is divided into regions 112 and 114 .
- dividing the graphical bars 104 and 106 into visually distinctive regionsmerely adds an additional dimension to the first layer visualization 100 .
- the graphical bars 104 and 106are subdivided differently or are not subdivided.
- the first layer visualization 100also comprises a legend 116 which indicates to a viewer of the first layer visualization 100 what the sub-regions of the graphical bars 104 and 106 represent. In some embodiments, the legend 116 is omitted from the first layer visualization 100 . In one embodiment, the first layer visualization 100 is also configured to support pointer-driven value display. In one embodiment, when a pointer is pointed at the sub-section of the visualization, the value of a sub-section of the visualization is displayed. For example, FIG. 4 illustrates an exemplary pointer and value 118 .
- the graphical bars 104 and 106 shown in the first layer visualization 100are merely one technique for displaying the data stream.
- other types of visualizationssuch as pistol charts, line charts or pie charts, can be employed to represent the data stream.
- the first layer visualizationis arranged hierarchically with different levels of the hierarchy displayed through differing shades or colors.
- FIG. 5illustrates one embodiment of a graphical user interface displaying an exemplary second layer visualization 150 .
- the second layer visualization 150is based on the data stream 70 described in regard to FIG. 3 . Further, the second layer visualization 150 is created by employing the exemplary interaction rules discussed above. Specifically, the second layer visualization 150 displays the response times by website for the provider with most SLO violations. As stated above, in alternate embodiments, the interaction rules could have specified that the second layer visualization 150 be created to display any one of a number of elements of the data stream.
- the second layer visualization 150expands on one of the graphical bars displayed in the first layer visualization 100 . This expansion is also referred to also drilling down or creating a drilldown visualization. In the case of the second layer visualization 150 , it is a drilldown graphical visualization from the graphical bar 104 . As with the first layer visualization 100 , the second layer visualization 150 comprises a y-axis 152 , which represent the number of service requests. In the second layer visualization 150 , the three websites with highest volume of service requests for provider 1 are arrayed along the x-axis. Those skilled in the art will appreciate that three websites are shown illustrative purposes only, and in alternate embodiments, the interaction rules could have specified that any one number of a number of sub-elements from the graphical bar 104 comprise the second layer visualization 150 .
- the second layer visualization 150comprises graphical bars 154 , 156 , and 158 which represent service requests to each of the three websites. As with the graphical bars 104 and 106 shown in FIG. 4 (from column 70 of FIG. 3 ), the graphical bars 154 , 156 , and 158 are sub-divided into a series of visually distinctive regions from the graphical bar 104 . In the case of the second layer visualization 150 , each of the graphical bars 154 , 156 , and 158 is divided into a series of regions corresponding to the response time of each individual service request with the total response time displayed above each of the graphical bars 154 , 156 , and 158 .
- the second layer visualization 150also comprises a legend 160 to display which usual distinctions correspond to which response times in the second layer visualization 150 .
- the graphical bars 154 , 156 , and 158 shown in the second layer visualization 150are merely one technique for displaying the data stream. In alternate embodiments, other types of visualizations, such as graphics, icons, line charts, pistol charts, or pie charts, can be employed to represent the data stream.
- the second layer visualization 150is configured to support pointer-driven value display. In one embodiment, when a pointer is pointed at the sub-section of the visualization, the value of a sub-section of the visualization is displayed. For example, FIG. 5 illustrates an exemplary pointer and value 162 .
- FIG. 6illustrates one embodiment of a graphical user interface displaying an exemplary third layer visualization 250 .
- the third layer visualization 250displays the set-up time of the individual website from the second layer visualization 154 with the worst response time (i.e., graphical bar 154 ).
- the third layer visualization 250illustrates four regions 252 , 254 , 256 , and 258 representing the volume of requests corresponding to particular ranges of setup times.
- the region 252indicates the number of requests that had a setup time between 2.5 seconds and 4 seconds
- the region 258indicates the number of requests with setup times between 1.1 seconds and 1.2 seconds.
- the third layer visualization 250also comprises a legend 260 to indicate to a viewer what the visual indicators (e.g. colors) of each region represent. In alternate embodiments, the legend is omitted.
- FIG. 7illustrates one embodiment of a graphical user interface displaying an exemplary third layer visualization 300 .
- the third layer visualization 300displays information regarding the availability of the website from the second layer visualization 150 with the highest response time (i.e., the graphical bar 154 ).
- the third layer visualization 300comprises regions 302 and 304 that indicate availability for the website www.attws.com. As illustrated, the region 302 indicates availability (represented in a legend 306 as a one) and the region 304 indicates non-availability (represented in the legend 306 as a zero).
- the visualization constructor 14is also capable of creating more detailed first layer visualizations than the first layer visualization 100 , if so specified in the interaction rules.
- FIG. 8illustrates one embodiment of a graphical user interface displaying an exemplary first layer visualization 350 .
- the first layer visualization 350displays more detailed information relating to the number of SLO violations for each of the services provided by each of the providers and organizes this information by date and time stamp (i.e., the numbers running across the top of first layer visualization 350 ).
- FIG. 9illustrates another embodiment of a graphical user interface displaying an exemplary first layer visualization 400 .
- the first layer visualization 400displays even more detailed information than the first layer visualization 350 by display both SLO violations and response time for each of the each of the websites of each of the providers. As illustrated in both first layer visualization 350 and first layer visualization 400 , shading can be used to highlight the different providers or to bring a third dimension to the visualization.
- the visualization constructor 14After the visualization constructor 14 has created the sequence of visualizations, the visualization constructor 14 ranks the sequence of visualizations and places the visualizations into an order, e.g. ascending, descending, and the like, based on the relative position of the data represented in each of the visualizations in the data stream 70 . In one embodiment, this ranking is used to order the sequence of visualizations for automated display in computer slide show.
- the image compositor 16transforms the sequence of visualizations into a sequence of images, as indicated by block 64 .
- the imagesare created by the visualization constructor 14 .
- the image compositor 16also selects a foreground and background color for the image.
- the image compositor 16can also enlarge or shrink the size of each image.
- the image compositor 16can save the images as a sequence of image files, such as JPG files, or compiles the images into a presentation, such as a computer displayed slideshow.
- this slideshowcan be automated and thus configured to display each of the images for a predetermined amount of time.
- the image compositor 16creates an image in which a user is able to get more detailed information from the image by pointing a graphical pointer at a part of the image.
- the image compositor 16stores the images on a storage medium, such as a shared disk drive.
- the image compositor 16composes the images for display on either an internal web page or a World Wide Web page.
Landscapes
- Engineering & Computer Science (AREA)
- Software Systems (AREA)
- Theoretical Computer Science (AREA)
- Human Computer Interaction (AREA)
- Physics & Mathematics (AREA)
- General Engineering & Computer Science (AREA)
- General Physics & Mathematics (AREA)
- User Interface Of Digital Computer (AREA)
Abstract
Description
Claims (24)
Priority Applications (1)
| Application Number | Priority Date | Filing Date | Title |
|---|---|---|---|
| US11/076,700US7714876B1 (en) | 2005-03-10 | 2005-03-10 | Method and system for creating visualizations |
Applications Claiming Priority (1)
| Application Number | Priority Date | Filing Date | Title |
|---|---|---|---|
| US11/076,700US7714876B1 (en) | 2005-03-10 | 2005-03-10 | Method and system for creating visualizations |
Publications (1)
| Publication Number | Publication Date |
|---|---|
| US7714876B1true US7714876B1 (en) | 2010-05-11 |
Family
ID=42139343
Family Applications (1)
| Application Number | Title | Priority Date | Filing Date |
|---|---|---|---|
| US11/076,700Expired - Fee RelatedUS7714876B1 (en) | 2005-03-10 | 2005-03-10 | Method and system for creating visualizations |
Country Status (1)
| Country | Link |
|---|---|
| US (1) | US7714876B1 (en) |
Cited By (24)
| Publication number | Priority date | Publication date | Assignee | Title |
|---|---|---|---|---|
| US20040252128A1 (en)* | 2003-06-16 | 2004-12-16 | Hao Ming C. | Information visualization methods, information visualization systems, and articles of manufacture |
| US20080180382A1 (en)* | 2007-01-31 | 2008-07-31 | Hao Ming C | Providing an automated visualization of a collection of data values divided into a number of bins depending upon a change feature of the data values |
| US20090033664A1 (en)* | 2007-07-31 | 2009-02-05 | Hao Ming C | Generating a visualization to show mining results produced from selected data items and attribute(s) in a selected focus area and other portions of a data set |
| US20100103176A1 (en)* | 2008-10-28 | 2010-04-29 | Hao Ming C | Non-overlapping visualization of data records of a scatter plot |
| US20100103189A1 (en)* | 2008-01-25 | 2010-04-29 | Hao Ming C | Displaying continually-incoming time series that uses overwriting of one portion of the time series data while another portion of the time series data remains unshifted |
| US20100188413A1 (en)* | 2009-01-23 | 2010-07-29 | Hao Ming C | Placement of cells in bins to provide non-overlapping visualization of data points of a scatter plot |
| US20100231594A1 (en)* | 2009-03-16 | 2010-09-16 | Hao Ming C | Constructing a cell-based cluster of data records of a scatter plot |
| US7921363B1 (en) | 2007-04-30 | 2011-04-05 | Hewlett-Packard Development Company, L.P. | Applying data thinning processing to a data set for visualization |
| US7924283B1 (en) | 2006-09-19 | 2011-04-12 | Hewlett-Packard Development Company, L.P. | Time relevance-based visualization of data |
| US7941742B1 (en) | 2007-04-30 | 2011-05-10 | Hewlett-Packard Development Company, L.P. | Visualizing growing time series data in a single view |
| US8239349B2 (en) | 2010-10-07 | 2012-08-07 | Hewlett-Packard Development Company, L.P. | Extracting data |
| US8773436B1 (en) | 2006-09-27 | 2014-07-08 | Hewlett-Packard Development Company, L.P. | Pixel charts with data dependent display spaces |
| US8924843B1 (en) | 2007-04-30 | 2014-12-30 | Hewlett-Packard Development Company, L.P. | Visualizing a plurality of times series in corresponding cell-based lines of a display region |
| US9064245B2 (en) | 2012-02-22 | 2015-06-23 | Hewlett-Packard Development Company, L.P. | Generating a calendar graphical visualization including pixels representing data records containing user feedback |
| US9064009B2 (en) | 2012-03-28 | 2015-06-23 | Hewlett-Packard Development Company, L.P. | Attribute cloud |
| US9087143B2 (en) | 2012-03-30 | 2015-07-21 | Hewlett-Packard Development Company, L.P. | Overlaying transparency images including pixels corresponding to different heirarchical levels over a geographic map |
| US20150356752A1 (en)* | 2014-06-06 | 2015-12-10 | Tata Consultancy Services Limited | System and method for interactively visualizing rules and exceptions |
| US9280612B2 (en) | 2012-12-14 | 2016-03-08 | Hewlett Packard Enterprise Development Lp | Visualizing a relationship of attributes using a relevance determination process to select from candidate attribute values |
| US20160132225A1 (en)* | 2014-11-11 | 2016-05-12 | Microsoft Technology Licensing, Llc | Interactive data-driven presentations |
| US9348881B1 (en) | 2006-12-29 | 2016-05-24 | Hewlett Packard Enterprise Development Lp | Visual content query for multi-dimensional datasets |
| US20160253828A1 (en)* | 2015-02-27 | 2016-09-01 | Fujitsu Limited | Display control system, and graph display method |
| US10061469B2 (en) | 2016-09-28 | 2018-08-28 | International Business Machines Corporation | Swivel bar concept within a 3D space to invite users to explore additional data on a third axis |
| US10068357B2 (en)* | 2016-09-28 | 2018-09-04 | International Business Machines Corporation | Graphical evaluation of a cognitive analysis using a 3D swivel bar chart |
| US20190369822A1 (en)* | 2018-06-05 | 2019-12-05 | Ge Inspection Technologies, Lp | User Interface |
Citations (44)
| Publication number | Priority date | Publication date | Assignee | Title |
|---|---|---|---|---|
| US5581797A (en) | 1993-10-22 | 1996-12-03 | Lucent Technologies Inc. | Method and apparatus for displaying hierarchical information of a large software system |
| US5623590A (en) | 1989-08-07 | 1997-04-22 | Lucent Technologies Inc. | Dynamic graphics arrangement for displaying spatial-time-series data |
| US5659768A (en) | 1993-01-06 | 1997-08-19 | Forbes; Kenneth S. | System and method for the time representation of tasks |
| US5742778A (en) | 1993-08-30 | 1998-04-21 | Hewlett-Packard Company | Method and apparatus to sense and multicast window events to a plurality of existing applications for concurrent execution |
| US5801688A (en) | 1994-02-14 | 1998-09-01 | Smart Clipboard Corporation | Controlling an abstraction level of visualized data |
| US5828866A (en) | 1996-07-08 | 1998-10-27 | Hewlett-Packard Company | Real-time synchronization of concurrent views among a plurality of existing applications |
| US5929863A (en) | 1995-06-20 | 1999-07-27 | Casio Computer Co., Ltd. | Record extraction method and apparatus in data processor and recording medium recording programs of the record extraction method |
| US5986673A (en) | 1997-10-17 | 1999-11-16 | Martz; David R. | Method for relational ordering and displaying multidimensional data |
| US6222547B1 (en)* | 1997-02-07 | 2001-04-24 | California Institute Of Technology | Monitoring and analysis of data in cyberspace |
| US6269325B1 (en) | 1998-10-21 | 2001-07-31 | Unica Technologies, Inc. | Visual presentation technique for data mining software |
| US6301579B1 (en)* | 1998-10-20 | 2001-10-09 | Silicon Graphics, Inc. | Method, system, and computer program product for visualizing a data structure |
| US6330685B1 (en) | 1999-03-22 | 2001-12-11 | Ming C. Hao | Non-invasive mechanism to automatically ensure 3D-graphical consistency among plurality applications |
| US6377287B1 (en) | 1999-04-19 | 2002-04-23 | Hewlett-Packard Company | Technique for visualizing large web-based hierarchical hyperbolic space with multi-paths |
| US20020054158A1 (en) | 2000-08-31 | 2002-05-09 | Akiko Asami | Information-processing apparatus and computer-graphic display program |
| US6400366B1 (en) | 1998-09-14 | 2002-06-04 | Visual Insights, Inc. | Method and system for the interactive visualization and examination of data |
| US20020067381A1 (en) | 1998-03-20 | 2002-06-06 | Hugh Harlan M. | Method and apparatus for organizing and processing information using a digital computer |
| US20020078086A1 (en) | 2000-12-18 | 2002-06-20 | Alden Jeffrey Morgan | Functional visualization of spreadsheets |
| US6429868B1 (en) | 2000-07-13 | 2002-08-06 | Charles V. Dehner, Jr. | Method and computer program for displaying quantitative data |
| US20020174087A1 (en) | 2001-05-02 | 2002-11-21 | Hao Ming C. | Method and system for web-based visualization of directed association and frequent item sets in large volumes of transaction data |
| US20030011601A1 (en)* | 2001-06-19 | 2003-01-16 | International Business Machines Corporation | Graphics image creation apparatus, and method and program therefor |
| US20030071815A1 (en) | 2001-10-17 | 2003-04-17 | Hao Ming C. | Method for placement of data for visualization of multidimensional data sets using multiple pixel bar charts |
| US20030128212A1 (en)* | 2002-01-09 | 2003-07-10 | Pitkow James E. | System for graphical display and interactive exploratory analysis of data and data relationships |
| US20030152288A1 (en) | 2002-02-12 | 2003-08-14 | Laurent Balmelli | Space-optimized texture maps |
| US20030169295A1 (en) | 2002-03-07 | 2003-09-11 | Becerra Santiago E. | Method and system for creating graphical and interactive representations of input and output data |
| US20030208323A1 (en) | 2002-05-02 | 2003-11-06 | Hao Ming C. | Method and system for computing forces on data objects for physics-based visualization |
| US20030214504A1 (en) | 2002-05-15 | 2003-11-20 | Hao Ming C. | Method for visualizing graphical data sets having a non-uniform graphical density for display |
| US20030227484A1 (en) | 2002-06-11 | 2003-12-11 | Hao Ming C. | System and method for visualization of objects using energy minimization of customized potential functions |
| US6700590B1 (en) | 1999-11-01 | 2004-03-02 | Indx Software Corporation | System and method for retrieving and presenting data using class-based component and view model |
| US6700575B1 (en)* | 2000-03-31 | 2004-03-02 | Ge Mortgage Holdings, Llc | Methods and apparatus for providing a quality control management system |
| US6704016B1 (en)* | 2000-05-08 | 2004-03-09 | 3Com Corporation | Method and apparatus for the graphical presentation of selected data |
| US6711577B1 (en)* | 2000-10-09 | 2004-03-23 | Battelle Memorial Institute | Data mining and visualization techniques |
| US20040078378A1 (en) | 2002-07-10 | 2004-04-22 | Jerzy Bala | Knowledge inferencing and data visualization method and system |
| US6727926B1 (en) | 1998-06-29 | 2004-04-27 | Hitachi, Ltd. | Displaying method in information processing apparatus that permits execution of either object or task oriented processings |
| US20040085316A1 (en)* | 2002-10-30 | 2004-05-06 | Web Information Technologies, Inc | Interactive data visualization and charting framework with self-detection of data commonality |
| US20040169654A1 (en)* | 2003-02-27 | 2004-09-02 | Teracruz, Inc. | System and method for tree map visualization for database performance data |
| US20040183799A1 (en) | 2003-03-20 | 2004-09-23 | Hao Ming C. | System for visualizing massive web transaction data sets without overlapping |
| US20040205450A1 (en) | 2001-07-27 | 2004-10-14 | Hao Ming C. | Method for visualizing large volumes of multiple-attribute data without aggregation using a pixel bar chart |
| US20040252128A1 (en) | 2003-06-16 | 2004-12-16 | Hao Ming C. | Information visualization methods, information visualization systems, and articles of manufacture |
| US20050088441A1 (en) | 2003-10-27 | 2005-04-28 | Hao Ming C. | Visual boundaries for aggregate information in pixel-oriented graphs |
| US20060059439A1 (en) | 2004-09-15 | 2006-03-16 | Hewlett-Packard Development Company, L.P. | Constructing substantially equal-width pixel bar charts to enable visual data analysis |
| US7051284B2 (en) | 2002-05-16 | 2006-05-23 | Microsoft Corporation | Displaying information to indicate both the importance and the urgency of the information |
| US20060156246A1 (en)* | 2005-01-12 | 2006-07-13 | Microsoft Corporation | Architecture and engine for time line based visualization of data |
| US20070101268A1 (en) | 2005-11-01 | 2007-05-03 | Microsoft Corporation | Video booklet |
| US7218325B1 (en) | 2004-03-31 | 2007-05-15 | Trading Technologies International, Inc. | Graphical display with integrated recent period zoom and historical period context data |
- 2005
- 2005-03-10USUS11/076,700patent/US7714876B1/ennot_activeExpired - Fee Related
Patent Citations (49)
| Publication number | Priority date | Publication date | Assignee | Title |
|---|---|---|---|---|
| US5623590A (en) | 1989-08-07 | 1997-04-22 | Lucent Technologies Inc. | Dynamic graphics arrangement for displaying spatial-time-series data |
| US5659768A (en) | 1993-01-06 | 1997-08-19 | Forbes; Kenneth S. | System and method for the time representation of tasks |
| US5742778A (en) | 1993-08-30 | 1998-04-21 | Hewlett-Packard Company | Method and apparatus to sense and multicast window events to a plurality of existing applications for concurrent execution |
| US5581797A (en) | 1993-10-22 | 1996-12-03 | Lucent Technologies Inc. | Method and apparatus for displaying hierarchical information of a large software system |
| US5801688A (en) | 1994-02-14 | 1998-09-01 | Smart Clipboard Corporation | Controlling an abstraction level of visualized data |
| US5929863A (en) | 1995-06-20 | 1999-07-27 | Casio Computer Co., Ltd. | Record extraction method and apparatus in data processor and recording medium recording programs of the record extraction method |
| US5828866A (en) | 1996-07-08 | 1998-10-27 | Hewlett-Packard Company | Real-time synchronization of concurrent views among a plurality of existing applications |
| US6222547B1 (en)* | 1997-02-07 | 2001-04-24 | California Institute Of Technology | Monitoring and analysis of data in cyberspace |
| US5986673A (en) | 1997-10-17 | 1999-11-16 | Martz; David R. | Method for relational ordering and displaying multidimensional data |
| US20020067381A1 (en) | 1998-03-20 | 2002-06-06 | Hugh Harlan M. | Method and apparatus for organizing and processing information using a digital computer |
| US6727926B1 (en) | 1998-06-29 | 2004-04-27 | Hitachi, Ltd. | Displaying method in information processing apparatus that permits execution of either object or task oriented processings |
| US6400366B1 (en) | 1998-09-14 | 2002-06-04 | Visual Insights, Inc. | Method and system for the interactive visualization and examination of data |
| US6301579B1 (en)* | 1998-10-20 | 2001-10-09 | Silicon Graphics, Inc. | Method, system, and computer program product for visualizing a data structure |
| US6269325B1 (en) | 1998-10-21 | 2001-07-31 | Unica Technologies, Inc. | Visual presentation technique for data mining software |
| US6330685B1 (en) | 1999-03-22 | 2001-12-11 | Ming C. Hao | Non-invasive mechanism to automatically ensure 3D-graphical consistency among plurality applications |
| US6377287B1 (en) | 1999-04-19 | 2002-04-23 | Hewlett-Packard Company | Technique for visualizing large web-based hierarchical hyperbolic space with multi-paths |
| US6700590B1 (en) | 1999-11-01 | 2004-03-02 | Indx Software Corporation | System and method for retrieving and presenting data using class-based component and view model |
| US6700575B1 (en)* | 2000-03-31 | 2004-03-02 | Ge Mortgage Holdings, Llc | Methods and apparatus for providing a quality control management system |
| US6704016B1 (en)* | 2000-05-08 | 2004-03-09 | 3Com Corporation | Method and apparatus for the graphical presentation of selected data |
| US6429868B1 (en) | 2000-07-13 | 2002-08-06 | Charles V. Dehner, Jr. | Method and computer program for displaying quantitative data |
| US20020054158A1 (en) | 2000-08-31 | 2002-05-09 | Akiko Asami | Information-processing apparatus and computer-graphic display program |
| US6711577B1 (en)* | 2000-10-09 | 2004-03-23 | Battelle Memorial Institute | Data mining and visualization techniques |
| US20020078086A1 (en) | 2000-12-18 | 2002-06-20 | Alden Jeffrey Morgan | Functional visualization of spreadsheets |
| US20020174087A1 (en) | 2001-05-02 | 2002-11-21 | Hao Ming C. | Method and system for web-based visualization of directed association and frequent item sets in large volumes of transaction data |
| US20030011601A1 (en)* | 2001-06-19 | 2003-01-16 | International Business Machines Corporation | Graphics image creation apparatus, and method and program therefor |
| US20040205450A1 (en) | 2001-07-27 | 2004-10-14 | Hao Ming C. | Method for visualizing large volumes of multiple-attribute data without aggregation using a pixel bar chart |
| US7221474B2 (en) | 2001-07-27 | 2007-05-22 | Hewlett-Packard Development Company, L.P. | Method for visualizing large volumes of multiple-attribute data without aggregation using a pixel bar chart |
| US20030071815A1 (en) | 2001-10-17 | 2003-04-17 | Hao Ming C. | Method for placement of data for visualization of multidimensional data sets using multiple pixel bar charts |
| US7038680B2 (en)* | 2002-01-09 | 2006-05-02 | Xerox Corporation | System for graphical display and interactive exploratory analysis of data and data relationships |
| US20030128212A1 (en)* | 2002-01-09 | 2003-07-10 | Pitkow James E. | System for graphical display and interactive exploratory analysis of data and data relationships |
| US20030152288A1 (en) | 2002-02-12 | 2003-08-14 | Laurent Balmelli | Space-optimized texture maps |
| US20030169295A1 (en) | 2002-03-07 | 2003-09-11 | Becerra Santiago E. | Method and system for creating graphical and interactive representations of input and output data |
| US20030208323A1 (en) | 2002-05-02 | 2003-11-06 | Hao Ming C. | Method and system for computing forces on data objects for physics-based visualization |
| US6658358B2 (en) | 2002-05-02 | 2003-12-02 | Hewlett-Packard Development Company, L.P. | Method and system for computing forces on data objects for physics-based visualization |
| US20030214504A1 (en) | 2002-05-15 | 2003-11-20 | Hao Ming C. | Method for visualizing graphical data sets having a non-uniform graphical density for display |
| US7046247B2 (en) | 2002-05-15 | 2006-05-16 | Hewlett-Packard Development Company, L.P. | Method for visualizing graphical data sets having a non-uniform graphical density for display |
| US7051284B2 (en) | 2002-05-16 | 2006-05-23 | Microsoft Corporation | Displaying information to indicate both the importance and the urgency of the information |
| US20030227484A1 (en) | 2002-06-11 | 2003-12-11 | Hao Ming C. | System and method for visualization of objects using energy minimization of customized potential functions |
| US20040078378A1 (en) | 2002-07-10 | 2004-04-22 | Jerzy Bala | Knowledge inferencing and data visualization method and system |
| US20040085316A1 (en)* | 2002-10-30 | 2004-05-06 | Web Information Technologies, Inc | Interactive data visualization and charting framework with self-detection of data commonality |
| US20040169654A1 (en)* | 2003-02-27 | 2004-09-02 | Teracruz, Inc. | System and method for tree map visualization for database performance data |
| US20040183799A1 (en) | 2003-03-20 | 2004-09-23 | Hao Ming C. | System for visualizing massive web transaction data sets without overlapping |
| US6937238B2 (en) | 2003-03-20 | 2005-08-30 | Hewlett-Packard Development Company, L.P. | System for visualizing massive web transaction data sets without overlapping |
| US20040252128A1 (en) | 2003-06-16 | 2004-12-16 | Hao Ming C. | Information visualization methods, information visualization systems, and articles of manufacture |
| US20050088441A1 (en) | 2003-10-27 | 2005-04-28 | Hao Ming C. | Visual boundaries for aggregate information in pixel-oriented graphs |
| US7218325B1 (en) | 2004-03-31 | 2007-05-15 | Trading Technologies International, Inc. | Graphical display with integrated recent period zoom and historical period context data |
| US20060059439A1 (en) | 2004-09-15 | 2006-03-16 | Hewlett-Packard Development Company, L.P. | Constructing substantially equal-width pixel bar charts to enable visual data analysis |
| US20060156246A1 (en)* | 2005-01-12 | 2006-07-13 | Microsoft Corporation | Architecture and engine for time line based visualization of data |
| US20070101268A1 (en) | 2005-11-01 | 2007-05-03 | Microsoft Corporation | Video booklet |
Non-Patent Citations (32)
| Title |
|---|
| A. Aris et al., "Representing Unevenly-Spaced Time Series Data for Visualization and Interactive Exploration," pp. 1-12 (2005). |
| B. Shneiderman, "Tree Visualization with Treemaps: a 2-D Space-Filling Approach", ACM Transactions on Graphics, vol. 11, No. 11, pp. 92-99, Jan. 1992. |
| D. A. Keim, "Designing Pixel-oriented Visualization Techniques: Theory and Applications", IEEE Transactions on Visualization and Computer Graphics, vol. 6, No. 1, Jan.-Mar. 2000, pp. 1-20. |
| D. Keim, M. C. Hao, J. Ladisch, M. Hsu, U. Dayal, "Pixel Bar Charts: A New Technique for Visualizing Large Multi-Attribute Data Sets without Aggregation", HP Technical Report, Apr. 11, 2001, pp. 1-10. |
| D.A. Kelm et al., "Hierarchical Pixel Bar Charts," IEEE Transactions on Visualization and Computer Graphics, vol. 8, No. 3, pp. 255-269 (Jul.-Sep. 2002). |
| D.A. Kelm et al., "Recursive Pattern: A Technique for Visualizing Very Large Amounts of Data," Proceedings of the 6th IEEE Visualization Conference, pp. 279-286 (1995). |
| G.W. Furnas, "Generalized Fisheye Views," Human Factors in Computing Systems CHI '86 Conference Proceedings, pp. 16-23 (1 986). |
| Hua Liu et al., "Rule-based visualiztion in the Discover computational steering collaboratory", 2004, p. 1-10.* |
| J.V. Carlis et al., "Interactive Visualization of Serial Periodic Data," Proceedings of UIST '98, 11th Annual Symposium on User Interface Software and Technology, pp. 1-10 (Nov. 1998). |
| Javid Alimohideen et al., "PAVIS-Pervasive Adaptive Visualization and Interaction Service", Dec. 2005, p. 1-5.* |
| Javid Alimohideen et al., "PAVIS—Pervasive Adaptive Visualization and Interaction Service", Dec. 2005, p. 1-5.* |
| L. Wei et al., "Assumption-Free Anomaly Detection in Time Series," University of California-Riverside, Department of Computer Science & Engineering, pp. 1-4 (2005). |
| L. Wei et al., "Assumption-Free Anomaly Detection in Time Series," University of California—Riverside, Department of Computer Science & Engineering, pp. 1-4 (2005). |
| M. Ankerst, M. Ester, H.-P. Kriegel, "Towards an effective cooperation of the computer and the user for classification", Proc. 6th Int. Conf. On Knowledge Discovery and Data Mining, (KDD 2000), Aug. 20-23, 2000, Boston, MA, 2000, pp. 1-10. |
| M. Sifer, "Query Web Site Visitor Trend Data with Coordinated Nested Bar and Pie Charts", Proc. of the Pan-Sydney area Workshop on Visual Info. Proc., May 2001, Sydney, Australia, pp. 1-2. |
| M. Weber et al., "Visualizing Time-Series on Spirals," pp. 1-6 (2001). |
| M.C. Chuah et al., "Dynamic Aggregation with Circular Visual Designs," School of Computer Science, Carnegie Mellon University, pp. 1-9 (1998). |
| M.C. Hao, J. Ladisch, U. Dayal, M. Hsu, A. Krug; "Visual Mining of E-customer Behavior Using Pixel Bar Charts", HP Technical Report, Jun. 20, 2001, pp. 1-7. |
| R. Rao et al., http://sigchi.org/chi95/proceedings/videos/rr-bdy.htm (4 pages) 1995. |
| R. Rao et al., http://sigchi.org/chi95/proceedings/videos/rr—bdy.htm (4 pages) 1995. |
| S. G. Eick et al., "Visual Scalability," Technical Report No. 106, National Institute of Statistical Sciences, pp. 1-27 (Jun. 2000). |
| U.S. Appl. No. 09/982,481, Examiner's Answer dated Jun. 1, 2004, pp. 1-16. |
| U.S. Appl. No. 09/982,481, Examiner's Answer dated Sep. 3, 2008, pp. 1-68. |
| U.S. Appl. No. 09/982,481, Final Rejection dated Dec. 17, 2003, pp. 1-13. |
| U.S. Appl. No. 09/982,481, Final Rejection dated Jan. 25, 2006, pp. 1-17 and attachments. |
| U.S. Appl. No. 09/982,481, Final Rejection dated Nov. 14, 2006, pp. 1-22. |
| U.S. Appl. No. 09/982,481, Final Rejection dated Sep. 5, 2007, pp. 1-43. |
| U.S. Appl. No. 09/982,481, Non-Final Rejection dated Apr. 4, 2008, pp. 1-58 and attachments. |
| U.S. Appl. No. 09/982,481, Non-Final Rejection dated Aug. 27, 2003, pp. 1-9 and attachments. |
| U.S. Appl. No. 09/982,481, Non-Final Rejection dated Jul. 26, 2006, pp. 1-19 and attachments. |
| U.S. Appl. No. 09/982,481, Non-Final Rejection dated May 8, 2007, pp. 1-33. |
| U.S. Appl. No. 09/982,481, Non-Final Rejection dated Oct. 4, 2005, pp. 1-11 and attachments. |
Cited By (33)
| Publication number | Priority date | Publication date | Assignee | Title |
|---|---|---|---|---|
| US20040252128A1 (en)* | 2003-06-16 | 2004-12-16 | Hao Ming C. | Information visualization methods, information visualization systems, and articles of manufacture |
| US7924283B1 (en) | 2006-09-19 | 2011-04-12 | Hewlett-Packard Development Company, L.P. | Time relevance-based visualization of data |
| US8773436B1 (en) | 2006-09-27 | 2014-07-08 | Hewlett-Packard Development Company, L.P. | Pixel charts with data dependent display spaces |
| US9348881B1 (en) | 2006-12-29 | 2016-05-24 | Hewlett Packard Enterprise Development Lp | Visual content query for multi-dimensional datasets |
| US20080180382A1 (en)* | 2007-01-31 | 2008-07-31 | Hao Ming C | Providing an automated visualization of a collection of data values divided into a number of bins depending upon a change feature of the data values |
| US8963969B2 (en) | 2007-01-31 | 2015-02-24 | Hewlett-Packard Development Company, L.P. | Providing an automated visualization of a collection of data values divided into a number of bins depending upon a change feature of the data values |
| US7921363B1 (en) | 2007-04-30 | 2011-04-05 | Hewlett-Packard Development Company, L.P. | Applying data thinning processing to a data set for visualization |
| US8924843B1 (en) | 2007-04-30 | 2014-12-30 | Hewlett-Packard Development Company, L.P. | Visualizing a plurality of times series in corresponding cell-based lines of a display region |
| US7941742B1 (en) | 2007-04-30 | 2011-05-10 | Hewlett-Packard Development Company, L.P. | Visualizing growing time series data in a single view |
| US20090033664A1 (en)* | 2007-07-31 | 2009-02-05 | Hao Ming C | Generating a visualization to show mining results produced from selected data items and attribute(s) in a selected focus area and other portions of a data set |
| US8022952B2 (en) | 2007-07-31 | 2011-09-20 | Hewlett-Packard Development Company, L.P. | Generating a visualization to show mining results produced from selected data items and attribute(s) in a selected focus area and other portions of a data set |
| US8427478B2 (en) | 2008-01-25 | 2013-04-23 | Hewlett-Packard Development Company, L.P. | Displaying continually-incoming time series that uses overwriting of one portion of the time series data while another portion of the time series data remains unshifted |
| US20100103189A1 (en)* | 2008-01-25 | 2010-04-29 | Hao Ming C | Displaying continually-incoming time series that uses overwriting of one portion of the time series data while another portion of the time series data remains unshifted |
| US20100103176A1 (en)* | 2008-10-28 | 2010-04-29 | Hao Ming C | Non-overlapping visualization of data records of a scatter plot |
| US9880086B2 (en) | 2008-10-28 | 2018-01-30 | Entit Software Llc | Non-overlapping visualization of data records of a scatter plot |
| US9298789B2 (en) | 2009-01-23 | 2016-03-29 | Hewlett Packard Enterprise Development Lp | Placement of cells in bins to provide non-overlapping visualization of data points of a scatter plot |
| US20100188413A1 (en)* | 2009-01-23 | 2010-07-29 | Hao Ming C | Placement of cells in bins to provide non-overlapping visualization of data points of a scatter plot |
| US8643646B2 (en)* | 2009-03-16 | 2014-02-04 | Hewlett-Packard Development Company, L.P. | Constructing a cell-based cluster of data records of a scatter plot |
| US20100231594A1 (en)* | 2009-03-16 | 2010-09-16 | Hao Ming C | Constructing a cell-based cluster of data records of a scatter plot |
| US8239349B2 (en) | 2010-10-07 | 2012-08-07 | Hewlett-Packard Development Company, L.P. | Extracting data |
| US9064245B2 (en) | 2012-02-22 | 2015-06-23 | Hewlett-Packard Development Company, L.P. | Generating a calendar graphical visualization including pixels representing data records containing user feedback |
| US9064009B2 (en) | 2012-03-28 | 2015-06-23 | Hewlett-Packard Development Company, L.P. | Attribute cloud |
| US9087143B2 (en) | 2012-03-30 | 2015-07-21 | Hewlett-Packard Development Company, L.P. | Overlaying transparency images including pixels corresponding to different heirarchical levels over a geographic map |
| US9280612B2 (en) | 2012-12-14 | 2016-03-08 | Hewlett Packard Enterprise Development Lp | Visualizing a relationship of attributes using a relevance determination process to select from candidate attribute values |
| US20150356752A1 (en)* | 2014-06-06 | 2015-12-10 | Tata Consultancy Services Limited | System and method for interactively visualizing rules and exceptions |
| US10460477B2 (en)* | 2014-06-06 | 2019-10-29 | Tata Consultancy Services Limited | System and method for interactively visualizing rules and exceptions |
| US9870362B2 (en)* | 2014-11-11 | 2018-01-16 | Microsoft Technology Licensing, Llc | Interactive data-driven presentations |
| US20160132225A1 (en)* | 2014-11-11 | 2016-05-12 | Microsoft Technology Licensing, Llc | Interactive data-driven presentations |
| US20160253828A1 (en)* | 2015-02-27 | 2016-09-01 | Fujitsu Limited | Display control system, and graph display method |
| US10061469B2 (en) | 2016-09-28 | 2018-08-28 | International Business Machines Corporation | Swivel bar concept within a 3D space to invite users to explore additional data on a third axis |
| US10068357B2 (en)* | 2016-09-28 | 2018-09-04 | International Business Machines Corporation | Graphical evaluation of a cognitive analysis using a 3D swivel bar chart |
| US20190369822A1 (en)* | 2018-06-05 | 2019-12-05 | Ge Inspection Technologies, Lp | User Interface |
| US10754516B2 (en)* | 2018-06-05 | 2020-08-25 | Ge Inspection Technologies, Lp | User interface |
Similar Documents
| Publication | Publication Date | Title |
|---|---|---|
| US7714876B1 (en) | Method and system for creating visualizations | |
| JP6730399B2 (en) | System and method for dialog customization | |
| RU2541216C2 (en) | Bidirectional update of grid and associated visualisations | |
| US9418336B2 (en) | Automatic recognition and insights of data | |
| US7487447B1 (en) | Web page zoom feature | |
| US7305622B2 (en) | Graphical user interface and web site evaluation tool for customizing web sites | |
| US8806325B2 (en) | Mode identification for selective document content presentation | |
| US8935301B2 (en) | Data context selection in business analytics reports | |
| US12367253B2 (en) | Simplified website creation, configuration, and customization system | |
| JP2022534214A (en) | Systems and methods for providing responsive editing and viewing that integrate hierarchical fluid components and dynamic layouts | |
| US11537363B2 (en) | User interface migration using intermediate user interfaces | |
| US20150007085A1 (en) | Data visualizations including interactive time line representations | |
| US20130038612A1 (en) | Automatic generation of trend charts | |
| KR20090041244A (en) | Adaptive document display device and method | |
| CA2716436A1 (en) | Systems and methods for generating data visualization dashboards | |
| US10089120B2 (en) | Widgets in digital dashboards | |
| WO2021154496A1 (en) | User interface design update automation | |
| Glueck et al. | Dive in! Enabling progressive loading for real-time navigation of data visualizations | |
| US20100023854A1 (en) | Method and apparatus for reconstructing a web page | |
| US20140068485A1 (en) | Visualizing entries in a calendar using the third dimension | |
| US7581173B1 (en) | Methods and apparatuses for formatting web pages | |
| US20070294631A1 (en) | Apparatus and method for embedding and utilizing report controls within an online report | |
| US10216363B2 (en) | Navigating a network of options | |
| US7490290B2 (en) | System and method for a look and feel designer with a skin editor | |
| Anslow et al. | User evaluation of polymetric views using a large visualization wall |
Legal Events
| Date | Code | Title | Description |
|---|---|---|---|
| AS | Assignment | Owner name:HEWLETT-PACKARD DEVELOPMENT COMPANY, L.P.,TEXAS Free format text:ASSIGNMENT OF ASSIGNORS INTEREST;ASSIGNORS:HAO, MING C.;ISLAM, MUSTAZIRUL;DAYAL, UMESHWAR;SIGNING DATES FROM 20050303 TO 20050310;REEL/FRAME:016374/0711 | |
| STCF | Information on status: patent grant | Free format text:PATENTED CASE | |
| CC | Certificate of correction | ||
| FPAY | Fee payment | Year of fee payment:4 | |
| AS | Assignment | Owner name:HEWLETT PACKARD ENTERPRISE DEVELOPMENT LP, TEXAS Free format text:ASSIGNMENT OF ASSIGNORS INTEREST;ASSIGNOR:HEWLETT-PACKARD DEVELOPMENT COMPANY, L.P.;REEL/FRAME:037079/0001 Effective date:20151027 | |
| AS | Assignment | Owner name:ENTIT SOFTWARE LLC, CALIFORNIA Free format text:ASSIGNMENT OF ASSIGNORS INTEREST;ASSIGNOR:HEWLETT PACKARD ENTERPRISE DEVELOPMENT LP;REEL/FRAME:042746/0130 Effective date:20170405 | |
| AS | Assignment | Owner name:JPMORGAN CHASE BANK, N.A., DELAWARE Free format text:SECURITY INTEREST;ASSIGNORS:ENTIT SOFTWARE LLC;ARCSIGHT, LLC;REEL/FRAME:044183/0577 Effective date:20170901 Owner name:JPMORGAN CHASE BANK, N.A., DELAWARE Free format text:SECURITY INTEREST;ASSIGNORS:ATTACHMATE CORPORATION;BORLAND SOFTWARE CORPORATION;NETIQ CORPORATION;AND OTHERS;REEL/FRAME:044183/0718 Effective date:20170901 | |
| MAFP | Maintenance fee payment | Free format text:PAYMENT OF MAINTENANCE FEE, 8TH YEAR, LARGE ENTITY (ORIGINAL EVENT CODE: M1552) Year of fee payment:8 | |
| AS | Assignment | Owner name:MICRO FOCUS LLC, CALIFORNIA Free format text:CHANGE OF NAME;ASSIGNOR:ENTIT SOFTWARE LLC;REEL/FRAME:050004/0001 Effective date:20190523 | |
| LAPS | Lapse for failure to pay maintenance fees | Free format text:PATENT EXPIRED FOR FAILURE TO PAY MAINTENANCE FEES (ORIGINAL EVENT CODE: EXP.); ENTITY STATUS OF PATENT OWNER: LARGE ENTITY | |
| FEPP | Fee payment procedure | Free format text:MAINTENANCE FEE REMINDER MAILED (ORIGINAL EVENT CODE: REM.); ENTITY STATUS OF PATENT OWNER: LARGE ENTITY | |
| STCH | Information on status: patent discontinuation | Free format text:PATENT EXPIRED DUE TO NONPAYMENT OF MAINTENANCE FEES UNDER 37 CFR 1.362 | |
| FP | Lapsed due to failure to pay maintenance fee | Effective date:20220511 | |
| AS | Assignment | Owner name:MICRO FOCUS LLC (F/K/A ENTIT SOFTWARE LLC), CALIFORNIA Free format text:RELEASE OF SECURITY INTEREST REEL/FRAME 044183/0577;ASSIGNOR:JPMORGAN CHASE BANK, N.A.;REEL/FRAME:063560/0001 Effective date:20230131 Owner name:NETIQ CORPORATION, WASHINGTON Free format text:RELEASE OF SECURITY INTEREST REEL/FRAME 044183/0718;ASSIGNOR:JPMORGAN CHASE BANK, N.A.;REEL/FRAME:062746/0399 Effective date:20230131 Owner name:MICRO FOCUS SOFTWARE INC. (F/K/A NOVELL, INC.), WASHINGTON Free format text:RELEASE OF SECURITY INTEREST REEL/FRAME 044183/0718;ASSIGNOR:JPMORGAN CHASE BANK, N.A.;REEL/FRAME:062746/0399 Effective date:20230131 Owner name:ATTACHMATE CORPORATION, WASHINGTON Free format text:RELEASE OF SECURITY INTEREST REEL/FRAME 044183/0718;ASSIGNOR:JPMORGAN CHASE BANK, N.A.;REEL/FRAME:062746/0399 Effective date:20230131 Owner name:SERENA SOFTWARE, INC, CALIFORNIA Free format text:RELEASE OF SECURITY INTEREST REEL/FRAME 044183/0718;ASSIGNOR:JPMORGAN CHASE BANK, N.A.;REEL/FRAME:062746/0399 Effective date:20230131 Owner name:MICRO FOCUS (US), INC., MARYLAND Free format text:RELEASE OF SECURITY INTEREST REEL/FRAME 044183/0718;ASSIGNOR:JPMORGAN CHASE BANK, N.A.;REEL/FRAME:062746/0399 Effective date:20230131 Owner name:BORLAND SOFTWARE CORPORATION, MARYLAND Free format text:RELEASE OF SECURITY INTEREST REEL/FRAME 044183/0718;ASSIGNOR:JPMORGAN CHASE BANK, N.A.;REEL/FRAME:062746/0399 Effective date:20230131 Owner name:MICRO FOCUS LLC (F/K/A ENTIT SOFTWARE LLC), CALIFORNIA Free format text:RELEASE OF SECURITY INTEREST REEL/FRAME 044183/0718;ASSIGNOR:JPMORGAN CHASE BANK, N.A.;REEL/FRAME:062746/0399 Effective date:20230131 |