US7698417B2 - Optimized performance counter monitoring - Google Patents
Optimized performance counter monitoringDownload PDFInfo
- Publication number
- US7698417B2 US7698417B2US11/152,941US15294105AUS7698417B2US 7698417 B2US7698417 B2US 7698417B2US 15294105 AUS15294105 AUS 15294105AUS 7698417 B2US7698417 B2US 7698417B2
- Authority
- US
- United States
- Prior art keywords
- sample performance
- computing device
- value
- management server
- sample
- Prior art date
- Legal status (The legal status is an assumption and is not a legal conclusion. Google has not performed a legal analysis and makes no representation as to the accuracy of the status listed.)
- Active, expires
Links
Images


Classifications
- G—PHYSICS
- G05—CONTROLLING; REGULATING
- G05B—CONTROL OR REGULATING SYSTEMS IN GENERAL; FUNCTIONAL ELEMENTS OF SUCH SYSTEMS; MONITORING OR TESTING ARRANGEMENTS FOR SUCH SYSTEMS OR ELEMENTS
- G05B15/00—Systems controlled by a computer
- G05B15/02—Systems controlled by a computer electric
- G—PHYSICS
- G06—COMPUTING OR CALCULATING; COUNTING
- G06F—ELECTRIC DIGITAL DATA PROCESSING
- G06F11/00—Error detection; Error correction; Monitoring
- G06F11/30—Monitoring
- G06F11/34—Recording or statistical evaluation of computer activity, e.g. of down time, of input/output operation ; Recording or statistical evaluation of user activity, e.g. usability assessment
- G06F11/3409—Recording or statistical evaluation of computer activity, e.g. of down time, of input/output operation ; Recording or statistical evaluation of user activity, e.g. usability assessment for performance assessment
- G—PHYSICS
- G06—COMPUTING OR CALCULATING; COUNTING
- G06F—ELECTRIC DIGITAL DATA PROCESSING
- G06F11/00—Error detection; Error correction; Monitoring
- G06F11/30—Monitoring
- G06F11/34—Recording or statistical evaluation of computer activity, e.g. of down time, of input/output operation ; Recording or statistical evaluation of user activity, e.g. usability assessment
- G06F11/3466—Performance evaluation by tracing or monitoring
- G06F11/3495—Performance evaluation by tracing or monitoring for systems
- G—PHYSICS
- G06—COMPUTING OR CALCULATING; COUNTING
- G06F—ELECTRIC DIGITAL DATA PROCESSING
- G06F2201/00—Indexing scheme relating to error detection, to error correction, and to monitoring
- G06F2201/81—Threshold
Definitions
- Management systemstypically include a management server and multiple computers or computing devices. Such computing devices may be known as “clients”.
- the management servermay receive performance data from the clients. Performance data may be conveyed through what are commonly known as performance counters.
- Exemplary performance dataincludes utilization as to resources resident at a client, such as a client processor, client memory, client disk storage, etc. Furthermore, performance data may also be provided as certain processes, such as network interconnections between the client and management server.
- the received performance datamay be used by administrators at the management server to determine the quality of service (QOS) provided at the clients.
- QOScan include issues related to “denial of service” attacks, data throughput to clients, ability of clients to process received data, etc. Administrators may plot such performance data on a graph over time. For example, percentage of processor usage may be plotted against time to create a processor utilization data plot. By analyzing such data plots, trends can be identified and/or problems can be corrected, leading to improved service for clients.
- Performance counters or performance datamay be sent to the management server over a defined frequency.
- performance data from client devicesare sent to the management server over a regular interval of time.
- the greater the frequency that performance data is senti.e., the more performance data that is received over a particular period), the greater accuracy is provided.
- the amount of information (i.e., performance data or performance counter) that is sentcan be significant.
- one or more networks that are used to connect the management server and client devicesmay have bandwidth constraints, and resource constraints at the management server and client devices, the amount of information sent can lead to network congestion and resource problems at the management server and client devices.
- Optimized performance counter monitoring in a management systemis performed by taking a sample performance value, waiting for a period of time, and determining if a succeeding performance value falls within a delta
- computing devicescollect sample performance values which may be in the form of performance data or performance counters. The sample performance values are selectively sent to a management server. Sample performance values are taken based on a set frequency. If a collected sample performance value falls outside a defined delta value of a last collected sample performance value, the collected sample performance value is sent to the management server. Otherwise, if the collected sample value is within the define delta value, the collected sample performance value is not sent to the management server.
- FIG. 1is an illustration of a management system that selectively provides performance data of computing devices to a management server.
- FIG. 2is a plot of sample performance values taken at a computing device over time.
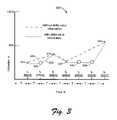
- FIG. 3is a plot of received and derived sample performance values from a computing device.
- FIG. 4is a block diagram of a management server that receives sample performance values from computing devices.
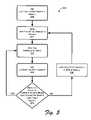
- FIG. 5is a flow diagram illustrating a process for sending selective performance values to a management server.
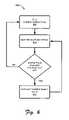
- FIG. 6is a flow diagram illustrating a process for plotting received and derived sample performance values from a computing device.
- the following disclosuredescribes techniques in which client or computing devices selectively send sample performance values to a management server to compare with previously collected sample performance values.
- FIG. 1shows a management system 100 that provides selective performance data or performance counters from computing devices to a management server.
- the selective performance data or performance countersmay be referred to as sample performance values.
- sample performance valuesare collected by clients, represented by “computing device 1 ” 105 ( 1 ), “computing device 2 ” 105 ( 2 ), and “computing device 3 ” 105 ( 3 ), and sent to management server 110 .
- Computing devices 105are managed by management server 110 .
- Management server 110may provide a service (e.g., applications, data, etc.) to computing devices 105 and monitor performance of computing devices 105 .
- performanceis monitored by the management server 110 by receiving performance data from the computing devices 105 .
- computing devices 105send sample performance values when there is a sufficient or significant change from a last sent sample performance value. A change is deemed sufficient if it varies a predefined delta from the last sample performance value. If the performance value does not change significantly, it is not collected as a sample and hence not sent to the management server.
- “computing device 1 ” 105 ( 1 )is shown as a desktop personal computer (PC).
- “Computing device 2 ” 105 ( 2 )is shown as a laptop PC.
- “Computing device 3 ” 105 ( 3 )is shown as a personal digital assistant (PDA). It is contemplated that in other cases, management system 100 includes other computing devices such as smart phones, media players, dedicated server computers, and the like.
- each of computing devices 105includes a management agent 115 that monitors sample performance values that are provided at computing devices 105 .
- the management agentdetermines if sample performance values are to be sent from computing devices 105 based on a change or delta from previous sample performance values.
- Management server 110includes a management service interface 120 that communicates with the management agents of computing devices 105 .
- Management agents 115(as well as updates of management agents) of computing devices 105 may be received from management server 110 .
- the management agents 115 and management service interface 120are discussed in greater detail below.
- Management server 110is connected to a storage 125 to store performance counter or performance data.
- Sample performance valuesi.e., performance data or performance counters
- the sample performance valuesmay be analyzed to determine trends or potential problems.
- a network 130connects computing devices 105 - 115 with management server 120 .
- the network 130allows management server 120 to access and receive selective sample performance values from computing devices 105 - 115 .
- the selective sample performance valuesare sent based on a defined delta value used by computing devices 105 - 115 . The use of the delta value is described further below.
- FIG. 2shows a plot 200 of sample performance values taken at a computing device.
- Plot 200in particular is based on sample performance values taken by a computing device at distinct times t 1 205 ( 1 ) to t N 205 (N). Although one plot 200 is shown, it is expected that multiple plots may be derived based on various computing device resources such as processor usage, memory usage, disk usage, etc.
- samplesare taken based on percentage utilization (i.e., utilization of a computing device resource) at a particular time. Examples can include client processor utilization and disk utilization.
- Sample performance valuesi.e., performance data or performance counters
- ftime period of “T”. Therefore, times 205 are spaced per a time period of “T”. Sample performance values are taken every “T” units of time.
- a sample performance value 210is taken at t 1 205 ( 1 )
- a sample performance value 215is taken at t 2 205 ( 2 )
- a sample performance value 220is taken at t 3 205 ( 3 )
- a sample performance value 225is taken at t N ⁇ 1 205 (N ⁇ 1)
- a sample performance value 230is taken at t N 205 (N).
- Intermediate sample performance valuesare taken between times t 3 205 ( 3 ) and t N ⁇ 1 205 (N ⁇ 1).
- a delta valueis associated with each of the sample performance values.
- the delta valueis the same for each of the sample performance values.
- the delta valuemay be a plus or minus value relative to each of the actual sample performance values.
- the delta valuemay be +/ ⁇ 5% utilization of an actual sample performance value.
- a delta value 235is associated with sample performance value 210
- a delta value 240is associated with sample performance value 215
- a delta value 245is associated with sample performance value 220
- a delta value 250is associated with sample performance value 225
- a delta value 255is associated with sample performance value 230 .
- Delta values 235 - 255are used to determine if a sample performance value (along with a time) is to be sent to a management server. Specifically, if a sample performance value falls within a delta value of an immediately preceding sample performance value, that particular performance value is not sent to the management server. Alternatively, if a sample performance value falls outside of a delta value of an immediately preceding sample performance value, that particular sample performance value is sent to the management server.
- a first sample performance value(e.g., sample performance value 210 ) may be sent to the management server to establish an initial sample performance value at the computing device and the management server.
- sample performance value 215 valuefalls within the delta value 235 of preceding sample performance value 210 . Therefore, sample performance value 215 is not sent to the management server.
- Sample performance value 220is outside of delta value 240 of preceding sample performance value 215 . Therefore, sample performance value 220 is sent to the management server.
- FIG. 3shows a plot 300 of sample performance values received from a computing device.
- plot 300is created based on actual and interpolated sample performance values.
- Sample performance valuesmay be in the form of performance data or performance counters.
- Sample performance valuesmay be values received by a management server (e.g., management server 110 ) and stored in a separate storage device (e.g., performance counter storage 125 ).
- a management servere.g., management server 110
- a separate storage devicee.g., performance counter storage 125
- FIG. 3shows a plot 300 of sample performance values received from a computing device.
- client or computing devicese.g., computing devices 105
- sample performance valuesare plotted based on percentage utilization of a particular computing device resource (e.g., processor, memory, disk, etc) over time. Based on a known frequency “f” in which the sample performance values were taken at the computing device, sample performance values are plotted at particular times.
- a received sample performance valuemay include a particular time. It is expected that a performance value can be couple or value pair (i.e., time and value); however due to propagation delays, the time a sample is received at the server is not a reliable way to determine when the sample was measured.
- the known frequency “f”translates to a time period of “T”. Times t 1 305 ( 1 ) to t 7 305 ( 7 ) occur or are plotted every “T” units of time.
- sample performance valueswill be sent from the computing devices and some sample performance values will not be sent, depending if sample performance values fall within a delta value of preceding (i.e., last collected) sample performance values.
- sample performance values 310 , 315 , 320 , and 325represent those sample performance values received from the computing devices. Without knowing that a delta value is used, received sample performance values are simply connected to one another. In other words, sample performance value 310 is connected to sample performance value 315 , sample performance value 315 is connected to sample performance value 320 , and sample performance value 320 is connected to sample performance value 325 .
- the line 330 that is plottedmay not adequately represent the trend in performance data or sample performance values.
- sample performance values that are not receivedare interpolated between received sample performance values.
- sample performance values not receivedmay be extrapolated from a last received sample performance value.
- Sample performance values that are not receivedare known to be within a delta value of preceding sample performance values that are received. Therefore, sample performance values that are not received are designated with a value of the preceding sample performance value.
- sample performance value 340 at time t 2 305 ( 2 )sample performance value 345 at t 5 305 ( 5 ), and sample performance value 350 at time t 6 305 ( 6 ) are interpolated.
- the resulting line connecting received and interpolated sample performance values with delta value informationshows a more correct representation of the performance data trends than the line without delta value information that only connects actual received sample performance values.
- FIG. 4shows a management server 400 that receives performance data from computing devices.
- management server 400includes management server 110 of FIG. 1 .
- Management server 400has a central processing unit (CPU) or processor 405 and a memory 410 .
- Processor 405accesses memory 410 through a system bus (not shown).
- the memory 410may store an operating system 415 .
- a management service process component or management service interface 420(e.g., management service interface 120 of FIG. 1 ) is included in management server 400 .
- Management service interface 420provides for connecting to particular computing devices.
- performance datai.e., performance counters, sample performance values
- Management service interface 420connects with one or more computing devices such as computing device 425 .
- Computing device 425is representative of any one of the computing devices 105 of FIG. 1 .
- Computing device 425has a management agent 430 (which may also be included in memory) that communicates with management server 400 , and particularly with management server interface 420 .
- Management agent 430is particularly used to selectively gather and send sample performance values (i.e., performance data or performance counters) from computing device 425 and also is used to compare deltas in determining if a sample performance value is to be sent to the management server 400 .
- the sample performance valuesare sent to management server 400 .
- Management agent 430 and updates to management agent 430may be provided by the management server 400 .
- a processor 435is included in computing device 425 .
- Processor 435is particularly configured to access and control management agent 430 , such as through a system bus (not shown).
- processor 435accesses a memory 440 , where access may be through the system bus (not shown).
- Stored on memory 440is an operating system 445 .
- management agent 430may also be stored in memory 440 .
- FIG. 5shows a process 500 a process for a computing device to selectively send sample performance values.
- the process 500is illustrated as a collection of blocks in a logical flow graph, which represent a sequence of operations that can be implemented in hardware, software, firmware, or a combination thereof.
- the blocksrepresent computer instructions that, when executed by one or more processors, perform the recited operations.
- the processmay be implemented, for example, by the management agent 430 at the computing device 425 , although the process may be implemented by other architectures.
- an initial sample performance value or performance datai.e. performance counter
- This “sample” performance valueis set to a “last collected sample” value.
- the “last collected sample” performance valueis sent to the management server.
- a valuei.e., performance data, performance counter
- a time at which the value was takenmay also be sent to the server.
- a waitis performed based on a predefined time period.
- the time periodmay be time period “T” discussed above.
- the time periodmay also be defined by a particular frequency, such as frequency “f” discussed above.
- a succeeding “sample” performance valueis taken or calculated at the succeeding time after the wait is performed.
- the “current sample” performance valueis then set to the collected “sample” performance value.
- FIG. 6shows a exemplary process 600 for plotting sample performance values from a computing device.
- the process 600is illustrated as a collection of blocks in a logical flow graph, which represent a sequence of operations that can be implemented in hardware, software, firmware, or a combination thereof.
- the blocksrepresent computer instructions that, when executed by one or more processors, perform the recited operations.
- the processmay be implemented, for example, by the management service process 420 at the management server 400 , although the process may be implemented by other architectures.
- a current sample performance valueis plotted.
- the current sample performance valuemay be an initial sample performance value received from a computing device.
- the current sample performance value and all other sample performance values that are plottedare directed to a particular computing device resource (e.g., processor) or process (e.g. management server to computing device interconnection).
- the current sample performance value and other sample performance valuesmay have a time associated with it.
- the sample performance valuesare performance data and may be in the specific form of performance counters.
- a waitis performed based on a frequency at which sample values were collected at the computing device.
- the waitis for a unit of time or the time period “T” that is the inverse of the frequency.
- Block 610is particularly performed when no time is provided or associated with the sample performance values.
- a determination as to whether a sample performance value is available for plottingAfter waiting the specified period, a determination as to whether a sample performance value is available for plotting. If no sample performance value is available (i.e., following the “NO” branch of block 615 ), the value of the current sample performance value is plotted (i.e., block 605 ) against the new time after the wait is performed (i.e., block 610 ). In this matter, the process interpolates the next performance value as illustrated in plot 300 of FIG. 3 .
Landscapes
- Engineering & Computer Science (AREA)
- General Engineering & Computer Science (AREA)
- Physics & Mathematics (AREA)
- General Physics & Mathematics (AREA)
- Automation & Control Theory (AREA)
- Debugging And Monitoring (AREA)
Abstract
Description
Claims (16)
Priority Applications (1)
| Application Number | Priority Date | Filing Date | Title |
|---|---|---|---|
| US11/152,941US7698417B2 (en) | 2005-06-15 | 2005-06-15 | Optimized performance counter monitoring |
Applications Claiming Priority (1)
| Application Number | Priority Date | Filing Date | Title |
|---|---|---|---|
| US11/152,941US7698417B2 (en) | 2005-06-15 | 2005-06-15 | Optimized performance counter monitoring |
Publications (2)
| Publication Number | Publication Date |
|---|---|
| US20060287738A1 US20060287738A1 (en) | 2006-12-21 |
| US7698417B2true US7698417B2 (en) | 2010-04-13 |
Family
ID=37574447
Family Applications (1)
| Application Number | Title | Priority Date | Filing Date |
|---|---|---|---|
| US11/152,941Active2028-05-15US7698417B2 (en) | 2005-06-15 | 2005-06-15 | Optimized performance counter monitoring |
Country Status (1)
| Country | Link |
|---|---|
| US (1) | US7698417B2 (en) |
Cited By (7)
| Publication number | Priority date | Publication date | Assignee | Title |
|---|---|---|---|---|
| US20080221911A1 (en)* | 2007-03-09 | 2008-09-11 | Ludmila Cherkasova | System and method for determining a subset of transactions of a computing system for use in determining resource costs |
| US20090119301A1 (en)* | 2007-11-05 | 2009-05-07 | Ludmila Cherkasova | System and method for modeling a session-based system with a transaction-based analytic model |
| US20090138544A1 (en)* | 2006-11-22 | 2009-05-28 | Rainer Wegenkittl | Method and System for Dynamic Image Processing |
| US20090167520A1 (en)* | 2005-07-11 | 2009-07-02 | Nec Corporation | Communication network failure detection system, and communication network failure detection method and failure detection program |
| US20100275184A1 (en)* | 2009-04-23 | 2010-10-28 | Dor Nir | Resource monitoring |
| US20110238974A1 (en)* | 2009-12-03 | 2011-09-29 | Wells Ryan D | Methods and apparatus to improve turbo performance for events handling |
| US20150143180A1 (en)* | 2013-11-21 | 2015-05-21 | Microsoft Corporation | Validating software characteristics |
Families Citing this family (8)
| Publication number | Priority date | Publication date | Assignee | Title |
|---|---|---|---|---|
| US8560604B2 (en) | 2009-10-08 | 2013-10-15 | Hola Networks Ltd. | System and method for providing faster and more efficient data communication |
| US20150113338A1 (en)* | 2012-10-02 | 2015-04-23 | Panasonic Intellectual Property Management Co., Ltd. | Monitoring device and monitoring method |
| US9241044B2 (en) | 2013-08-28 | 2016-01-19 | Hola Networks, Ltd. | System and method for improving internet communication by using intermediate nodes |
| US11057446B2 (en) | 2015-05-14 | 2021-07-06 | Bright Data Ltd. | System and method for streaming content from multiple servers |
| US11153183B2 (en)* | 2015-06-11 | 2021-10-19 | Instana, Inc. | Compacted messaging for application performance management system |
| EP3767494B1 (en) | 2017-08-28 | 2023-02-15 | Bright Data Ltd. | Method for improving content fetching by selecting tunnel devices |
| EP3780557B1 (en) | 2019-02-25 | 2023-02-15 | Bright Data Ltd. | System and method for url fetching retry mechanism |
| EP4030318B1 (en) | 2019-04-02 | 2025-06-04 | Bright Data Ltd. | System and method for managing non-direct url fetching service |
Citations (23)
| Publication number | Priority date | Publication date | Assignee | Title |
|---|---|---|---|---|
| US5619656A (en)* | 1994-05-05 | 1997-04-08 | Openservice, Inc. | System for uninterruptively displaying only relevant and non-redundant alert message of the highest severity for specific condition associated with group of computers being managed |
| US5867495A (en) | 1996-11-18 | 1999-02-02 | Mci Communications Corporations | System, method and article of manufacture for communications utilizing calling, plans in a hybrid network |
| US6453346B1 (en)* | 1998-07-17 | 2002-09-17 | Proactivenet, Inc. | Method and apparatus for intelligent storage and reduction of network information |
| US20020184363A1 (en)* | 2001-04-20 | 2002-12-05 | Steven Viavant | Techniques for server-controlled measurement of client-side performance |
| US20020198891A1 (en) | 2001-06-14 | 2002-12-26 | International Business Machines Corporation | Methods and apparatus for constructing and implementing a universal extension module for processing objects in a database |
| US20030018627A1 (en) | 2001-07-18 | 2003-01-23 | Turner Paul William | Apparatus and method for workflow |
| US6587878B1 (en)* | 1999-05-12 | 2003-07-01 | International Business Machines Corporation | System, method, and program for measuring performance in a network system |
| US20040015583A1 (en) | 2000-11-30 | 2004-01-22 | Barrett Mark A | Network management apparatus |
| US20040148299A1 (en) | 2002-11-25 | 2004-07-29 | Microsoft Corporation | Automated workflow composable action model |
| US20050114448A1 (en) | 2003-11-03 | 2005-05-26 | Apacheta Corporation | System and method for delegation of data processing tasks based on device physical attributes and spatial behavior |
| US6901442B1 (en)* | 2000-01-07 | 2005-05-31 | Netiq Corporation | Methods, system and computer program products for dynamic filtering of network performance test results |
| US20050198298A1 (en)* | 2004-03-08 | 2005-09-08 | Norifumi Nishikawa | System monitoring method |
| US20060004749A1 (en) | 2004-05-28 | 2006-01-05 | International Business Machines Corporation | Method and system for managing execution of data driven workflows |
| US20060111921A1 (en) | 2004-11-23 | 2006-05-25 | Hung-Yang Chang | Method and apparatus of on demand business activity management using business performance management loops |
| US20060117387A1 (en)* | 2004-11-30 | 2006-06-01 | Gunsalus Bradley W | Propagation protection of email within a network |
| US7062537B2 (en) | 2002-11-25 | 2006-06-13 | Microsoft Corporation | Workflow services architecture |
| US7065566B2 (en)* | 2001-03-30 | 2006-06-20 | Tonic Software, Inc. | System and method for business systems transactions and infrastructure management |
| US20060167891A1 (en)* | 2005-01-27 | 2006-07-27 | Blaisdell Russell C | Method and apparatus for redirecting transactions based on transaction response time policy in a distributed environment |
| US20060245369A1 (en)* | 2005-04-19 | 2006-11-02 | Joern Schimmelpfeng | Quality of service in IT infrastructures |
| US20070022093A1 (en) | 2005-03-07 | 2007-01-25 | Nat Wyatt | System and method for analyzing and reporting extensible data from multiple sources in multiple formats |
| US7197559B2 (en)* | 2001-05-09 | 2007-03-27 | Mercury Interactive Corporation | Transaction breakdown feature to facilitate analysis of end user performance of a server system |
| US7499994B2 (en)* | 2004-03-30 | 2009-03-03 | Emc Corporation | System and method of providing performance information for a communications network |
| US7505415B2 (en)* | 2004-01-30 | 2009-03-17 | Nortel Networks Limited | Performance monitoring in a communications network |
- 2005
- 2005-06-15USUS11/152,941patent/US7698417B2/enactiveActive
Patent Citations (24)
| Publication number | Priority date | Publication date | Assignee | Title |
|---|---|---|---|---|
| US5619656A (en)* | 1994-05-05 | 1997-04-08 | Openservice, Inc. | System for uninterruptively displaying only relevant and non-redundant alert message of the highest severity for specific condition associated with group of computers being managed |
| US5867495A (en) | 1996-11-18 | 1999-02-02 | Mci Communications Corporations | System, method and article of manufacture for communications utilizing calling, plans in a hybrid network |
| US6453346B1 (en)* | 1998-07-17 | 2002-09-17 | Proactivenet, Inc. | Method and apparatus for intelligent storage and reduction of network information |
| US6587878B1 (en)* | 1999-05-12 | 2003-07-01 | International Business Machines Corporation | System, method, and program for measuring performance in a network system |
| US6901442B1 (en)* | 2000-01-07 | 2005-05-31 | Netiq Corporation | Methods, system and computer program products for dynamic filtering of network performance test results |
| US20040015583A1 (en) | 2000-11-30 | 2004-01-22 | Barrett Mark A | Network management apparatus |
| US7065566B2 (en)* | 2001-03-30 | 2006-06-20 | Tonic Software, Inc. | System and method for business systems transactions and infrastructure management |
| US20020184363A1 (en)* | 2001-04-20 | 2002-12-05 | Steven Viavant | Techniques for server-controlled measurement of client-side performance |
| US7197559B2 (en)* | 2001-05-09 | 2007-03-27 | Mercury Interactive Corporation | Transaction breakdown feature to facilitate analysis of end user performance of a server system |
| US20020198891A1 (en) | 2001-06-14 | 2002-12-26 | International Business Machines Corporation | Methods and apparatus for constructing and implementing a universal extension module for processing objects in a database |
| US20030018627A1 (en) | 2001-07-18 | 2003-01-23 | Turner Paul William | Apparatus and method for workflow |
| US20040148299A1 (en) | 2002-11-25 | 2004-07-29 | Microsoft Corporation | Automated workflow composable action model |
| US7062537B2 (en) | 2002-11-25 | 2006-06-13 | Microsoft Corporation | Workflow services architecture |
| US20050114448A1 (en) | 2003-11-03 | 2005-05-26 | Apacheta Corporation | System and method for delegation of data processing tasks based on device physical attributes and spatial behavior |
| US7505415B2 (en)* | 2004-01-30 | 2009-03-17 | Nortel Networks Limited | Performance monitoring in a communications network |
| US20050198298A1 (en)* | 2004-03-08 | 2005-09-08 | Norifumi Nishikawa | System monitoring method |
| US7499994B2 (en)* | 2004-03-30 | 2009-03-03 | Emc Corporation | System and method of providing performance information for a communications network |
| US20060004749A1 (en) | 2004-05-28 | 2006-01-05 | International Business Machines Corporation | Method and system for managing execution of data driven workflows |
| US20060111921A1 (en) | 2004-11-23 | 2006-05-25 | Hung-Yang Chang | Method and apparatus of on demand business activity management using business performance management loops |
| US20060117387A1 (en)* | 2004-11-30 | 2006-06-01 | Gunsalus Bradley W | Propagation protection of email within a network |
| US20060167891A1 (en)* | 2005-01-27 | 2006-07-27 | Blaisdell Russell C | Method and apparatus for redirecting transactions based on transaction response time policy in a distributed environment |
| US20070022093A1 (en) | 2005-03-07 | 2007-01-25 | Nat Wyatt | System and method for analyzing and reporting extensible data from multiple sources in multiple formats |
| US7630956B2 (en)* | 2005-03-07 | 2009-12-08 | Skytide, Inc. | System and method for analyzing and reporting extensible data from multiple sources in multiple formats |
| US20060245369A1 (en)* | 2005-04-19 | 2006-11-02 | Joern Schimmelpfeng | Quality of service in IT infrastructures |
Cited By (14)
| Publication number | Priority date | Publication date | Assignee | Title |
|---|---|---|---|---|
| US20090167520A1 (en)* | 2005-07-11 | 2009-07-02 | Nec Corporation | Communication network failure detection system, and communication network failure detection method and failure detection program |
| US8065568B2 (en)* | 2005-07-11 | 2011-11-22 | Nec Corporation | Communication network failure detection system, and communication network failure detection method and failure detection program |
| US20090138544A1 (en)* | 2006-11-22 | 2009-05-28 | Rainer Wegenkittl | Method and System for Dynamic Image Processing |
| US8793301B2 (en)* | 2006-11-22 | 2014-07-29 | Agfa Healthcare | Method and system for dynamic image processing |
| US7779127B2 (en)* | 2007-03-09 | 2010-08-17 | Hewlett-Packard Development Company, L.P. | System and method for determining a subset of transactions of a computing system for use in determing resource costs |
| US20080221911A1 (en)* | 2007-03-09 | 2008-09-11 | Ludmila Cherkasova | System and method for determining a subset of transactions of a computing system for use in determining resource costs |
| US8326970B2 (en) | 2007-11-05 | 2012-12-04 | Hewlett-Packard Development Company, L.P. | System and method for modeling a session-based system with a transaction-based analytic model |
| US20090119301A1 (en)* | 2007-11-05 | 2009-05-07 | Ludmila Cherkasova | System and method for modeling a session-based system with a transaction-based analytic model |
| US8615739B2 (en)* | 2009-04-23 | 2013-12-24 | Hewlett-Packard Development Company, L.P. | Resource monitoring |
| US20100275184A1 (en)* | 2009-04-23 | 2010-10-28 | Dor Nir | Resource monitoring |
| US20110238974A1 (en)* | 2009-12-03 | 2011-09-29 | Wells Ryan D | Methods and apparatus to improve turbo performance for events handling |
| US9092218B2 (en)* | 2009-12-03 | 2015-07-28 | Intel Corporation | Methods and apparatus to improve turbo performance for events handling |
| US9098274B2 (en) | 2009-12-03 | 2015-08-04 | Intel Corporation | Methods and apparatuses to improve turbo performance for events handling |
| US20150143180A1 (en)* | 2013-11-21 | 2015-05-21 | Microsoft Corporation | Validating software characteristics |
Also Published As
| Publication number | Publication date |
|---|---|
| US20060287738A1 (en) | 2006-12-21 |
Similar Documents
| Publication | Publication Date | Title |
|---|---|---|
| US7487206B2 (en) | Method for providing load diffusion in data stream correlations | |
| CN111124819B (en) | Method and device for full link monitoring | |
| US7698417B2 (en) | Optimized performance counter monitoring | |
| US9363151B2 (en) | Dynamically determining packet sampling rates | |
| US10404556B2 (en) | Methods and computer program products for correlation analysis of network traffic in a network device | |
| US8700765B2 (en) | Methods and computer program products for monitoring and reporting network application performance | |
| US8868727B2 (en) | Methods and computer program products for storing generated network application performance data | |
| US8589537B2 (en) | Methods and computer program products for aggregating network application performance metrics by process pool | |
| US9197566B2 (en) | Information processing method, recording medium, and information processing apparatus | |
| US10313209B2 (en) | System and method to sample a large data set of network traffic records | |
| US20170116034A1 (en) | Systems and methods for service demand based performance prediction with varying workloads | |
| US8635381B2 (en) | System, method and computer program product for monitoring memory access | |
| EP2634699B1 (en) | Application monitoring | |
| US9542459B2 (en) | Adaptive data collection | |
| CN112148551B (en) | Method, apparatus and computer program product for determining a rate of change of usage of a storage system | |
| US20080109390A1 (en) | Method for dynamically managing a performance model for a data center | |
| CN119182716A (en) | Service interface flow control method, device, equipment, medium and program product | |
| US10122599B2 (en) | Method and apparatus for dynamically scaling application performance analysis completeness based on available system resources | |
| US20130013769A1 (en) | Determining heavy distinct hitters in a data stream | |
| CN116382892B (en) | Load balancing method and device based on multi-cloud fusion and cloud service | |
| CN112527782A (en) | Data processing method and device | |
| EP3754910A1 (en) | Packet analysis program and packet analyzing device | |
| CN106686082A (en) | Storage resource adjustment method and management node | |
| CN112260903A (en) | Link monitoring method and device | |
| KR20220055661A (en) | Edge service processing system and control method thereof |
Legal Events
| Date | Code | Title | Description |
|---|---|---|---|
| AS | Assignment | Owner name:MICROSOFT CORPORATION,WASHINGTON Free format text:ASSIGNMENT OF ASSIGNORS INTEREST;ASSIGNORS:RIZZI, LORENZO;DILILLO, GERARDO;REEL/FRAME:016548/0174 Effective date:20050615 Owner name:MICROSOFT CORPORATION, WASHINGTON Free format text:ASSIGNMENT OF ASSIGNORS INTEREST;ASSIGNORS:RIZZI, LORENZO;DILILLO, GERARDO;REEL/FRAME:016548/0174 Effective date:20050615 | |
| FEPP | Fee payment procedure | Free format text:PAYOR NUMBER ASSIGNED (ORIGINAL EVENT CODE: ASPN); ENTITY STATUS OF PATENT OWNER: LARGE ENTITY | |
| STCF | Information on status: patent grant | Free format text:PATENTED CASE | |
| FPAY | Fee payment | Year of fee payment:4 | |
| AS | Assignment | Owner name:MICROSOFT TECHNOLOGY LICENSING, LLC, WASHINGTON Free format text:ASSIGNMENT OF ASSIGNORS INTEREST;ASSIGNOR:MICROSOFT CORPORATION;REEL/FRAME:034543/0001 Effective date:20141014 | |
| MAFP | Maintenance fee payment | Free format text:PAYMENT OF MAINTENANCE FEE, 8TH YEAR, LARGE ENTITY (ORIGINAL EVENT CODE: M1552) Year of fee payment:8 | |
| MAFP | Maintenance fee payment | Free format text:PAYMENT OF MAINTENANCE FEE, 12TH YEAR, LARGE ENTITY (ORIGINAL EVENT CODE: M1553); ENTITY STATUS OF PATENT OWNER: LARGE ENTITY Year of fee payment:12 |