US7692653B1 - System and method for presenting statistics - Google Patents
System and method for presenting statisticsDownload PDFInfo
- Publication number
- US7692653B1 US7692653B1US09/968,953US96895301AUS7692653B1US 7692653 B1US7692653 B1US 7692653B1US 96895301 AUS96895301 AUS 96895301AUS 7692653 B1US7692653 B1US 7692653B1
- Authority
- US
- United States
- Prior art keywords
- displaying
- data items
- wedge
- subset
- wedges
- Prior art date
- Legal status (The legal status is an assumption and is not a legal conclusion. Google has not performed a legal analysis and makes no representation as to the accuracy of the status listed.)
- Expired - Lifetime, expires
Links
Images


Classifications
- G—PHYSICS
- G06—COMPUTING OR CALCULATING; COUNTING
- G06T—IMAGE DATA PROCESSING OR GENERATION, IN GENERAL
- G06T11/00—2D [Two Dimensional] image generation
- G06T11/20—Drawing from basic elements, e.g. lines or circles
Definitions
- This inventionrelates in general to the field of data processing, and in particular to a system and method for presenting statistics.
- a pie chartFor example, one well-known format that may be used to present statistical results is the pie chart.
- a pie chart for government spendingincludes wedges for different governmental programs, such as military, social security, etc.
- the wedge for each programoccupies a portion of the pie that corresponds to the amount spent by that program, relative to the total amount spent.
- a pie chartdepicts statistical results involving two parameters, the category parameter and the measure parameter.
- the values for the category parameterare military, social security, etc.
- the values for the measure parameterare the amounts spent in each category.
- the wedgesthus depict a categorization of spending according to program.
- Pie chartsare effective for communicating statistical results that are limited to two parameters.
- standard pie chartsare not designed to present results that include different values for three or more parameters. For instance, with reference to the above example, if a user is interested in understanding how government spending has changed over time, it is necessary to add a third parameter to the analysis: a time parameter.
- a standard pie chartaccommodates only two parameters, a separate pie chart must be used for each different year in the analysis.
- a presentation with a number of pie chartscan reveal relatively large changes over time, which show up as noticeable differences between the charts. More subtle changes, however, are not readily apparent.
- the size of each chartmust decrease, which further reduces the ability to convey any but the most obvious of changes.
- statistical analysesfrequently involve more than three parameters. For example, data mining systems may generate statistics containing summary information for many different parameters or dimensions.
- the systemproduces a plane figure such as a radial graph to depict statistics for a set of data items.
- Multiple wedges or slicesare displayed in the plane figure to categorize the set of data items into base subsets.
- a ring with a ring radiusis also displayed, and the ring radius represents a first measure, such as an average quantity of data items, for at least one of the wedges.
- that wedgehas a wedge radius which differs from the ring radius in proportion to a difference between a second measure and the first measure.
- the wedgesmay categorize the data items according to distinct values for a category attribute.
- the radial width of each wedgemay represent an aggregate measure for that wedge's base subset, in proportion to an aggregate measure for the set of items.
- time attributes of the data itemsmay be used to define temporal subsets of the base subsets, and the wedge radius for a wedge may differ from the ring radius to illustrate how the aggregate measure for that wedge's temporal subset differs from the normalized measure.
- One or more dividing linesmay also be displayed within the wedges to partition the each interior region into multiple areas.
- the areasrepresent a second categorization of each base subset, based on a supplementary parameter such as message direction or importance.
- the linesmay define sub-wedges and/or radial bands within the wedges.
- a presentation enginedisplays the radial graph in a user interface, while also displaying a first ordered list of topics in the user interface.
- the first ordered listis derived from the set of data items.
- the presentation enginereplaces the first ordered list of topics with a second ordered list of topics.
- the second ordered listis derived from the base subset associated with the selected wedge.
- a presentation managerdisplays first and second groups of objects in respective first and second areas of a presentation space.
- a lineis displayed between the first object and a second object in the second group to depict a flow of information between the first object and the second object.
- the presentation managerdisplays a third group of objects in a third area of the presentation space generally between the first area and the second area.
- linesare displayed between a third object in the third group and the first object and between the third object and the second object, to depict a characteristic of the flow of information between the first object and the second object.
- the first and second objectsmay relate to first and second business units
- the third objectmay reveal something about the content of messages that have passed between those business units.
- a user interfacehas a mechanism for selecting a different type of view to be displayed in lieu of a current view.
- the user interfacemay include a selectable object, such as a tab, for retrieving each of a radial view, a flow view, a timeline view, and a list view.
- a selectable objectsuch as a tab
- FIG. 1presents a block diagram of an example embodiment of a collaborative data processing environment which provides visualizations such as radial graphs and flow diagrams according to the present invention
- FIG. 2presents a flowchart of an illustrative process for displaying visualizations
- FIGS. 3A-3Bdepict a graphical user interface (GUI) featuring an illustrative list view
- FIG. 4depicts a GUI featuring an illustrative timeline view
- FIG. 5depicts a GUI featuring an illustrative radial view
- FIGS. 6A-6Fdepict an evolution from a pie chart to an illustrative radial graph according to the present invention
- FIG. 7depicts a GUI featuring an illustrative flow view
- FIGS. 8A-8Edepict an illustrative flow visualization in a variety of different states
- FIG. 9depicts a GUI featuring an alternative radial view
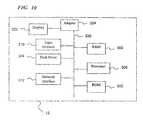
- FIG. 10presents a block diagram of an example data processing system.
- the 0110 Applicationdescribes ways of extracting useful knowledge from sets of data. This detailed description describes a method and system for presenting the results of statistical analyses, such as those performed by the 0110 Application, in a way that allows users to quickly and easily understand the knowledge represented by those statistics.
- An example embodiment for presenting statisticsgenerates different views to provide different perspectives on, and highlight different characteristics of, the underlying data. The views provide elegant visualizations that represent the data in forms that are easy to understand.
- the example embodimentcan provide a number of technical advantages.
- the embodimentprovides a system and method which present a unified data presentation such as radial view that accommodates a category parameter, a measure parameter, and one or more additional or supplementary parameters.
- the example embodimentalso provides a system and method which presents an easily understood, interactive, graphical representation of information flow, such as a flow view.
- the example embodimentprovides the further benefit of a user interface which allows users to readily swap between various view types, such as radial views and flow views.
- a radial graphrepresents statistics involving a category parameter, a measure parameter, and a time parameter, with different radii used for different wedges to clearly illustrate even small changes in the measure parameter for different periods of time.
- flow viewscan be used to illustrate the flow of information through various units of an organization, they are easy to understand, and they include mechanisms which allow users to compare information flow with respect to entities such as organizational units.
- the flow views of the example embodimentreveal further characteristics of the information, in response to user input “drilling down” on a portion or portions of the visualization. For example, a user may drill down on a particular communications path to obtain additional facts about the content of the information associated with that path.
- the example embodimentalso allows users to readily swap between various view types.
- the multiple viewsinclude a timeline view that illustrates how particular topics have waxed and waned in popularity over time and a top-topics view that displays a list of topics ranked according to importance. Additional advantages of the example embodiment include common or similar control mechanisms in the different views, which minimizes the learning curve associated with using the various views.
- the different viewsgraphically portray groupings of the e-mail messages according to various parameters, present important topics extracted from the messages, illustrate flow patterns for the messages, and/or reveal topics of conversation contained within the flow patterns.
- other sources of informationprovide the bases for the visualizations.
- the viewsalso feature controls that are easy to use and generally consistent among different view types.
- the controlsgive users the ability to interact with the views. For example, users may use the controls to explore many different aspects of the underlying data and thereby uncover additional knowledge.
- the viewsallow users to understand knowledge derived from large sets of data.
- the viewscan be used to organize and/or summarize e-mail databases that receive half a million or more new e-mail messages per day.
- the example embodimentis described in terms of a software application that provides graphical illustrations (i.e. visualizations) based on data sets.
- visualizationsi.e. visualizations
- the example applicationis constructed so that it will work in any data set, regardless of the data type or theme
- the visualizations in the example embodimentrelate to e-mail messages of a large organization.
- the example embodimentprovides visualizations that represent a set of data items corresponding to an organization's e-mail messages.
- Each of those data itemshas numerous attributes, such as message topic, message time, sender, business unit of sender, recipient, and business unit of recipient.
- each data itemmay be stored as a record with various fields of the record containing values for the various attributes.
- additional processingmay be required to resolve one or more attributes for the data items. Nevertheless, when an attribute of a data item is used in determining the characteristics of a visualization, that attribute is considered a parameter.
- a collaborative data processing environment 10provides facilities for presenting visualizations in a GUI.
- the GUIis displayed in a display device of a client data processing system 20 , which communicates with a server data processing system 22 via a presentation engine 32 .
- presentation engine 32is part of a data mining system 24 , such as that described in the 0110 Application, and presentation engine 32 uses a query manager 26 to generate the visualizations based on data/statistics obtained from a database 28 and/or a hyper data cube 30 .
- Presentation engine 32transmits views that include those visualizations to client 20 for display.
- Client 20uses a Web browser to display those views.
- the web browserreturns user input to presentation engine 32 .
- Data mining system 24may be implemented, for example, in the JAVA programming language using SUN's JAVA DEVELOPMENT KIT (JDK) version 1.3.
- the visualizationsmay be implemented using JAVASERVER PAGES (JSPs) and JAVA Servlet technology.
- JSPsJAVASERVER PAGES
- Any JSP 1.1 and Servlet 2.2 compliant application server/container, such as ALLAIRE/MACROMEDIA's JRun,may be used as the application container to host the JSPs and Servlets.
- Open source toolssuch as FLEX and JCup that aid developers in creating robust and flexible parsers in JAVA may be used to write query tools that do real-time parsing of user queries.
- a standard SQL92 and JDBC compliant database serversuch as MICROSOFT IIS Webserver 4.0 communicating with a backend MICROSOFT SQL Server 7.0 database, may be used to deploy data mining system 24 .
- Any available web servercould be used with the preceding technology to serve web pages, provided the web server allows third party JSP/Servlet application servers to connect to it to serve the dynamic pages. It will be apparent to those of ordinary skill in the art that other technologies may be used to implement data mining system 24 .
- Presentation engine 32generates different types of views to highlight different aspects of the data.
- the viewspresent a consistent front end for user interaction.
- each viewhas two major components: the visualizations and the controls (also known as interactions).
- the visualizationsprovide users with visual representations of data sets.
- the controlsmake the visualizations easy to manipulate.
- presentation engine 32uses four views: a list view, a radial graph view, a flow view, and a timeline view.
- the radial graph viewmay also be called a radial view or an aggregate view.
- Each viewfeatures a different visualization that is intuitively understandable by users and incorporates unique functionality suited to that particular view.
- Controlsallow users to manipulate the presented data. Controls may be active or passive. Active controls allow the users to directly manipulate the data.
- active controlsallow users to click, drag, and/or drill down directly on the visualizations the users see on the screen.
- Passive controlsallow users to further filter or focus the information displayed on the screen.
- Passive controlsprovide functionality such as searching, filtering, and sorting.
- presentation engine 32executes within server 22 .
- presentation engine 32transmits a default view to a user at client 20 , for example in response to the user initiating a presentation session.
- the default viewis a list view 50 .
- List view 50includes a tab 52 for each available view and a presentation space within which is presented a top-topics visualization 56 .
- Top-topics visualization 56presents a list of the ten most important topics discussed in the e-mail messages of the organization or in a particular subset of those messages.
- List view 50also includes summary fields 54 , which display summary information relating to the list of topics, and a heading field 58 , which identifies the scope that defines the subset of e-mail messages being depicted.
- summary fields 54include a counter showing the global aggregate volume of messages sent and received that day throughout the company.
- the counterreads 10,234. That is the total amount of movement on the system that day. That number is analogous to the daily stock market volume of shares traded (i.e. bought and sold).
- Summary fields 54also show the percentage change from the previous day. This is represented as a percentage. The number is preceded with either a positive or negative mark to show direction. In the example, the change in volume was up five percent from the previous day.
- Heading field 58includes to two main sections: navigation and information.
- the information sectionillustrates the current date and contains a link for help.
- the navigation sectioncontains two elements, the title and the “breadcrumbs”.
- the titleis serves as the label for the below visualization 56 .
- the title and the breadcrumbsfunction as one unit.
- the breadcrumbsact as a trail through the interface. They allow the user to see where he or she has just been, while the title shows where he or she currently is.
- the breadcrumbsallow the user to quickly move back after drilling down on a particular item. For example, a user might drill down to: “Top Emails ⁇ BU emails ⁇ Automotive emails”. The title might then read “Ford”.
- the breadcrumbsallow that user to jump anywhere up that chain.
- list view 50includes a number of passive controls 60 which allow the user to change the focus of the presentation, for example by restricting the analysis to e-mail messages relating to a particular business unit, to e-mail messages relating to a particular topic, to e-mail messages originating within a specified time range, or to e-mail messages which include terms specified in a search query.
- List view 50also includes a highlight block 62 that displays detailed information relating to the top topic or a selected topic.
- highlight block 62indicates (1) which person sent the message that is highlighted in top-topics visualization 56 , (2) how many people received that message, and (3) how many people responded to that message.
- Highlight block 62also indicates the number of auxiliary strings originating from the highlighted message. For example, if a receiver of the original message forwarded that message to another person, the forwarded message would count as an auxiliary string.
- highlight block 62includes a counter of the total amount of traffic that the first message caused.
- Top-topics visualization 56lists individual topics 63 in order of importance.
- importancecorresponds to the volume of e-mail messages relating to each topic 63 ; however, in alternative embodiments, importance is based on other characteristics of the e-mail documents, such as position of the sender within the organization, etc.
- top-topics visualization 56also identifies the sender 64 of the original e-mail relating to that topic, the date 66 of the last posting for that topic, and the largest organizational unit 68 to have received messages for that topic.
- Data mining system 24may categorize topics by organizational units within the company. By manipulating passive controls 60 to select a desired unit of the organization, the user can cause top-topics visualization 56 to focus on information unique to that unit. For example, a user who belongs to a consulting unit of his or her company might focus all results within that business unit.
- the listis organized in a tree structure, with e-mail messages grouped into topics. For example, if enough of the organization's e-mail messages discuss customer satisfaction, top-topics visualization 56 will list the topic “customer satisfaction” at the top of the list. Numerous subsidiary threads may also be aggregated into the top topic, such as threads discussing customer satisfaction with regard to particular products.
- the tree structureallows the user to control the level of depth of the information that is displayed in the list.
- the active controls in list view 50include drill down and roll up interaction elements.
- the topicsthemselves serve as the drill down controls.
- top-topics visualization 56modifies the displayed list to show one or more of the subsidiary threads pertaining to the selected topic. Additional threads can be nested within each of those subsidiary threads, and the user can eventually drill down to see individual e-mail messages.
- To roll up the listthe user either clicks on the first message, or uses the thread topology to move back up the hierarchy.
- presentation engine 32determines whether the user has selected a tab 52 for a different view, as indicated at block 44 . If a different view has been selected, presentation engine 32 transmits the new view to client 20 , as indicated at block 46 . Additional types of views are described in greater detail below.
- presentation engine 32determines whether the user has manipulated one of passive controls 60 . If so, presentation engine 32 updates the current view accordingly, as depicted at block 70 . For example, presentation engine 32 can modify the view to reflect data that has been filtered according to search criteria specified via passive controls 60 .
- presentation engine 32when the user interacts with passive controls 60 , that user input is relayed to presentation engine 32 by client 20 , and the new or updated views are then transmitted by presentation engine 32 back to client 20 for display to the user.
- different architecturesmay be used, including architectures in which the presentation engine resides within the same data processing system that is being operated by the user.
- presentation engine 32determines whether any active controls have been modified. If so, the view is updated accordingly, as indicated at block 74 . For example, if the user has selected a topic, that topic is expanded. Otherwise, the process returns to block 44 with presentation engine 32 awaiting user input from client 20 .
- timeline view 80includes a timeline visualization 84 with lines or curves 82 for up to three e-mail topics. Lines 82 depict how the volume of information relating to each topic has changed over time. Timeline view 80 thus allows users to see how the popularity of selected topics has changed over time.
- Timeline view 80also includes active controls implemented as control points 88 on the highs and lows of each of lines 82 . Selecting control points 88 allows the user to quickly drill down to important times in a topic's history. When the user elects to drill down, by clicking on a control point, a top-topics visualization 89 will display the message or string which has the most volume at the selected point on the curve.
- timeline visualization 84is displayed in an upper portion of a presentation space 86
- top-topics visualization 89is displayed in a lower portion of presentation space 86 .
- Userscan select the topics to be graphed in timeline visualization 84 by selecting topics in top-topics visualization 89 or through a passive control such as the key word search filter.
- Radial view 100includes a radial graph 101 , passive controls 102 , and a highlight block 104 . Passive controls 102 and highlight block 104 are generally the same as or similar to the corresponding parts of the other types views.
- Radial graph 101may also be called a radial visualization or radial graph visualization.
- FIGS. 6A-6Fdepict an illustrative evolution from a standard pie chart 105 to a radial graph 115 according to the present invention.
- pie chart 105merely slices a circle into wedges that correspond to categories. Each wedge has a radial width 107 that reflects a measure for the corresponding category relative to an aggregate measure for all of the categories.
- Pie chart 105therefore accommodates, and provides information about, no more than two parameters: category and measure.
- pie chart 105reflects the categories involved and reflects the measure for each category as a percentage of the aggregate measure. For example, if a chart represents a total of $100 in spending for various categories, and one wedge represent $25 in spending for one of the categories, that wedge would have a radial width of 90 degrees.
- radial graph 115uses wedges to show categories and uses radial widths to reflect corresponding measures.
- an example radial graphalso includes a focal point 106 , as highlighted in FIG. 6B .
- Focal point 106defines how the information in the radial graph is to be categorized into wedges.
- the radial graphmay be categorized according to topic, business unit, person, etc.
- radial graph 101is focused on the business unit category, and the underlying data items relates to e-mail messages.
- each wedgecorresponds to a business unit, and the radial width of each wedge reflects the total amount of e-mail associated with the corresponding business unit.
- the radial width of the wedge 113 for the marketing departmentrepresents a count of e-mail messages having the value “Marketing Department” as a category attribute.
- the wedgesthus represent a grouping of a set of e-mail messages into multiple subsets, based on the category parameter.
- presentation engine 32would include information in the visualization that is important to that person.
- a personmay have a profile with attributes including the following: name: Jim Smith; title: Manager of Digital Marketing; Current project: Corporate Website Redesign; Team: Jane Doe, Bill Smith, John Ryan.
- radial graph 101ranks information associated with Jim's profile attributes, such as messages from the team members, closer to the center of the radial plot. This allows Jim Smith to quickly get to information that is important to his current state of affairs. Additionally, Jim might key sonar to look specifically for information about the corporate Website, perhaps to see if people are talking about that Website. Radial graph 101 would then prioritize that information in the stack rank.
- the radial widths for the wedgesare determined by reference to the data set which includes all e-mail messages in data mining system 24 , without regard to the time attributes of those messages.
- the radial widthsthus depict a baseline ratio of message traffic for each business unit, relative to an aggregate amount of traffic for all business units.
- the message subsets for the individual wedgesare therefore referred to as base subsets.
- radial graphs 101 and 115also feature a ring 110 which depicts a normalized measure of e-mail traffic.
- the radius 109 of ring 110 in FIG. 6Erepresents the average total volume of e-mail traffic for each business unit. Ring radius 109 thus represents a normalized measure for each base subset.
- ring 110is a perfect circle, the actual value corresponding to each point on ring 110 depends on the radial wedge associated with that point. Specifically, ring 110 is normalized against each individual radial wedge. This way, a user can determine, at a quick glance, which wedges fall below and above their normal values on a particular day/week/month.
- each wedgehas its own individual radius 111 , and each such wedge radius represents the volume of e-mail for that wedge within a predetermined timeframe.
- the radial graphsthus also accommodate a time parameter, and users can easily compare the radii for the wedges (e.g. wedge radius 111 ) with ring radius 109 to determine the degree to which e-mail traffic for the predetermined timeframe differs from the baseline e-mail traffic.
- the default timeframeis the preceding week
- presentation engine 32therefore determines the radius for each wedge by reference only to e-mail messages for that week.
- the wedgesare associated with base subsets of messages for purposes of determining radial widths.
- each wedge radiusrepresents a subset of the corresponding base subset, with messages from the base subset filtered out if the time attributes of those messages do not fall within the preceding week. Since the data items are filtered according to a time parameter to determine the wedge radii, the subsets represented by the wedge radii are referred to as temporal subsets.
- the difference between the radius 109 of ring 110 and the radius 111 of each wedgeillustrates how the volume of e-mail traffic in the last week for the corresponding business unit compares to the normalized volume.
- a particular radial graphmay represent the total e-mails sent on a specified day by different business units, with each wedge representing one business unit.
- the ring radiusmay represent the value “seventy-five e-mails sent per day” for one business unit, and if the wedge radius for that business unit falls inside the ring radius, the user can tell that the volume of e-mail on the specified day falls significantly below the seventy-five-e-mails-per-day average (e.g. fifty e-mails).
- the ring radius at a wedge for a second business unitcan actually correspond to an average of three hundred e-mails per day for the second business unit. Accordingly, if the wedge radius for the second business unit extends beyond the ring radius, the user can tell that the volume on the specified day exceeds the three-hundred-e-mail-per-day average (e.g. three hundred and twenty-five e-mails). Thus, users could quickly gather information about the e-mail traffic for each of the business units on the specified day, versus their normal traffic.
- radial graph 101provides one or more additional sections within the wedges to depict a sub-categorization according to one or more supplementary parameters.
- two types of sectionsare used to reflect information pertaining to two additional parameters: importance and direction.
- each wedge 108is divided into four radial bands 108 C, and the bands closest to focal point 106 correspond to e-mail messages with the highest importance.
- presentation engine 32determines importance for the radial graph by reference to the time attributes of the e-mail messages, with recent messages deemed more important than older messages. In alternative embodiments, importance is determined by reference to other attributes.
- each wedge 108is split into sub-wedges 108 A and 108 B to show how much of the e-mail was sent by the business unit and how much was received by the business unit.
- Radial graphs 101 and 115thus accommodate two primary parameters (i.e. category and measure), and three supplementary parameters (i.e. time, direction and importance).
- radial graph 115provides active controls, including a control point 112 for each wedge, as highlighted in FIG. 6F .
- active controlsincluding a control point 112 for each wedge, as highlighted in FIG. 6F .
- top-topics section 114will only show information that has term.
- the visualizationwould be revised accordingly, as well. For example Financial Services might have no discussions going on about Automotive, so Financial Services would drop off of the visualization.
- the wedgesthemselves operate as active controls, in that if the user clicks on a wedge, data from that wedge is presented in top-topics section 114 .
- the user interfaceis also modified to change the color of that wedge.
- radial graph 115allows the user to select two slices to compare. For example, to compare the e-mail flow in the consulting and development units of an organization, the user selects the two wedges for those units. In response, presentation engine 32 updates list frame 114 to display data from the selected organizational units only.
- presentation engine 32re-articulates radial graph 115 based solely on the data for the two selected units. For example, line 116 in FIG. 6F depicts a user clicking and dragging between wedge control points.
- presentation engine 32reconfigures radial graph 115 to include only two wedges.
- presentation engine 32gives the ring a radius which reflects an aggregate measure for the two selected units without regard to time attributes and gives the wedges for those units radii which reflect respective measures of e-mail traffic for the predetermined timeframe.
- a usermay be looking at a plot of all the industry-aligned business units of the company. Those business units might be Auto, Computer, Financial Services, Healthcare, etc. The user might then want to compare Auto and Computer. To do so, the user could drag from a point on the wedge for Auto and a point on the wedge for Computer. In response, the entire graph would change to show only the units within Computer and Auto.
- a flow view 120includes a flow visualization 127 with a first group of objects, such as labeled push buttons or boxes 122 A, displayed in one portion of a presentation space 124 and a second group of objects, such as labeled boxes 122 B, positioned in a separate area of presentation space 124 .
- a first group of objectssuch as labeled push buttons or boxes 122 A
- a second group of objectssuch as labeled boxes 122 B
- flow view 120begins with two identical sets of objects that represent the organizational units of a company (e.g. Consulting, Development, Sales, etc.)
- the userselects an organizational unit from one of the columns, for example by clicking on the box 125 for that unit.
- presentation engine 32highlights the selected box 125 and draws connecting lines or “pipes” to boxes in the other column for the units that have sent e-mail to or received e-mail from the selected unit.
- These linesrepresent the flow of information between units.
- the thickness of each linecorresponds to the amount of e-mail that has passed between the units—the smaller the line, the smaller the aggregate flow of information.
- Presentation engine 32also allows the user to adjust the focus the presentation to see a breakdown of the flow of information between units of a company.
- the useractivates or selects a box 123 for a particular unit or a particular line, for example by rolling a mouse pointer over that box or line.
- part of the line leading to that box 123or part of the elected line, is divided into smaller lines 126 that respectively represent e-mail flow into and out of box 123 , as shown in FIGS. 7 and 8C .
- the usercan further drill down to obtain more detailed information by selecting two containers, one in each of the groups of objects 122 A and 122 B. For example, as depicted in FIG. 8D , two containers can be selected by clicking and dragging from one container to another. Presentation engine 32 responds to two containers being selected by displaying a third group of containers 122 C between the first group and second group, as depicted in FIG. 8E .
- third group 122 Crepresents a company's vertical organizational units focused on particular industries, such as auto, computer, telecom, etc. (i.e. the company's “industry verticals”). This configuration allows the user to quickly determine whether or not two horizontal units are communicating about a particular industry vertical.
- presentation engine 32may display the projects listed under Auto. If the user drills down to a project level, presentation engine 32 may display teams or individuals. The hierarchy of categories is dependant on the organizational structure of the company.
- flow view 120includes other features like those in the other views, such as passive controls 130 that include a selection box or drop-down box 129 to modify the categories used for the first, second and/or third groups of objects. For example, in the visualization pictured, if the user were to select “Development” from drop-down box 129 and click “Compare Verticals,” the graph would re-articulate to highlight Development in the right-hand side list.
- passive controls 130that include a selection box or drop-down box 129 to modify the categories used for the first, second and/or third groups of objects. For example, in the visualization pictured, if the user were to select “Development” from drop-down box 129 and click “Compare Verticals,” the graph would re-articulate to highlight Development in the right-hand side list.
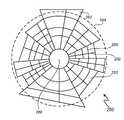
- a plane figure 280includes multiple wedges or slices 282 representing subsets of a set of data items, such as a group of documents or e-mail messages for different business units.
- Plane figure 280also features a line 284 which depicts the average quantity of documents for each of the slices.
- the distance between line 284 and a center point 286 of plane figure 280may represent the average total volume of e-mail traffic for each business unit.
- each slice 282has its own individual radius, and each such slice radius may represent the volume of e-mail for that wedge within a predetermined timeframe.
- Additional lines 290 and 292may be used to partition the interior volume of each slice into at least first and second areas to represent different subsets of documents within each slice.
- various embodiments of the present inventionrelate to visualizations that are rich in meaning yet simple to understand and to a user interface that provides a consistent window for those visualizations.
- the visualizationsare provided by components executing within one or more data processing systems, which may include, without limitation, personal computers, mini computers, mainframe computers, and distributed computing systems.
- FIG. 1depicts data mining system 24 as residing within server data processing system 22 , with input received from, and output sent to, client data processing system 20 .
- the processing resources within server data processing system 22 and client data processing system 20may include data storage, such as read only memory (ROM) 300 , random access memory (RAM) 302 , one or more hard disk drives 304 , CD-ROM drives, etc., and one or more central processing units (CPUs) 306 .
- the processing resourcesmay also include input devices 310 , such as a keyboard and a pointing device, as well as one or more network interfaces 312 , such as Ethernet ports.
- a display 322may also be provided, along with a display adapter 324 for driving display 322 .
- One or more buses 320may be used to interconnect the various processing resources.
- control logic and data constructs of data mining system 24may be stored in nonvolatile data storage, such as in the one or more hard disk drives 304 , with some or all of data mining system 24 then loaded into RAM 300 to facilitate execution on the one or more CPUs 306 .
- Data processing systems incorporating the inventionmay include, without limitation, personal computers, mini computers, mainframe computers, and distributed computing systems. Furthermore, all of the components of the data mining system need not reside on the same data processing system. Moreover, some or all of the external systems, such as the client Web browser, could reside on the same data processing system as the data mining system.
- alternative embodiments of the inventioninclude computer-usable media encoding logic such as computer instructions for performing the operations of the invention.
- Such computer-usable mediamay include, without limitation, storage media such as floppy disks, hard disks, CD-ROMs, read-only memory, and random access memory; as well as communications media such as wires, optical fibers, microwaves, radio waves, electrical signals, and other electromagnetic and/or optical carriers.
- embodiments of the radial graph and plane figure graphalso include presentations using three dimensional presentation techniques, such as shadowing and embossing. It will also be recognized by those skilled in the art that embodiments of the graphs and displays described herein may easily be adapted into three dimensional displays using the appropriate application and display technology that allows for the generation and display of three dimensional objects.
- the three dimensional displayscould also be manually manipulated to display the desired orientation. For example, graphs could be presented as spheres with conic or pyramid slices.
Landscapes
- Physics & Mathematics (AREA)
- General Physics & Mathematics (AREA)
- Engineering & Computer Science (AREA)
- Theoretical Computer Science (AREA)
- Information Retrieval, Db Structures And Fs Structures Therefor (AREA)
- User Interface Of Digital Computer (AREA)
Abstract
Description
Claims (49)
Priority Applications (1)
| Application Number | Priority Date | Filing Date | Title |
|---|---|---|---|
| US09/968,953US7692653B1 (en) | 2001-10-01 | 2001-10-01 | System and method for presenting statistics |
Applications Claiming Priority (1)
| Application Number | Priority Date | Filing Date | Title |
|---|---|---|---|
| US09/968,953US7692653B1 (en) | 2001-10-01 | 2001-10-01 | System and method for presenting statistics |
Publications (1)
| Publication Number | Publication Date |
|---|---|
| US7692653B1true US7692653B1 (en) | 2010-04-06 |
Family
ID=42061327
Family Applications (1)
| Application Number | Title | Priority Date | Filing Date |
|---|---|---|---|
| US09/968,953Expired - LifetimeUS7692653B1 (en) | 2001-10-01 | 2001-10-01 | System and method for presenting statistics |
Country Status (1)
| Country | Link |
|---|---|
| US (1) | US7692653B1 (en) |
Cited By (59)
| Publication number | Priority date | Publication date | Assignee | Title |
|---|---|---|---|---|
| US20070190499A1 (en)* | 2006-02-14 | 2007-08-16 | Advanced Development Tools Limited | Method and system for strategy development and resource management for achieving a goal |
| US20090031245A1 (en)* | 2007-07-25 | 2009-01-29 | Matthew Brezina | Method and System for Collecting and Presenting Historical Communication Data |
| US20090177754A1 (en)* | 2008-01-03 | 2009-07-09 | Xobni Corporation | Presentation of Organized Personal and Public Data Using Communication Mediums |
| US20110057928A1 (en)* | 2009-09-10 | 2011-03-10 | Fujitsu Limited | Graph creation method and graph creation device |
| US20110119338A1 (en)* | 2009-11-19 | 2011-05-19 | International Business Machines Corporation | Email composition and processing |
| US20120079430A1 (en)* | 2009-06-09 | 2012-03-29 | Kwahk Ji-Young | Method for providing a gui for searching for content, and device adoptiving same |
| US20120151399A1 (en)* | 2010-12-13 | 2012-06-14 | Microsoft Corporation | Bull's-eye multidimensional data visualization |
| US20120194520A1 (en)* | 2011-01-31 | 2012-08-02 | Ascom Network Testing Inc. | Presentation modes for radio network measurements |
| US20120229469A1 (en)* | 2010-11-08 | 2012-09-13 | Lizotte Todd E | Dynamic 3d analytic tools: a method for maintaining situational awareness during high tempo warfare or mass casualty operations |
| US8294719B1 (en)* | 2002-03-18 | 2012-10-23 | Perttunen Cary D | Graphical representation of financial information |
| US20130222406A1 (en)* | 2012-02-24 | 2013-08-29 | McCormick & Company, Incorporated. | System and method for providing flavor advisement and enhancement |
| USD690720S1 (en)* | 2012-01-05 | 2013-10-01 | Nooka Inc. | Display screen with graphical user interface for time keeping |
| USD691168S1 (en) | 2011-10-26 | 2013-10-08 | Mcafee, Inc. | Computer having graphical user interface |
| USD692451S1 (en) | 2011-10-26 | 2013-10-29 | Mcafee, Inc. | Computer having graphical user interface |
| USD693845S1 (en) | 2011-10-26 | 2013-11-19 | Mcafee, Inc. | Computer having graphical user interface |
| US20140111518A1 (en)* | 2012-10-23 | 2014-04-24 | Halliburton Energy Services, Inc. | Methods and Systems Using a Fluid Treatment Polar Graph |
| US20140129961A1 (en)* | 2012-11-07 | 2014-05-08 | Sergey Mikhailovich Zubarev | Tool for managing user task information |
| USD710863S1 (en)* | 2014-03-14 | 2014-08-12 | Nike, Inc. | Display screen with graphical user interface for athletic achievements |
| USD711420S1 (en)* | 2014-03-14 | 2014-08-19 | Nike, Inc. | Display screen with graphical user interface for athletic achievements |
| US8924956B2 (en) | 2010-02-03 | 2014-12-30 | Yahoo! Inc. | Systems and methods to identify users using an automated learning process |
| US20150040052A1 (en)* | 2013-07-31 | 2015-02-05 | Splunk Inc. | Radial graphs for visualizing data in real-time |
| USD722613S1 (en) | 2011-10-27 | 2015-02-17 | Mcafee Inc. | Computer display screen with graphical user interface |
| US8982053B2 (en) | 2010-05-27 | 2015-03-17 | Yahoo! Inc. | Presenting a new user screen in response to detection of a user motion |
| US8984074B2 (en) | 2009-07-08 | 2015-03-17 | Yahoo! Inc. | Sender-based ranking of person profiles and multi-person automatic suggestions |
| US8990323B2 (en) | 2009-07-08 | 2015-03-24 | Yahoo! Inc. | Defining a social network model implied by communications data |
| US9020938B2 (en) | 2010-02-03 | 2015-04-28 | Yahoo! Inc. | Providing profile information using servers |
| US9087323B2 (en) | 2009-10-14 | 2015-07-21 | Yahoo! Inc. | Systems and methods to automatically generate a signature block |
| US9275126B2 (en) | 2009-06-02 | 2016-03-01 | Yahoo! Inc. | Self populating address book |
| USD761810S1 (en)* | 2014-01-03 | 2016-07-19 | Samsung Electronics Co., Ltd. | Display screen or portion thereof with icon |
| US9424670B1 (en)* | 2016-01-15 | 2016-08-23 | International Business Machines Corporation | Interactive threshold setting for pie charts |
| US20160335787A1 (en)* | 2014-01-09 | 2016-11-17 | Hewlett Packard Enterprise Development Lp | Segmented status display |
| US9501561B2 (en) | 2010-06-02 | 2016-11-22 | Yahoo! Inc. | Personalizing an online service based on data collected for a user of a computing device |
| US9514466B2 (en) | 2009-11-16 | 2016-12-06 | Yahoo! Inc. | Collecting and presenting data including links from communications sent to or from a user |
| US9685158B2 (en) | 2010-06-02 | 2017-06-20 | Yahoo! Inc. | Systems and methods to present voice message information to a user of a computing device |
| US9721228B2 (en) | 2009-07-08 | 2017-08-01 | Yahoo! Inc. | Locally hosting a social network using social data stored on a user's computer |
| US9747583B2 (en) | 2011-06-30 | 2017-08-29 | Yahoo Holdings, Inc. | Presenting entity profile information to a user of a computing device |
| US9760866B2 (en) | 2009-12-15 | 2017-09-12 | Yahoo Holdings, Inc. | Systems and methods to provide server side profile information |
| US9819765B2 (en) | 2009-07-08 | 2017-11-14 | Yahoo Holdings, Inc. | Systems and methods to provide assistance during user input |
| USD810111S1 (en)* | 2016-09-08 | 2018-02-13 | Sap Se | Electronic display screen with a graphical user interface |
| US10013672B2 (en) | 2012-11-02 | 2018-07-03 | Oath Inc. | Address extraction from a communication |
| US10078819B2 (en) | 2011-06-21 | 2018-09-18 | Oath Inc. | Presenting favorite contacts information to a user of a computing device |
| USD835148S1 (en)* | 2014-03-04 | 2018-12-04 | Google Llc | Mobile computing device with a graphical user interface with schematic representation of geographic locations |
| US10192200B2 (en) | 2012-12-04 | 2019-01-29 | Oath Inc. | Classifying a portion of user contact data into local contacts |
| USD870142S1 (en)* | 2017-12-29 | 2019-12-17 | Leica Biosystems Imaging, Inc. | Digital pathology apparatus display screen with graphical user interface |
| US20200026500A1 (en)* | 2018-07-18 | 2020-01-23 | Sap Se | Visual facet components |
| US20200133451A1 (en)* | 2018-10-25 | 2020-04-30 | Autodesk, Inc. | Techniques for analyzing the proficiency of users of software applications |
| USD890770S1 (en)* | 2017-06-23 | 2020-07-21 | Genoscreen | Display screen or portion thereof with graphical user interface |
| USD901520S1 (en)* | 2017-06-02 | 2020-11-10 | Life Technologies Corporation | Electrophoresis and imaging system display screen with graphical user interface |
| US10977285B2 (en) | 2012-03-28 | 2021-04-13 | Verizon Media Inc. | Using observations of a person to determine if data corresponds to the person |
| USD916887S1 (en)* | 2014-09-03 | 2021-04-20 | Rockwell Collins, Inc. | Avionics display screen with animated computer icon |
| USD930656S1 (en)* | 2017-06-02 | 2021-09-14 | Raytheon Company | Display screen with graphical user interface for accessing cluster information |
| USD956073S1 (en)* | 2019-02-22 | 2022-06-28 | Fundlab Technologies Inc. | Display screen or portion thereof with graphical user interface for an investment tool |
| USD959448S1 (en)* | 2020-04-09 | 2022-08-02 | Palantir Technologies Inc. | Display screen or portion thereof with graphical user interface |
| US20230153347A1 (en)* | 2011-07-05 | 2023-05-18 | Michael Stewart Shunock | System and method for annotating images |
| USD998642S1 (en)* | 2021-12-02 | 2023-09-12 | PassiveLogic, Inc. | Display screen or portion thereof with a graphical user interface |
| USD998643S1 (en)* | 2021-12-02 | 2023-09-12 | PassiveLogic, Inc. | Display screen or portion thereof with a graphical user interface |
| USD998641S1 (en)* | 2021-12-02 | 2023-09-12 | PassiveLogic, Inc. | Display screen or portion thereof with a graphical user interface |
| USD1034670S1 (en)* | 2022-08-25 | 2024-07-09 | EMOCOG Co., Ltd. | Display screen or portion thereof with graphical user interface |
| US12113873B2 (en) | 2019-11-15 | 2024-10-08 | Autodesk, Inc. | Techniques for analyzing the proficiency of users of software applications in real-time |
Citations (29)
| Publication number | Priority date | Publication date | Assignee | Title |
|---|---|---|---|---|
| US3736411A (en)* | 1971-05-17 | 1973-05-29 | Atomic Energy Commission | Graphics display system |
| US4616262A (en)* | 1983-11-14 | 1986-10-07 | Dainippon Ink And Chemicals, Incorporated | Method and apparatus for forming a combined image signal |
| US5236193A (en)* | 1992-11-27 | 1993-08-17 | Ierulli Anthony F | Black hole board game |
| US5333244A (en)* | 1990-11-29 | 1994-07-26 | Hitachi, Ltd. | Method of and system for displaying a scalar quantity distribution |
| US5442741A (en)* | 1991-11-13 | 1995-08-15 | Hewlett-Packard Company | Method for displaying pie chart information on a computer screen |
| US5491779A (en) | 1992-04-03 | 1996-02-13 | Bezjian; Richard D. | Three dimensional presentation of multiple data sets in unitary format with pie charts |
| US5557716A (en)* | 1992-07-02 | 1996-09-17 | Canon Kabushiki Kaisha | Graph drawing |
| US5559527A (en)* | 1993-03-01 | 1996-09-24 | Motorola, Inc. | Method and apparatus for displaying performance metrics in a communication system |
| JPH099104A (en)* | 1995-06-21 | 1997-01-10 | Sony Electron Inc | Soft clamping device and soft clamping method |
| JPH10208068A (en)* | 1997-01-22 | 1998-08-07 | R Andei Kk | How to create a ring graph |
| US5798760A (en)* | 1995-06-07 | 1998-08-25 | Vayda; Mark | Radial graphical menuing system with concentric region menuing |
| US5844572A (en)* | 1995-06-07 | 1998-12-01 | Binaryblitz | Method and apparatus for data alteration by manipulation of representational graphs |
| US5960381A (en)* | 1998-07-07 | 1999-09-28 | Johnson Controls Technology Company | Starfield display of control system diagnostic information |
| US5986673A (en)* | 1997-10-17 | 1999-11-16 | Martz; David R. | Method for relational ordering and displaying multidimensional data |
| US6023261A (en)* | 1997-04-01 | 2000-02-08 | Konami Co., Ltd. | Translucent-image display apparatus, translucent-image display method, and pre-recorded and computer-readable storage medium |
| CH690517A5 (en)* | 1996-05-22 | 2000-09-29 | Modolo Dino | Analogue watch with telephone information includes colored rings indicating specific telephone tariff applicable at times during day |
| US6201550B1 (en)* | 1997-06-30 | 2001-03-13 | Fuji Xerox Co., Ltd. | Image forming apparatus and method of generating gradation pattern |
| US6320586B1 (en)* | 1998-11-04 | 2001-11-20 | Sap Aktiengesellschaft | System an method for the visual display of data in an interactive split pie chart |
| US6326962B1 (en)* | 1996-12-23 | 2001-12-04 | Doubleagent Llc | Graphic user interface for database system |
| US6343508B1 (en)* | 1997-07-25 | 2002-02-05 | Zellweger Luwa Ag | Method for representing properties of elongated textile test specimens |
| US6359635B1 (en)* | 1999-02-03 | 2002-03-19 | Cary D. Perttunen | Methods, articles and apparatus for visibly representing information and for providing an input interface |
| US20020054040A1 (en)* | 2000-02-18 | 2002-05-09 | Moshal David Clive | System for graphical representation of real-time data |
| US6390508B2 (en)* | 1997-12-31 | 2002-05-21 | Matthew Levine | Method of producing a customized chart |
| US20020063719A1 (en)* | 2000-11-29 | 2002-05-30 | Ziobro James M. | Intelligent color to texture converter |
| US20020122072A1 (en)* | 1999-04-09 | 2002-09-05 | Edwin J. Selker | Pie menu graphical user interface |
| US6448987B1 (en)* | 1998-04-03 | 2002-09-10 | Intertainer, Inc. | Graphic user interface for a digital content delivery system using circular menus |
| US6577319B1 (en)* | 1998-09-18 | 2003-06-10 | Sharp Kabushiki Kaisha | Method for controlling data display |
| US20040001608A1 (en)* | 1993-11-18 | 2004-01-01 | Rhoads Geoffrey B. | Image processor and image processing method |
| US20050078111A1 (en)* | 2000-07-05 | 2005-04-14 | Cardno Andrew J. | Data visualisation system and method |
- 2001
- 2001-10-01USUS09/968,953patent/US7692653B1/ennot_activeExpired - Lifetime
Patent Citations (30)
| Publication number | Priority date | Publication date | Assignee | Title |
|---|---|---|---|---|
| US3736411A (en)* | 1971-05-17 | 1973-05-29 | Atomic Energy Commission | Graphics display system |
| US4616262A (en)* | 1983-11-14 | 1986-10-07 | Dainippon Ink And Chemicals, Incorporated | Method and apparatus for forming a combined image signal |
| US5333244A (en)* | 1990-11-29 | 1994-07-26 | Hitachi, Ltd. | Method of and system for displaying a scalar quantity distribution |
| US5442741A (en)* | 1991-11-13 | 1995-08-15 | Hewlett-Packard Company | Method for displaying pie chart information on a computer screen |
| US5491779A (en) | 1992-04-03 | 1996-02-13 | Bezjian; Richard D. | Three dimensional presentation of multiple data sets in unitary format with pie charts |
| US5557716A (en)* | 1992-07-02 | 1996-09-17 | Canon Kabushiki Kaisha | Graph drawing |
| US5236193A (en)* | 1992-11-27 | 1993-08-17 | Ierulli Anthony F | Black hole board game |
| US5559527A (en)* | 1993-03-01 | 1996-09-24 | Motorola, Inc. | Method and apparatus for displaying performance metrics in a communication system |
| US20040001608A1 (en)* | 1993-11-18 | 2004-01-01 | Rhoads Geoffrey B. | Image processor and image processing method |
| US5798760A (en)* | 1995-06-07 | 1998-08-25 | Vayda; Mark | Radial graphical menuing system with concentric region menuing |
| US5844572A (en)* | 1995-06-07 | 1998-12-01 | Binaryblitz | Method and apparatus for data alteration by manipulation of representational graphs |
| JPH099104A (en)* | 1995-06-21 | 1997-01-10 | Sony Electron Inc | Soft clamping device and soft clamping method |
| CH690517A5 (en)* | 1996-05-22 | 2000-09-29 | Modolo Dino | Analogue watch with telephone information includes colored rings indicating specific telephone tariff applicable at times during day |
| US6326962B1 (en)* | 1996-12-23 | 2001-12-04 | Doubleagent Llc | Graphic user interface for database system |
| JPH10208068A (en)* | 1997-01-22 | 1998-08-07 | R Andei Kk | How to create a ring graph |
| US6023261A (en)* | 1997-04-01 | 2000-02-08 | Konami Co., Ltd. | Translucent-image display apparatus, translucent-image display method, and pre-recorded and computer-readable storage medium |
| US6201550B1 (en)* | 1997-06-30 | 2001-03-13 | Fuji Xerox Co., Ltd. | Image forming apparatus and method of generating gradation pattern |
| US6343508B1 (en)* | 1997-07-25 | 2002-02-05 | Zellweger Luwa Ag | Method for representing properties of elongated textile test specimens |
| US5986673A (en)* | 1997-10-17 | 1999-11-16 | Martz; David R. | Method for relational ordering and displaying multidimensional data |
| US6390508B2 (en)* | 1997-12-31 | 2002-05-21 | Matthew Levine | Method of producing a customized chart |
| US6448987B1 (en)* | 1998-04-03 | 2002-09-10 | Intertainer, Inc. | Graphic user interface for a digital content delivery system using circular menus |
| US5960381A (en)* | 1998-07-07 | 1999-09-28 | Johnson Controls Technology Company | Starfield display of control system diagnostic information |
| US6577319B1 (en)* | 1998-09-18 | 2003-06-10 | Sharp Kabushiki Kaisha | Method for controlling data display |
| US6320586B1 (en)* | 1998-11-04 | 2001-11-20 | Sap Aktiengesellschaft | System an method for the visual display of data in an interactive split pie chart |
| US6359635B1 (en)* | 1999-02-03 | 2002-03-19 | Cary D. Perttunen | Methods, articles and apparatus for visibly representing information and for providing an input interface |
| US20020122072A1 (en)* | 1999-04-09 | 2002-09-05 | Edwin J. Selker | Pie menu graphical user interface |
| US6549219B2 (en)* | 1999-04-09 | 2003-04-15 | International Business Machines Corporation | Pie menu graphical user interface |
| US20020054040A1 (en)* | 2000-02-18 | 2002-05-09 | Moshal David Clive | System for graphical representation of real-time data |
| US20050078111A1 (en)* | 2000-07-05 | 2005-04-14 | Cardno Andrew J. | Data visualisation system and method |
| US20020063719A1 (en)* | 2000-11-29 | 2002-05-30 | Ziobro James M. | Intelligent color to texture converter |
Non-Patent Citations (13)
| Title |
|---|
| 3-dimensional pliable surfaces: for the effective presentation of visual information ,pp. 217-226, Year of Publication: 1995.* |
| A classification of visual representations Gerald L. Lohse, Kevin Biolsi, Neff Walker, Henry H. Rueter, Dec. 1994.* |
| A graphical comparison of RISC processors Margarita Esponda, Raúl Rojas, Sep. 1992.* |
| Barbara, Daniel and Wu, Xintao, George Mason University, The Role of Approximations in Maintaining and Using Aggregate Views, IEEE Computer Society, vol. 22 No. 4, pp. 15-21, Dec. 1999. |
| Computer Visualization graphics techniques for scientific and engineering analysis, edited by Richard s. Gallagher. 1995, pp. 275-279. ISBN 0-8493-9050-8.* |
| Gray, Jim et al., DataCube: A Relational Aggregation Operator Generalizing Group-By, Cross-Tab, and Sub-Totals; Microsoft Research, Advanced Technology Division, Microsoft Corporation, pp. 1-9, obtained from internet at <http://citeseer.nj.nec.com/cache/papers2/cs/12668/ftp:zSzzSzftp.research.microsoft.comzSzpubzSztrzSztr-95-22.pdf/gray96data.pdf> (printed May 7, 2001), Feb. 5, 1995 and revised Oct. 18, 1995. |
| IBM Intelligent Miner for Text, Fact Sheet obtained from internet at <http://www-4.ibm.com/software/data/iminer/fortext/download/factsheet.pdf> 1999. |
| IBM Intelligent Miner for Text, Fact Sheet obtained from internet at 1999. |
| Interactive visualization of serial periodic data John V. Carlis, Joseph A. Konstan, Nov. 1998.* |
| Jiawei Han, Towards on-line Analytical Mining in Large Databases, 1998, Simon Fraser University, British Columbia, Canada V5A 1S6 pp. 1-11.* |
| The Trillium Control Center (Figure) obtained from Internet at <http://www.trilliumsoft.com/softwareanim.htm> printed Feb. 6, 2001. |
| The Trillium Control Center (Figure) obtained from Internet at printed Feb. 6, 2001. |
| Visualizing information spaces: Intelligent visualization and dynamic manipulation: two complementary instruments to support data exploration with GIS Gennady L. Andrienko, Natalia V. Andrienko May 1998.* |
Cited By (120)
| Publication number | Priority date | Publication date | Assignee | Title |
|---|---|---|---|---|
| US8294719B1 (en)* | 2002-03-18 | 2012-10-23 | Perttunen Cary D | Graphical representation of financial information |
| US9135659B1 (en) | 2002-03-18 | 2015-09-15 | Cary D. Perttunen | Graphical representation of financial information |
| US8659605B1 (en) | 2002-03-18 | 2014-02-25 | Cary D. Perttunen | Graphical representation of financial information |
| US8456473B1 (en) | 2002-03-18 | 2013-06-04 | Cary D. Perttunen | Graphical representation of financial information |
| US9082316B2 (en)* | 2006-02-14 | 2015-07-14 | Goalscape Software Gmbh | Method and system for strategy development and resource management for achieving a goal |
| US20070190499A1 (en)* | 2006-02-14 | 2007-08-16 | Advanced Development Tools Limited | Method and system for strategy development and resource management for achieving a goal |
| US9954963B2 (en) | 2007-07-25 | 2018-04-24 | Oath Inc. | Indexing and searching content behind links presented in a communication |
| US9596308B2 (en) | 2007-07-25 | 2017-03-14 | Yahoo! Inc. | Display of person based information including person notes |
| US9591086B2 (en) | 2007-07-25 | 2017-03-07 | Yahoo! Inc. | Display of information in electronic communications |
| US10356193B2 (en) | 2007-07-25 | 2019-07-16 | Oath Inc. | Indexing and searching content behind links presented in a communication |
| US9699258B2 (en) | 2007-07-25 | 2017-07-04 | Yahoo! Inc. | Method and system for collecting and presenting historical communication data for a mobile device |
| US9275118B2 (en)* | 2007-07-25 | 2016-03-01 | Yahoo! Inc. | Method and system for collecting and presenting historical communication data |
| US10554769B2 (en) | 2007-07-25 | 2020-02-04 | Oath Inc. | Method and system for collecting and presenting historical communication data for a mobile device |
| US20090031245A1 (en)* | 2007-07-25 | 2009-01-29 | Matthew Brezina | Method and System for Collecting and Presenting Historical Communication Data |
| US20090106415A1 (en)* | 2007-07-25 | 2009-04-23 | Matthew Brezina | Display of Person Based Information Including Person Notes |
| US11552916B2 (en) | 2007-07-25 | 2023-01-10 | Verizon Patent And Licensing Inc. | Indexing and searching content behind links presented in a communication |
| US11394679B2 (en) | 2007-07-25 | 2022-07-19 | Verizon Patent And Licensing Inc | Display of communication system usage statistics |
| US9058366B2 (en) | 2007-07-25 | 2015-06-16 | Yahoo! Inc. | Indexing and searching content behind links presented in a communication |
| US10623510B2 (en) | 2007-07-25 | 2020-04-14 | Oath Inc. | Display of person based information including person notes |
| US10958741B2 (en) | 2007-07-25 | 2021-03-23 | Verizon Media Inc. | Method and system for collecting and presenting historical communication data |
| US9716764B2 (en) | 2007-07-25 | 2017-07-25 | Yahoo! Inc. | Display of communication system usage statistics |
| US10069924B2 (en) | 2007-07-25 | 2018-09-04 | Oath Inc. | Application programming interfaces for communication systems |
| US9584343B2 (en) | 2008-01-03 | 2017-02-28 | Yahoo! Inc. | Presentation of organized personal and public data using communication mediums |
| US20090177754A1 (en)* | 2008-01-03 | 2009-07-09 | Xobni Corporation | Presentation of Organized Personal and Public Data Using Communication Mediums |
| US10200321B2 (en) | 2008-01-03 | 2019-02-05 | Oath Inc. | Presentation of organized personal and public data using communication mediums |
| US10963524B2 (en) | 2009-06-02 | 2021-03-30 | Verizon Media Inc. | Self populating address book |
| US9275126B2 (en) | 2009-06-02 | 2016-03-01 | Yahoo! Inc. | Self populating address book |
| US20120079430A1 (en)* | 2009-06-09 | 2012-03-29 | Kwahk Ji-Young | Method for providing a gui for searching for content, and device adoptiving same |
| US9159057B2 (en) | 2009-07-08 | 2015-10-13 | Yahoo! Inc. | Sender-based ranking of person profiles and multi-person automatic suggestions |
| US9721228B2 (en) | 2009-07-08 | 2017-08-01 | Yahoo! Inc. | Locally hosting a social network using social data stored on a user's computer |
| US11755995B2 (en) | 2009-07-08 | 2023-09-12 | Yahoo Assets Llc | Locally hosting a social network using social data stored on a user's computer |
| US8990323B2 (en) | 2009-07-08 | 2015-03-24 | Yahoo! Inc. | Defining a social network model implied by communications data |
| US9800679B2 (en) | 2009-07-08 | 2017-10-24 | Yahoo Holdings, Inc. | Defining a social network model implied by communications data |
| US8984074B2 (en) | 2009-07-08 | 2015-03-17 | Yahoo! Inc. | Sender-based ranking of person profiles and multi-person automatic suggestions |
| US9819765B2 (en) | 2009-07-08 | 2017-11-14 | Yahoo Holdings, Inc. | Systems and methods to provide assistance during user input |
| US8928664B2 (en)* | 2009-09-10 | 2015-01-06 | Fujitsu Limited | Graph creation method and graph creation device |
| US20110057928A1 (en)* | 2009-09-10 | 2011-03-10 | Fujitsu Limited | Graph creation method and graph creation device |
| US9087323B2 (en) | 2009-10-14 | 2015-07-21 | Yahoo! Inc. | Systems and methods to automatically generate a signature block |
| US9514466B2 (en) | 2009-11-16 | 2016-12-06 | Yahoo! Inc. | Collecting and presenting data including links from communications sent to or from a user |
| US10768787B2 (en) | 2009-11-16 | 2020-09-08 | Oath Inc. | Collecting and presenting data including links from communications sent to or from a user |
| US7979500B2 (en)* | 2009-11-19 | 2011-07-12 | International Business Machines Corporation | Email composition and processing |
| US20110119338A1 (en)* | 2009-11-19 | 2011-05-19 | International Business Machines Corporation | Email composition and processing |
| US11037106B2 (en) | 2009-12-15 | 2021-06-15 | Verizon Media Inc. | Systems and methods to provide server side profile information |
| US9760866B2 (en) | 2009-12-15 | 2017-09-12 | Yahoo Holdings, Inc. | Systems and methods to provide server side profile information |
| US9842144B2 (en) | 2010-02-03 | 2017-12-12 | Yahoo Holdings, Inc. | Presenting suggestions for user input based on client device characteristics |
| US8924956B2 (en) | 2010-02-03 | 2014-12-30 | Yahoo! Inc. | Systems and methods to identify users using an automated learning process |
| US9842145B2 (en) | 2010-02-03 | 2017-12-12 | Yahoo Holdings, Inc. | Providing profile information using servers |
| US9020938B2 (en) | 2010-02-03 | 2015-04-28 | Yahoo! Inc. | Providing profile information using servers |
| US8982053B2 (en) | 2010-05-27 | 2015-03-17 | Yahoo! Inc. | Presenting a new user screen in response to detection of a user motion |
| US9501561B2 (en) | 2010-06-02 | 2016-11-22 | Yahoo! Inc. | Personalizing an online service based on data collected for a user of a computing device |
| US10685072B2 (en) | 2010-06-02 | 2020-06-16 | Oath Inc. | Personalizing an online service based on data collected for a user of a computing device |
| US9685158B2 (en) | 2010-06-02 | 2017-06-20 | Yahoo! Inc. | Systems and methods to present voice message information to a user of a computing device |
| US9569529B2 (en) | 2010-06-02 | 2017-02-14 | Yahoo! Inc. | Personalizing an online service based on data collected for a user of a computing device |
| US9594832B2 (en) | 2010-06-02 | 2017-03-14 | Yahoo! Inc. | Personalizing an online service based on data collected for a user of a computing device |
| US20120229469A1 (en)* | 2010-11-08 | 2012-09-13 | Lizotte Todd E | Dynamic 3d analytic tools: a method for maintaining situational awareness during high tempo warfare or mass casualty operations |
| US8443293B2 (en)* | 2010-12-13 | 2013-05-14 | Microsoft Corporation | Bull's-eye multidimensional data visualization |
| US20120151399A1 (en)* | 2010-12-13 | 2012-06-14 | Microsoft Corporation | Bull's-eye multidimensional data visualization |
| US20120194520A1 (en)* | 2011-01-31 | 2012-08-02 | Ascom Network Testing Inc. | Presentation modes for radio network measurements |
| US10714091B2 (en) | 2011-06-21 | 2020-07-14 | Oath Inc. | Systems and methods to present voice message information to a user of a computing device |
| US10078819B2 (en) | 2011-06-21 | 2018-09-18 | Oath Inc. | Presenting favorite contacts information to a user of a computing device |
| US10089986B2 (en) | 2011-06-21 | 2018-10-02 | Oath Inc. | Systems and methods to present voice message information to a user of a computing device |
| US9747583B2 (en) | 2011-06-30 | 2017-08-29 | Yahoo Holdings, Inc. | Presenting entity profile information to a user of a computing device |
| US11232409B2 (en) | 2011-06-30 | 2022-01-25 | Verizon Media Inc. | Presenting entity profile information to a user of a computing device |
| US20230153347A1 (en)* | 2011-07-05 | 2023-05-18 | Michael Stewart Shunock | System and method for annotating images |
| USD692912S1 (en) | 2011-10-26 | 2013-11-05 | Mcafee, Inc. | Computer having graphical user interface |
| USD692911S1 (en) | 2011-10-26 | 2013-11-05 | Mcafee, Inc. | Computer having graphical user interface |
| USD692454S1 (en)* | 2011-10-26 | 2013-10-29 | Mcafee, Inc. | Computer having graphical user interface |
| USD692452S1 (en) | 2011-10-26 | 2013-10-29 | Mcafee, Inc. | Computer having graphical user interface |
| USD692453S1 (en) | 2011-10-26 | 2013-10-29 | Mcafee, Inc. | Computer having graphical user interface |
| USD692451S1 (en) | 2011-10-26 | 2013-10-29 | Mcafee, Inc. | Computer having graphical user interface |
| USD691168S1 (en) | 2011-10-26 | 2013-10-08 | Mcafee, Inc. | Computer having graphical user interface |
| USD693845S1 (en) | 2011-10-26 | 2013-11-19 | Mcafee, Inc. | Computer having graphical user interface |
| USD691167S1 (en) | 2011-10-26 | 2013-10-08 | Mcafee, Inc. | Computer having graphical user interface |
| USD722613S1 (en) | 2011-10-27 | 2015-02-17 | Mcafee Inc. | Computer display screen with graphical user interface |
| USD690720S1 (en)* | 2012-01-05 | 2013-10-01 | Nooka Inc. | Display screen with graphical user interface for time keeping |
| CN104994747A (en)* | 2012-02-24 | 2015-10-21 | 麦克考米克有限公司 | System and method for providing flavor advisement and enhancement |
| US9633456B2 (en)* | 2012-02-24 | 2017-04-25 | Mccormick & Company, Incorporated | System and method for providing flavor advisement and enhancement |
| CN104994747B (en)* | 2012-02-24 | 2018-11-20 | 麦克考米克有限公司 | For providing the system and method for flavor suggestion and enhancing |
| US20130235042A1 (en)* | 2012-02-24 | 2013-09-12 | Mccormick & Company, Incorporated | System and method for providing flavor advisement and enhancement |
| US20130222406A1 (en)* | 2012-02-24 | 2013-08-29 | McCormick & Company, Incorporated. | System and method for providing flavor advisement and enhancement |
| US10977285B2 (en) | 2012-03-28 | 2021-04-13 | Verizon Media Inc. | Using observations of a person to determine if data corresponds to the person |
| US9163492B2 (en)* | 2012-10-23 | 2015-10-20 | Halliburton Energy Services, Inc. | Methods and systems using a fluid treatment polar graph |
| US20140111518A1 (en)* | 2012-10-23 | 2014-04-24 | Halliburton Energy Services, Inc. | Methods and Systems Using a Fluid Treatment Polar Graph |
| US11157875B2 (en) | 2012-11-02 | 2021-10-26 | Verizon Media Inc. | Address extraction from a communication |
| US10013672B2 (en) | 2012-11-02 | 2018-07-03 | Oath Inc. | Address extraction from a communication |
| US20140129961A1 (en)* | 2012-11-07 | 2014-05-08 | Sergey Mikhailovich Zubarev | Tool for managing user task information |
| US10192200B2 (en) | 2012-12-04 | 2019-01-29 | Oath Inc. | Classifying a portion of user contact data into local contacts |
| US10838605B2 (en) | 2013-07-31 | 2020-11-17 | Splunk Inc. | Reactive graphical display of real-time values |
| US20150040052A1 (en)* | 2013-07-31 | 2015-02-05 | Splunk Inc. | Radial graphs for visualizing data in real-time |
| US10509555B2 (en) | 2013-07-31 | 2019-12-17 | Splunk Inc. | Machine data analysis in an information technology environment |
| US9921732B2 (en)* | 2013-07-31 | 2018-03-20 | Splunk Inc. | Radial graphs for visualizing data in real-time |
| USD761810S1 (en)* | 2014-01-03 | 2016-07-19 | Samsung Electronics Co., Ltd. | Display screen or portion thereof with icon |
| US20160335787A1 (en)* | 2014-01-09 | 2016-11-17 | Hewlett Packard Enterprise Development Lp | Segmented status display |
| USD835148S1 (en)* | 2014-03-04 | 2018-12-04 | Google Llc | Mobile computing device with a graphical user interface with schematic representation of geographic locations |
| USD710863S1 (en)* | 2014-03-14 | 2014-08-12 | Nike, Inc. | Display screen with graphical user interface for athletic achievements |
| USD711420S1 (en)* | 2014-03-14 | 2014-08-19 | Nike, Inc. | Display screen with graphical user interface for athletic achievements |
| USD916887S1 (en)* | 2014-09-03 | 2021-04-20 | Rockwell Collins, Inc. | Avionics display screen with animated computer icon |
| US10048849B2 (en) | 2016-01-15 | 2018-08-14 | International Business Machines Corporation | Interactive threshold setting for pie charts |
| US9424670B1 (en)* | 2016-01-15 | 2016-08-23 | International Business Machines Corporation | Interactive threshold setting for pie charts |
| US9569082B1 (en)* | 2016-01-15 | 2017-02-14 | International Business Machines Corporation | Interactive threshold setting for pie charts |
| USD810111S1 (en)* | 2016-09-08 | 2018-02-13 | Sap Se | Electronic display screen with a graphical user interface |
| USD901519S1 (en)* | 2017-06-02 | 2020-11-10 | Life Technologies Corporation | Electrophoresis and imaging system display screen with graphical user interface |
| USD901520S1 (en)* | 2017-06-02 | 2020-11-10 | Life Technologies Corporation | Electrophoresis and imaging system display screen with graphical user interface |
| USD930656S1 (en)* | 2017-06-02 | 2021-09-14 | Raytheon Company | Display screen with graphical user interface for accessing cluster information |
| USD890770S1 (en)* | 2017-06-23 | 2020-07-21 | Genoscreen | Display screen or portion thereof with graphical user interface |
| USD870142S1 (en)* | 2017-12-29 | 2019-12-17 | Leica Biosystems Imaging, Inc. | Digital pathology apparatus display screen with graphical user interface |
| US20200026500A1 (en)* | 2018-07-18 | 2020-01-23 | Sap Se | Visual facet components |
| US10732941B2 (en)* | 2018-07-18 | 2020-08-04 | Sap Se | Visual facet components |
| EP3871085A2 (en)* | 2018-10-25 | 2021-09-01 | Autodesk, Inc. | Techniques for analyzing the proficiency of users of software applications |
| US20200133451A1 (en)* | 2018-10-25 | 2020-04-30 | Autodesk, Inc. | Techniques for analyzing the proficiency of users of software applications |
| US12045918B2 (en)* | 2018-10-25 | 2024-07-23 | Autodesk, Inc. | Techniques for analyzing command usage of software applications |
| US12073494B2 (en) | 2018-10-25 | 2024-08-27 | Autodesk, Inc. | Techniques for analyzing the proficiency of users of software applications |
| USD956073S1 (en)* | 2019-02-22 | 2022-06-28 | Fundlab Technologies Inc. | Display screen or portion thereof with graphical user interface for an investment tool |
| US12113873B2 (en) | 2019-11-15 | 2024-10-08 | Autodesk, Inc. | Techniques for analyzing the proficiency of users of software applications in real-time |
| USD959448S1 (en)* | 2020-04-09 | 2022-08-02 | Palantir Technologies Inc. | Display screen or portion thereof with graphical user interface |
| USD1068791S1 (en) | 2020-04-09 | 2025-04-01 | Palantir Technologies Inc. | Display screen or portion thereof with graphical user interface |
| USD998642S1 (en)* | 2021-12-02 | 2023-09-12 | PassiveLogic, Inc. | Display screen or portion thereof with a graphical user interface |
| USD998643S1 (en)* | 2021-12-02 | 2023-09-12 | PassiveLogic, Inc. | Display screen or portion thereof with a graphical user interface |
| USD998641S1 (en)* | 2021-12-02 | 2023-09-12 | PassiveLogic, Inc. | Display screen or portion thereof with a graphical user interface |
| USD1034670S1 (en)* | 2022-08-25 | 2024-07-09 | EMOCOG Co., Ltd. | Display screen or portion thereof with graphical user interface |
Similar Documents
| Publication | Publication Date | Title |
|---|---|---|
| US7692653B1 (en) | System and method for presenting statistics | |
| US12189932B2 (en) | Methods and apparatus for managing and exchanging information using information objects | |
| US12008008B2 (en) | Contextual data visualization | |
| US20230047675A1 (en) | Relational presentation of communications and application for transaction analysis | |
| US20240273419A1 (en) | Approaches to dynamically organizing time-varying information into multi-dimensional visualizations | |
| US7343365B2 (en) | Computer system architecture for automatic context associations | |
| US9053462B2 (en) | User interface for a system and process for providing dynamic communication access and information awareness in an interactive peripheral display | |
| US8407620B2 (en) | System and process for providing dynamic communication access and information awareness in an interactive peripheral display | |
| KR101002451B1 (en) | A method of indexing and searching, a computer readable recording medium including software therefor, and a computer display rendering the search results thereby | |
| US8452818B2 (en) | Dimension-based relation graphing of documents | |
| US8370331B2 (en) | Dynamic visualization of search results on a graphical user interface | |
| US20160335345A1 (en) | Unstructured data analytics systems and methods | |
| US20080091656A1 (en) | Method and apparatus to visually present discussions for data mining purposes | |
| US20090043646A1 (en) | System and Method for the Automated Capture and Clustering of User Activities | |
| CA2475319A1 (en) | A method and apparatus to visually present discussions for data mining purposes | |
| KR20140041452A (en) | Methods for electronic document searching and graphically representing electronic document searches | |
| Khazaei et al. | Supporting academic search tasks through citation visualization and exploration | |
| Isaacs et al. | Footprints: A visual search tool that supports discovery and coverage tracking | |
| US8103660B2 (en) | Computer method and system for contextual management and awareness of persistent queries and results | |
| Chatterjee | Design research: Building human-centered system |
Legal Events
| Date | Code | Title | Description |
|---|---|---|---|
| AS | Assignment | Owner name:TRILOGY DEVELOPMENT GROUP, INC.,TEXAS Free format text:ASSIGNMENT OF ASSIGNORS INTEREST;ASSIGNORS:PETRO, JUSTIN B.;SWENSON, SAHALA T.;SHAH, AMAN H.;SIGNING DATES FROM 20011001 TO 20011002;REEL/FRAME:012387/0064 | |
| AS | Assignment | Owner name:VERSATA DEVELOPMENT GROUP, INC., TEXAS Free format text:CHANGE OF NAME;ASSIGNOR:TRILOGY DEVELOPMENT GROUP, INC.;REEL/FRAME:019035/0545 Effective date:20060703 Owner name:VERSATA DEVELOPMENT GROUP, INC.,TEXAS Free format text:CHANGE OF NAME;ASSIGNOR:TRILOGY DEVELOPMENT GROUP, INC.;REEL/FRAME:019035/0545 Effective date:20060703 | |
| STCF | Information on status: patent grant | Free format text:PATENTED CASE | |
| FPAY | Fee payment | Year of fee payment:4 | |
| MAFP | Maintenance fee payment | Free format text:PAYMENT OF MAINTENANCE FEE, 8TH YEAR, LARGE ENTITY (ORIGINAL EVENT CODE: M1552) Year of fee payment:8 | |
| MAFP | Maintenance fee payment | Free format text:PAYMENT OF MAINTENANCE FEE, 12TH YEAR, LARGE ENTITY (ORIGINAL EVENT CODE: M1553); ENTITY STATUS OF PATENT OWNER: LARGE ENTITY Year of fee payment:12 |