US7688322B2 - System and method for data visualization using a synchronous display of sequential time data and on-map planning - Google Patents
System and method for data visualization using a synchronous display of sequential time data and on-map planningDownload PDFInfo
- Publication number
- US7688322B2 US7688322B2US11/333,325US33332506AUS7688322B2US 7688322 B2US7688322 B2US 7688322B2US 33332506 AUS33332506 AUS 33332506AUS 7688322 B2US7688322 B2US 7688322B2
- Authority
- US
- United States
- Prior art keywords
- data
- elements
- time
- sequenced
- visual
- Prior art date
- Legal status (The legal status is an assumption and is not a legal conclusion. Google has not performed a legal analysis and makes no representation as to the accuracy of the status listed.)
- Expired - Fee Related, expires
Links
Images


Classifications
- G—PHYSICS
- G06—COMPUTING OR CALCULATING; COUNTING
- G06Q—INFORMATION AND COMMUNICATION TECHNOLOGY [ICT] SPECIALLY ADAPTED FOR ADMINISTRATIVE, COMMERCIAL, FINANCIAL, MANAGERIAL OR SUPERVISORY PURPOSES; SYSTEMS OR METHODS SPECIALLY ADAPTED FOR ADMINISTRATIVE, COMMERCIAL, FINANCIAL, MANAGERIAL OR SUPERVISORY PURPOSES, NOT OTHERWISE PROVIDED FOR
- G06Q10/00—Administration; Management
- G06Q10/06—Resources, workflows, human or project management; Enterprise or organisation planning; Enterprise or organisation modelling
- G—PHYSICS
- G06—COMPUTING OR CALCULATING; COUNTING
- G06Q—INFORMATION AND COMMUNICATION TECHNOLOGY [ICT] SPECIALLY ADAPTED FOR ADMINISTRATIVE, COMMERCIAL, FINANCIAL, MANAGERIAL OR SUPERVISORY PURPOSES; SYSTEMS OR METHODS SPECIALLY ADAPTED FOR ADMINISTRATIVE, COMMERCIAL, FINANCIAL, MANAGERIAL OR SUPERVISORY PURPOSES, NOT OTHERWISE PROVIDED FOR
- G06Q10/00—Administration; Management
- G06Q10/10—Office automation; Time management
- G—PHYSICS
- G06—COMPUTING OR CALCULATING; COUNTING
- G06T—IMAGE DATA PROCESSING OR GENERATION, IN GENERAL
- G06T11/00—2D [Two Dimensional] image generation
- G06T11/20—Drawing from basic elements, e.g. lines or circles
- G06T11/206—Drawing of charts or graphs
Definitions
- the present inventionrelates to the synchronized visualization of temporal and spatial data in the context of a managed process.
- a Gantt chartis a linear time series chart that aims to show the timing of tasks or activities as they occur over time.
- standard Gantt chartsdo not indicate the relationships between activities, they can be extended up on such that both timing and interdependencies between tasks can be identified.
- Standard Gantt chartsuse a fixed scale for plotting events, meaning that a particular event in a long-term plan can potentially occupy a small percentage of the chart. This makes displaying detailed information problematic.
- Interactive, computer-based Gantt chartscan employ non-linear adjustable time scales (such as fisheye views) to allow focusing on individual elements within the chart.
- time sequential chartssuch as the Gantt chart
- the chartsare abstracted away from the context in which the tasks are done.
- Tasksare not viewed with the resources who are performing the tasks together with the resources' characteristics.
- Plannersneed to change their views of the charts and look at a different displays of those properties. These views are not coordinated with respect to temporal and spatial concerns and therefore planners need to remember complex properties as they move back and forth from one display type to another. For example, sequential tasks are listed in an order in the Gantt charts, but the tasks are not listed in a synchronization order or in order of geo-located or time-located.
- time sequential chartsare static and do not portray dynamic properties such as speed, rate, duration of individual resources performing the task. Nor do they portray relative dynamics such as relative speeds, rates and durations of multiple coordinated units.
- time-by-activity sheetsused in staging and coordinating theatrical productions in order to synch lights, sound, voices, actions, and scenery. These time-by-activity sheets can be used for practical schedules, but are not suited to visualization of spatial aspects related to the sheets contents, since they fail to provide a high-level representation of task planning.
- Gantt chart(or other time sequential charts) can show when the project terminal elements (i.e. the smallest task tracked as part of the project effort) start and finish, summarize elements of the terminal elements, and display terminal element dependencies. Since the initial introduction of Gantt charts, they have become an industry standard as a key project management tool for representing the phases, tasks and activities that are scheduled as part of a project work breakdown structure or timeline of activities. Further, other methods exist to represent the tasks within a project such as a network diagram, however, such a diagram is used more to show the relationship between tasks and less on the temporal aspects of the project.
- time sequential chartssuch as the Gantt chart
- the chartscan become visually cumbersome when number of tasks becomes large and therefore the charts are best suited for planning basic tasks in a schedule in the early stages of a project.
- Another disadvantage with time sequential chartsis that computer screens can be too small for an overview of large projects, such that horizontal and vertical scrolling through the chart contents are necessary to visualize only a small portion of the chart at any one time.
- a system and methodis provided for coordinating display of synchronized spatial information and time-variant information on a visual interface as a visual representation of a multi-dimensional planned process.
- the system and methodcomprise a data store configured for storing the time-variant information, such that the data store is further configured for storing the spatial information as a plurality of data elements for representing visual elements for display in the visual representation with respect to a reference surface. Each of the visual elements is operatively coupled to at least one sequenced element of a plurality of sequenced elements.
- the system and methodalso include a synchronization module coupled to the data store and is configured for synchronizing a displayed state on the visual interface of the spatial information with a displayed state on the visual interface of the time-variant information.
- the time-variant informationincludes timeline data including at least two of the plurality of sequenced elements having overlapping time spans with respect to a common temporal reference frame, and includes a marker for facilitating navigation of the plurality of sequenced elements with respect to the common temporal reference frame. Changes in the displayed state of the time-variant information are reflected in changes to the displayed state of the spatial information.
- One aspectis a system for coordinating display of synchronized spatial information and time-variant information on a visual interface as a visual representation of a multi-dimensional planned process, the system comprising: a data store configured for storing the time-variant information, the data store further configured for storing the spatial information as a plurality of data elements for representing visual elements for display in the visual representation with respect to a reference surface, each of the visual elements operatively coupled to at least one sequenced element of a plurality of sequenced elements; and a synchronization module coupled to the data store and configured for synchronizing a displayed state on the visual interface of the spatial information with a displayed state on the visual interface of the time-variant information, the time-variant information including timeline data including at least two of the plurality of sequenced elements having overlapping time spans with respect to a common temporal reference frame and including a marker for facilitating navigation of the plurality of sequenced elements with respect to the common temporal reference frame; wherein changes in the displayed state of the time-variant information are reflected in changes
- a further aspectis a method for coordinating display of synchronized spatial information and time-variant information on a visual interface as a visual representation of a multi-dimensional planned process, the method comprising the steps of: accessing the time-variant information from a data store including timeline data including at least two of the plurality of sequenced elements having overlapping time spans with respect to a common temporal reference frame and including a marker for facilitating navigation of the plurality of sequenced elements with respect to the common temporal reference frame; accessing the spatial information from a data store including a plurality of data elements for representing visual elements for display in the visual representation with respect to a reference surface, each of the visual elements operatively coupled to at least one sequenced element of a plurality of sequenced elements; and synchronizing through use of the marker a displayed state on the visual interface of the spatial information with a displayed state on the visual interface of the time-variant information; wherein changes in the displayed state of the time-variant information are reflected in changes to the displayed state of the spatial information.
- FIG. 1is a block diagram of a visualization data processing system
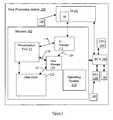
- FIG. 2shows further details of the data processing system of the system of FIG. 1 ;
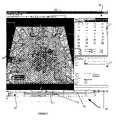
- FIG. 3shows an example display of a visual interface of the data processing system of FIG. 2 ;
- FIG. 4shows content details in a Gantt type chart of graphics data for display on the visual interface of FIG. 2 ;
- FIG. 5 ais an example embodiment of control of the timeline data of FIG. 3 ;
- FIG. 5 bis a further example embodiment of control of the timeline data of FIG. 3 ;
- FIG. 6shows a further embodiment of the timeline data of FIG. 5 ;
- FIG. 7shows further details of the tool of FIG. 1 ;
- FIG. 8shows an example of chart data of FIG. 1 ;
- FIG. 10is an example operation of the tool of FIG. 1 ;
- FIG. 11is a further embodiment of the visual interface of FIG. 3 .
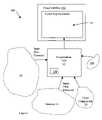
- a visualization data processing system 100includes a visualization tool 12 for processing a collection of data objects or entities/elements 14 as input data elements (e.g. geographic- or map-based) for display in a visualization representation 10 presented on a visual interface 202 .
- the visualization data processing system 100provides a means of linking a high-level temporal chart information with a visual display of tasks, actors and interactions, such that focus can be achieved while maintaining overall context.
- the visualization data processing system 100facilitates an interactive, collaborative, and real-time visualization of various managed scenarios or scripted processes (e.g. battlefield operations) that involve interconnected spatial and temporal information typical in a multi-dimensional planned process.
- the data objects 14can represent multiple events, resources and actors, which are combined by the tool 12 with synchronized timeline data 16 and supplemental chart data 20 to generate a synchronous interactive (e.g. animated) visual representation 10 on the visual interface 202 .
- the animation of the data objects 14 in the visualization representation 10 with the animation of the timeline data 16can be used in both planning and playback of the managed scenario.
- the timeline data 16is displayed synchronously with the visualization representation 10 and can represent a plurality of overlapping time periods (sequenced elements 17 ) related to a variety of different data objects 14 .
- the chart data 20can represent detailed parameter definition(s) of data objects 14 and their interdependencies.
- the data objects 14 and chart data 20are synchronized with one another through the timeline data 16 for coordinated display in the visualization representation 10 , where changes in visual elements representing the data objects 14 and chart data 20 can be animated in the visualization representation 10 as desired.
- the tool 12is used to coordinate on-map (i.e. the visualization representation 10 ) animation and planning, including zero hour relative task starts for a generic sometime in the future plan.
- Management of the synchronized data objects 14 and the data 16 , 20can be driven by user events 109 of a user (not shown) via a user interface 108 (see FIG. 2 ), during user interaction with the visual representation 10 . It is recognized that management (including display characteristics of the timeline data 16 and the visualization representation 10 as well as corresponding data definitions) of the data objects 14 and data 16 , 20 can be facilitated through automation (or semi-automation) using predefined operating rules (e.g. stored in memory and/or a computer readable medium 46 —see FIG. 2 ) of the tool 12 , as desired.
- the timeline data 16 and the associated chart data 20are provided to the tool 12 through use of sequencing charts (e.g. Gantt-like—see FIG. 4 )), thus facilitating the generation of the interactive 3D visualization representations with tiered contexts for viewing plans, further described below.
- the data processing system 100has the user interface 108 for interacting with the tool 12 , the user interface 108 being connected to the memory 102 via a BUS 106 .
- the interface 108is coupled to a processor 104 via the BUS 106 , to interact with the user events 109 (as well as programmed events—not shown) to monitor or otherwise instruct the operation of the tool 12 via an operating system 110 .
- the user interface 108can include one or more user input devices such as but not limited to a QWERTY keyboard, a keypad, a track wheel, a stylus, a mouse, and a microphone.
- the visual interface 202is considered the user output device, such as but not limited to a computer screen display.
- the displaycan also be used as the user input device as controlled by the processor 104 .
- the data processing system 100can include the computer readable storage medium 46 coupled to the processor 104 for providing operating instructions to the processor 104 and/or the tool 12 .
- the computer readable medium 46can include hardware and/or software such as, by way of example only, magnetic disks, magnetic tape, optically readable medium such as CD/DVD ROMS, and memory cards in each case, the computer readable medium 46 may take the form of a small disk, floppy diskette, cassette, hard disk drive, solid-state memory card, or RAM provided in the memory 102 . It should be noted that the above listed example computer readable mediums 46 can be used either alone or in combination.
- the tool 12interacts via link 116 with a VI manager 112 (also known as a visualization renderer) of the system 100 for presenting the visual representation 10 on the visual interface 202 , along with visual elements representing the synchronized data objects 14 , timeline data 16 and chart data 20 .
- the tool 12also interacts via link 118 with a data manager 114 of the system 100 to coordinate management of the data objects 14 and data 16 , 20 resident in the memory 102 .
- the data manager 114can receive requests for storing, retrieving, amending, or creating the objects 14 and the data 16 , 20 via the tool 12 and/or directly via link 120 from the VI manager 112 , as driven by the user events 109 and/or predefined operation of the tool 12 .
- the data objects 14 and the data 16 , 20can be stored in a data store 122 accessible by the tool 12 and data manager 114 . Accordingly, the tool 12 and managers 112 , 114 coordinate the processing of data objects 14 , data 16 , 20 and associated user events 109 with respect to the graphic content displayed on the visual interface 202 .
- timeline data 16and the visualization representation 10 (e.g. a 2D or 3D battlefield), such that navigation thought the timeline data 16 is synchronized with changes in the display of visual elements representing the data objects 14 and chart data 20 in the visualization representation 10 .
- Navigation of the timeline data 12is facilitated, for example, through use of a time marker 18 (e.g. a slider control) moved in the context of a common temporal reference frame 19 .
- the timeline data 16includes a plurality of sequenced elements 17 (e.g. tasks, process step, actions, events, resources, or other time variant processes) overlapping in time as represented by the temporal reference frame 19 , as further described below.
- the chart data 20can include components such as but not limited to various icons 13 for use in representing the data objects 14 and descriptions/definitions 15 of the various data objects 14 .
- the data objects 14can include terrain 11 or other spatial data 11 (e.g. a process flow chart).
- the data objects 14can also be used to represent routes/paths 9 shown on the terrain 11 and/or in the air above the terrain 11 , as desired.
- synchronization of multiple units 61 with respective tasks 17is shown in the timeline data 16 and on the terrain 11 of the visualization representation 10 .
- the combination of the timeline data 16 synchronized with portrayal of the data objects 14 and the chart data 20facilitates 3D representation (or 2D if desired) of a managed scenario in the visualization representation, such as but not limited to a manufacturing process, a theatrical production, a battlefield and the plans executed within, an engineering project, etc . . .
- the display of the managed scenarioe.g. visualization representation 10
- the display of the managed scenariois directly linked to the chart data 20 and data objects 14 as they in turn are synchronized in the temporal reference frame 19 via their assigned sequenced elements 17 . It is recognized that interaction by the user with the visualization representation 10 through the user interface 108 directly affects the timeline data 16 representation, and vice-versa.
- the significance of the synchronization of the visualization representation 10 and timeline data 12 contentsis that it facilitates users of the tool 12 to plan battles in a manner similar to pushing models around a physical map, while retaining the temporal aspect of outlining a battle from a project planning standpoint through use of the chart data 20 .
- the tool 12can be used to organize the highest level of plan abstraction of a selected managed scenario through Gantt chart like information (organized through the chart data 20 and timeline data 16 ) depicting the entire plan. These plans can be coordinated to a minute-by-minute resolution level, as is done in battle simulation. Operations described via the data objects 14 and data 16 , 20 may be anywhere from a few minutes up to several months, for example.
- the data 16 , 20can be manipulated according to a variable scale of the temporal reference frame 19 for plotting events and other data objects 14 , such that a selected event/data object 14 (or series events/data is objects 14 ) in a long-term plan may occupy the entire displayed timeline data 16 and visualization representation 10 .
- This selected display via the variable scale of the temporal reference frame 19facilitates drilling down for detailed information of the plan by the user of the tool 12 .
- the tool 12can also be used to fit selected tasks (e.g.
- the toolwill either fit the selected tasks in the visualization representation 10 , of if the user does not select any tasks then the tool 12 will fit all plan tasks.
- the “Fit to zoom” controlcan make it easier for the user to find all the tasks when planning across a large time span.
- a typical Gantt chart 30is shown to portray in context the timeline data 16 and chart data 20 that can be extracted, formatted, and then used as input to the tool 12 for generation of the timeline data 16 and visualization representation 10 . It is recognized that the timeline data 16 and the chart data 20 , when in the form of a Gantt chart 30 , can be converted by the tool 12 through use of a conversion module 300 and stored in the data store 122 in the required format. The stored data 16 , 20 would be for subsequent use in planning and display on the visual interface 202 as the data 16 , 20 synchronized with the corresponding visualization representation 10 .
- additional data objects 14may need to be added to the data obtained from the Gantt chart 30 to facilitate the synchronous display of the data 16 , 20 with the visualization representation 10 .
- terrain images and icons for representation of entities that implement the associated tasks represented in the data 16 , 20can be added to the data store 122 by user events 109 through use of the tool 12 , as further described below.
- the tool 12can be configured for scenario planning using representational units as the data objects 14 (user created on the terrain 11 ), or by using real units as the data objects 14 reported through a data feed (not shown) coupled to the tool 12 .
- the timeline data 16can be used to show both the sequenced elements 17 and their associated units 61 , displayed together.
- the tool 12can be configured to obtain the data 16 , 20 from the Gantt chart 30 , which in its most basic form is a bar chart used in planning and tracking by plotting the tasks/resources 32 of the project versus time 34 , thus depicting project progress in relation to time.
- the tasksare displayed as bars 36 on the timescale 34 .
- the timescale 34is a scale of major and minor time units that extends from the date the project begins to the date it ends.
- the time units for the timescale 34 , its start and end dates, and the days that considered nonworking dayscan be defined in this manner.
- the chart 30can also have vertical linkages 38 showing how the elements are sequentially inter-linked, over several tasks/resources 32 simultaneously.
- the chart 30can use graphical elements, such as bars and arrows, to represent tasks 32 and the dependencies 38 between them, and track how changes in one task 32 affect the others.
- the chart 30can also be used to group several subordinate tasks 32 under one summary task and add useful data 40 such as descriptions, required resources, and completion percentages to each task.
- the chart 30has dates for the timescale 34 , such that the number of tasks 32 associated with particular dates have duration that indicate how long tasks 32 will take.
- the chart 30can have a start date 44 on which the project (or specific task(s)) begins, a finish date 46 on which the project (or specific task(s)) ends.
- the chart 30also indicates major units of time, such as years or months, that is used in the timescale 34 .
- the chart 30also indicates minor units as the smallest unit, such as days or hours, that is used in the timescale 34 .
- the chart 30can have additional data about each task placed in specified columns 40 . For example, you can add a resource column so the chart 30 reflects who is responsible for each task.
- each task 32occupies a row in the chart 30 frame
- milestonescan be included that represent a significant event in a schedule rather than the task with the milestones duration set to zero.
- Summary tasks 32are included when you want to combine several subordinate tasks 32 under one umbrella task 32
- dependencies 38are included when one task 32 is made dependent upon another by an arrow connecting the two task bars 36 .
- the chart 30can also include data columns 40 to indicate how the project schedule is built from task-specific data.
- the data columns 40can also be used to describe complex or unique tasks, resources to list the people responsible for completing each task 32 , and percent complete to track what percentage of each task has been completed.
- the tool 12couples, through a synchronization module 302 (see FIG. 7 ), the chart data 20 and timeline data 16 with interactive 3D visualization representations 10 to provide tiered contexts for viewing managed scenarios such as battle plans.
- the tool 12employs a variable time scale on the temporal reference frame 19 , allowing users to zoom out to view an entire list of sequenced elements 17 displayed with the timeline data 16 , or zoom in on a particular section/portion of the temporal reference frame 19 to view the corresponding sequenced elements 17 included in that portion at an increased level of detail.
- the timeline data 16 and corresponding chart data 20occupy a proportionate amount of space on the visual interface 202 , thus providing for the display of a higher degree of information.
- the higher degree of informationcan include displayed information such as but not limited to: a summary task is displayed as its respective subordinate tasks, additional descriptions are displayed in the chart data 20 ; dependencies 38 (see FIG. 4 ) are displayed in the timeline data 12 ; etc . . . It is recognized that the rows of the timeline data 16 can be resized via user events 109 in order to better view overlapping tasks 17 .
- the sequenced elements 17appear on the timeline data 16 overlapping in time as labeled rectangles, for example, and occupy space proportionate to their duration in the temporal reference frame 19 .
- These rectanglescan be moved left and right through user events 109 to adjust the sequenced elements' 17 start time, or stretched from the left and right edges 42 to adjust their duration.
- the user through user events 109can group plan tasks 17 in an effort or task group (not shown) in the timeline data 16 , by dragging and viewing efforts in the timeline data 16 , in order to group tasks and units for multi-phase operations.
- the groupscan be marked and toggled on/off in the visualization interface 10 , as desired.
- the task groupcan be displayed in the timeline data 16 to help the user more easily view the plan duration (from earliest task start time to latest task end time). Further, users can drag the task group with respect to the reference frame 19 to adjust the start time for all tasks 17 at once. Further, all tasks in an effort can be shifted by right clicking on the effort in the layers panel 50 .
- the real-world timeis indicated on the temporal reference frame 19 with a marker 18 that can be moved across the temporal reference frame 19 to show the progress of time, which is synchronized with the displayed state of the data objects 14 (preferably animated) as the marker 18 is scrolled from side to side.
- a marker 18that can be moved across the temporal reference frame 19 to show the progress of time, which is synchronized with the displayed state of the data objects 14 (preferably animated) as the marker 18 is scrolled from side to side.
- the sequenced elements 17 shown to the left of the marker 18occurred in the past, while sequenced elements 17 to the right have yet to occur.
- Users of the tool 12can drag the marker 18 along the temporal reference frame 19 to view the sequenced elements 17 that occurred in the past or that have yet to occur. Doing so updates the animations of the data objects 14 , associated with the sequenced elements 17 , in the 3D visualization representation 10 .
- a timeline module 304(see FIG. 7 ). For example, when associating a battlefield unit (e.g. data object 14 ) with a task (e.g. sequenced element 17 ), the battlefield unit will appear as a new label entry in the timeline data 16 displayed on the visual interface 202 (e.g. a new rectangle appears with the name of the corresponding battlefield unit).
- the current task, as well as any future tasks applied to the battlefield unitoccupies a respective time span with respect to the temporal reference frame 19 .
- the default time span for the taskcan be set by stretching an arrow 44 at the end on the right side of the time marker 18 .
- r-click optionse.g. user events 109
- the time marker 18 and temporal reference frame 19can be used to position the marker 18 , as desired. For example, fitting a task on the timeline data 16 by r-clicking on it on the terrain 11 and r-click options on the timeline data 16 make it easier to manipulate the time slider/marker 18 .
- the timeline module 304can adjust the display of a time slider portion/bar 46 of the timeline data 16 in respect to user events 109 .
- moving the time marker 18causes the battlefield unit's tasks (i.e. sequenced elements 17 ) to become superimposed over the time slider bar 46 and the actual task line becomes highlighted.
- the visual element representing the data objects 14can be outlined in the visualization representation 10 to more easily identify the visual element in the scene (e.g. on the terrain 11 ).
- a bounding box 48can be displayed to help indicate all sequenced elements 17 associated with the selected battlefield unit(s), such that the box 48 contains the associated sequenced elements 17 . This association can free the user from having to sort through several lines of tasks to find the one that is relevant to the battlefield unit. It should be noted that context of all sequenced elements 17 in the displayed timeline data 16 can be maintained, as the sequenced element 17 displayed in the box 48 is still displayed with all other overlapping sequenced elements 17 , as shown by example with the “fire 7 ” task of FIG. 6 .
- time spans of the respective sequenced elements 17can be stretched and slid along the timeline to occupy a set time region through manipulation of the ends 42 .
- Multiple sequenced elements 17can be selected in the timeline data 16 and updated simultaneously by the module 304 , thus helping to reduce alignment errors.
- Timingcan also be precisely adjusted by modifying values 48 in an element's properties pane 50 (see FIG. 8 ), as displayed on the VI 202 (see FIG. 1 as well).
- the user of the tool 12can set the altitude of a battlefield unit (or other data object 14 ) in the properties panel 50 and see the corresponding visual element of the battlefield unit displayed at the proper altitude in the visualization representation 10 .
- air corridorscan be used as maneuver routes over the terrain 11 , such that the respective unit will animate along the route in 3D by following the altitude.
- the properties panel 50can be used to facilitate editing of task and unit properties, including such as but not limited to: label; task type; status; and time start/end. Editing of the timeline data 16 can be used to adjust time start/end, duration, and unit speed.
- the module 304can be used to update the display of the pane 50 and corresponding values 48 , where the pane 50 can display properties for one or more sequenced elements 17 .
- the pane 50can display only those sequenced element(s) 17 selected, the pane 50 can display the properties of all sequenced elements 17 shown in the timeline data 16 contained within the temporal reference frame 19 (shown in the bar 46 ), the pane 50 can display the properties of any sequenced element(s) 17 not shown in the timeline data 16 contained within the temporal reference frame 19 (shown in the bar 46 ), or a combination thereof. Double-clicking on the task in the timeline data 16 can also prompt the user to set the start and end times, as desired.
- the display of the timeline data 16can be simplified by selectively removing (or adding) the battlefield units from the timeline data 16 that the user is not interested in. These tasks will still execute in the visualization representation 10 as the time marker 18 is manipulated along the temporal reference frame 19 , but visual cluttering of the timeline data 16 for plan adjustment can be managed.
- the tool 12uses a custom 3D engine 52 (in conjunction with the VI manager 112 —see FIG. 2 ) for rendering highly accurate models of real-world terrain 11 , for example, which are texture mapped with actual map and landsat data.
- Thisprovides users with a realistic environment for planning operations. Users can use the I/O 108 to pan and rotate around the terrain 11 and zoom in and out to view varying amounts of space.
- Accurate models of military equipmente.g. data objects 14
- the tool 12can be adapted for real-time use with several users on multiple systems 100 , all connected via a common network (not shown). All users may view and interact with the same shared displayed visualization representation 10 and timeline data 16 , where changes in the data 16 (or chart data 20 where appropriate) made by one user are propagated through to all other users and displayed.
- This multi-user environmentallows for collaborative planning sessions to include team members in disparate regions, including using real units and their chart data 20 parameters reported through a data feed coupled to the tool 12 .
- the tool 12can be used collaboratively (i.e.
- tow or more networked tools 12can be used by their respective users to collaborate on plans, such that two or more people at different locations (and/or different times) can jointly construct and edit the plan.
- the tool 12has dynamic animated sequenced element modules 120 including such as but not limited to: lay out units module 306 ; create tasks module 308 ; associate units with tasks module 310 ; create paths for navigable tasks module 312 ; and adjust task timing and duration on the timeline module 314 .
- the modules 120interact with the managers 112 , 114 via the user events 109 to coordinate persistence and display of the database 122 contents (data 16 , 20 ).
- the following modules 120are described using a battlefield example, by way of example only, where it is recognized that other appropriate modules 120 could be defined or other wise adapted in the tool 12 to manage other types of managed scenarios as desired.
- the tool 12can also resize rows of the timeline data 16 to facilitate viewing details of the visible sequenced elements 17 .
- battlefield unitsare the entities that participate in the theatre of operations, such as infantry, brigades, divisions, etc.
- battlefield units placement on the 3D terrain 10is done by the module 306 according to where the battlefield units appear in the real world.
- the battlefield unitsare represented by icons on the visualization representation 10 , determined by military symbology, but may be toggled to 3D icons by the module 306 that accurately depict their shape and other descriptive physical characteristics.
- Battlefield unitsare also colored by the module 306 in accordance to their friend/foe status. Once placed on the terrain, the battlefield units may be freely moved around or removed in conjunction with the synchronized timeline data 16 .
- Tasksare common operations that battlefield units can perform, including maneuvers, fire tasks, effects, decisive points, intelligence reconnaissance, and support. Tasks are created using the module 308 through the use of a context menu via events 109 , generated by clicking on the terrain 11 . The tasks can appear as a representative icon on the visualization representation 10 , as well as in the timeline data 16 as desired. As with battlefield units, tasks can be freely moved about the terrain 11 during planning of the battlefield scenario.
- selecting via the module 310 of an ink tool and dragging the mouse along the terrain 11draws a path for the battlefield unit to follow, as calculated by the module 310 .
- This defined pathis associated with the task (e.g. sequenced element 17 ) and during the duration of the task, when animated, the battlefield unit will animate along the path in respect to its position at each moment in time, as represented in the timeline data 16 .
- the usercan draw an ink route (any type) on the visualization representation 10 and then drag it to the maneuver task (e.g. sequenced element 17 ) in the timeline data 16 .
- the unit coupled to the sequenced element 17will follow the assigned route. Further, it is recognized that a replacement route can be dragged to the task and the unit will follow the assigned new route, as desired.
- the module 310can also be used hide/show different routes/tasks so the user can walk through different scenarios when manipulating the marker 18 . It is recognised that the timeline data 16 and visualization representation 10 contents are synchronized with one another, such that changes to one content will be reflected in the other associated content.
- units and tasksmay be associated by using the association module 312 to drag one icon (representing data objects 14 ) on to another, thus linking the two icons.
- the ink pathis also dragged on to the task, defining the route for the battlefield unit to follow.
- These associated battlefield units and ink pathsappear as children of the task in its properties pane 50 (see FIG. 8 ).
- Bach taskmay only have one unit associated with it, as desired.
- the module 312can also be used to facilitate storing of associations done by dragging units directly to the sequenced elements 17 in the timeline data 16 .
- taskscan be dragged directly to the unit's line/row of the timeline data 16 to associate the new task with the unit.
- userscan reassign tasks to different units by dragging the selected task from one unit to another displayed in the timeline data 16 .
- the module 312can be used to coordinate the placement of units and task by such as but not limited to: drag units directly to the timeline data 16 ; assign/reassign tasks to units by dragging to a unit in the timeline data 16 ; reassign the task by ⁇ alt> dragging from one unit on in the timeline data 16 to another unit; reassign a new route to a maneuver task by dragging it to the task in the timeline data 16 ; and choose a new position for a task in the timeline data 16 by dragging the task from one spot to the next with represent to the temporal reference frame 19 .
- One-Click (or more) gesture specification/creation of taskscan be done through a gesture module 122 , wherein planned actions are provided through a one-click method for assigning a task to a battlefield unit.
- This gesture specificationenables the user to rapidly setup multiple tasks for planning by reducing the steps required and reducing the confusion inherent in associating several tasks and units, as well as the setup of multiple task components in one gesture (e.g. unit, type of task, route).
- By using the gesture module 122simply selecting a battlefield unit icon 61 (see FIG.
- the module 122also updates the corresponding task shown in the timeline data 16 (as well as the properties of the chart data 20 ) with the information inherent to the changes (e.g. drawn navigable route) in the visualization representation 10 . Therefore, association of task with the battlefield unit can be done while in conjunction with terrain 11 specifics as well as timeline considerations. It is recognized that expressive icons 61 can be used that indicate the nature of task/action, for example an icon of a missile in the visualization representation 10 would be indicative of a firing action listed in the timeline data 16
- the module 302enables plan/playback synchronization of routes and effects (e.g. sequenced elements 17 ) for multiple entities (e.g. data objects 14 ) across both time (given by timeline data 16 ) and space (portrayed in the visualization representation 10 ).
- routes and effectse.g. sequenced elements 17
- entitiese.g. data objects 14
- spaceportrayed in the visualization representation 10
- changes done by the usere.g. direct interactions
- editing the sequenced elements 17e.g. tasks
- changes in bar length of the sequenced elements 17changes by movement of the bar in time, and changes in route geometry and length will result in correspondingly displayed edits of affected visual elements in the visualization representation 10 .
- the module 302can be used to organize the data objects 14 and the data 16 , 20 into phases and alternative course of actions (COAs), such that each of the courses of action can be toggled on/off and the play back of one or more of courses of action can be done at a time.
- COAsare one unit associated with three different maneuver tasks at the same time, representing three route options.
- maneuverscan be synchronized across one or many routes of the visualization representation 10 .
- standard interactive chart data 20 adjustmentsare provided.
- the module 302can synchronize multiple maneuvers for simultaneous waypoint arrival.
- Each battlefield unitcan be given a new line/row on the timeline data 16 , with the battlefield unit's associated tasks appearing along the line/row.
- Userscan set several maneuver tasks through user events 109 to have the same end point, despite having routes of different length.
- the module 302calculates the speed at which each battlefield unit would need to travel along their respective routes in order to reach the waypoint at the same time. Travel time, distance, and speed are reported to the user, by the module 302 via the VI 202 , which can in turn be passed (via telecommunication) to real world battlefield units in the field to coordinate travel.
- multiple vehicle synchronization along a single routecan be enabled by the module 302 by allowing multiple battlefield units to use the same ink path as its navigable route. Associating multiple maneuver tasks and their battlefield units with the same ink on the visualization representation 10 helps for common maneuvers to be repeated without the user re-drawing the same route. Further, the user can select multiple sequenced elements 17 in the timeline data 16 and then adjust them all at the same time via user events 109 .
- each battlefield unitis represented by both its original icon 150 and a proxy icon 152 (see FIG. 9 ).
- the original icon 150represents the battlefield unit's last reported position in the real world, and becomes translucent throughout the animation to give a point of reference for determining the battlefield unit's course relative to its planned position.
- the proxy icon 152remains opaque during the animation, and shows what the battlefield unit's planned movement across the terrain 11 , not its actual position. Routes are not limited to just following a course across the terrain. Air paths are also supported, allowing users to draw a space for units to follow above the terrain 11 . Further, the tool 12 can perform route interpolation between maneuver tasks (e.g. can visualize the unit moving from one maneuver task to the next on the terrain 11 ).
- Displayed effectsare synchronized by the module 302 through the use of time-dependant animations in the 3D visualization representation 10 .
- the animations in the visualization representation 10update as the marker 18 reaches their respective stages in the plan.
- An effect taskcan be visualized while the time slider marker 18 is over its respective time span (represented by the duration or extent of the rectangle of the sequenced element 17 in the timeline data 16 ), thus providing for the animation to play out like a movie.
- By viewing these animations in the visualization representation 10users can see when it is safe for later tasks to enter the region that is under fire, for example.
- Each type of sequenced element 17can represent a different action that occurs on the battlefield terrain 11 , and as such, each is visualized in the visualization representation 10 in a different manner.
- maneuver taskscan cause the battlefield unit icon 61 to travel along a path 62
- fire tasksdisplay an artillery arc 64 from the battlefield unit icon 61 to a target 66 on the terrain 11 .
- a battlefield unitmay have multiple tasks associated with it. The battlefield unit can be associated with both a maneuver and fire action, resulting in the battlefield unit icon 61 moving along the path 62 while firing at the target 66 .
- the artillery arc 64would continually update throughout the animation to show the correct ballistics 68 information on the visualization representation 10 , as well as in the data 16 , 20 as desired. It is recognized that the maneuver and fire action could be represented as separate sequenced elements 17 in the timeline data 16 , or as one combined summary element as desired.
- an example operation 700 of the tool 12is shown for coordinating display of synchronized spatial information and time-variant information on the visual interface 202 as the visual representation 10 of a multi-dimensional planned process.
- the methodhas the example steps of: step 702 —access the time-variant information from the data store 122 including timeline data 16 including at least two sequenced elements 17 having overlapping time spans with respect to the common temporal reference frame 19 ; step 704 —access the spatial information from the data store 122 including a plurality of data elements 14 for representing visual elements for display in the visual representation 10 with respect to a reference surface 11 , such that each of the visual elements are operatively coupled to at least one sequenced element 17 of the sequenced elements; step 706 —synchronize through navigation of the marker 18 the display parameters for a displayed state on the visual interface 202 of the spatial information in the visualization representation 10 with the display parameters for a displayed state on the visual interface 202 of the time-variant information in the timeline data 16 , such
- the above described system 100can be used for visually planning managed scenarios to help in giving a precise, realistic means of the planning efforts to the user of the tool 12 .
- typical planning toolsuse a charting paradigm for scheduling events and actors
- the tool 12extends on this by presenting a live, visualization representation 10 of the plan synchronized with a display of the timeline data 16 .
- This synchronizationallows for easy interaction with objects in the plan, adding a geographic dimension to what is typically a temporal-only system.
- This synchronization of sequenced elements 17 through display of the timeline data 16 and visualization representation 10can be used for military planning, where both time and space are used for successful coordination of battlefield units. Users are able to coordinate the battlefield units, and also the battlefield units' effect on targets.
- the system 100provides for animated planning of coordinated battlefield units and/or tasks for actions coupled in both time and space, as displayed on visual Interface 202 (see FIG. 1 ). It is also recognized that the above-described system 100 can be used to generate separate data 16 , 20 and corresponding visualization representations 10 for different groups of activities. Further, a filter on selected set of activities by the module 302 can provide for critical activities, parent activities, or activities requiring a particular resource. Further, the system 100 can provide (using special marker fonts) a wide variety of symbols typically used in project management and decision analysis.
- the tool 12enables users to see plan entities in context by visualizing the plans being created and enacted in a 3D environment.
- planning using the tool 12can use several affordances built into the system 100 , including 1-click specification of tasks, and intuitive interaction between the data 16 , 20 and the visualization representation 10 (see FIG. 1 ).
- Planning in the tool 12includes planning such as but not limited to: dynamic animated tasks on a 3D map; directly editable timings, routes, effects and targets; one click gesture specification of complex tasks, thereby coordinating the definition of task, time, terrain and/or units though simplified user event 109 gesturing; and concurrent multiple entity synchronization of routes and effects in time and space.
Landscapes
- Engineering & Computer Science (AREA)
- Business, Economics & Management (AREA)
- Entrepreneurship & Innovation (AREA)
- Strategic Management (AREA)
- Human Resources & Organizations (AREA)
- General Physics & Mathematics (AREA)
- Physics & Mathematics (AREA)
- Theoretical Computer Science (AREA)
- Economics (AREA)
- Tourism & Hospitality (AREA)
- Operations Research (AREA)
- Quality & Reliability (AREA)
- Marketing (AREA)
- General Business, Economics & Management (AREA)
- Game Theory and Decision Science (AREA)
- Development Economics (AREA)
- Educational Administration (AREA)
- Data Mining & Analysis (AREA)
- Processing Or Creating Images (AREA)
- User Interface Of Digital Computer (AREA)
- Reinforcement Elements For Buildings (AREA)
Abstract
Description
Claims (31)
Priority Applications (1)
| Application Number | Priority Date | Filing Date | Title |
|---|---|---|---|
| US11/333,325US7688322B2 (en) | 2005-01-18 | 2006-01-18 | System and method for data visualization using a synchronous display of sequential time data and on-map planning |
Applications Claiming Priority (2)
| Application Number | Priority Date | Filing Date | Title |
|---|---|---|---|
| US64403205P | 2005-01-18 | 2005-01-18 | |
| US11/333,325US7688322B2 (en) | 2005-01-18 | 2006-01-18 | System and method for data visualization using a synchronous display of sequential time data and on-map planning |
Publications (2)
| Publication Number | Publication Date |
|---|---|
| US20060238538A1 US20060238538A1 (en) | 2006-10-26 |
| US7688322B2true US7688322B2 (en) | 2010-03-30 |
Family
ID=36123177
Family Applications (1)
| Application Number | Title | Priority Date | Filing Date |
|---|---|---|---|
| US11/333,325Expired - Fee RelatedUS7688322B2 (en) | 2005-01-18 | 2006-01-18 | System and method for data visualization using a synchronous display of sequential time data and on-map planning |
Country Status (3)
| Country | Link |
|---|---|
| US (1) | US7688322B2 (en) |
| EP (1) | EP1688878A1 (en) |
| CA (1) | CA2533148A1 (en) |
Cited By (51)
| Publication number | Priority date | Publication date | Assignee | Title |
|---|---|---|---|---|
| US20060200372A1 (en)* | 2005-03-01 | 2006-09-07 | Microsoft Corporation | Method and system for generating a timeline associated with a project schedule |
| US20070136436A1 (en)* | 2005-12-08 | 2007-06-14 | International Business Machines Corporation | Selective view synchronization for composite services delivery |
| US20070174770A1 (en)* | 2006-01-20 | 2007-07-26 | Michael John Safoutin | Time conditioned digital map and information display |
| US20070288279A1 (en)* | 2006-06-07 | 2007-12-13 | Microsoft Corporation | Entering And Using Time Ranges |
| US20080126989A1 (en)* | 2006-11-29 | 2008-05-29 | Philip Flores | Method and user interface tool for navigation through grid of scheduled items |
| US20080153600A1 (en)* | 2006-11-10 | 2008-06-26 | Bally Gaming, Inc. | Gaming system configuration change reporting |
| US20080175104A1 (en)* | 2007-01-23 | 2008-07-24 | Microsoft Corporation | Flexible electronic calendar integrating tasks and appointments |
| US20080177609A1 (en)* | 2007-01-23 | 2008-07-24 | Microsoft Corporation | Electronic calendar associating tasks and appointments |
| US20080215552A1 (en)* | 2007-03-03 | 2008-09-04 | Michael John Safoutin | Time-conditioned search engine interface with visual feedback |
| US20080295016A1 (en)* | 2007-05-25 | 2008-11-27 | Mathieu Audet | Timescale for representing information |
| US20090131144A1 (en)* | 2007-11-12 | 2009-05-21 | Bally Gaming, Inc. | Meta-option |
| US20090276715A1 (en)* | 2008-04-30 | 2009-11-05 | Bally Gaming, Inc. | User interface for managing network download and configuration tasks |
| US20090275402A1 (en)* | 2008-04-30 | 2009-11-05 | Bally Gaming, Inc. | Information distribution in gaming networks |
| US20110118857A1 (en)* | 2009-12-02 | 2011-05-19 | Eric Bodnar | Method and apparatus for automation of a programmable device |
| US20110320979A1 (en)* | 2010-06-24 | 2011-12-29 | Nokia Corporation | Method and apparatus for creating a to-do item based on selection of a function to be performed by an application |
| US20120265516A1 (en)* | 2011-04-12 | 2012-10-18 | Microsoft Corporation | Peripheral device simulation |
| US20120278123A1 (en)* | 2009-12-02 | 2012-11-01 | Houle Dale T | Method And System For Determining The Capacity Required To Complete Work During Planned Start And Finished Times |
| US8631325B1 (en) | 2013-08-09 | 2014-01-14 | Zoomdata, Inc. | Real-time data visualization of streaming data |
| US8851988B2 (en) | 2008-11-14 | 2014-10-07 | Bally Gaming, Inc. | Apparatus, method, and system to provide a multiple processor architecture for server-based gaming |
| US8870647B2 (en) | 2006-04-12 | 2014-10-28 | Bally Gaming, Inc. | Wireless gaming environment |
| US8920236B2 (en) | 2007-11-02 | 2014-12-30 | Bally Gaming, Inc. | Game related systems, methods, and articles that combine virtual and physical elements |
| US8920233B2 (en) | 2006-11-10 | 2014-12-30 | Bally Gaming, Inc. | Assignment template and assignment bundle in a gaming configuration and download system |
| US20150046856A1 (en)* | 2013-08-06 | 2015-02-12 | SmartSheet.com, Inc. | Interactive Charts For Collaborative Project Management |
| US9009592B2 (en) | 2010-06-22 | 2015-04-14 | Microsoft Technology Licensing, Llc | Population of lists and tasks from captured voice and audio content |
| US9005034B2 (en) | 2008-04-30 | 2015-04-14 | Bally Gaming, Inc. | Systems and methods for out-of-band gaming machine management |
| US9058716B2 (en) | 2011-06-06 | 2015-06-16 | Bally Gaming, Inc. | Remote game play in a wireless gaming environment |
| US9082258B2 (en) | 2006-11-13 | 2015-07-14 | Bally Gaming, Inc. | Method and system for providing download and configuration job progress tracking and display via host user interface |
| US9101820B2 (en) | 2006-11-09 | 2015-08-11 | Bally Gaming, Inc. | System, method and apparatus to produce decks for and operate games played with playing cards |
| US9111078B2 (en) | 2006-11-10 | 2015-08-18 | Bally Gaming, Inc. | Package manager service in gaming system |
| US9120007B2 (en) | 2012-01-18 | 2015-09-01 | Bally Gaming, Inc. | Network gaming architecture, gaming systems, and related methods |
| US9251276B1 (en) | 2015-02-27 | 2016-02-02 | Zoomdata, Inc. | Prioritization of retrieval and/or processing of data |
| US9275512B2 (en) | 2006-11-10 | 2016-03-01 | Bally Gaming, Inc. | Secure communications in gaming system |
| US9286194B2 (en) | 2012-04-10 | 2016-03-15 | International Business Machines Corporation | Data processing system |
| US9384251B2 (en) | 2012-04-11 | 2016-07-05 | International Business Machines Corporation | Synchronization of off-line reports and off-line mobile content packages |
| US9389909B1 (en) | 2015-04-28 | 2016-07-12 | Zoomdata, Inc. | Prioritized execution of plans for obtaining and/or processing data |
| US20160232217A1 (en)* | 2015-02-06 | 2016-08-11 | Adp, Llc | Adjustable Graphical Display System |
| US9418348B2 (en) | 2014-05-05 | 2016-08-16 | Oracle International Corporation | Automatic task assignment system |
| US9423943B2 (en) | 2014-03-07 | 2016-08-23 | Oracle International Corporation | Automatic variable zooming system for a project plan timeline |
| US20160259500A1 (en)* | 2014-12-31 | 2016-09-08 | Calendre Company | Venue and event interface |
| US9443377B2 (en) | 2008-05-30 | 2016-09-13 | Bally Gaming, Inc. | Web pages for gaming devices |
| US20160292620A1 (en)* | 2015-03-30 | 2016-10-06 | Oracle International Corporation | Visual task assignment system |
| US9466172B2 (en) | 2006-11-13 | 2016-10-11 | Bally Gaming, Inc. | Download and configuration management engine for gaming system |
| US9552334B1 (en) | 2011-05-10 | 2017-01-24 | Myplanit Inc. | Geotemporal web and mobile service system and methods |
| US9710571B2 (en) | 2014-03-07 | 2017-07-18 | Oracle International Corporation | Graphical top-down planning system |
| US9792770B2 (en) | 2012-01-18 | 2017-10-17 | Bally Gaming, Inc. | Play for fun network gaming system and method |
| US9817871B2 (en) | 2015-02-27 | 2017-11-14 | Zoomdata, Inc. | Prioritized retrieval and/or processing of data via query selection |
| US9942312B1 (en) | 2016-12-16 | 2018-04-10 | Zoomdata, Inc. | System and method for facilitating load reduction at a landing zone |
| US10192176B2 (en) | 2011-10-11 | 2019-01-29 | Microsoft Technology Licensing, Llc | Motivation of task completion and personalization of tasks and lists |
| US10643157B2 (en) | 2015-02-03 | 2020-05-05 | Oracle International Corporation | Task progress update history visualization system |
| US10692257B2 (en)* | 2016-10-28 | 2020-06-23 | Nec Corporation | Process management apparatus, process management method, and storage medium |
| US20220224587A1 (en)* | 2021-01-07 | 2022-07-14 | Servicenow, Inc. | Systems and methods for ranked visualization of events |
Families Citing this family (71)
| Publication number | Priority date | Publication date | Assignee | Title |
|---|---|---|---|---|
| US7426701B2 (en)* | 2003-09-08 | 2008-09-16 | Chrysler Llc | Interactive drill down tool |
| US7873917B2 (en)* | 2005-11-11 | 2011-01-18 | Apple Inc. | Locking relationships among parameters in computer programs |
| US8560109B1 (en)* | 2006-02-09 | 2013-10-15 | Cadence Design Systems, Inc. | Method and system for bi-directional communication between an integrated circuit (IC) layout editor and various IC pattern data viewers |
| US8560946B2 (en)* | 2006-03-22 | 2013-10-15 | Vistracks, Inc. | Timeline visualizations linked with other visualizations of data in a thin client |
| KR100852615B1 (en)* | 2006-04-27 | 2008-08-18 | 팅크웨어(주) | System and method for expressing map according to change season and topography |
| US8438646B2 (en)* | 2006-04-28 | 2013-05-07 | Disney Enterprises, Inc. | System and/or method for distributing media content |
| US7999810B1 (en)* | 2006-08-30 | 2011-08-16 | Boice Gina L | System and method for animated computer visualization of historic events |
| JP4552943B2 (en)* | 2007-01-19 | 2010-09-29 | ソニー株式会社 | Chronological table providing method, chronological table providing apparatus, and chronological table providing program |
| US20090024911A1 (en)* | 2007-01-29 | 2009-01-22 | Apple Inc. | Graph data visualization tool |
| EP1967994A1 (en)* | 2007-03-06 | 2008-09-10 | Projektkontoret I Skandinavien AB | A system for capturing project information over a network |
| GB2447672B (en) | 2007-03-21 | 2011-12-14 | Ford Global Tech Llc | Vehicle manoeuvring aids |
| US20080295007A1 (en)* | 2007-05-24 | 2008-11-27 | Microsoft Corporation | Data Visualization |
| US7765220B2 (en)* | 2007-05-24 | 2010-07-27 | Microsoft Corporation | Data relevance filtering |
| KR100989080B1 (en)* | 2007-11-22 | 2010-10-25 | 한국전자통신연구원 | Method and system for providing experiential knowledge combined with space-time information |
| US8601388B2 (en)* | 2008-01-09 | 2013-12-03 | International Business Machines Corporation | Efficiently adjusting a timeline in a time window |
| US8245153B2 (en)* | 2008-01-24 | 2012-08-14 | International Business Machines Coporation | System and method for displaying gantt charts with other project management tools |
| KR20090085335A (en)* | 2008-02-04 | 2009-08-07 | 삼성전자주식회사 | Content organization method and device |
| US8793619B2 (en)* | 2008-03-03 | 2014-07-29 | The United States Of America, As Represented By The Secretary Of The Navy | Graphical user control for multidimensional datasets |
| US8446412B2 (en)* | 2008-06-26 | 2013-05-21 | Microsoft Corporation | Static visualization of multiple-dimension data trends |
| US20100015579A1 (en)* | 2008-07-16 | 2010-01-21 | Jerry Schlabach | Cognitive amplification for contextual game-theoretic analysis of courses of action addressing physical engagements |
| US20100017740A1 (en)* | 2008-07-17 | 2010-01-21 | Microsoft Corporation | Pan and zoom control |
| CA2646117A1 (en)* | 2008-12-02 | 2010-06-02 | Oculus Info Inc. | System and method for visualizing connected temporal and spatial information as an integrated visual representation on a user interface |
| US8433998B2 (en)* | 2009-01-16 | 2013-04-30 | International Business Machines Corporation | Tool and method for annotating an event map, and collaborating using the annotated event map |
| US8601442B2 (en)* | 2009-09-30 | 2013-12-03 | Microsoft Corporation | Marker correlation of application constructs with visualizations |
| US8667533B2 (en)* | 2010-04-22 | 2014-03-04 | Microsoft Corporation | Customizing streaming content presentation |
| GB2489584A (en)* | 2011-03-29 | 2012-10-03 | Schlumberger Holdings | An immersive GUI for geological data |
| US9969428B2 (en) | 2011-04-19 | 2018-05-15 | Ford Global Technologies, Llc | Trailer backup assist system with waypoint selection |
| US9500497B2 (en)* | 2011-04-19 | 2016-11-22 | Ford Global Technologies, Llc | System and method of inputting an intended backing path |
| US9555832B2 (en) | 2011-04-19 | 2017-01-31 | Ford Global Technologies, Llc | Display system utilizing vehicle and trailer dynamics |
| US9926008B2 (en) | 2011-04-19 | 2018-03-27 | Ford Global Technologies, Llc | Trailer backup assist system with waypoint selection |
| US9506774B2 (en)* | 2011-04-19 | 2016-11-29 | Ford Global Technologies, Llc | Method of inputting a path for a vehicle and trailer |
| US9854209B2 (en) | 2011-04-19 | 2017-12-26 | Ford Global Technologies, Llc | Display system utilizing vehicle and trailer dynamics |
| JP2013042309A (en)* | 2011-08-12 | 2013-02-28 | Sony Corp | Time line operation control device, time line operation control method, program and image processor |
| US8700612B2 (en)* | 2011-08-23 | 2014-04-15 | Contextu, Inc. | Knowledge matrix utilizing systematic contextual links |
| US9123030B2 (en) | 2012-07-30 | 2015-09-01 | Sap Se | Indication of off-screen calendar objects |
| US9658672B2 (en)* | 2012-07-30 | 2017-05-23 | Sap Se | Business object representations and detail boxes display |
| US9483086B2 (en) | 2012-07-30 | 2016-11-01 | Sap Se | Business object detail display |
| US8832583B2 (en) | 2012-08-31 | 2014-09-09 | Sap Se | Visualizing entries in a calendar using the third dimension |
| US9081466B2 (en) | 2012-09-10 | 2015-07-14 | Sap Se | Dynamic chart control that triggers dynamic contextual actions |
| US9250781B2 (en) | 2012-10-17 | 2016-02-02 | Sap Se | Method and device for navigating time and timescale using movements |
| US8972883B2 (en) | 2012-10-19 | 2015-03-03 | Sap Se | Method and device for display time and timescale reset |
| US20140210734A1 (en)* | 2013-01-29 | 2014-07-31 | Smart Technologies Ulc | Method for conducting a collaborative event and system employing same |
| US9592851B2 (en) | 2013-02-04 | 2017-03-14 | Ford Global Technologies, Llc | Control modes for a trailer backup assist system |
| US9511799B2 (en) | 2013-02-04 | 2016-12-06 | Ford Global Technologies, Llc | Object avoidance for a trailer backup assist system |
| US9632673B1 (en)* | 2013-06-14 | 2017-04-25 | Telos Corporation | Cyber domain visualization systems and methods |
| JP6287018B2 (en)* | 2013-10-04 | 2018-03-07 | 富士通株式会社 | Visualization method, display method, information processing apparatus, visualization program, and display program |
| JP6209959B2 (en)* | 2013-12-03 | 2017-10-11 | 富士通株式会社 | Display method, display device, and display program |
| US20150160838A1 (en)* | 2013-12-06 | 2015-06-11 | Takeshi SHIRABE | Method and apparatus for automatic graphic editing with map-dependent constraints |
| TWI539331B (en)* | 2014-03-03 | 2016-06-21 | 宏碁股份有限公司 | Electronic device and user interface control method |
| US9533683B2 (en) | 2014-12-05 | 2017-01-03 | Ford Global Technologies, Llc | Sensor failure mitigation system and mode management |
| US9522677B2 (en) | 2014-12-05 | 2016-12-20 | Ford Global Technologies, Llc | Mitigation of input device failure and mode management |
| US10387834B2 (en)* | 2015-01-21 | 2019-08-20 | Palantir Technologies Inc. | Systems and methods for accessing and storing snapshots of a remote application in a document |
| US11021949B2 (en)* | 2015-05-13 | 2021-06-01 | Halliburton Energy Services, Inc. | Timeline visualization of events for monitoring well site drilling operations |
| WO2017044108A1 (en)* | 2015-09-10 | 2017-03-16 | Halliburton Energy Services Inc. | Method for n-dimensional detection of spatial, temporal and gravimetric attributes and associated variation in plots, digital objects and photographs |
| US9896130B2 (en) | 2015-09-11 | 2018-02-20 | Ford Global Technologies, Llc | Guidance system for a vehicle reversing a trailer along an intended backing path |
| US10514825B2 (en)* | 2015-12-18 | 2019-12-24 | Ricoh Co., Ltd. | Image recognition result visualization over time |
| US10112646B2 (en) | 2016-05-05 | 2018-10-30 | Ford Global Technologies, Llc | Turn recovery human machine interface for trailer backup assist |
| US10445702B1 (en)* | 2016-06-30 | 2019-10-15 | John E. Hunt | Personal adaptive scheduling system and associated methods |
| US10140739B1 (en)* | 2016-11-29 | 2018-11-27 | Palantir Technologies Inc. | User interface for automatically generating charts |
| FR3062732B1 (en)* | 2017-02-03 | 2019-04-05 | Thales | OPERATOR TERMINAL OF A MISSION CONTROL AND VISUALIZATION SYSTEM |
| US10095763B1 (en) | 2017-07-10 | 2018-10-09 | Palantir Technologies Inc. | Systems and methods for data analysis and visualization and managing data conflicts |
| US11205146B2 (en)* | 2020-02-14 | 2021-12-21 | Atlassian Pty Ltd. | Computer implemented methods and systems for project management |
| USD1019696S1 (en) | 2020-02-14 | 2024-03-26 | Atlassian Pty Ltd. | Display screen or portion thereof with graphical user interface |
| US11720466B1 (en)* | 2020-04-09 | 2023-08-08 | Palantir Technologies Inc. | Interactive graph generation for computation analysis |
| US11810033B2 (en)* | 2021-09-29 | 2023-11-07 | Atlassian Pty Ltd. | Computer implemented methods and systems for project management |
| US11907692B2 (en)* | 2022-07-25 | 2024-02-20 | Bank Of America Corporation | System and method for retrieval and generation of graphical user interface depicting of graphics associated with rules-based data management |
| US20240330799A1 (en)* | 2023-03-27 | 2024-10-03 | Kinaxis Inc. | Visual display for overlapping intervals |
| EP4451099A1 (en)* | 2023-04-19 | 2024-10-23 | BAE SYSTEMS plc | Temporally synchronising first and second users of respective first and second user interface devices |
| WO2024218478A1 (en)* | 2023-04-19 | 2024-10-24 | Bae Systems Plc | Computer-implemented method of managing a plan of a sequence of events |
| WO2024218477A1 (en)* | 2023-04-19 | 2024-10-24 | Bae Systems Plc | Temporally synchronising first and second users of respective first and second user interface devices |
| EP4451100A1 (en)* | 2023-04-19 | 2024-10-23 | BAE SYSTEMS plc | Computer-implemented method of managaing a plan of a sequence of events |
Citations (12)
| Publication number | Priority date | Publication date | Assignee | Title |
|---|---|---|---|---|
| US5537524A (en)* | 1994-04-25 | 1996-07-16 | Hypercubic Tunneling Industries, Inc. | Process for converting two dimensional data into a multidimensional flow model |
| US5664084A (en)* | 1995-05-18 | 1997-09-02 | Motorola, Inc. | Method and apparatus for visually correlating temporal relationships |
| US5745110A (en)* | 1995-03-10 | 1998-04-28 | Microsoft Corporation | Method and apparatus for arranging and displaying task schedule information in a calendar view format |
| US6057839A (en)* | 1996-11-26 | 2000-05-02 | International Business Machines Corporation | Visualization tool for graphically displaying trace data produced by a parallel processing computer |
| US6466211B1 (en)* | 1999-10-22 | 2002-10-15 | Battelle Memorial Institute | Data visualization apparatuses, computer-readable mediums, computer data signals embodied in a transmission medium, data visualization methods, and digital computer data visualization methods |
| US6750864B1 (en)* | 1999-11-15 | 2004-06-15 | Polyvista, Inc. | Programs and methods for the display, analysis and manipulation of multi-dimensional data implemented on a computer |
| US20040119713A1 (en)* | 2002-12-20 | 2004-06-24 | Michael Meyringer | Interactive and web-based Gantt Chart |
| US20050012743A1 (en)* | 2003-03-15 | 2005-01-20 | Thomas Kapler | System and method for visualizing connected temporal and spatial information as an integrated visual representation on a user interface |
| US6985837B2 (en)* | 2001-11-01 | 2006-01-10 | Moon Dennis A | System presenting meteorological information using a browser interface |
| US20060146048A1 (en)* | 2004-11-30 | 2006-07-06 | William Wright | System and method for interactive 3D air regions |
| US7079142B2 (en)* | 2004-01-14 | 2006-07-18 | Fuji Xerox Co., Ltd. | Systems and methods for creating and updating an interactive 3D visualization of media indices |
| US7168045B2 (en)* | 2002-06-28 | 2007-01-23 | Sap Aktiengesellschaft | Modeling business objects |
Family Cites Families (3)
| Publication number | Priority date | Publication date | Assignee | Title |
|---|---|---|---|---|
| US6106297A (en)* | 1996-11-12 | 2000-08-22 | Lockheed Martin Corporation | Distributed interactive simulation exercise manager system and method |
| EP1139246A1 (en)* | 2000-03-31 | 2001-10-04 | BRITISH TELECOMMUNICATIONS public limited company | Contingency planning in a scheduling process |
| US20020116242A1 (en)* | 2001-02-22 | 2002-08-22 | Vercellone James J. | Emergency response synchronization matrix |
- 2006
- 2006-01-18CACA002533148Apatent/CA2533148A1/ennot_activeAbandoned
- 2006-01-18EPEP06250247Apatent/EP1688878A1/ennot_activeWithdrawn
- 2006-01-18USUS11/333,325patent/US7688322B2/ennot_activeExpired - Fee Related
Patent Citations (13)
| Publication number | Priority date | Publication date | Assignee | Title |
|---|---|---|---|---|
| US5537524A (en)* | 1994-04-25 | 1996-07-16 | Hypercubic Tunneling Industries, Inc. | Process for converting two dimensional data into a multidimensional flow model |
| US5745110A (en)* | 1995-03-10 | 1998-04-28 | Microsoft Corporation | Method and apparatus for arranging and displaying task schedule information in a calendar view format |
| US5664084A (en)* | 1995-05-18 | 1997-09-02 | Motorola, Inc. | Method and apparatus for visually correlating temporal relationships |
| US6057839A (en)* | 1996-11-26 | 2000-05-02 | International Business Machines Corporation | Visualization tool for graphically displaying trace data produced by a parallel processing computer |
| US6466211B1 (en)* | 1999-10-22 | 2002-10-15 | Battelle Memorial Institute | Data visualization apparatuses, computer-readable mediums, computer data signals embodied in a transmission medium, data visualization methods, and digital computer data visualization methods |
| US6750864B1 (en)* | 1999-11-15 | 2004-06-15 | Polyvista, Inc. | Programs and methods for the display, analysis and manipulation of multi-dimensional data implemented on a computer |
| US6985837B2 (en)* | 2001-11-01 | 2006-01-10 | Moon Dennis A | System presenting meteorological information using a browser interface |
| US7168045B2 (en)* | 2002-06-28 | 2007-01-23 | Sap Aktiengesellschaft | Modeling business objects |
| US20040119713A1 (en)* | 2002-12-20 | 2004-06-24 | Michael Meyringer | Interactive and web-based Gantt Chart |
| US20050012743A1 (en)* | 2003-03-15 | 2005-01-20 | Thomas Kapler | System and method for visualizing connected temporal and spatial information as an integrated visual representation on a user interface |
| US7180516B2 (en)* | 2003-03-15 | 2007-02-20 | Oculus Info Inc. | System and method for visualizing connected temporal and spatial information as an integrated visual representation on a user interface |
| US7079142B2 (en)* | 2004-01-14 | 2006-07-18 | Fuji Xerox Co., Ltd. | Systems and methods for creating and updating an interactive 3D visualization of media indices |
| US20060146048A1 (en)* | 2004-11-30 | 2006-07-06 | William Wright | System and method for interactive 3D air regions |
Non-Patent Citations (1)
| Title |
|---|
| Celestine Ntuen et al., "Decision Support Display Modeling for Digital Battlefield", p. 1-5.* |
Cited By (76)
| Publication number | Priority date | Publication date | Assignee | Title |
|---|---|---|---|---|
| US20060200372A1 (en)* | 2005-03-01 | 2006-09-07 | Microsoft Corporation | Method and system for generating a timeline associated with a project schedule |
| US7921026B2 (en)* | 2005-03-01 | 2011-04-05 | Microsoft Corporation | Method and system for generating a timeline associated with a project schedule |
| US20070136436A1 (en)* | 2005-12-08 | 2007-06-14 | International Business Machines Corporation | Selective view synchronization for composite services delivery |
| US7890635B2 (en)* | 2005-12-08 | 2011-02-15 | International Business Machines Corporation | Selective view synchronization for composite services delivery |
| US20070174770A1 (en)* | 2006-01-20 | 2007-07-26 | Michael John Safoutin | Time conditioned digital map and information display |
| US9786123B2 (en) | 2006-04-12 | 2017-10-10 | Bally Gaming, Inc. | Wireless gaming environment |
| US8870647B2 (en) | 2006-04-12 | 2014-10-28 | Bally Gaming, Inc. | Wireless gaming environment |
| US20070288279A1 (en)* | 2006-06-07 | 2007-12-13 | Microsoft Corporation | Entering And Using Time Ranges |
| US9101820B2 (en) | 2006-11-09 | 2015-08-11 | Bally Gaming, Inc. | System, method and apparatus to produce decks for and operate games played with playing cards |
| US8920233B2 (en) | 2006-11-10 | 2014-12-30 | Bally Gaming, Inc. | Assignment template and assignment bundle in a gaming configuration and download system |
| US9275512B2 (en) | 2006-11-10 | 2016-03-01 | Bally Gaming, Inc. | Secure communications in gaming system |
| US20080153600A1 (en)* | 2006-11-10 | 2008-06-26 | Bally Gaming, Inc. | Gaming system configuration change reporting |
| US9111078B2 (en) | 2006-11-10 | 2015-08-18 | Bally Gaming, Inc. | Package manager service in gaming system |
| US9082258B2 (en) | 2006-11-13 | 2015-07-14 | Bally Gaming, Inc. | Method and system for providing download and configuration job progress tracking and display via host user interface |
| US9466172B2 (en) | 2006-11-13 | 2016-10-11 | Bally Gaming, Inc. | Download and configuration management engine for gaming system |
| US8381130B2 (en)* | 2006-11-29 | 2013-02-19 | Yahoo! Inc. | Method and user interface tool for navigation through grid of scheduled items |
| US20080126989A1 (en)* | 2006-11-29 | 2008-05-29 | Philip Flores | Method and user interface tool for navigation through grid of scheduled items |
| US20080175104A1 (en)* | 2007-01-23 | 2008-07-24 | Microsoft Corporation | Flexible electronic calendar integrating tasks and appointments |
| US20080177609A1 (en)* | 2007-01-23 | 2008-07-24 | Microsoft Corporation | Electronic calendar associating tasks and appointments |
| US8135696B2 (en)* | 2007-03-03 | 2012-03-13 | Michael John Safoutin | Time-conditioned search engine interface with visual feedback |
| US20080215552A1 (en)* | 2007-03-03 | 2008-09-04 | Michael John Safoutin | Time-conditioned search engine interface with visual feedback |
| US20080295016A1 (en)* | 2007-05-25 | 2008-11-27 | Mathieu Audet | Timescale for representing information |
| US8826123B2 (en)* | 2007-05-25 | 2014-09-02 | 9224-5489 Quebec Inc. | Timescale for presenting information |
| US9613487B2 (en) | 2007-11-02 | 2017-04-04 | Bally Gaming, Inc. | Game related systems, methods, and articles that combine virtual and physical elements |
| US8920236B2 (en) | 2007-11-02 | 2014-12-30 | Bally Gaming, Inc. | Game related systems, methods, and articles that combine virtual and physical elements |
| US20090131144A1 (en)* | 2007-11-12 | 2009-05-21 | Bally Gaming, Inc. | Meta-option |
| US8819124B2 (en) | 2007-11-12 | 2014-08-26 | Bally Gaming, Inc. | System and method for one-way delivery of notifications from server-to-clients using modified multicasts |
| US20090276715A1 (en)* | 2008-04-30 | 2009-11-05 | Bally Gaming, Inc. | User interface for managing network download and configuration tasks |
| US8856657B2 (en)* | 2008-04-30 | 2014-10-07 | Bally Gaming, Inc. | User interface for managing network download and configuration tasks |
| US9483911B2 (en) | 2008-04-30 | 2016-11-01 | Bally Gaming, Inc. | Information distribution in gaming networks |
| US9005034B2 (en) | 2008-04-30 | 2015-04-14 | Bally Gaming, Inc. | Systems and methods for out-of-band gaming machine management |
| US20090275402A1 (en)* | 2008-04-30 | 2009-11-05 | Bally Gaming, Inc. | Information distribution in gaming networks |
| US9443377B2 (en) | 2008-05-30 | 2016-09-13 | Bally Gaming, Inc. | Web pages for gaming devices |
| US8851988B2 (en) | 2008-11-14 | 2014-10-07 | Bally Gaming, Inc. | Apparatus, method, and system to provide a multiple processor architecture for server-based gaming |
| US20120278123A1 (en)* | 2009-12-02 | 2012-11-01 | Houle Dale T | Method And System For Determining The Capacity Required To Complete Work During Planned Start And Finished Times |
| US8849462B2 (en)* | 2009-12-02 | 2014-09-30 | Velvetwire Llc | Method and apparatus for automation of a programmable device |
| US20110118857A1 (en)* | 2009-12-02 | 2011-05-19 | Eric Bodnar | Method and apparatus for automation of a programmable device |
| US9618911B2 (en) | 2009-12-02 | 2017-04-11 | Velvetwire Llc | Automation of a programmable device |
| US9009592B2 (en) | 2010-06-22 | 2015-04-14 | Microsoft Technology Licensing, Llc | Population of lists and tasks from captured voice and audio content |
| US20110320979A1 (en)* | 2010-06-24 | 2011-12-29 | Nokia Corporation | Method and apparatus for creating a to-do item based on selection of a function to be performed by an application |
| US20120265516A1 (en)* | 2011-04-12 | 2012-10-18 | Microsoft Corporation | Peripheral device simulation |
| US9552334B1 (en) | 2011-05-10 | 2017-01-24 | Myplanit Inc. | Geotemporal web and mobile service system and methods |
| US9058716B2 (en) | 2011-06-06 | 2015-06-16 | Bally Gaming, Inc. | Remote game play in a wireless gaming environment |
| US9898889B2 (en) | 2011-06-06 | 2018-02-20 | Bally Gaming, Inc. | Remote game play in a wireless gaming environment |
| US10192176B2 (en) | 2011-10-11 | 2019-01-29 | Microsoft Technology Licensing, Llc | Motivation of task completion and personalization of tasks and lists |
| US9120007B2 (en) | 2012-01-18 | 2015-09-01 | Bally Gaming, Inc. | Network gaming architecture, gaming systems, and related methods |
| US9792770B2 (en) | 2012-01-18 | 2017-10-17 | Bally Gaming, Inc. | Play for fun network gaming system and method |
| US10403091B2 (en) | 2012-01-18 | 2019-09-03 | Bally Gaming, Inc. | Play for fun network gaming system and method |
| US9286194B2 (en) | 2012-04-10 | 2016-03-15 | International Business Machines Corporation | Data processing system |
| US9384251B2 (en) | 2012-04-11 | 2016-07-05 | International Business Machines Corporation | Synchronization of off-line reports and off-line mobile content packages |
| US20150046856A1 (en)* | 2013-08-06 | 2015-02-12 | SmartSheet.com, Inc. | Interactive Charts For Collaborative Project Management |
| US9696903B2 (en) | 2013-08-09 | 2017-07-04 | Zoomdata, Inc. | Real-time data visualization of streaming data |
| US9946811B2 (en) | 2013-08-09 | 2018-04-17 | Zoomdata, Inc. | Presentation of streaming data |
| US8631325B1 (en) | 2013-08-09 | 2014-01-14 | Zoomdata, Inc. | Real-time data visualization of streaming data |
| US9411807B2 (en) | 2013-08-09 | 2016-08-09 | Zoomdata, Inc. | Real-time data visualization of streaming data |
| US9396190B2 (en) | 2013-08-09 | 2016-07-19 | Zoomdata, Inc. | Real-time data visualization of streaming data |
| US9612742B2 (en) | 2013-08-09 | 2017-04-04 | Zoomdata, Inc. | Real-time data visualization of streaming data |
| US9710571B2 (en) | 2014-03-07 | 2017-07-18 | Oracle International Corporation | Graphical top-down planning system |
| US9423943B2 (en) | 2014-03-07 | 2016-08-23 | Oracle International Corporation | Automatic variable zooming system for a project plan timeline |
| US9418348B2 (en) | 2014-05-05 | 2016-08-16 | Oracle International Corporation | Automatic task assignment system |
| US10489014B2 (en)* | 2014-12-31 | 2019-11-26 | Calendre Company | Venue and event interface |
| US20160259500A1 (en)* | 2014-12-31 | 2016-09-08 | Calendre Company | Venue and event interface |
| US10643157B2 (en) | 2015-02-03 | 2020-05-05 | Oracle International Corporation | Task progress update history visualization system |
| US10262051B2 (en)* | 2015-02-06 | 2019-04-16 | Adp, Llc | Adjustable graphical display system |
| US20160232217A1 (en)* | 2015-02-06 | 2016-08-11 | Adp, Llc | Adjustable Graphical Display System |
| US9817871B2 (en) | 2015-02-27 | 2017-11-14 | Zoomdata, Inc. | Prioritized retrieval and/or processing of data via query selection |
| US9811567B2 (en) | 2015-02-27 | 2017-11-07 | Zoomdata, Inc. | Prioritization of retrieval and/or processing of data |
| US9251276B1 (en) | 2015-02-27 | 2016-02-02 | Zoomdata, Inc. | Prioritization of retrieval and/or processing of data |
| US20160292620A1 (en)* | 2015-03-30 | 2016-10-06 | Oracle International Corporation | Visual task assignment system |
| US10496943B2 (en)* | 2015-03-30 | 2019-12-03 | Oracle International Corporation | Visual task assignment system |
| US9389909B1 (en) | 2015-04-28 | 2016-07-12 | Zoomdata, Inc. | Prioritized execution of plans for obtaining and/or processing data |
| US10692257B2 (en)* | 2016-10-28 | 2020-06-23 | Nec Corporation | Process management apparatus, process management method, and storage medium |
| US9942312B1 (en) | 2016-12-16 | 2018-04-10 | Zoomdata, Inc. | System and method for facilitating load reduction at a landing zone |
| US10375157B2 (en) | 2016-12-16 | 2019-08-06 | Zoomdata, Inc. | System and method for reducing data streaming and/or visualization network resource usage |
| US20220224587A1 (en)* | 2021-01-07 | 2022-07-14 | Servicenow, Inc. | Systems and methods for ranked visualization of events |
| US11777792B2 (en)* | 2021-01-07 | 2023-10-03 | Servicenow, Inc. | Systems and methods for ranked visualization of events |
Also Published As
| Publication number | Publication date |
|---|---|
| CA2533148A1 (en) | 2006-07-18 |
| EP1688878A1 (en) | 2006-08-09 |
| US20060238538A1 (en) | 2006-10-26 |
Similar Documents
| Publication | Publication Date | Title |
|---|---|---|
| US7688322B2 (en) | System and method for data visualization using a synchronous display of sequential time data and on-map planning | |
| US7180516B2 (en) | System and method for visualizing connected temporal and spatial information as an integrated visual representation on a user interface | |
| US7609257B2 (en) | System and method for applying link analysis tools for visualizing connected temporal and spatial information on a user interface | |
| US10157502B2 (en) | Method and apparatus for sharing augmented reality applications to multiple clients | |
| US9947367B2 (en) | Assignment of a local physical user interface control function to a remote physical user interface control for local control in a media production system | |
| US7499046B1 (en) | System and method for visualizing connected temporal and spatial information as an integrated visual representation on a user interface | |
| US8966398B2 (en) | System and method for visualizing connected temporal and spatial information as an integrated visual representation on a user interface | |
| US9424536B2 (en) | System for business portfolio modeling and analysis | |
| CA2569449A1 (en) | System and method for visualizing configurable analytical spaces in time for diagrammatic context representations | |
| Chen et al. | 3D AR-based modeling for discrete-event simulation of transport operations in construction | |
| GB2440171A (en) | Improvements in data visualisation systems | |
| EP1755056A1 (en) | System and method for applying link analysis tools for visualizing connected temporal and spatial information on a user interface | |
| Parikka et al. | An ecoaesthetic of vegetal surfaces: on Seed, Image, Ground as soft montage | |
| Brooks | ArtsIT, Interactivity and Game Creation: 12th EAI International Conference, ArtsIT 2023, São Paulo, Brazil, November 27-29, 2023, Proceedings, Part II | |
| Baker et al. | Interaction Techniques for Comparing Video | |
| Balyk et al. | Study of augmented and virtual reality technology in the educational digital environment of the pedagogical university | |
| Gałązkiewicz et al. | A comprehensive approach to the analysis of VR training progress of Industry 4.0 employees | |
| Gerhard et al. | Mastering Autodesk 3ds Max Design 2010 | |
| CN120011613A (en) | A data-driven event automatic modeling and dynamic display method and device | |
| Sivasankaran et al. | Data exploration: transposition operations in dynamic diagrams | |
| Cerqueira et al. | Serious game interaction techniques applied to an operational satellite simulator | |
| Parikka et al. | An Ecoaesthetic of Vegetal Surfaces: On Seed, Image, Ground as Soft Montage | |
| Cybulski | Classification of Animated Maps–A Multi-Perspective Approach | |
| Andujar et al. | Enriching Medieval 4D Models with Interactive Narratives | |
| CA2487616A1 (en) | System and method for visualizing connected temporal and spatial information as an integrated visual representation on a user interface |
Legal Events
| Date | Code | Title | Description |
|---|---|---|---|
| AS | Assignment | Owner name:OCULUS INFO INC.,CANADA Free format text:ASSIGNMENT OF ASSIGNORS INTEREST;ASSIGNORS:KAPLER, THOMAS;HALL, ERIC;REEL/FRAME:017442/0815 Effective date:20060315 Owner name:OCULUS INFO INC., CANADA Free format text:ASSIGNMENT OF ASSIGNORS INTEREST;ASSIGNORS:KAPLER, THOMAS;HALL, ERIC;REEL/FRAME:017442/0815 Effective date:20060315 | |
| FEPP | Fee payment procedure | Free format text:PAYOR NUMBER ASSIGNED (ORIGINAL EVENT CODE: ASPN); ENTITY STATUS OF PATENT OWNER: LARGE ENTITY | |
| STCF | Information on status: patent grant | Free format text:PATENTED CASE | |
| FPAY | Fee payment | Year of fee payment:4 | |
| AS | Assignment | Owner name:UNCHARTED SOFTWARE INC., CANADA Free format text:CHANGE OF NAME;ASSIGNOR:OCULUS INFO INC.;REEL/FRAME:035638/0331 Effective date:20141218 | |
| MAFP | Maintenance fee payment | Free format text:PAYMENT OF MAINTENANCE FEE, 8TH YEAR, LARGE ENTITY (ORIGINAL EVENT CODE: M1552) Year of fee payment:8 | |
| FEPP | Fee payment procedure | Free format text:MAINTENANCE FEE REMINDER MAILED (ORIGINAL EVENT CODE: REM.); ENTITY STATUS OF PATENT OWNER: LARGE ENTITY | |
| LAPS | Lapse for failure to pay maintenance fees | Free format text:PATENT EXPIRED FOR FAILURE TO PAY MAINTENANCE FEES (ORIGINAL EVENT CODE: EXP.); ENTITY STATUS OF PATENT OWNER: LARGE ENTITY | |
| STCH | Information on status: patent discontinuation | Free format text:PATENT EXPIRED DUE TO NONPAYMENT OF MAINTENANCE FEES UNDER 37 CFR 1.362 | |
| FP | Lapsed due to failure to pay maintenance fee | Effective date:20220330 |