US7681086B2 - Fault tree map generation - Google Patents
Fault tree map generationDownload PDFInfo
- Publication number
- US7681086B2 US7681086B2US11/858,146US85814607AUS7681086B2US 7681086 B2US7681086 B2US 7681086B2US 85814607 AUS85814607 AUS 85814607AUS 7681086 B2US7681086 B2US 7681086B2
- Authority
- US
- United States
- Prior art keywords
- fault tree
- fault
- failure
- failures
- map
- Prior art date
- Legal status (The legal status is an assumption and is not a legal conclusion. Google has not performed a legal analysis and makes no representation as to the accuracy of the status listed.)
- Expired - Fee Related, expires
Links
Images


Classifications
- G—PHYSICS
- G06—COMPUTING OR CALCULATING; COUNTING
- G06F—ELECTRIC DIGITAL DATA PROCESSING
- G06F30/00—Computer-aided design [CAD]
- G06F30/20—Design optimisation, verification or simulation
- G—PHYSICS
- G06—COMPUTING OR CALCULATING; COUNTING
- G06F—ELECTRIC DIGITAL DATA PROCESSING
- G06F2111/00—Details relating to CAD techniques
- G06F2111/08—Probabilistic or stochastic CAD
Definitions
- the technology hereinrelates to fault tree analysis, and more particularly to methods and apparatus for transforming a fault tree into a compact fault tree map. Still more particularly, the technology herein relates to Fault Tree Map generation through use of special symbols and graphical presentation in order to facilitate fault tree qualitative analysis.
- the technology hereincan generally be adapted for use with any type of the Fault Tree, including Fault Trees developed for production installation, specific installation, hardware and integrated hardware/software technical systems.
- the technology hereinis suitable, for example, for use in performing systems, installations and equipment faults analysis, including fault propagation, for complex or other integrated objects, systems or installations including but not limited to aircraft failure analysis.
- No man-made machine or systemcan be designed to be 100% reliable. Any machine or system we can design and build will eventually break down and fail. In many cases, a breakdown can be handled simply by repairing or replacing a defective system or part. For example, when a light bulb burns out, you simply replace it with a new bulb. If a household appliance such as a dishwasher or oven in your kitchen breaks down, you may be inconvenienced until the appliance can be repaired but few other adverse consequences generally occur. However, as we trust and rely on technology more and more, there is an increased risk that technology failure can have catastrophic consequences.
- fault-tolerant systemsare designed so that if one important component or function fails, another part of the system stands ready to take its place or at least provide sufficient functionality to continue safe operation.
- an aircraft or spacecraftmay be designed to have a main power system plus a backup power system. If the main power system fails, the backup power system immediately takes over.
- aircraftare usually provided with redundant instrumentation so that even if certain instrumentation fails, the pilot still has the information she needs to continue to fly the plane safely.
- fault tolerant designshave been highly successful, they introduce additional complexity to the already complex problem of reliably predicting how the system will operate in the event of certain faults. Fault testing is certainly a useful way of predicting system behavior, but there is generally a need for tools that help system designers predict system fault behavior without subjecting the system being analyzed to potentially destructive exhaustive fault testing.
- Fault analysis using Fault Treesis a common method known and widely used in various industries and developments to evaluate object efficiency and safety.
- a fault treeis a logical construct that attempts to represent system operational and fault states with nodes and paths that in some sense resemble the root, trunk, branches and leaves of a tree.
- the paths to the nodesare typically defined using Boolean logic which precisely describes logical combinations of nodes and paths.
- Such fault tree representationsallow system and reliability engineers to visualize and analyze system failure modes so they can predict how certain types of faults will affect system operation. Using such fault tree analysis, it is possible, for example, to predict co-dependencies between faults and to isolate which faults that could potentially cause mission-critical systems and subsystems to catastrophically fail.
- Fault treesalso give system designers a better idea concerning overall system reliability and behavioral complexity and can help designers simplify their systems to achieve higher reliability with reduced cost and greater efficiency.
- Fault Tree logicusing logical Gates, accordingly to e.g., NUREG-0492, Fault Tree Handbook
- fault Date Basese.g., logging or otherwise recording failure rate and exposure time, or failure probability
- Fault Tree analysesthere are two types of Fault Tree (failure combinations) analyses: quantitative and qualitative.
- a quantitative analysisis generally linked with Fault Tree Top Event probability calculation.
- a qualitative analysisgenerally envisages the evaluation of Fault Tree structure, Fault Tree Cut Sets, combinations of evident and latent failures, possible failure propagation, and the like. Each type of analysis can be useful and powerful.
- Fault Trees generation and analysisMuch work has been done in the area of Fault Tree techniques, Fault Trees generation and analysis. Some, for example, have developed methods for the automated generation of an extended Fault Trees, adapted to a production installation or a specific installation. Others have developed methods for technical system fault tree determining with extended fault description. Still others have proposed system integrated fault tree analysis methods. Some have declared fault tree displaying method for system diagnosis.
- fault treesfor complex integrated systems/installations (for example, in the aeronautic industry) will result in extended large fault trees, that can consist about 200-300 failure nodes.
- Such fault treesif printed out in a graphical format could result for example in hundreds of printed pages considering the practices recommended by NUREG-0492, Fault Tree Handbook, and the Aerospace Industry (see specification ARP4761).
- Such graphical representationprovides a complex set of fault event and logical gate images and also takes stock of relevant information presented on the fault tree for fault tree Top event probability calculation.
- Such complex fault tree graphical representationsare, because they are so large, not possible or practical to display on a single display screen or page view. Rather, systems analysts must generally print out the fault tree and conduct analyses than can span over many tens or even hundreds pages of graphical representation. The complexity of such graphical representations can be overwhelming.
- existing computerized tools to perform fault tree creationgenerally can show large and complex fault trees on a computer screen only one part at a time.
- a printed reportalso generally presents the fault tree page by page.
- the amount of time and complexity required to analyze such multi-view representationscan be substantial. For example, consider a person who is not author of this fault tree, but who needs to understand the fault tree logic (e.g., to evaluate the fault tree accuracy, to merge various fault trees on the systems integrated level, etc.) and perform the fault tree analysis. The task such a person faces can be difficult, and can obviously involve considerable time outlay.
- Some known toolssupport performing Fault Tree analysis (assessment) by Cut Set generation and failure importance determination. Such support in some cases includes failure table generation. However, using such approaches, it is often difficult to apprehend why determined failures have entered in the cut sets, where in the fault tree the repeated failures are located, and how their positions influence fault tree Top event probability.
- the technology hereinprovides a Fault Tree map generation method that transforms a conventional fault tree to new type of fault tree diagram (“Fault Tree Map”), which permits drastically compact fault tree depiction and representation through special techniques.
- Fault Tree Mapfault tree diagram
- Exemplary illustrative non-limiting techniques for generating fault tree mapsgraphically present fault trees in a compact, understandable, efficient manner from which repeated event location and other information can be readily ascertained.
- Exemplary illustrative non-limiting fault tree map generationprovides a fault tree map that graphically presents fault tree failures with graphical identification of failure type and shows failure/gates repetition, cut set consistency and failure propagation potentiality, besides facility of localization of each Fault Tree logical Gate and relevant failures in the Fault Tree printed report.
- markingsare used to indicate repeated events to readily indicate the location of repeated failure on the fault tree.
- repeated eventsare can be indicated by colored trapezoids; bolded (red) triangles indicate “top” events; and bolded (violet) circles indicate repeated gates.
- arrow connectorsindicate events with exposure time in excess of flight duration. Different cutsets can be indicated by differently colored solid circles.
- AND logical connectorscan be indicated by one symbol (e.g., triangle) and OR logical connectors can be indicated by a different symbol (circle), such symbols being different from the conventional AND and OR gate symbols that are typically used. Word descriptions are generally omitted in the exemplary illustrative non-limiting implementation.
- an exemplary illustrative non-limiting implementationprovides the following exemplary steps using a conventional fault tree as a starting point:
- a resulting exemplary illustrative non-limiting Fault Tree Mapreflects the Fault Tree logic, presents all Fault Tree failures with graphically identification of the failure type, and shows failure/Gates repetition, Cut Sets consistency and also failure criticality (importance) to Fault Tree Top Event probability.
- One exemplary illustrative non-limiting Fault Tree Map imagecontains all information necessary to Fault Tree qualitative analysis, and allows one to comprehend at a glance (e.g., on a single printed page A4 or display screen view) a complex Fault Tree that for example may include 100-120 failure nodes (corresponding e.g., to 40-50 printed pages A4, as it is presented by existing computerized tools for Fault Tree creation).
- any specialistincluding one who is not the Fault Tree author, can rapidly understand the Fault Tree logic and conduct an appropriate failure analysis.
- analysis of combinations of logical Gates through Fault Tree structureallows a reliability engineer to make conclusion about potentiality failure propagation (OR'ed combination of failure support the failure propagation, AND'ed combination of failures prevent the failure propagation) and also determine elements of the system that provide mitigation factor functionality.
- an exemplary illustrative non-limiting Fault Tree Mapthat has opportunity to show, using special marking, various sets of repeated events, provides easy comprehension about the location of the repeated failures on the Fault Tree to provide adequate and efficient Fault Tree treatment.
- failure Qualitative Importance Determinationusing a Fault Tree Map where failures that belong to each Cut Set were marked.
- This exemplary illustrative analysiscan be performed to comprehend what part of the System the failure belongs to or is associated with, and how far from the Fault Tree Top Event the failure is located.
- the exemplary illustrative non-limiting implementation fault tree mapalso makes evident failures which appear more times in the Cut Sets and are located near to Fault Tree Top Events, thereby giving them enlarged importance to the Fault Tree.
- the exemplary illustrative non-limiting Fault Tree Mapprovided by the technology herein, which marks results of said Importance Analysis, allows one to understand why particular failures are important for the Fault Tree (for example, failures that provide input to OR'ed Boolean logic combinations are generally more critical or important than those failures that provide input to AND'ed combinations), and to provide, if necessary, adequate mitigation means to decrease the failure importance.
- the Fault Tree Mapaccording to this exemplary illustrative non-limiting implementation is easy to understand, convenient to use and provide high analysis efficiency together with considerable time economy.
- failure or logical Gatesin the form of data may be obtained from conventional Fault Tree, may be provided and represented on the Fault Tree Map using failure (or Gate) identification Code.
- the exemplary illustrative Fault Tree Mapmay be analyzed by itself, or it may be used as a map or guide for analyzing the underlying more detailed and complex fault tree—thus serving as a map the same way that a roadmap helps one to navigate the complexity of city streets. For example, occasionally, at the report generation stage, a Fault Tree may need to be divided and paged. In the exemplary illustrative non-limiting implementation at this stage, the logical gates on the Fault Tree Map may be completed or identified by report page number, where each logical Gate is placed. This action provides highly efficient guidance for using the exemplary illustrative Fault Tree Map to guide the reliability engineer to traverse and analyze the conventional Fault Tree, to perform any type of failure analysis desired. For large-scale Fault Trees, this type of guidance allows one to appreciably decrease of the time outlay and avoid hash and mistakes during Fault Tree evaluation, including Fault Trees merging on the systems integration level.
- One exemplary illustrative non-limiting method for Fault Tree Map generationemploys transformation of Fault Trees, using manual means.
- Other exemplary illustrative non-limiting implementationstransform Fault Trees to Fault Tree maps using computerized means.
- a combination of manual and computer techniquesmay be used to transform a Fault Tree to a Fault Tree map. Involvement of the computerized tool to perform Fault Tree Map generation provides more time economy and results confidence.
- An exemplary illustrative non-limiting method for Fault Tree Map generationprovides transformation of Fault Trees of production installation, specific installation, technical system/equipment (Hardware and integrated Hardware/Software).
- One exemplary illustrative non-limiting method of generating a graphical presentation of a fault tree map for use in technical system or installation design and/or diagnosticscomprises creating a fault tree including cut sets and events important evaluation; analyzing the fault tree to determine latent failures, repeated events and gates; generating a compact map of said fault tree, said compact map graphically indicating evident event (failure) type with a first connector symbol and indicating events with exposure time in excess of flight duration (mission time) with a second connector symbol different from said first connector symbol; graphically indicating logic gates with predetermined symbols different from Fault Tree gates image; and graphically presenting said compact fault tree map.
- the graphically presentingmay comprise repeated events and repeated gates with predetermined symbols/colors. It is possible to indicate different cut sets with different colors and more important event with predetermined symbols.
- the graphically presentingmay comprise displaying said compact fault tree map on an electronic display.
- One exemplary illustrative non-limiting implementationsuppresses from said map, display of wordbased events (failures) and gates descriptions. Failure propagation may be demonstrated by color indicating of the propagation path. Numbers of Fault Tree report pages where gates are placed may be included.
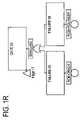
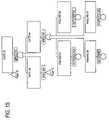
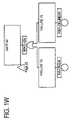
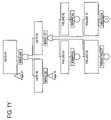
- FIGS. 1 A- 1 AFare together an exemplary illustrative non-limiting conventional Fault Tree for an aeronautical application such as fault analysis for an aircraft;
- FIGS. 2A-2Bare an example of exemplary illustrative non-limiting symbols and marking that may be used for generating an exemplary illustrative non-limiting Fault Tree Map;
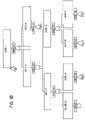
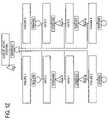
- FIGS. 3A-3Bshow an exemplary illustrative non-limiting Fault Tree Map that corresponding to the conventional Fault Tree shown in FIGS. 1 A- 1 AF;
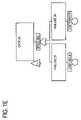
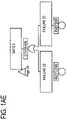
- FIG. 4is a block diagram showing an exemplary illustrative non-limiting fault tree map generation process
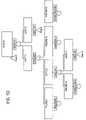
- FIG. 5is an exemplary illustrative non-limiting flowchart for computer-assisted fault tree map generation
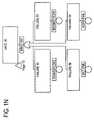
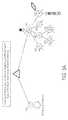
- FIG. 6shows an exemplary illustrative non-limiting data base transformation diagram.
- FIGS. 1 A- 1 AFshow an exemplary illustrative non-limiting conventional fault tree of the type that is used in many industries and applications to conduct fault and reliability analysis.
- the example fault tree shown in these Figuresshows faults and system behavior for an example aircraft braking condition.
- any type of aircraft or other systemincluding but not limited to other vehicular or transportation systems, medical systems, first responder emergency systems, communications systems, power grid systems including nuclear reactors, or any other complex or other system can be analyzed using a fault tree in a similar fashion as is known to those skilled in the art.
- FIGS. 1 A- 1 AEThose skilled in the art will recognize the features of the conventional fault tree shown in FIGS. 1 A- 1 AE. For example, they will recognize the “top event” shown in FIG. 1A (braking loss combined with loss of nosewheel steering) that represents a potentially aircraft failure mode, as well as the failure events (loss of wheel braking ANDed with loss of active steering) that will result in such failure mode. They will also recognize that to fully analyze the failure nodes and dependencies that contribute to such failure mode may require many hours of complex study across the various pages of the FIG. 1A-FIG . 1 AE fault tree. Those skilled in the art will further understand that the particular exemplary illustrative fault tree represented by FIGS. 1 A- 1 AE is by no means the most complex fault tree one may envision, and that complex systems may commonly have fault trees that are substantially more complex with hundreds of failure nodes and associated logic.
- patenteetransforms the exemplary fault tree shown in FIGS. 1 A- 1 AE into the exemplary fault tree map shown in FIGS. 3A-3B to provide a much more compact, distilled, easy to understand, easy to analyze and highly useful representation of the same system fault behavior.
- the fault tree map of FIGS. 3A-3Bcan be analyzed on its own, or it can be used as a guide for traversing the more complex complete fault tree map of FIGS. 1 A- 1 AE, or both.
- FIGS. 2A-2Bshow exemplary illustrative symbols that the Fault Tree map of FIGS. 3A-3B uses to represent information. These symbols are only exemplary (others can be used instead). Additionally, the illustrative exemplary non-limiting implementation colors these symbols with different colors to make them more distinctive and easy to recognize and read. As can be seen, top events can be represented by a distinctive symbol such as a bold triangle of a particular color. AND gates can be represented by triangles (as opposed to the conventional AND gate symbol used by logic designers), and OR gates can be represented by circles (as opposed to the conventional OR gate symbol used by logic designers). Repeated gates can be represented by bold circles of a distinctive color. Evident events can be represented by strokes.
- Events with exposure time more than the typical operation duration of the systemcan be represented by strokes with arrows. Repeated events may be represented by specially colored trapezoids. Cutset events may be represented by distinctive colored circles, with different cut sets color coded with different colors. Intermediate connections may be represented by rounded squares. Other symbol and color schemes may be used instead.
- FIGS. 2A-2BApplying the symbol key shown in FIGS. 2A-2B allows one to immediately understand the exemplary illustrative Fault Tree map shown in FIGS. 3A-3B .
- the bolded triangle labeled “ 1 ”represents a top event.
- the diagramshows that this Top Event is contributed to by a node (logical Gate OR), coded 324 , that is located on the page 1 of the underlying Fault Tree (see FIG. 1A ) and by other node (logical Gate OR), coded 001, that is located on the page 26 of the underlying Fault Tree (see FIG. 1Z ). This one is contributed to by a number of additional Failure nodes (logical Gates OR), with own codes.
- These logical Gatesare located on the pages 27 , 28 , 31 , 32 , 29 and 30 of the Fault Tree.
- the shaded circles shown in FIG. 3Acorrespond to differently color coded cut sets.
- This repeated eventcan also be seen on the lower lefthand corner of the FIG. 3B fault tree map—indicating that the event (if a failure) contributes to both loss of wheel braking and loss of active steering.
- a reliability engineeris thus immediately alerted to the fact that this repeated event can reduce the fault tolerance of the overall system by contributing to two different aspects of the ANDed together failure modes.
- FIG. 4is a block diagram showing an exemplary illustrative non-limiting Fault Tree Map computer generation process.
- a usermay input a fault tree using a conventional user input system 102 such as a keyboard, a mouse, etc.
- a computer 104receives these inputs and processes them to generate a fault tree map which it may then display on a display monitor 114 and/or print using a printer 112 (or otherwise render or store).
- the exemplary illustrative non-limiting implementationuses fault tree creation software 106 of conventional design to create a fault tree.
- the fault treemay be stored in a conventional data storage/retrieval device 108 .
- Fault tree map generation software 110is used in the exemplary illustrative non-limiting implementation to generate a fault tree map.
- FIG. 5shows an exemplary flowchart of fault tree map generation
- FIG. 6shows an exemplary flowchart of fault database transformation.
- fault tree data inputis received (block 150 ) and stored into a Fault Tree data base (blocks 152 , 154 ). If the inputted data is associated with fault tree logic (block 156 ), the fault tree map structure is determined (block 158 ) and the map is constructed (block 160 ). If the inputted data is not associated with fault tree logic (“no” exit to decision block 156 ), then it is determined whether the inputted data is associated with an event (block 162 ).
- this evaluation datais included in the fault tree map (block 182 ). If the inputted data is associated with a fault tree report (block 184 ), then this information may be used to encode page number on a fault tree map report gate (block 186 ).
- the fault tree mapmay be displayed (block 190 ) and/or printed (block 192 ).
- FIG. 6shows an exemplary illustrative non-limiting transformation between a fault tree database 196 and a fault tree map database 198 that the FIG. 5 algorithm may effect.
- FIG. 6shows for example how a fault tree logic database 202 may be transformed into a fault tree map structure 302 .
- a fault tree event database 204may be transformed to an event type map symbol 304 and an event code 305 as shown.
- a fault tree gates database 206may be transformed to a gate type map symbol 306 and a gate code 307 as shown.
- a fault tree evaluation database 208may be transformed to repeated events (special markings), cutset utensils (special marking), repeated gates (special marking) and/or event importance (special marking) 308 a - d as shown.
- a fault tree report database 210may be transformed to a gate page number 310 in the manner shown.
Landscapes
- Engineering & Computer Science (AREA)
- Physics & Mathematics (AREA)
- Theoretical Computer Science (AREA)
- Computer Hardware Design (AREA)
- Evolutionary Computation (AREA)
- Geometry (AREA)
- General Engineering & Computer Science (AREA)
- General Physics & Mathematics (AREA)
- Test And Diagnosis Of Digital Computers (AREA)
- Management, Administration, Business Operations System, And Electronic Commerce (AREA)
Abstract
Description
- Evident failure—a failure which is detected and/or annunciated when it occurs.
- Latent failure—a failure which is not detected and/or annunciated when it occurs. A failure is latent until it is made known by special test/proceeding.
- Repeated failure—a failure that appears more than once in the given Fault Tree.
- Fault Tree Cut Set—smallest set of failures which must occur in order for the Fault Tree Top Event to occur.
- Substitution of the all logical Gates by adequate symbols, which graphically define the Gate type and content the Gate identification Code;
- Exclusion of the Gate description;
- When on the report generation stage, inclusion of the numbers of pages, where the logical Gate is placed;
- Substitution of evident failures by adequate symbols, which graphically define the failure type;
- Substitution of all latent failures by adequate symbols (different than evident failure symbols), which graphically define the failure type;
- Substitution of other types of failures by adequate different symbols, which graphically define the failure types;
- Exclusion of all evident/latent/other failures description;
- Using special or distinctive markings for repeated gates;
- Using special or distinctive markings for repeated failures;
- Using special or distinctive markings for failures of the same Cut Set;
- Using special or distinctive markings for indicating failure importance evaluation results.
Claims (20)
Priority Applications (1)
| Application Number | Priority Date | Filing Date | Title |
|---|---|---|---|
| US11/858,146US7681086B2 (en) | 2007-09-20 | 2007-09-20 | Fault tree map generation |
Applications Claiming Priority (1)
| Application Number | Priority Date | Filing Date | Title |
|---|---|---|---|
| US11/858,146US7681086B2 (en) | 2007-09-20 | 2007-09-20 | Fault tree map generation |
Publications (2)
| Publication Number | Publication Date |
|---|---|
| US20090083576A1 US20090083576A1 (en) | 2009-03-26 |
| US7681086B2true US7681086B2 (en) | 2010-03-16 |
Family
ID=40472998
Family Applications (1)
| Application Number | Title | Priority Date | Filing Date |
|---|---|---|---|
| US11/858,146Expired - Fee RelatedUS7681086B2 (en) | 2007-09-20 | 2007-09-20 | Fault tree map generation |
Country Status (1)
| Country | Link |
|---|---|
| US (1) | US7681086B2 (en) |
Cited By (13)
| Publication number | Priority date | Publication date | Assignee | Title |
|---|---|---|---|---|
| US20090106589A1 (en)* | 2007-10-19 | 2009-04-23 | Oracle International Corporation | Gathering context information used for activation of contextual dumping |
| US20100174388A1 (en)* | 2009-01-02 | 2010-07-08 | Ferreira David A | Live Device Graphical Status Tree |
| US20100318853A1 (en)* | 2009-06-16 | 2010-12-16 | Oracle International Corporation | Techniques for gathering evidence for performing diagnostics |
| US20130274991A1 (en)* | 2012-04-12 | 2013-10-17 | Airbus Operations (Sas) | Method, devices and program for computer-aided analysis of the failure tolerance of an aircraft system, using critical event charts |
| US20130339795A1 (en)* | 2012-06-15 | 2013-12-19 | The Boeing Company | Failure Analysis Validation And Visualization |
| US9430311B2 (en) | 2013-07-23 | 2016-08-30 | Halliburton Energy Services, Inc. | Cause and effect mapping for failure mode effect analysis creation and risk management |
| US20160266952A1 (en)* | 2015-03-10 | 2016-09-15 | Kai Höfig | Automated Qualification of a Safety Critical System |
| US9852232B2 (en) | 2013-11-08 | 2017-12-26 | International Business Machines Corporation | Automating event trees using analytics |
| US10061670B2 (en)* | 2015-12-28 | 2018-08-28 | Siemens Aktiengesellschaft | Method and apparatus for automatically generating a component fault tree of a safety-critical system |
| CN110517369A (en)* | 2019-08-23 | 2019-11-29 | 中国航空无线电电子研究所 | Fault tree construction method and system based on mind map |
| US10572331B2 (en)* | 2016-07-15 | 2020-02-25 | Siemens Aktiengesellschaft | Method and apparatus for a computer-based generation of component fault trees |
| US11079749B2 (en)* | 2016-06-21 | 2021-08-03 | Siemens Aktiengesellschaft | Method and apparatus for automated hazard detection |
| US20220067238A1 (en)* | 2020-08-31 | 2022-03-03 | Siemens Aktiengesellschaft | Computer-implemented method and computerized device for testing a technical system |
Families Citing this family (37)
| Publication number | Priority date | Publication date | Assignee | Title |
|---|---|---|---|---|
| US8171343B2 (en)* | 2009-06-16 | 2012-05-01 | Oracle International Corporation | Techniques for determining models for performing diagnostics |
| US8417656B2 (en)* | 2009-06-16 | 2013-04-09 | Oracle International Corporation | Techniques for building an aggregate model for performing diagnostics |
| FR2947080A1 (en)* | 2009-06-22 | 2010-12-24 | Peugeot Citroen Automobiles Sa | System i.e. headlight, operational safety controlling method for motor vehicle, involves identifying set of potential causes with levels of criticality of fault mode in data structure, and examining levels of criticality |
| US8612377B2 (en)* | 2009-12-17 | 2013-12-17 | Oracle International Corporation | Techniques for generating diagnostic results |
| JP5880866B2 (en)* | 2010-04-22 | 2016-03-09 | 日本電気株式会社 | Method, system, and program for failure tree analysis of runtime system |
| JP5334140B2 (en)* | 2011-09-27 | 2013-11-06 | ジヤトコ株式会社 | FT diagram creation support device and FT diagram creation support program |
| FR2989499B1 (en)* | 2012-04-12 | 2014-05-16 | Airbus Operations Sas | METHOD, DEVICES AND COMPUTER PROGRAM FOR PREVENTIVE DIAGNOSTIC ASSISTANCE OF A SYSTEM OF AN AIRCRAFT USING REDUCED EVENT GRAPHICS |
| US20130317780A1 (en)* | 2012-05-23 | 2013-11-28 | General Electric Company | Probability of failure on demand calculation using fault tree approach for safety integrity level analysis |
| TWI453665B (en)* | 2012-06-15 | 2014-09-21 | Univ Nat Kaohsiung 1St Univ Sc | Event Analysis System of Mystery Tree and Its Analytical Method |
| CN103577672B (en)* | 2012-08-01 | 2016-12-21 | 王振华 | Fault event analysis system and its analysis method |
| US20140359366A1 (en)* | 2013-05-28 | 2014-12-04 | Jean-Pascal Schwinn | Method and Engineering Apparatus for Performing a Three-Dimensional Analysis of a Technical System |
| JP6287274B2 (en)* | 2014-01-31 | 2018-03-07 | 富士通株式会社 | Monitoring device, monitoring method and monitoring program |
| EP3059676B1 (en)* | 2015-02-20 | 2019-09-11 | Siemens Aktiengesellschaft | A method and apparatus for analyzing the availability of a system, in particular of a safety critical system |
| US20160327607A1 (en)* | 2015-05-06 | 2016-11-10 | Airbus Operations Limited | Methods and systems for transforming fault tree diagrams of engineering systems |
| CN104898039B (en)* | 2015-05-27 | 2017-09-12 | 电子科技大学 | Fault mode method for optimizing based on probability of failure propagation model |
| EP3151122A1 (en)* | 2015-10-02 | 2017-04-05 | Siemens Aktiengesellschaft | Method and apparatus for generating a fault tree |
| EP3570130B1 (en)* | 2018-05-15 | 2020-12-16 | Siemens Industry Software NV | Ring-closures in fault trees |
| EP3579074B1 (en)* | 2018-06-07 | 2021-01-06 | Siemens Aktiengesellschaft | Computer-implemented method and device for resolving closed loops in automatic fault tree analysis of a multi-component system |
| US20200073781A1 (en)* | 2018-08-29 | 2020-03-05 | Salesforce.Com, Inc. | Systems and methods of injecting fault tree analysis data into distributed tracing visualizations |
| EP3671384A1 (en)* | 2018-12-18 | 2020-06-24 | Siemens Aktiengesellschaft | Computer-implemented method for generating a mixed-layer fault tree of a multi-component system combining different layers of abstraction |
| CN110222927A (en)* | 2019-04-29 | 2019-09-10 | 南京航空航天大学 | A kind of civil aircraft multiple faults risk identification assessment calculation method |
| US20200394576A1 (en)* | 2019-06-11 | 2020-12-17 | At&T Intellectual Property I, L.P. | Machine Learning-Enabled Event Tree for Rapid and Accurate Customer Problem Resolution |
| CN110502808B (en)* | 2019-08-02 | 2022-11-04 | 中国航空无线电电子研究所 | SysML-oriented system security analysis method and device |
| CN111008310B (en)* | 2019-12-11 | 2023-08-25 | 北京航空航天大学 | Intermittent working logic gate without considering maintenance and fault tree simulation method thereof |
| CN111160583B (en)* | 2019-12-31 | 2024-08-27 | 联想(北京)有限公司 | Data processing method and device |
| CN111598467A (en)* | 2020-05-20 | 2020-08-28 | 中国石油大学(华东) | A reliability evaluation method and system for gathering and transportation combined station and key equipment |
| CN113807083B (en)* | 2020-06-11 | 2025-02-25 | 应急管理部化学品登记中心 | Similarity calculation and extraction method of petrochemical accident investigation report based on fault tree and event diagram |
| CN111859492B (en)* | 2020-07-17 | 2023-10-17 | 北京唯实兴邦科技有限公司 | Simulink hazard occurrence and propagation analysis method based on MAPS fault comprehensive analysis tool |
| CN112416644A (en)* | 2020-11-30 | 2021-02-26 | 中国航空工业集团公司西安航空计算技术研究所 | Quick fault positioning method for airborne computer |
| CN112733453B (en)* | 2021-01-13 | 2024-03-29 | 新奥新智科技有限公司 | Equipment predictive maintenance method and device based on joint learning |
| CN114443856B (en)* | 2022-01-12 | 2025-03-07 | 北京轩宇空间科技有限公司 | A method and device for automatically creating a fault knowledge graph of a fault tree image |
| US12189467B2 (en)* | 2022-02-04 | 2025-01-07 | Hub data security Ltd. | Method to improve accuracy in fault tree analysis (FTA) |
| CN115167358A (en)* | 2022-07-14 | 2022-10-11 | 中铁第四勘察设计院集团有限公司 | A fault diagnosis method, device, system and storage medium |
| CN115935516B (en)* | 2022-12-20 | 2025-06-06 | 成都飞机工业(集团)有限责任公司 | A method for constructing a fault tree for complex equipment system assembly |
| CN116071039B (en)* | 2022-12-21 | 2024-01-19 | 广州辰创科技发展有限公司 | Fault diagnosis method based on fault tree |
| CN116992958B (en)* | 2023-09-27 | 2024-03-12 | 中国长江电力股份有限公司 | Method for automatically generating FTA real-time dynamic tree based on fault knowledge base |
| CN119962363B (en)* | 2025-01-10 | 2025-10-03 | 中国航空综合技术研究所 | FMES data generation method and system for safety analysis of airborne system |
Citations (18)
| Publication number | Priority date | Publication date | Assignee | Title |
|---|---|---|---|---|
| US4849900A (en) | 1986-05-02 | 1989-07-18 | The Boeing Company | Flight control system and method |
| US4870575A (en) | 1987-10-01 | 1989-09-26 | Itt Corporation | System integrated fault-tree analysis methods (SIFTAN) |
| JPH05143570A (en) | 1991-11-19 | 1993-06-11 | Nippon Telegr & Teleph Corp <Ntt> | How to create a fault tree |
| US5369756A (en) | 1990-01-18 | 1994-11-29 | Hitachi, Ltd. | Fault tree displaying method and process diagnosis support system |
| US5561762A (en)* | 1995-06-06 | 1996-10-01 | Union Switch & Signal Inc. | Malicious fault list generation method |
| US5699403A (en)* | 1995-04-12 | 1997-12-16 | Lucent Technologies Inc. | Network vulnerability management apparatus and method |
| US5722620A (en) | 1995-05-15 | 1998-03-03 | The Boeing Company | Aircraft pitch-axis stability and command augmentation |
| JP2000194561A (en) | 1998-12-25 | 2000-07-14 | Toshiba Corp | Fault tree creation device and method, and recording medium recording fault tree creation software |
| US6125453A (en)* | 1998-06-30 | 2000-09-26 | Sandia Corporation | Cut set-based risk and reliability analysis for arbitrarily interconnected networks |
| US20020066829A1 (en) | 1999-12-02 | 2002-06-06 | Boeing Company | Aircraft tailstrike avoidance system |
| US20040143561A1 (en) | 2002-11-14 | 2004-07-22 | Jensen Finn Verner | Method for problem solving in technical systems with redundant components and computer system for performing the method |
| US6820044B2 (en) | 2001-10-09 | 2004-11-16 | University Of Maryland | Method and apparatus for a common-cause failure module for probabilistic risk assessment tools |
| US7013411B2 (en) | 2000-01-29 | 2006-03-14 | Abb Research Ltd. | Method for the automated generation of a fault tree structure |
| US7017080B1 (en) | 1999-06-02 | 2006-03-21 | Siemens Aktiengesellschaft | Method and system for determining a fault tree of a technical system, computer program product and a computer readable storage medium |
| US7200525B1 (en)* | 2004-06-29 | 2007-04-03 | Sun Microsystems, Inc. | System and method for generating a data structure representative of a fault tree |
| US20090083014A1 (en)* | 2007-09-07 | 2009-03-26 | Deutsches Zentrum Fuer Luft-Und Raumfahrt E.V. | Method for analyzing the reliability of technical installations with the use of physical models |
| US20090106593A1 (en)* | 2005-01-19 | 2009-04-23 | Zigmund Bluvband | System and Method for Bouncing Failure Analysis |
| US7526391B2 (en)* | 2006-12-14 | 2009-04-28 | Bickel Jon A | Method and apparatus to evaluate transient characteristics in an electrical power system |
- 2007
- 2007-09-20USUS11/858,146patent/US7681086B2/ennot_activeExpired - Fee Related
Patent Citations (18)
| Publication number | Priority date | Publication date | Assignee | Title |
|---|---|---|---|---|
| US4849900A (en) | 1986-05-02 | 1989-07-18 | The Boeing Company | Flight control system and method |
| US4870575A (en) | 1987-10-01 | 1989-09-26 | Itt Corporation | System integrated fault-tree analysis methods (SIFTAN) |
| US5369756A (en) | 1990-01-18 | 1994-11-29 | Hitachi, Ltd. | Fault tree displaying method and process diagnosis support system |
| JPH05143570A (en) | 1991-11-19 | 1993-06-11 | Nippon Telegr & Teleph Corp <Ntt> | How to create a fault tree |
| US5699403A (en)* | 1995-04-12 | 1997-12-16 | Lucent Technologies Inc. | Network vulnerability management apparatus and method |
| US5722620A (en) | 1995-05-15 | 1998-03-03 | The Boeing Company | Aircraft pitch-axis stability and command augmentation |
| US5561762A (en)* | 1995-06-06 | 1996-10-01 | Union Switch & Signal Inc. | Malicious fault list generation method |
| US6125453A (en)* | 1998-06-30 | 2000-09-26 | Sandia Corporation | Cut set-based risk and reliability analysis for arbitrarily interconnected networks |
| JP2000194561A (en) | 1998-12-25 | 2000-07-14 | Toshiba Corp | Fault tree creation device and method, and recording medium recording fault tree creation software |
| US7017080B1 (en) | 1999-06-02 | 2006-03-21 | Siemens Aktiengesellschaft | Method and system for determining a fault tree of a technical system, computer program product and a computer readable storage medium |
| US20020066829A1 (en) | 1999-12-02 | 2002-06-06 | Boeing Company | Aircraft tailstrike avoidance system |
| US7013411B2 (en) | 2000-01-29 | 2006-03-14 | Abb Research Ltd. | Method for the automated generation of a fault tree structure |
| US6820044B2 (en) | 2001-10-09 | 2004-11-16 | University Of Maryland | Method and apparatus for a common-cause failure module for probabilistic risk assessment tools |
| US20040143561A1 (en) | 2002-11-14 | 2004-07-22 | Jensen Finn Verner | Method for problem solving in technical systems with redundant components and computer system for performing the method |
| US7200525B1 (en)* | 2004-06-29 | 2007-04-03 | Sun Microsystems, Inc. | System and method for generating a data structure representative of a fault tree |
| US20090106593A1 (en)* | 2005-01-19 | 2009-04-23 | Zigmund Bluvband | System and Method for Bouncing Failure Analysis |
| US7526391B2 (en)* | 2006-12-14 | 2009-04-28 | Bickel Jon A | Method and apparatus to evaluate transient characteristics in an electrical power system |
| US20090083014A1 (en)* | 2007-09-07 | 2009-03-26 | Deutsches Zentrum Fuer Luft-Und Raumfahrt E.V. | Method for analyzing the reliability of technical installations with the use of physical models |
Non-Patent Citations (37)
| Title |
|---|
| "How to choose an Attitude Sensor, Application Notes on Watson's Inertial Sensors," Watson Industries Ltd., Romsey, Hampshire, 8 pages. |
| Assaf, Tariq et al., "Diagnostic Expert Systems from Dynamic Fault Trees," University of Virginia, Charlottesville, 2004RM-060: pp. 1-6 (2004). |
| Bechta, Joanne et al., "Developing a high-quality software tool for fault tree analysis," In Proceedings of the International Symposium on Software Reliability Engineering, pp. 222-231, Boca Raton, Florida (Nov. 1-4, 1999). |
| Bechta, Joanne et al., "Developing a low-cost, high-quality software tool for dynamic fault tree analysis," Transactions on Reliability, pp. 49-59 (Dec. 1999). |
| Brown, Kevin. "Evaluating Fault Trees (and & or Gates Only) with Repeated Events", IEEE Transactions on Reliability, vol. 39, No. 2, pp. 226-235 (1990). |
| Coppit, David et al., "Formal Semantics of Models for Computational Engineering: A Case Study on Dynamic Fault Trees," Proceedings of the International Symposium on Software Reliability Engineering, pp. 270-282, San Jose, California (Oct. 8-11, 2000). |
| Coppit, David et al., "Formal specification in collaborative design of critical software tools," In Proceedings Third IEEE International High-Assurance Systems Engineering Symposium, pp. 13-20, Washington, D.C. (Nov. 13-14, 1998). |
| Coppit, David et al., "Multiple mass-market applications as components," In Proceedings of the 22nd International Conference on Software Engineering, pp. 273-282, Limerick, Ireland (Jun. 4-11, 2000). |
| Goodrich Sensor Systems, Angle of Attack Systems, Goodrich Corporation, Burnsville, MN (Mar. 2002). |
| Henry, J.J., Andrews, J.D. "Computerized Fault Tree Construction For A Train Braking System", Quality and Reliability Engineering International, vol. 13 No. 5 pp. 299-309 (1997). |
| Hong Xu and Joanne Bechta Dugan, "Combining Dynamic Fault Trees and Event Trees for Probabilistic Risk Assessment," In Annual Reliability and Maintainability Symposium 2004 Proceedings, LA (Jan. 2004). |
| Isograph, "Fault Tree Analysis Software", Publication date: 2005.* |
| Joanne Bechta Dugan and Tariq S. Assaf, "Dynamic Fault Tree Analysis of a Reconfigurable Software System," The 19th International System Safety Conference, Huntsville, Alabama (Sep. 2001). |
| Joanne Bechta Dugan, Bharath Venkataraman, and Rohit Gulati. DIFTree: A software package for the analysis of dynamic fault tree models., In Annual Reliability and Maintainability Symposium 1997 Proceedings, Philadelphia, PA (Jan. 13-16, 1997). |
| Kaiser, Bernhard et al., "A New Component Concept for Fault Trees," 8th Australian Workshop on Safety Critical Systems and Software (SCS'03), Canberra (2003). |
| Leila Meshkat, Joanne Bechta Dugan, and John D. Andrews, "Analysis of safety systems with on-demand and dynamic failure modes," University of Virginia, Charlottesville, 2000RM-115: p. 1-9 (2000). |
| Papazoglou, Ioannis A., "Functional Block Diagrams and Automated Construction of Event Trees", Reliability Engineering and Systems Safety, vol. 61, pp. 185-214 (1998). |
| Ragavan Manian, David W. Coppit, Kevin J. Sullivan, and Joanne Bechta Dugan., "Bridging the gap between systems and dynamic fault tree models," In Annual Reliability and Maintainability Symposium 1999 Proceedings, pp. 105-111, Washington, DC, USA (Jan. 18-21, 1999). |
| Ragavan Manian, Joanne Bechta Dugan, David Coppit, and Kevin Sullivan, "Combining various solution techniques for dynamic fault tree analysis of computer systems," In Proceedings Third IEEE International High-Assurance Systems Engineering Symposium, pp. 21-28, Washington, D.C. (Nov. 13-14, 1998). |
| Remenyte, R., Andrews, J.D., "A Simple Component Connection Approach for Fault Tree Conversion to Binary Decision Diagram", IEEE Computer Society, Proceedings of the First Conference on Availability, Reliability and Security (ARES '06) (Sep. 2006). |
| SAE, The Engineering Society for Advancing Mobility Land Sea Air and Space International, Aerospace Recommended Practice, "Guidelines and Methods for Conducting the Safety Assessment Process on Civil Airborne Systems and Equipment," ARP4761 (Dec. 1996). |
| Scott, Jeff, Aerospace.org, "Ask Us-Angle of Attack and Pitch Angle," 6 pages (Feb. 29, 2004). |
| Sinnamon, Roslyn, Andrews, John., "Fault Tree Analysis and Binary Decision Diagrams", 1996 Proceeding Annual Reliability and Maintainability Symposium, pp. 215-222 (1996). |
| Sullivan, Kevin et al., "The Galileo fault tree analysis tool," In Proceedings of the 29th Annual International Symposium on Fault-Tolerant Computing, pp. 232-235, Madison, Wisconsin (Jun. 15-18, 1999). |
| Sullivan, Kevin J. et al., "The Galileo Fault Tree Analysis Tool," University of Virginia, Charlottesville (2003). |
| Sun, H., Andrews, J.D., "Identification of Independent Modules in Fault Trees which contain Dependent Basic Events", Reliability Engineering and Systems Safety, vol. 86, pp. 285-296 (2004). |
| Swaminathan, S., Smidts, C., "The Event Sequence Diagram Framework For Dynamic Probabilistic Risk Assessment", Reliability Engineering and Systems Safety, vol. 63 pp. 73-79 (1999). |
| Systems and Reliability Research Office of Nuclear Regulatory Research, U.S. Nuclear Regulatory Commission, NUREG-0492, Fault Tree Handbook, Washington D.C. (Jan. 1981). |
| Tang, Zhihua et al., University of Virginia, Charlottesville, "An Integrated Method for Incorporating Common Cause Failures in System Analysis" (Jan. 2004). |
| Tang, Zhihua et al., University of Virginia, Charlottesville, "Minimal Cut Set/Sequence Generation for Dynamic Fault Trees" (Jan. 2004). |
| Tariq Assaf and Joanne Bechta Dugan "Diagnostic Expert Systems from Dynamic Fault Trees," In Annual Reliability and Maintainability Symposium 2004 Proceedings, LA (Jan. 2004). |
| Tariq Assaf and Joanne Bechta Dugan, "Automatic generation of Diagnostic Expert Systems from Fault Trees," In Annual Reliability and Maintainability Symposium 2003 Proceedings, Tampa, FL (Jan. 2003). |
| Vemuri, K.K. et al., "A Design Language for Automatic Synthesis of Fault Trees," Proceedings Annual Reliability and Maintainability Symposium, pp. 91-96 (1999). |
| Wang, J.D. "A Component Behavioural Model For Automatic Fault-Tree Construction", Reliability Engineering & System Safety UK, vol. 42, No. 1, pp. 87-100 (1993). |
| Yong Ou and Joanne Bechta Dugan, "Sensitivity Analysis of Modular Dynamic Fault Trees," IEEE International Computer Performance and Dependability Symposium (Mar. 2000). |
| Zhihua Tang and Joanne Bechta Dugan, "An Integrated Method for Incorporating Common Cause Failures in System Analysis," In Annual Reliability and Maintainability Symposium 2004 Proceedings, LA (Jan. 2004). |
| Zhihua Tang and Joanne Bechta Dugan, "Minimal Cut Set/Sequence Generation for Dynamic fault Trees," In Annual Reliability and Maintainability Symposium 2004 Proceedings, LA (Jan. 2004). |
Cited By (23)
| Publication number | Priority date | Publication date | Assignee | Title |
|---|---|---|---|---|
| US20090105991A1 (en)* | 2007-10-19 | 2009-04-23 | Oracle International Corporation | Rule-based engine for gathering diagnostic data |
| US20090106262A1 (en)* | 2007-10-19 | 2009-04-23 | Oracle International Corporation | Scrubbing and editing of diagnostic data |
| US20090105982A1 (en)* | 2007-10-19 | 2009-04-23 | Oracle International Corporation | Diagnosability system: flood control |
| US7937623B2 (en) | 2007-10-19 | 2011-05-03 | Oracle International Corporation | Diagnosability system |
| US7941707B2 (en) | 2007-10-19 | 2011-05-10 | Oracle International Corporation | Gathering information for use in diagnostic data dumping upon failure occurrence |
| US8255182B2 (en) | 2007-10-19 | 2012-08-28 | Oracle International Corporation | Diagnosability system: flood control |
| US20090106589A1 (en)* | 2007-10-19 | 2009-04-23 | Oracle International Corporation | Gathering context information used for activation of contextual dumping |
| US20100174388A1 (en)* | 2009-01-02 | 2010-07-08 | Ferreira David A | Live Device Graphical Status Tree |
| US20100318853A1 (en)* | 2009-06-16 | 2010-12-16 | Oracle International Corporation | Techniques for gathering evidence for performing diagnostics |
| US9266626B2 (en)* | 2012-04-12 | 2016-02-23 | Airbus Operations (S.A.S.) | Method, devices and program for computer-aided analysis of the failure tolerance of an aircraft system, using critical event charts |
| US20130274991A1 (en)* | 2012-04-12 | 2013-10-17 | Airbus Operations (Sas) | Method, devices and program for computer-aided analysis of the failure tolerance of an aircraft system, using critical event charts |
| US20130339795A1 (en)* | 2012-06-15 | 2013-12-19 | The Boeing Company | Failure Analysis Validation And Visualization |
| US10539955B2 (en)* | 2012-06-15 | 2020-01-21 | The Boeing Company | Failure analysis validation and visualization |
| US9430311B2 (en) | 2013-07-23 | 2016-08-30 | Halliburton Energy Services, Inc. | Cause and effect mapping for failure mode effect analysis creation and risk management |
| US9852232B2 (en) | 2013-11-08 | 2017-12-26 | International Business Machines Corporation | Automating event trees using analytics |
| US20160266952A1 (en)* | 2015-03-10 | 2016-09-15 | Kai Höfig | Automated Qualification of a Safety Critical System |
| US10241852B2 (en)* | 2015-03-10 | 2019-03-26 | Siemens Aktiengesellschaft | Automated qualification of a safety critical system |
| US10061670B2 (en)* | 2015-12-28 | 2018-08-28 | Siemens Aktiengesellschaft | Method and apparatus for automatically generating a component fault tree of a safety-critical system |
| US11079749B2 (en)* | 2016-06-21 | 2021-08-03 | Siemens Aktiengesellschaft | Method and apparatus for automated hazard detection |
| US10572331B2 (en)* | 2016-07-15 | 2020-02-25 | Siemens Aktiengesellschaft | Method and apparatus for a computer-based generation of component fault trees |
| CN110517369A (en)* | 2019-08-23 | 2019-11-29 | 中国航空无线电电子研究所 | Fault tree construction method and system based on mind map |
| CN110517369B (en)* | 2019-08-23 | 2021-04-23 | 中国航空无线电电子研究所 | Fault tree construction method and system based on mind map |
| US20220067238A1 (en)* | 2020-08-31 | 2022-03-03 | Siemens Aktiengesellschaft | Computer-implemented method and computerized device for testing a technical system |
Also Published As
| Publication number | Publication date |
|---|---|
| US20090083576A1 (en) | 2009-03-26 |
Similar Documents
| Publication | Publication Date | Title |
|---|---|---|
| US7681086B2 (en) | Fault tree map generation | |
| AU2014202578B2 (en) | System and method for assessing cumulative effects of a failure | |
| Stanton et al. | Predicting pilot error: testing a new methodology and a multi-methods and analysts approach | |
| Pham | Software reliability | |
| CN103514079B (en) | Fault analysis validation and visualization method and apparatus | |
| US20090012631A1 (en) | Automation safety life cycle | |
| CA2857923A1 (en) | Safety analysis of a complex system using component-oriented fault trees | |
| Jiménez et al. | Checklists for compliance to DO-178C and DO-278A standards | |
| Wang | Civil aircraft electrical power system safety assessment: issues and practices | |
| Hassan et al. | Operator response modeling and human error probability in TRIGA Mark II research reactor probabilistic safety assessment | |
| Tribble et al. | Software safety analysis of a flight management system vertical navigation function-a status report | |
| GB2510253A (en) | Evaluating the operating dependability of a complex system | |
| Reiser et al. | The Functional Resonance Analysis Method (FRAM) on Aviation: A Systematic Review | |
| Julius et al. | Next Generation Human Reliability Analysis–Addressing Future Needs Today for Digital Control Systems | |
| Park et al. | Safety analysis of safety-critical software for nuclear digital protection system | |
| Ramos et al. | Phoenix HRA Methodology: Preliminary Investigation for Digital Control Rooms, Explicit Time Treatment, and Future Extensions | |
| Groth et al. | A model-based approach to HRA: example application and quantitative analysis | |
| Thomas et al. | An innovative and automated solution for NERC PRC-027-1 compliance | |
| Scaife | Human factors in risk management | |
| Bao et al. | Light Water Reactor Sustainability Program | |
| Bieber et al. | Aircraft Safety Model Development and Integration in a Risk Observatory | |
| Saraiva et al. | A Study on Application of SPAR-H Method for Human Reliability Analysis of an Electric-electronic System of a Mechanism for Moving a Nuclear Fuel Irradiation Capsule | |
| Rashid | An Architecture-centric Approach to Safety Critical Software Product Lines | |
| Hesselink | A comparison of standards for software engineering based on DO-178B for certification of avionics systems | |
| Sakugawa et al. | Airborne software concerns in civil aviation certification |
Legal Events
| Date | Code | Title | Description |
|---|---|---|---|
| AS | Assignment | Owner name:EMBRAER - EMPRESA BRASILEIRA DE AERONAUTICA S.A., Free format text:ASSIGNMENT OF ASSIGNORS INTEREST;ASSIGNORS:VLASSOVA, OLGA ALEXANDROVNA;BAKOWSKI, ANTONIO;CARDOSO, JAURES, JR;AND OTHERS;REEL/FRAME:019868/0459;SIGNING DATES FROM 20070910 TO 20070914 Owner name:EMBRAER - EMPRESA BRASILEIRA DE AERONAUTICA S.A.,B Free format text:ASSIGNMENT OF ASSIGNORS INTEREST;ASSIGNORS:VLASSOVA, OLGA ALEXANDROVNA;BAKOWSKI, ANTONIO;CARDOSO, JAURES, JR;AND OTHERS;SIGNING DATES FROM 20070910 TO 20070914;REEL/FRAME:019868/0459 | |
| STCF | Information on status: patent grant | Free format text:PATENTED CASE | |
| AS | Assignment | Owner name:EMBRAER S.A., BRAZIL Free format text:CHANGE OF NAME;ASSIGNOR:EMBRAER - EMPRESA BRASILEIRA DE AERONAUTICA S.A.;REEL/FRAME:028363/0062 Effective date:20101119 | |
| FPAY | Fee payment | Year of fee payment:4 | |
| MAFP | Maintenance fee payment | Free format text:PAYMENT OF MAINTENANCE FEE, 8TH YEAR, LARGE ENTITY (ORIGINAL EVENT CODE: M1552) Year of fee payment:8 | |
| FEPP | Fee payment procedure | Free format text:MAINTENANCE FEE REMINDER MAILED (ORIGINAL EVENT CODE: REM.); ENTITY STATUS OF PATENT OWNER: LARGE ENTITY | |
| LAPS | Lapse for failure to pay maintenance fees | Free format text:PATENT EXPIRED FOR FAILURE TO PAY MAINTENANCE FEES (ORIGINAL EVENT CODE: EXP.); ENTITY STATUS OF PATENT OWNER: LARGE ENTITY | |
| STCH | Information on status: patent discontinuation | Free format text:PATENT EXPIRED DUE TO NONPAYMENT OF MAINTENANCE FEES UNDER 37 CFR 1.362 | |
| FP | Lapsed due to failure to pay maintenance fee | Effective date:20220316 |