US7626696B2 - Method and apparatus for reconfigurable field of view in a FAST-based imaging system - Google Patents
Method and apparatus for reconfigurable field of view in a FAST-based imaging systemDownload PDFInfo
- Publication number
- US7626696B2 US7626696B2US11/890,517US89051707AUS7626696B2US 7626696 B2US7626696 B2US 7626696B2US 89051707 AUS89051707 AUS 89051707AUS 7626696 B2US7626696 B2US 7626696B2
- Authority
- US
- United States
- Prior art keywords
- optical
- dataset
- spectrometer
- fibers
- sample
- Prior art date
- Legal status (The legal status is an assumption and is not a legal conclusion. Google has not performed a legal analysis and makes no representation as to the accuracy of the status listed.)
- Active, expires
Links
- 238000000034methodMethods0.000titleclaimsabstractdescription21
- 238000003384imaging methodMethods0.000titleabstractdescription17
- 230000003287optical effectEffects0.000claimsabstractdescription152
- 239000000835fiberSubstances0.000claimsabstractdescription117
- 230000003595spectral effectEffects0.000claimsabstractdescription24
- 238000003491arrayMethods0.000claimsabstractdescription5
- 239000013307optical fiberSubstances0.000claimsdescription103
- 230000007246mechanismEffects0.000claimsdescription21
- 238000004891communicationMethods0.000claimsdescription10
- 238000005286illuminationMethods0.000claimsdescription9
- 238000001069Raman spectroscopyMethods0.000claimsdescription7
- 238000013480data collectionMethods0.000claimsdescription6
- 238000004611spectroscopical analysisMethods0.000claimsdescription4
- 230000007274generation of a signal involved in cell-cell signalingEffects0.000claims4
- 238000004020luminiscence typeMethods0.000claims1
- 238000000701chemical imagingMethods0.000abstractdescription15
- 230000003213activating effectEffects0.000abstractdescription2
- 238000013519translationMethods0.000description6
- 238000003332Raman imagingMethods0.000description4
- 230000008569processEffects0.000description4
- 238000001228spectrumMethods0.000description4
- 238000013507mappingMethods0.000description3
- 239000000463materialSubstances0.000description3
- 238000001237Raman spectrumMethods0.000description2
- 238000004458analytical methodMethods0.000description2
- 238000006243chemical reactionMethods0.000description2
- 239000013626chemical specieSubstances0.000description2
- 230000000694effectsEffects0.000description2
- 238000012544monitoring processMethods0.000description2
- 238000002360preparation methodMethods0.000description2
- 102100025490Slit homolog 1 proteinHuman genes0.000description1
- 101710123186Slit homolog 1 proteinProteins0.000description1
- 102100027340Slit homolog 2 proteinHuman genes0.000description1
- 101710133576Slit homolog 2 proteinProteins0.000description1
- 230000004913activationEffects0.000description1
- 238000013459approachMethods0.000description1
- 238000012512characterization methodMethods0.000description1
- 238000005253claddingMethods0.000description1
- 238000003759clinical diagnosisMethods0.000description1
- 239000011247coating layerSubstances0.000description1
- 238000010276constructionMethods0.000description1
- IDLFZVILOHSSID-OVLDLUHVSA-NcorticotropinChemical compoundC([C@@H](C(=O)N[C@@H](CO)C(=O)N[C@@H](CCSC)C(=O)N[C@@H](CCC(O)=O)C(=O)N[C@@H](CC=1NC=NC=1)C(=O)N[C@@H](CC=1C=CC=CC=1)C(=O)N[C@@H](CCCNC(N)=N)C(=O)N[C@@H](CC=1C2=CC=CC=C2NC=1)C(=O)NCC(=O)N[C@@H](CCCCN)C(=O)N1[C@@H](CCC1)C(=O)N[C@@H](C(C)C)C(=O)NCC(=O)N[C@@H](CCCCN)C(=O)N[C@@H](CCCCN)C(=O)N[C@@H](CCCNC(N)=N)C(=O)N[C@@H](CCCNC(N)=N)C(=O)N1[C@@H](CCC1)C(=O)N[C@@H](C(C)C)C(=O)N[C@@H](CCCCN)C(=O)N[C@@H](C(C)C)C(=O)N[C@@H](CC=1C=CC(O)=CC=1)C(=O)N1[C@@H](CCC1)C(=O)N[C@@H](CC(N)=O)C(=O)NCC(=O)N[C@@H](C)C(=O)N[C@@H](CCC(O)=O)C(=O)N[C@@H](CC(O)=O)C(=O)N[C@@H](CCC(O)=O)C(=O)N[C@@H](CO)C(=O)N[C@@H](C)C(=O)N[C@@H](CCC(O)=O)C(=O)N[C@@H](C)C(=O)N[C@@H](CC=1C=CC=CC=1)C(=O)N1[C@@H](CCC1)C(=O)N[C@@H](CC(C)C)C(=O)N[C@@H](CCC(O)=O)C(=O)N[C@@H](CC=1C=CC=CC=1)C(O)=O)NC(=O)[C@@H](N)CO)C1=CC=C(O)C=C1IDLFZVILOHSSID-OVLDLUHVSA-N0.000description1
- 230000007547defectEffects0.000description1
- 201000010099diseaseDiseases0.000description1
- 208000037265diseases, disorders, signs and symptomsDiseases0.000description1
- 230000005284excitationEffects0.000description1
- 238000002073fluorescence micrographMethods0.000description1
- 238000000799fluorescence microscopyMethods0.000description1
- 230000012447hatchingEffects0.000description1
- 230000003993interactionEffects0.000description1
- 239000004973liquid crystal related substanceSubstances0.000description1
- 238000012986modificationMethods0.000description1
- 230000004048modificationEffects0.000description1
- 238000012634optical imagingMethods0.000description1
- 230000002093peripheral effectEffects0.000description1
- 238000003908quality control methodMethods0.000description1
- 230000008707rearrangementEffects0.000description1
- 238000011160researchMethods0.000description1
- 238000000926separation methodMethods0.000description1
- 230000008054signal transmissionEffects0.000description1
- 239000000126substanceSubstances0.000description1
- 238000000411transmission spectrumMethods0.000description1
- 238000002834transmittanceMethods0.000description1
- 238000013316zoningMethods0.000description1
Images


Classifications
- G—PHYSICS
- G01—MEASURING; TESTING
- G01J—MEASUREMENT OF INTENSITY, VELOCITY, SPECTRAL CONTENT, POLARISATION, PHASE OR PULSE CHARACTERISTICS OF INFRARED, VISIBLE OR ULTRAVIOLET LIGHT; COLORIMETRY; RADIATION PYROMETRY
- G01J3/00—Spectrometry; Spectrophotometry; Monochromators; Measuring colours
- G01J3/28—Investigating the spectrum
- G01J3/44—Raman spectrometry; Scattering spectrometry ; Fluorescence spectrometry
- G—PHYSICS
- G01—MEASURING; TESTING
- G01J—MEASUREMENT OF INTENSITY, VELOCITY, SPECTRAL CONTENT, POLARISATION, PHASE OR PULSE CHARACTERISTICS OF INFRARED, VISIBLE OR ULTRAVIOLET LIGHT; COLORIMETRY; RADIATION PYROMETRY
- G01J3/00—Spectrometry; Spectrophotometry; Monochromators; Measuring colours
- G01J3/02—Details
- G01J3/0202—Mechanical elements; Supports for optical elements
- G—PHYSICS
- G01—MEASURING; TESTING
- G01J—MEASUREMENT OF INTENSITY, VELOCITY, SPECTRAL CONTENT, POLARISATION, PHASE OR PULSE CHARACTERISTICS OF INFRARED, VISIBLE OR ULTRAVIOLET LIGHT; COLORIMETRY; RADIATION PYROMETRY
- G01J3/00—Spectrometry; Spectrophotometry; Monochromators; Measuring colours
- G01J3/02—Details
- G01J3/0205—Optical elements not provided otherwise, e.g. optical manifolds, diffusers, windows
- G01J3/0218—Optical elements not provided otherwise, e.g. optical manifolds, diffusers, windows using optical fibers
- G01J3/0221—Optical elements not provided otherwise, e.g. optical manifolds, diffusers, windows using optical fibers the fibers defining an entry slit
- G—PHYSICS
- G01—MEASURING; TESTING
- G01J—MEASUREMENT OF INTENSITY, VELOCITY, SPECTRAL CONTENT, POLARISATION, PHASE OR PULSE CHARACTERISTICS OF INFRARED, VISIBLE OR ULTRAVIOLET LIGHT; COLORIMETRY; RADIATION PYROMETRY
- G01J3/00—Spectrometry; Spectrophotometry; Monochromators; Measuring colours
- G01J3/02—Details
- G01J3/0205—Optical elements not provided otherwise, e.g. optical manifolds, diffusers, windows
- G01J3/0237—Adjustable, e.g. focussing
- G—PHYSICS
- G01—MEASURING; TESTING
- G01J—MEASUREMENT OF INTENSITY, VELOCITY, SPECTRAL CONTENT, POLARISATION, PHASE OR PULSE CHARACTERISTICS OF INFRARED, VISIBLE OR ULTRAVIOLET LIGHT; COLORIMETRY; RADIATION PYROMETRY
- G01J3/00—Spectrometry; Spectrophotometry; Monochromators; Measuring colours
- G01J3/02—Details
- G01J3/0289—Field-of-view determination; Aiming or pointing of a spectrometer; Adjusting alignment; Encoding angular position; Size of measurement area; Position tracking
- G—PHYSICS
- G01—MEASURING; TESTING
- G01J—MEASUREMENT OF INTENSITY, VELOCITY, SPECTRAL CONTENT, POLARISATION, PHASE OR PULSE CHARACTERISTICS OF INFRARED, VISIBLE OR ULTRAVIOLET LIGHT; COLORIMETRY; RADIATION PYROMETRY
- G01J3/00—Spectrometry; Spectrophotometry; Monochromators; Measuring colours
- G01J3/28—Investigating the spectrum
- G01J3/2823—Imaging spectrometer
- G—PHYSICS
- G01—MEASURING; TESTING
- G01N—INVESTIGATING OR ANALYSING MATERIALS BY DETERMINING THEIR CHEMICAL OR PHYSICAL PROPERTIES
- G01N21/00—Investigating or analysing materials by the use of optical means, i.e. using sub-millimetre waves, infrared, visible or ultraviolet light
- G01N21/62—Systems in which the material investigated is excited whereby it emits light or causes a change in wavelength of the incident light
- G01N21/63—Systems in which the material investigated is excited whereby it emits light or causes a change in wavelength of the incident light optically excited
- G01N21/64—Fluorescence; Phosphorescence
- G01N2021/6417—Spectrofluorimetric devices
- G01N2021/6423—Spectral mapping, video display
- G—PHYSICS
- G01—MEASURING; TESTING
- G01N—INVESTIGATING OR ANALYSING MATERIALS BY DETERMINING THEIR CHEMICAL OR PHYSICAL PROPERTIES
- G01N21/00—Investigating or analysing materials by the use of optical means, i.e. using sub-millimetre waves, infrared, visible or ultraviolet light
- G01N21/62—Systems in which the material investigated is excited whereby it emits light or causes a change in wavelength of the incident light
- G01N21/63—Systems in which the material investigated is excited whereby it emits light or causes a change in wavelength of the incident light optically excited
- G01N21/64—Fluorescence; Phosphorescence
- G01N21/645—Specially adapted constructive features of fluorimeters
- G01N2021/6484—Optical fibres
- G—PHYSICS
- G01—MEASURING; TESTING
- G01N—INVESTIGATING OR ANALYSING MATERIALS BY DETERMINING THEIR CHEMICAL OR PHYSICAL PROPERTIES
- G01N21/00—Investigating or analysing materials by the use of optical means, i.e. using sub-millimetre waves, infrared, visible or ultraviolet light
- G01N21/62—Systems in which the material investigated is excited whereby it emits light or causes a change in wavelength of the incident light
- G01N21/63—Systems in which the material investigated is excited whereby it emits light or causes a change in wavelength of the incident light optically excited
- G01N21/64—Fluorescence; Phosphorescence
- G01N21/645—Specially adapted constructive features of fluorimeters
- G01N21/6456—Spatial resolved fluorescence measurements; Imaging
- G—PHYSICS
- G01—MEASURING; TESTING
- G01N—INVESTIGATING OR ANALYSING MATERIALS BY DETERMINING THEIR CHEMICAL OR PHYSICAL PROPERTIES
- G01N21/00—Investigating or analysing materials by the use of optical means, i.e. using sub-millimetre waves, infrared, visible or ultraviolet light
- G01N21/62—Systems in which the material investigated is excited whereby it emits light or causes a change in wavelength of the incident light
- G01N21/63—Systems in which the material investigated is excited whereby it emits light or causes a change in wavelength of the incident light optically excited
- G01N21/65—Raman scattering
Definitions
- Chemical imaginghas a powerful capability for material characterization, process monitoring, quality control and disease-state determination. Chemical imaging combines chemical analysis with high-resolution optical imaging including optical spectroscopy, Raman imaging as well as fluorescent and IR techniques.
- Raman effectis a phenomenon in which a specimen scatters incident light of a given frequency into a spectrum which has lines caused by interaction of the incident light with the molecules making up the specimen. Different molecular species have different characteristic Raman spectra. Consequently, the Raman effect can be used to analyze the molecular species present in the sample.
- Raman chemical imagingprovides molecular-specific image contrast without the use of stains or dies. Raman image contrast arises from a material's intrinsic vibrational spectroscopic signature which is highly sensitive to the composition and structure of the sample as well as its local environment. As a result, Raman imaging can be performed with little or no sample preparation and is widely applicable for material research, failure analysis, process monitoring and clinical diagnosis.
- a chemical imaging system based on a tunable filterenables visualizing the distribution (morphology and architecture) of chemical species in heterogeneous samples with molecular compositional specificity.
- Raman imagescan be collected non-invasively with limited or no sample preparation, at high spatial resolution, and with high fidelity where the spatial fidelity is limited by the number of pixels of a charge coupled device (CCD) detector.
- CCDcharge coupled device
- every image pixelhas associated with it a Raman spectrum whose quality is comparable to that obtained with conventional non-imaging spectrometers.
- Chemical imagingsimultaneously provides image information on the size, shape and distribution (the image morphology) of molecular chemical species present within the sample.
- the two dimensions of the imageare recorded directly by a CCD camera while the multispectral information is acquired by capturing images at discrete wavelengths selected by the tunable filter, e.g., a liquid crystal tunable filter or LCTF.
- the tunable filtere.g., a liquid crystal tunable filter or LCTF.
- LCTFis an electro-optically controllable spectral bandpass filter which can function from the visible region to the near IR with a continuously tunable wavelength.
- an LCTFis free of image shift with tuning.
- LCTFshave noticeable drawbacks.
- LCTFshave a low peak transmittance.
- LCTFsare susceptible to thermally-induced drift in their spectral bandpass.
- the LCTFis free of optical distortions and spectral leakage; but in reality these defects always exist.
- LCTF systemsare costly. Therefore, it is desirable to address the signal loss (and, hence, loss of efficiency) issues associated with LCTFs.
- the disclosurerelates to an LCTF-less chemical imaging system with reconfigurable field of view (FOV).
- the systemcomprising a first optical transmitter for converting a first 2D optical dataset collected from a first 2D portion of a sample to a first 1D optical dataset; a second optical transmitter for converting a second 2D optical dataset collected from a second 2D portion of the sample to a second 1D optical dataset; and a switching mechanism for selectively communicating one of the first 1D optical dataset or the second 1D optical dataset to a spectrometer.
- a method disclosedcomprises converting a first 2D optical dataset depicting a first portion of a sample to a first 1D optical dataset, converting a second 2D optical dataset depicting a second portion of the sample to a second 1D optical dataset; and selectively communicating the first and the second 1D optical datasets to a spectrometer to obtain spectral data for the sample.
- An additional embodiment describedis a system comprising a switching mechanism having an input for receiving a plurality of 1D optical datasets from a plurality of optical fiber bundles; and a processor in communication with the switching mechanism and programmed with instructions for controlling the switching mechanism to select a first 1D optical dataset from one of the plurality of optical fiber bundles, to communicate the first 1D optical dataset to a spectrometer, to select a second 1D optical dataset from another of the plurality of optical fiber bundles, and to communicate the second optical 1D dataset to the spectrometer.
- a fiber bundlecomprises an optical signal input end formed by a plurality of optical fibers organized in a plurality of non-overlapping 2D zones, wherein each zone includes a predetermined number of fibers; and an optical signal output end formed by a plurality of zone-specific curvilinear arrays of optical fibers in the plurality of optical fibers, wherein each curvilinear array contains a 1D arrangement of a corresponding set of zone-specific fibers from the plurality of fibers.
- FIG. 1is a schematic representation of a prior art chemical imaging system
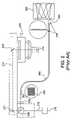
- FIG. 2shows a prior art FAST based system for implementing the representation of FIG. 1 ;
- FIG. 3shows a prior art substantially linear arrangement of fibers in an optical fiber's output port for communication with a spectrometer slit in the system of FIG. 2 ;
- FIG. 4shows a prior art arrangement of optical fibers at input and output ports of an optical fiber bundle in the system of FIG. 2 ;
- FIG. 5is a schematic representation of a chemical imaging system according to one embodiment of the present disclosure.
- FIG. 6shows an exemplary arrangement of input and output for several fiber bundles according to one embodiment of the disclosure
- FIG. 7shows a system according to one embodiment of the disclosure for implementing the arrangement of FIG. 6 in the representation of FIG. 5 ;
- FIG. 8shows a motorized linear switching system according to one embodiment of the disclosure.
- FIG. 9is a schematic representation of image reconstruction according to one embodiment of the present disclosure at an exemplary CCD.
- FIG. 1is a schematic representation of a prior art chemical imaging system 100 .
- sample 115is illuminated by laser illumination source 110 .
- the illuminating photonsare transmitted through mirror 112 and through imaging optics 120 .
- Mirror 112can be a dichroic mirror.
- Imaging optics 120can comprise an optical train including one or more lenses (not shown) and other optical elements (not shown).
- the photons received from the sample 115e.g., through reflection, scattering, etc.
- Control unit 160communicates with laser source 110 , imaging optics 120 , fiber bundle 130 , spectrometer 140 , CCD 150 and optionally, mirror 112 .
- Control unit 160can integrate and control the operation of system 100 .
- the optical fiber bundle 130communicates an optical dataset to spectrometer 140 to form spectra.
- Spectrometer 140can define a spectrograph.
- the spectra from gratings (not shown) in the spectrometer 140can be communicated to the Charge-Coupled Device (CCD) 150 to form an image of sample 115 .
- the imagecan define a spatially accurate wavelength-resolved image of the sample.
- a spatially accurate wavelength-resolved imageis an image of a sample that is formed from multiple “frames” wherein each frame has plural spatial dimensions and is created from photons of a particular wavelength (or wave number) or from photons in a particular wavelength band (or wave number band) so that the frames may be combined to form a complete image across all wavelengths (wave numbers) of interest.
- FIG. 2shows a prior art FAST (Fiber Array Spectral Translator) based system for implementing the representation of FIG. 1 .
- illumination source 210provides illuminating photons 212 to sample 215 through optical beam splitter 230 , mirrors 227 and 225 , and optical train 220 .
- sample photons 217 received from the sample 215are collected by optical train 220 and directed through mirrors 225 and 227 , optical splitter 230 and objective lens 235 to input port 242 of an optical fiber bundle 240 .
- Objective lens 235focuses sample photons 217 to an image plane 243 of input port 242 .
- image plane 243can comprise a two dimensional (2D) input surface of optical fiber bundle 240 .
- Port 248defines the output end of optical fiber bundle 240 .
- Optical fibersare substantially linearly arranged at output port 248 . While not specifically shown in FIG. 2 , input port 242 and output port 248 have the same number of optical fibers. The rearrangement of the optical fibers from input port 242 to output port 248 enables conversion or translation of a two-dimensional (2D) optical dataset at input port 242 to a one-dimensional (1D) optical dataset at output port 248 .
- the 1D optical datasetcan be communicated with spectrometer opening slit 252 .
- Spectrometer 250can be a spectrograph.
- FIG. 3shows a prior art substantially linear arrangement of fibers in an optical fiber's output port (e.g., the output port 248 in FIG. 2 ) for communication with a spectrometer slit.
- a gratings-based spectrometermay have an input slit with a length of about 13.312 mm. This length may be dictated by the number of imaging pixels in a CCD (not shown in FIGS. 2-3 ) receiving the wavelength dispersed spectra from the spectrometer.
- output port 300is shown to have a length of about 13 mm to fit the spectrometer slit.
- substantially linearly arranging the fiber array as shown in FIG. 3substantially all the data received at the input port of the optical fiber can be communicated to the spectrometer.
- about 208 optical fibers 310can be arranged to provide a substantially linear or curvilinear fiber array of about 13 mm height.
- FIG. 4shows a prior art arrangement of optical fibers at input and output ports of an optical fiber bundle in the system of FIG. 2 (e.g., the fiber bundle 240 ).
- a total of 203 optical fibersare arranged in a rectangular, two-dimensional format at the input port of the optical fiber bundle.
- the optical fibers of the input portform a surface for receiving a 2D optical dataset from the sample.
- the optical datasetcan be, for example, an image of the sample or a sub-image depicting a portion of the sample. It is seen in FIG.
- the optical fibers in the input port 410are arranged in a total of 15 rows, wherein each odd-numbered row contains 14 fibers and each even-numbered row contains 13 fibers. There is a total of 8 odd-numbered rows and 7 even-numbered rows in the input port 410 , thereby resulting in a total of 203 fibers.
- the optical fibers of FIG. 4are arranged to form a substantially linear array at the output port 420 .
- the linear arrangementenables communicating the optical dataset with a spectrometer slit (not shown) as discussed before. While FIG. 4 shows the optical fibers with a particular numerical arrangement, it should be noted that such arrangement is exemplary and non-limiting.
- the size of the 2D fiber bundle at the input end of a FAST fiberwill typically dictate the size of the sample's field-of-view (FOV).
- FOVfield-of-view
- the number of fibers in the 2D input endhas to be increased.
- an increase in the number of fibers at the input endwill require a similar increase in the fibers at the 1D output end, which, in turn, will require a similar increase in the column size of the CCD used to image the light received from the fibers.
- a larger sized CCDmay be expensive, and may not be always practical or desirable.
- this problemis avoided by organizing the FAST fiber bundle in different “zones” of fibers as shown in FIG. 6 and discussed later below.
- FIG. 5is a schematic representation of a chemical imaging system 525 according to one embodiment of the present disclosure.
- the chemical imaging system 525may be a Raman imaging system, a fluorescence imaging system, or any other type of chemical imaging system employing a fiber bundle for optical signal transmission and a spectrometer operating on a liner input.
- the system in FIG. 5relies on 2D to 1D “translation” of input and output fiber arrangements to optically link photons from sample 540 to the spectrometer slit.
- Various componentse.g., laser 530 , spectrometer 555 , CCD 560 , and mirror 535 ) in the system 525 in FIG. 5 are functionally similar to the corresponding components in FIG.
- the imaging optics 545may be similar to the imaging optics 120 in FIG. 1 .
- the imaging optics 545may be implemented using mirrors, lenses, and optical train based implementation similar to that shown in FIG. 2 and discussed hereinbefore.
- An alternative arrangement for imaging optics 545is shown in FIG. 7 and discussed later below.
- the embodiment in FIG. 5includes a plurality of fiber bundles or “zones” (discussed below) and a motorized translation stage so as to allow a variable field of view as discussed later hereinbelow.
- control unit 570 in FIG. 5may differ from the control unit 160 in FIG. 1 in that the control unit 570 may be configured to provide special controls for the multiple fiber zones and selection of one or more fiber zones through proper control of the movement of the motorized stage as discussed later below.
- control unit 570may be a computer processor suitably programmed to carry out fiber bundle selection, motor stage translation, CCD and spectrometer activation, and various other image capture and spectroscopy operations as per the teachings of the present disclosure.
- an imagee.g., a Raman image, a fluorescence image, etc.
- a display screene.g., a computer display 580 that is operatively coupled to the control unit 570 .
- the CCD 560may be a CCD camera model MicroMax: 1024B manufactured by Roper Scientific®.
- the spectrometer 555may be the grating-based SpectroPro 500i spectrometer manufactured by Acton Optics (a division of Princeton Instruments).
- each zonemay include a predetermined number of fibers.
- zone 1comprises 203 optical fibers arranged in a square pattern capturing a corresponding field of view of the sample.
- Zone 2comprises 208 optical fibers surrounding Zone 1 and capturing a corresponding field of view that surrounds the field of view of Zone 1.
- Zone 2are in addition to the 203 fibers in Zone 1, thereby making a total of 411 fibers.
- Zone 3comprises another 208 fibers and surrounds Zones 1 and 2 capturing a corresponding field of view of the sample which extends beyond Zones 1 and 2.
- Zone 4comprises still additional 208 fibers and surrounds zones 1 through 3.
- Zone 4is arranged to capture the field of view not covered by Zones 1 through 3. In the exemplary embodiment of FIG. 6 , there is thus a total of 827 fibers in zones 1 through 4. Further, in other embodiments, the number of fibers per zone and the total number of zones at the fiber input port may be different from those illustrated in FIG.
- Each 2D zone of fibers at the signal input endis organized as a separate curvilinear array (1D) at the spectrometer input end as shown by the four slit arrangements (corresponding to four input fiber Zones 1 through 4) in the output fiber bundle 620 .
- the overall 2D rectangular configuration of the fiber bundles arranged in Zones 1, 2, 3 and 4defines an input port for a FAST fiber (not shown in FIG. 6 , but shown as exemplary fiber 740 in FIG. 7 ) that may be used in the system of FIG. 5 .
- the rectangular, two-dimensional arrangement of the optical fibers 610 at the input portis exemplary and non-limiting. Indeed, the optical fibers can be arranged to form a circular, hexagonal, polygonal, or any other shape.
- FIG. 6also shows the output of each of Zones 1 through 4 arranged linearly at output 620 .
- the output for each of Zones 1 through 4is identified, respectively, as Slits 1 through 4.
- the linear arrangement of the output slitsenables direct optical communication from field of views corresponding to Zones 1 through 4 with the spectrometer slit.
- the fiber outputsare denoted as “Slit 1”, “Slit 2”, etc., for convenience only and should not be confused with the spectrometer slit.
- there is only one spectrometer slitthere is only one spectrometer slit, whereas there may be multiple fiber “slits”.
- each fiber “slit” or curvilinear (1D) arrangementis brought in optical alignment with the spectrometer slit by the motorized translation stage during operation of a chemical imaging system according to one embodiment of the present disclosure (e.g., the system 450 in FIG. 5 ).
- an electro-mechanical or an optical switch(not shown) can be used to successively communicate the optical information from each of Slits 1 through 4 to the spectrometer opening.
- FIG. 7shows a system according to one embodiment of the disclosure for implementing the arrangement of FIG. 6 in the representation of FIG. 5 .
- photons from sample 700are collected by the imaging optics 720 and directed through mirror 725 and objective lens 727 to input port 743 of optical fiber bundles.
- Objective lens 727(which could be a microlens array to provide more spectral resolution) focuses sample photons onto input port 743 of optical bundle 740 .
- the optical fibers at input port 743are divided into zones 1, 2 and 3 and each zone captures sample photons corresponding to a different region of the sample's field of view.
- optical bundle 740communicates sample photons from different fields of view of sample 700 .
- optical fibers at the input port 743is more functional than physical.
- the fibersmay still be physically stacked together or all fibers may be part of a single optical fiber cable (e.g., the fiber 740 ) without physical separation or zoning therebetween.
- a system controllere.g., the control unit 470 in FIG. 5
- Output port 748 of optical fiber bundle 740comprises fiber “slits” 1, 2 and 3 which communicate an optical data set from input fiber zones 1, 2 and 3, respectively, as indicated by the corresponding hatchings for fibers shown in FIG. 7 .
- the 1D fiber ends or “slits” 1, 2 and 3are shown in the exploded view 749 .
- Each of slits 1, 2 and 3communicates a one-dimensional optical dataset corresponding to a field of view of each of zones 1, 2 and 3, respectively, to spectrometer 750 (which could be a spectrograph in one embodiment).
- each optical fiber in the fiber bundle 740may be a multi-mode fiber having a numerical aperture of 0.22.
- the fiber coremay be 50 ⁇ m thick
- the claddingmay be 60 ⁇ m thick
- the coating layermay be 64 ⁇ m thick.
- the fibermay have a transmission spectrum from approximately 350 to 2400 nm wavelength range.
- FIG. 8shows a motorized linear switching system according to one embodiment of the disclosure. More specifically, FIG. 8 shows a motorized linear switching mechanism for selectively communicating one of the one-dimensional optical datasets to a spectrometer slit.
- fiber bundle 810communicates optical dataset depicting various regions of a sample (not shown).
- Optical fiber bundle 810can comprise, for example, four zones where each zone communicates an optical data set from a region of the sample (not shown).
- Each of the four zones of the optical fiber bundle 810is schematically represented by lines 831 - 834 .
- Optical fiber lines 831 to 834end at the output port 840 .
- the construction and operation of the fiber bundle 810may be similar to that of the fiber bundle 740 in FIG. 7 .
- Motorized switching mechanism 820selectively positions the output from one of the optical fiber lines 831 - 834 to input slit port 860 of spectrometer 870 such that the optical dataset from a selected region of the sample is communicated to the spectrometer.
- Optical information processed by spectrometer 870is directed to CCD 880 .
- CCD 880can produce an image of the selected region of the sample as communicated by the optical fiber lines 831 - 834 .
- CCD 880can display an image of the single zone (not shown) or compile the images from optical fiber lines 831 - 834 and display an omnibus image (not shown) depicting an entire field of view for the sample (not shown). It may take approximately 1 second to capture optical dataset for the image of the corresponding FOV from a linear fiber array slit, thereby providing a quick imaging of the desired FOV.
- the translational movement of the motorized linear stage 820may be controlled by a computer, controller, or a programmed processor (e.g., the control unit 570 in the embodiment of FIG. 5 ).
- the motorized linear stage 820may have a high position tolerance (less than 1 micron) for accurate alignment of a fiber “slit” with the spectrometer slit.
- one or more zones of fibersmay be selected by the controller for signal input (into the spectrometer).
- the controllermay then control the movement of the motorized linear translating stage 820 so as to sequentially scan each linear fiber array providing the relevant portion of the optical dataset for the user-selected FOV.
- the “central” fiber array(i.e., the fiber array corresponding to zone-1 in the illustration in FIG. 6 ) may constitute a “default” scanning position.
- the scanning of 1D fiber slitsmay start with the fiber slit corresponding to the central fiber array.
- the motorized stagemay then scan (under control from a controller) the fiber slit corresponding to zone-2, and so on. Because there may be N numbers of linear fiber arrays (depending on the desired maximum size of the sample FOV), the user can switch from one FOV size to another at run-time, thereby activating the operation of the linear translating stage to gather signals from appropriate linear fiber arrays.
- the motorized linear translating stage 820may position the fiber slit from zone-2 at the spectrometer input slit port 860 .
- an image reconstruction softwaremay be used to map the image data from the zone-2 fibers in appropriate peripheral locations (pixels) around the zone-1 image on the display screen, so as to obtain a 2D image format that corresponds to the zone-based 2D input fiber layout (e.g., as illustrated in FIG. 6 ) that is used to image a desired FOV.
- This approachmay be repeated (with fibers from zone-3, zone-4, etc.) if a still larger FOV is desired.
- the “breaking up” of the FOV (to be imaged) into different zones, using zone-specific fiber bundles to capture optical data from the corresponding portion of the FOV, followed by a sequential scanning (using a single spectrometer slit aligned with one fiber slit at a time) of each “linearized” or 1D fiber slitmay allow for a large/flexible FOV without requiring an increase in the CCD size because the CCD processes optical data from only one zone of fibers at a time.
- the spatial resolution of a FOVmay be reciprocally proportional to the optical magnification selected by a user for viewing the image of the FOV.
- the area of a FOV on samplemay be also reciprocally proportional to the selected magnification.
- the area of the FOVis directly proportional to the total number of fiber zones.
- a 532 nm excitation lasermay be used to image the desired FOV of a sample in the range of approximately 538 to 650 nm wavelengths.
- the spectral resolutionmay be approximately 0.1 nm.
- the shape of the imaged FOV(rectangular, square, circular, hexagonal, etc.) may depend on the shape of the 2D fiber zones.
- FIG. 9is a schematic representation of image reconstruction according to one embodiment of the present disclosure at an exemplary CCD.
- an exemplary CCD with an array of 1024 ⁇ 1024 pixelsis shown.
- the 1D output from a fiber “slit”may be fed to the spectrometer gratings (or other similar dispersive elements) through the spectrometer slit as illustrated in exemplary FIGS. 7 and 8 .
- Each wavelength-dispersed signal (1D) from the gratingsis sent to the CCD as illustrated in FIG. 8 .
- each column of CCD pixelsmay represent one wavelength.
- FIG. 9an exemplary illustration of pixel mapping in FIG.
- 5 CCD pixelsmay be mapped to an image point (e.g., an optical fiber in the fiber slit at issue) at a particular wavelength.
- image pointe.g., an optical fiber in the fiber slit at issue
- image pointsor linear fiber array outputs in a fiber slit
- the entire CCD in the embodiment of FIG. 9can then accommodate approximately 204 to 205 different columns of wavelengths (1024 pixels in a row divided by 5 pixels per column representing a wavelength) from a given fiber slit.
- a 1D-to-2D array mappingmay then organize each column of CCD (containing optical data at a particular wavelength) back to or close to the layout of the corresponding original 2D fiber zone, so as to obtain a 2D spatially-accurate wavelength-resolved image (SAWRI) of the sample for the specific wavelength.
- SAWRIwavelength-resolved image
- the array mapped imagemay have image pixels laid out in 15 ⁇ 14 or 15 ⁇ 13 format similar to that illustrated in the arrangement in FIG. 4 . If desired, all wavelength-specific images may be combined to obtain a 3D spectral image of the FOV corresponding to a single zone of fibers.
- the 1D-to-2D array mapping processmay be repeated for each selected zone of fibers to construct the SAWRI image of the entire user-selected FOV in substantial conformance with the input fiber zone layout in the exemplary FIG. 6 (e.g., by displaying image from zone-2 fibers on the periphery of the zone-1 image, image from zone-3 fibers on the periphery of the zone-2 image, and so on).
Landscapes
- Physics & Mathematics (AREA)
- Spectroscopy & Molecular Physics (AREA)
- General Physics & Mathematics (AREA)
- Investigating Or Analysing Materials By Optical Means (AREA)
Abstract
Description
Claims (51)
Priority Applications (1)
| Application Number | Priority Date | Filing Date | Title |
|---|---|---|---|
| US11/890,517US7626696B2 (en) | 2007-08-07 | 2007-08-07 | Method and apparatus for reconfigurable field of view in a FAST-based imaging system |
Applications Claiming Priority (1)
| Application Number | Priority Date | Filing Date | Title |
|---|---|---|---|
| US11/890,517US7626696B2 (en) | 2007-08-07 | 2007-08-07 | Method and apparatus for reconfigurable field of view in a FAST-based imaging system |
Publications (2)
| Publication Number | Publication Date |
|---|---|
| US20090040519A1 US20090040519A1 (en) | 2009-02-12 |
| US7626696B2true US7626696B2 (en) | 2009-12-01 |
Family
ID=40346189
Family Applications (1)
| Application Number | Title | Priority Date | Filing Date |
|---|---|---|---|
| US11/890,517Active2027-11-21US7626696B2 (en) | 2007-08-07 | 2007-08-07 | Method and apparatus for reconfigurable field of view in a FAST-based imaging system |
Country Status (1)
| Country | Link |
|---|---|
| US (1) | US7626696B2 (en) |
Cited By (5)
| Publication number | Priority date | Publication date | Assignee | Title |
|---|---|---|---|---|
| US20090066947A1 (en)* | 2005-04-04 | 2009-03-12 | Chem1Mage Corporation | Method and apparatus for interactive hyperspectral image subtraction |
| US20100200736A1 (en)* | 2007-08-16 | 2010-08-12 | Leslie Charles Laycock | Imaging device |
| US20100265502A1 (en)* | 2009-04-15 | 2010-10-21 | Chemlmage Corporation | Spatially and Spectrally Parallelized Fiber Array Spectral Translator System and Method of Use |
| WO2012151288A1 (en)* | 2011-05-03 | 2012-11-08 | Applied Materials Israel, Ltd. | Multi-spot collection optics |
| US9395296B1 (en) | 2015-02-20 | 2016-07-19 | The United States Of America, As Represented By The Secretary Of The Army | Two-dimensional optical spot location using a one-dimensional detector array |
Families Citing this family (14)
| Publication number | Priority date | Publication date | Assignee | Title |
|---|---|---|---|---|
| JP5307629B2 (en)* | 2009-05-22 | 2013-10-02 | オリンパス株式会社 | Scanning microscope equipment |
| WO2010148068A1 (en)* | 2009-06-17 | 2010-12-23 | Battelle Memorial Institute | Fiber bundle for high efficiency, spatially resolved coupling, and spectrometer using the same |
| JP5265632B2 (en)* | 2010-08-16 | 2013-08-14 | 株式会社サイム | Plastic identification device and plastic identification method |
| AU2013341327A1 (en) | 2012-11-06 | 2015-07-02 | Chemimage Corporation | System and method for serum based cancer detection |
| US20170010153A1 (en)* | 2014-01-30 | 2017-01-12 | Horiba Instruments Incorporated | Spectroscopic mapping system and method |
| US9995882B2 (en)* | 2014-02-04 | 2018-06-12 | University Of Florida Research Foundation, Inc. | Photonic synthesis of large aperture telescopes from multi-telescope arrays |
| US9651359B2 (en)* | 2014-11-21 | 2017-05-16 | Kla-Tencor Corporation | Dual wavelength dual interferometer with combiner-splitter |
| CN104990626A (en)* | 2015-07-01 | 2015-10-21 | 天津大学 | Snapshot type high-spectrum imaging system realizing image segmentation by use of optical fiber bundle |
| EP3385685A1 (en)* | 2017-04-06 | 2018-10-10 | ASML Netherlands B.V. | Radiation receiving system |
| CN112649091B (en)* | 2020-12-28 | 2022-03-25 | 武汉精测电子集团股份有限公司 | Chromaticity measurement method and device for LED (light emitting diode) spliced display screen calibration |
| WO2023283742A1 (en)* | 2021-07-14 | 2023-01-19 | Westboro Photonics Inc. | Imager and spot sampler with translatable stage |
| EP4471392A4 (en)* | 2022-01-25 | 2025-04-23 | Osaka University | SPECTROMETRY DEVICE AND SPECTROMETRY METHOD |
| US12431604B2 (en) | 2022-12-30 | 2025-09-30 | Endress+Hauser Optical Analysis, Inc. | Waveguide and electromagnetic spectrometer |
| WO2025009401A1 (en)* | 2023-07-06 | 2025-01-09 | 国立大学法人大阪大学 | Spectrometry device and spectrometry method |
Citations (41)
| Publication number | Priority date | Publication date | Assignee | Title |
|---|---|---|---|---|
| US3984190A (en) | 1974-11-26 | 1976-10-05 | Allied Chemical Corporation | Simultaneous transmission of periodic spectral components by plural interferometric means |
| US4195931A (en) | 1978-05-18 | 1980-04-01 | The United States Of America As Represented By The Secretary Of The Army | Clear air turbulence detector |
| US4200801A (en) | 1979-03-28 | 1980-04-29 | The United States Of America As Represented By The United States Department Of Energy | Portable spotter for fluorescent contaminants on surfaces |
| US4487504A (en)* | 1982-09-01 | 1984-12-11 | Pacific Scientific Instruments Company | Reflectance measuring instrument with integrating sphere |
| US4553816A (en) | 1980-12-15 | 1985-11-19 | Honeywell Inc. | Tunable Fabry-Perot filter |
| US4660151A (en) | 1983-09-19 | 1987-04-21 | Beckman Instruments, Inc. | Multicomponent quantitative analytical method and apparatus |
| US4701838A (en) | 1983-05-12 | 1987-10-20 | The Broken Hill Proprietary Co., Ltd. | Characterizing and handling multi-component substances |
| US4766551A (en) | 1986-09-22 | 1988-08-23 | Pacific Scientific Company | Method of comparing spectra to identify similar materials |
| US4885697A (en) | 1988-09-01 | 1989-12-05 | E. I. Du Pont De Nemours And Company | Method of identifying spectra |
| US5072338A (en) | 1988-05-19 | 1991-12-10 | Hug William F | Inspection/detection system with a laser module for use in forensic applications |
| US5121337A (en) | 1990-10-15 | 1992-06-09 | Exxon Research And Engineering Company | Method for correcting spectral data for data due to the spectral measurement process itself and estimating unknown property and/or composition data of a sample using such method |
| US5121338A (en) | 1988-03-10 | 1992-06-09 | Indiana University Foundation | Method for detecting subpopulations in spectral analysis |
| US5124932A (en) | 1988-03-10 | 1992-06-23 | Indiana University Foundation | Method for analyzing asymmetric clusters in spectral analysis |
| US5311445A (en) | 1989-04-19 | 1994-05-10 | Board Of Regents Of The University Of Oklahoma | Deconvoluted band representation for infrared spectrum compression |
| US5324567A (en) | 1990-02-02 | 1994-06-28 | Thomas De La Rue And Company Limited | Ink composition and components thereof |
| US5347378A (en) | 1991-04-04 | 1994-09-13 | Displaytech, Inc. | Fast switching color filters for frame-sequential video using ferroelectric liquid crystal color-selective filters |
| US5357340A (en) | 1989-10-12 | 1994-10-18 | Hartmann & Braun | Method for spectroscopy using two Fabry-Perot interference filters |
| US5481476A (en) | 1990-06-04 | 1996-01-02 | Eastman Kodak Company | Apparatus for interactive self-modeling mixture analysis |
| US5606164A (en) | 1996-01-16 | 1997-02-25 | Boehringer Mannheim Corporation | Method and apparatus for biological fluid analyte concentration measurement using generalized distance outlier detection |
| US5610836A (en) | 1996-01-31 | 1997-03-11 | Eastman Chemical Company | Process to use multivariate signal responses to analyze a sample |
| US5710713A (en) | 1995-03-20 | 1998-01-20 | The Dow Chemical Company | Method of creating standardized spectral libraries for enhanced library searching |
| US5751415A (en) | 1996-05-13 | 1998-05-12 | Process Instruments, Inc. | Raman spectroscopy apparatus and method for continuous chemical analysis of fluid streams |
| US5801828A (en) | 1996-11-14 | 1998-09-01 | Detections Unlimited, Inc. | Apparatus and method for fluorescence spectroscopy of remote sample |
| US5822219A (en) | 1996-05-13 | 1998-10-13 | Foss Nirsystems, Inc. | System for identifying materials by NIR spectrometry |
| US5866430A (en) | 1996-06-13 | 1999-02-02 | Grow; Ann E. | Raman optrode processes and devices for detection of chemicals and microorganisms |
| US6002476A (en) | 1998-04-22 | 1999-12-14 | Chemicon Inc. | Chemical imaging system |
| US6008888A (en) | 1999-03-16 | 1999-12-28 | Wizard Of Ink & Co. | Laser verification and authentication Raman spectrometer (LVARS) |
| US6239904B1 (en) | 1998-06-11 | 2001-05-29 | Carl Zeiss Jena Gmbh | Forensic microscope, in particular for examination of writing |
| WO2001077648A1 (en) | 2000-04-11 | 2001-10-18 | Chemometec A/S | Method and apparatus for detecting fluorescence of a sample |
| US6485981B1 (en) | 1998-07-29 | 2002-11-26 | Ciencia, Inc. | Method and apparatus for imaging and documenting fingerprints |
| US6549861B1 (en) | 2000-08-10 | 2003-04-15 | Euro-Celtique, S.A. | Automated system and method for spectroscopic analysis |
| US6584413B1 (en) | 2001-06-01 | 2003-06-24 | Sandia Corporation | Apparatus and system for multivariate spectral analysis |
| US6614532B1 (en) | 2000-04-28 | 2003-09-02 | Mcgill University | Apparatus and method for light profile microscopy |
| US6621614B1 (en) | 2001-08-10 | 2003-09-16 | Arista Networks, Inc. | Etalons with variable reflectivity |
| US6631001B2 (en) | 1998-08-26 | 2003-10-07 | Minolta Co., Ltd. | Spectral image input device |
| US6833957B2 (en) | 2002-06-04 | 2004-12-21 | Nec Corporation | Tunable filter, manufacturing method thereof and optical switching device comprising the tunable filter |
| US6836366B1 (en) | 2000-03-03 | 2004-12-28 | Axsun Technologies, Inc. | Integrated tunable fabry-perot filter and method of making same |
| US6897951B2 (en) | 2003-02-14 | 2005-05-24 | Raman Systems, Inc. | Probe assemblies for Raman spectroscopy |
| US6985216B2 (en) | 2003-07-18 | 2006-01-10 | Chemimage Corporation | Method and apparatus for compact birefringent interference imaging spectrometer |
| US7072770B1 (en) | 2004-03-29 | 2006-07-04 | Chemimage Corporation | Method for identifying components of a mixture via spectral analysis |
| US20060209301A1 (en) | 2003-07-18 | 2006-09-21 | Gardner Charles W Jr | Method and apparatus for compact spectrometer for fiber array spectral translator |
- 2007
- 2007-08-07USUS11/890,517patent/US7626696B2/enactiveActive
Patent Citations (46)
| Publication number | Priority date | Publication date | Assignee | Title |
|---|---|---|---|---|
| US3984190A (en) | 1974-11-26 | 1976-10-05 | Allied Chemical Corporation | Simultaneous transmission of periodic spectral components by plural interferometric means |
| US4195931A (en) | 1978-05-18 | 1980-04-01 | The United States Of America As Represented By The Secretary Of The Army | Clear air turbulence detector |
| US4200801A (en) | 1979-03-28 | 1980-04-29 | The United States Of America As Represented By The United States Department Of Energy | Portable spotter for fluorescent contaminants on surfaces |
| US4553816A (en) | 1980-12-15 | 1985-11-19 | Honeywell Inc. | Tunable Fabry-Perot filter |
| US4487504A (en)* | 1982-09-01 | 1984-12-11 | Pacific Scientific Instruments Company | Reflectance measuring instrument with integrating sphere |
| US4701838A (en) | 1983-05-12 | 1987-10-20 | The Broken Hill Proprietary Co., Ltd. | Characterizing and handling multi-component substances |
| US4660151A (en) | 1983-09-19 | 1987-04-21 | Beckman Instruments, Inc. | Multicomponent quantitative analytical method and apparatus |
| US4766551A (en) | 1986-09-22 | 1988-08-23 | Pacific Scientific Company | Method of comparing spectra to identify similar materials |
| US5124932A (en) | 1988-03-10 | 1992-06-23 | Indiana University Foundation | Method for analyzing asymmetric clusters in spectral analysis |
| US5121338A (en) | 1988-03-10 | 1992-06-09 | Indiana University Foundation | Method for detecting subpopulations in spectral analysis |
| US5072338A (en) | 1988-05-19 | 1991-12-10 | Hug William F | Inspection/detection system with a laser module for use in forensic applications |
| US4885697A (en) | 1988-09-01 | 1989-12-05 | E. I. Du Pont De Nemours And Company | Method of identifying spectra |
| US5311445A (en) | 1989-04-19 | 1994-05-10 | Board Of Regents Of The University Of Oklahoma | Deconvoluted band representation for infrared spectrum compression |
| US5357340A (en) | 1989-10-12 | 1994-10-18 | Hartmann & Braun | Method for spectroscopy using two Fabry-Perot interference filters |
| US5324567A (en) | 1990-02-02 | 1994-06-28 | Thomas De La Rue And Company Limited | Ink composition and components thereof |
| US5481476A (en) | 1990-06-04 | 1996-01-02 | Eastman Kodak Company | Apparatus for interactive self-modeling mixture analysis |
| US5121337A (en) | 1990-10-15 | 1992-06-09 | Exxon Research And Engineering Company | Method for correcting spectral data for data due to the spectral measurement process itself and estimating unknown property and/or composition data of a sample using such method |
| US5347378A (en) | 1991-04-04 | 1994-09-13 | Displaytech, Inc. | Fast switching color filters for frame-sequential video using ferroelectric liquid crystal color-selective filters |
| US5710713A (en) | 1995-03-20 | 1998-01-20 | The Dow Chemical Company | Method of creating standardized spectral libraries for enhanced library searching |
| US5606164A (en) | 1996-01-16 | 1997-02-25 | Boehringer Mannheim Corporation | Method and apparatus for biological fluid analyte concentration measurement using generalized distance outlier detection |
| US5610836A (en) | 1996-01-31 | 1997-03-11 | Eastman Chemical Company | Process to use multivariate signal responses to analyze a sample |
| US5751415A (en) | 1996-05-13 | 1998-05-12 | Process Instruments, Inc. | Raman spectroscopy apparatus and method for continuous chemical analysis of fluid streams |
| US5822219A (en) | 1996-05-13 | 1998-10-13 | Foss Nirsystems, Inc. | System for identifying materials by NIR spectrometry |
| US5866430A (en) | 1996-06-13 | 1999-02-02 | Grow; Ann E. | Raman optrode processes and devices for detection of chemicals and microorganisms |
| US5801828A (en) | 1996-11-14 | 1998-09-01 | Detections Unlimited, Inc. | Apparatus and method for fluorescence spectroscopy of remote sample |
| US6002476A (en) | 1998-04-22 | 1999-12-14 | Chemicon Inc. | Chemical imaging system |
| US6239904B1 (en) | 1998-06-11 | 2001-05-29 | Carl Zeiss Jena Gmbh | Forensic microscope, in particular for examination of writing |
| US6485981B1 (en) | 1998-07-29 | 2002-11-26 | Ciencia, Inc. | Method and apparatus for imaging and documenting fingerprints |
| US6631001B2 (en) | 1998-08-26 | 2003-10-07 | Minolta Co., Ltd. | Spectral image input device |
| US6008888A (en) | 1999-03-16 | 1999-12-28 | Wizard Of Ink & Co. | Laser verification and authentication Raman spectrometer (LVARS) |
| US6836366B1 (en) | 2000-03-03 | 2004-12-28 | Axsun Technologies, Inc. | Integrated tunable fabry-perot filter and method of making same |
| US6970246B2 (en) | 2000-04-11 | 2005-11-29 | Chemometec A/S | Method and apparatus for detecting fluorescence of a sample |
| WO2001077648A1 (en) | 2000-04-11 | 2001-10-18 | Chemometec A/S | Method and apparatus for detecting fluorescence of a sample |
| US6614532B1 (en) | 2000-04-28 | 2003-09-02 | Mcgill University | Apparatus and method for light profile microscopy |
| US6549861B1 (en) | 2000-08-10 | 2003-04-15 | Euro-Celtique, S.A. | Automated system and method for spectroscopic analysis |
| US6584413B1 (en) | 2001-06-01 | 2003-06-24 | Sandia Corporation | Apparatus and system for multivariate spectral analysis |
| US6621614B1 (en) | 2001-08-10 | 2003-09-16 | Arista Networks, Inc. | Etalons with variable reflectivity |
| US6833957B2 (en) | 2002-06-04 | 2004-12-21 | Nec Corporation | Tunable filter, manufacturing method thereof and optical switching device comprising the tunable filter |
| US6897951B2 (en) | 2003-02-14 | 2005-05-24 | Raman Systems, Inc. | Probe assemblies for Raman spectroscopy |
| US6985216B2 (en) | 2003-07-18 | 2006-01-10 | Chemimage Corporation | Method and apparatus for compact birefringent interference imaging spectrometer |
| US6985233B2 (en) | 2003-07-18 | 2006-01-10 | Chemimage Corporation | Method and apparatus for compact Fabry-Perot imaging spectrometer |
| US7012695B2 (en) | 2003-07-18 | 2006-03-14 | Chemimage Corporation | Method and apparatus for multiwavelength imaging spectrometer |
| US7084972B2 (en) | 2003-07-18 | 2006-08-01 | Chemimage Corporation | Method and apparatus for compact dispersive imaging spectrometer |
| US20060209301A1 (en) | 2003-07-18 | 2006-09-21 | Gardner Charles W Jr | Method and apparatus for compact spectrometer for fiber array spectral translator |
| US7072770B1 (en) | 2004-03-29 | 2006-07-04 | Chemimage Corporation | Method for identifying components of a mixture via spectral analysis |
| WO2007101279A2 (en) | 2006-03-03 | 2007-09-07 | Chemimage Corporation | Method and apparatus for compact spectrometer with fiber array spectral translator |
Non-Patent Citations (20)
| Title |
|---|
| Brunelle, R.L., "Questioned Document Examination," Bureau of Alcohol, Tobacco, and Firearms, U.S. Treasury Department, 1982. |
| Caetano, M.R., et al., "Evaluation of the importance of non-linear spectral mixing in coniferous forests," EUROPTO Conference on Remote Sensing for Agriculture, Ecosystems, and Hydrology, Barcelona, Spain, Sep. 1998. |
| Conti, S., et al., "Traces of Polymethylsiloxane in case histories of rape: technique for detection," Elsvier Science Ireland Ltd, Forensic Science International, Jan. 1995, pp. 121-128. |
| Engman, E.T., "Remote Sensing for Agriculture, Ecosystems, and Hydrology," Proceedings of SPIE EUROPTO Series, vol. 3499, Sep. 22-24, 1998. |
| Gaudette, B.D., "The Forensic Aspects of Textile Fiber Examination," Central Forensic Laboratory, Royal Canadian Mounted Police. |
| Guilment, J., et al., "Infrared Chemical Micro-Imaging Assisted by Interactive Self-Modeling Multivariate Analysis," Applied Spectroscopy, vol. 48, No. 3, 1994. |
| Lee, G.S.H., et al., "A Methodology Based on NMR Spectroscopy for the Forensic Analysis of Condoms," St. Andrews Centre for Advanced Materials, pp. 808-821, Journal of Forensic Sciences, 2001. |
| Malinowski, E.R., Factor Analysis in Chemistry, 2nd ed., New York, NY: John Wiley & Sons, Inc., 1991. |
| Maynard, P., et al., "A protocol for the forensic analysis of condom and personal lubricants found in sexual assault cases," Forensic Science International, 124 (2001), pp. 140-156. |
| Maynard, P., et al., "Adhesive Tape Analysis: Establishing the Evidential Value of Specific Techniques," Journal of Forensic Sciences, vol. 46(2), 2001, pp. 280-287. |
| Mazzella, W.D., et al., "Classification and Identification of Photocopying Toners by Diffuse Reflectance Infrared Fourier Transform Spectroscopy (DRIFTS): I. Preliminary Results," Journal of Forensic Sciences, JFSCA, vol. 36, No. 2, Mar. 1991, pp. 449-465. |
| Mazzella, W.D., et al., "Classification and Identification of Photocopying Toners by Diffuse Reflectance Infrared Fourier Transform Spectroscopy (DRIFTS): II. Final Report," Journal of Forensic Sciences, JFSCA, vol. 36, No. 3, May 1991, pp. 820-837. |
| Pounds, C.A., et al., "The Transfer of Fibres between Clothing Materials During Simulated Contacts and their Persistence During Wear: Part I-Fibre Transference," Journal of Forensic Sciences, vol. 15, 1975, pp. 17-27. |
| Pounds, C.A., et al., "The Transfer of Fibres between Clothing Materials During Simulated Contacts and their Persistence During Wear: Part II-Fibre Persistence," Journal of Forensic Sciences, vol. 15, 1975, pp. 29-37. |
| Press, W.H., et al., Numerical Recipes in C, The Art of Scientific Computing, 2nd ed., Cambridge, NY: Cambridge University Press, 1992. |
| Rasmussen, G.T., et al., "Library Retrieval of Infrared Spectra Based on Detailed Intensity Information," Applied Spectroscopy, vol. 33, No. 4, 1979. |
| Robertson, J., et al., "The Persistence of Textile Fibres Transferred During Simulated Contacts," Journal of Forensic Sciences, vol. 22, No. 4, Oct. 1982, p. 353-360. |
| Roux, C., et al., "A study to investigate the evidential value of blue and black ballpoint pen inks in Australia," Forensic Science International, 101 (1999), pp. 167-176. |
| Roux, C., et al., "Evaluation of 1,2-Indanedione and 5,6-Dimethoxy-1,2-Indanedione for the Detection of Latent Fingerprints on Porous Surfaces," Journal of Forensic Sciences, vol. 45(4), 2000, pp. 761-769. |
| Stoilovic, M., et al., "The Application of Light in Forensic Science & A Modern Approach to Fingerprint Detection and Enhancement," Australian Federal Police, AFP Workshop Manual, Oct. 2000. |
Cited By (9)
| Publication number | Priority date | Publication date | Assignee | Title |
|---|---|---|---|---|
| US20090066947A1 (en)* | 2005-04-04 | 2009-03-12 | Chem1Mage Corporation | Method and apparatus for interactive hyperspectral image subtraction |
| US7956991B2 (en)* | 2005-04-04 | 2011-06-07 | Chemimage Corporation | Method and apparatus for interactive hyperspectral image subtraction |
| US20100200736A1 (en)* | 2007-08-16 | 2010-08-12 | Leslie Charles Laycock | Imaging device |
| US8110791B2 (en)* | 2007-08-16 | 2012-02-07 | Bae Systems Plc | Imaging device |
| US20100265502A1 (en)* | 2009-04-15 | 2010-10-21 | Chemlmage Corporation | Spatially and Spectrally Parallelized Fiber Array Spectral Translator System and Method of Use |
| US8098373B2 (en) | 2009-04-15 | 2012-01-17 | Chemimage Corporation | Spatially and spectrally parallelized fiber array spectral translator system and method of use |
| WO2012151288A1 (en)* | 2011-05-03 | 2012-11-08 | Applied Materials Israel, Ltd. | Multi-spot collection optics |
| US9702983B2 (en) | 2011-05-03 | 2017-07-11 | Applied Materials Israel, Ltd. | Multi-spot collection optics |
| US9395296B1 (en) | 2015-02-20 | 2016-07-19 | The United States Of America, As Represented By The Secretary Of The Army | Two-dimensional optical spot location using a one-dimensional detector array |
Also Published As
| Publication number | Publication date |
|---|---|
| US20090040519A1 (en) | 2009-02-12 |
Similar Documents
| Publication | Publication Date | Title |
|---|---|---|
| US7626696B2 (en) | Method and apparatus for reconfigurable field of view in a FAST-based imaging system | |
| US8068222B2 (en) | Method and apparatus for microlens array/fiber optic imaging | |
| US9052290B2 (en) | SWIR targeted agile raman system for detection of unknown materials using dual polarization | |
| US7636158B1 (en) | Optimal coupling of high performance line imaging spectrometer to imaging system | |
| US7609370B2 (en) | Single detector based dual excitation wavelength spectra display | |
| US8098373B2 (en) | Spatially and spectrally parallelized fiber array spectral translator system and method of use | |
| US20130235255A1 (en) | Optical imaging system for multispectral imaging | |
| CN105612454A (en) | High Resolution Scanning Microscopy | |
| WO2008128971A2 (en) | A spectroscopic imaging method and system for exploring the surface of a sample | |
| CN108139578A (en) | High-resolution scanning microscopy that resolves at least two spectral ranges | |
| WO2017197491A1 (en) | Spectrally-resolved scanning microscope | |
| CA3035109C (en) | Scanning microscope using a mosaic scan filter | |
| US7408636B2 (en) | Method and apparatus for dark field chemical imaging | |
| KR20220005022A (en) | Hybrid Imaging Products and Hybrid Endoscopy Systems | |
| US20070171409A1 (en) | Method and apparatus for dense spectrum unmixing and image reconstruction of a sample | |
| US20070188747A1 (en) | System and method for image reconstruction in a fiber array spectral translator system | |
| WO2009020450A1 (en) | Method and apparatus for reconfigurable field of view in a fast-based imaging system | |
| US20240389903A1 (en) | Assembly having a detector | |
| US7701572B2 (en) | System and method for chemical imaging of microarrays | |
| RU2658140C1 (en) | Confocal fluorescent image spectrum analyser | |
| US20250216258A1 (en) | Imaging spectrometer and camera with sliding lens group | |
| US20250216260A1 (en) | Imaging spectrometer and camera with high spectral range | |
| WO2006107309A2 (en) | Method and apparatus for interactive hyperspectral image subtraction | |
| US20080197287A1 (en) | System and method for super resolution of a sample in a fiber array spectral translator system | |
| EP3504577A1 (en) | Scanning microscope using a mosaic scan filter |
Legal Events
| Date | Code | Title | Description |
|---|---|---|---|
| AS | Assignment | Owner name:CHEMIMAGE CORPORATION, PENNSYLVANIA Free format text:ASSIGNMENT OF ASSIGNORS INTEREST;ASSIGNOR:ZHANG, JINGYUN;REEL/FRAME:019847/0455 Effective date:20070831 | |
| STCF | Information on status: patent grant | Free format text:PATENTED CASE | |
| AS | Assignment | Owner name:CHEMIMAGE CORPORATION, PENNSYLVANIA Free format text:ASSIGNMENT OF ASSIGNORS INTEREST;ASSIGNOR:CHEMIMAGE CORPORATION;REEL/FRAME:030134/0096 Effective date:20130402 | |
| FPAY | Fee payment | Year of fee payment:4 | |
| AS | Assignment | Owner name:CHEMIMAGE TECHNOLOGIES LLC, PENNSYLVANIA Free format text:CORRECTIVE ASSIGNMENT TO CORRECT THE CHANGE ASSIGNEE FROM CHEMIMAGE CORPORATION TO CHEMIMAGE TECHNOLOGIES LLC PREVIOUSLY RECORDED ON REEL 030134 FRAME 0096. ASSIGNOR(S) HEREBY CONFIRMS THE CHEMIMAGE CORP TO CHEMIMAGE TECHNOLOGIES LLC;ASSIGNOR:CHEMIMAGE CORPORATION;REEL/FRAME:030583/0143 Effective date:20130402 | |
| FPAY | Fee payment | Year of fee payment:8 | |
| MAFP | Maintenance fee payment | Free format text:PAYMENT OF MAINTENANCE FEE, 12TH YR, SMALL ENTITY (ORIGINAL EVENT CODE: M2553); ENTITY STATUS OF PATENT OWNER: SMALL ENTITY Year of fee payment:12 |