US7570979B2 - Methods and apparatus for patient monitoring - Google Patents
Methods and apparatus for patient monitoringDownload PDFInfo
- Publication number
- US7570979B2 US7570979B2US11/091,396US9139605AUS7570979B2US 7570979 B2US7570979 B2US 7570979B2US 9139605 AUS9139605 AUS 9139605AUS 7570979 B2US7570979 B2US 7570979B2
- Authority
- US
- United States
- Prior art keywords
- radiation
- patient
- reflected
- blood
- level
- Prior art date
- Legal status (The legal status is an assumption and is not a legal conclusion. Google has not performed a legal analysis and makes no representation as to the accuracy of the status listed.)
- Expired - Fee Related, expires
Links
- 238000000034methodMethods0.000titleclaimsabstractdescription45
- 238000012544monitoring processMethods0.000titleclaimsabstractdescription26
- 239000008280bloodSubstances0.000claimsabstractdescription103
- 210000004369bloodAnatomy0.000claimsabstractdescription102
- 229910052760oxygenInorganic materials0.000claimsabstractdescription88
- 239000001301oxygenSubstances0.000claimsabstractdescription88
- QVGXLLKOCUKJST-UHFFFAOYSA-Natomic oxygenChemical compound[O]QVGXLLKOCUKJST-UHFFFAOYSA-N0.000claimsabstractdescription62
- 230000000241respiratory effectEffects0.000claimsabstractdescription38
- 230000029058respiratory gaseous exchangeEffects0.000claimsabstractdescription29
- 230000037007arousalEffects0.000claimsabstractdescription20
- 208000001797obstructive sleep apneaDiseases0.000claimsabstractdescription9
- 206010021143HypoxiaDiseases0.000claimsabstractdescription8
- 230000005855radiationEffects0.000claimsdescription81
- 208000008784apneaDiseases0.000claimsdescription30
- 230000002490cerebral effectEffects0.000claimsdescription29
- 230000004044responseEffects0.000claimsdescription26
- 239000000523sampleSubstances0.000claimsdescription26
- 230000002706hydrostatic effectEffects0.000claimsdescription24
- 238000012545processingMethods0.000claimsdescription23
- 230000001351cycling effectEffects0.000claimsdescription17
- 238000010521absorption reactionMethods0.000claimsdescription13
- 201000002859sleep apneaDiseases0.000claimsdescription12
- 230000000694effectsEffects0.000claimsdescription10
- 230000008859changeEffects0.000claimsdescription9
- 238000011084recoveryMethods0.000claimsdescription6
- 238000005070samplingMethods0.000claimsdescription5
- 208000003417Central Sleep ApneaDiseases0.000claimsdescription4
- 208000003443UnconsciousnessDiseases0.000claimsdescription4
- 230000003831deregulationEffects0.000claimsdescription4
- 230000000541pulsatile effectEffects0.000claimsdescription4
- 229920002379silicone rubberPolymers0.000claimsdescription4
- 238000004891communicationMethods0.000claimsdescription3
- 238000009825accumulationMethods0.000claimsdescription2
- 230000003213activating effectEffects0.000claimsdescription2
- 230000001146hypoxic effectEffects0.000claimsdescription2
- 230000000414obstructive effectEffects0.000claimsdescription2
- 210000001519tissueAnatomy0.000abstractdescription40
- 206010021079HypopnoeaDiseases0.000abstractdescription13
- 238000004497NIR spectroscopyMethods0.000abstractdescription13
- 230000007954hypoxiaEffects0.000abstractdescription5
- 210000003019respiratory muscleAnatomy0.000abstractdescription4
- 108010054147HemoglobinsProteins0.000description17
- 102000001554HemoglobinsHuman genes0.000description17
- 210000003128headAnatomy0.000description12
- 230000001144postural effectEffects0.000description9
- 238000002106pulse oximetryMethods0.000description9
- 108010002255deoxyhemoglobinProteins0.000description7
- 238000005259measurementMethods0.000description7
- INGWEZCOABYORO-UHFFFAOYSA-N2-(furan-2-yl)-7-methyl-1h-1,8-naphthyridin-4-oneChemical compoundN=1C2=NC(C)=CC=C2C(O)=CC=1C1=CC=CO1INGWEZCOABYORO-UHFFFAOYSA-N0.000description6
- 108010064719OxyhemoglobinsProteins0.000description6
- 239000000243solutionSubstances0.000description6
- 238000004458analytical methodMethods0.000description5
- 238000003745diagnosisMethods0.000description5
- 210000003743erythrocyteAnatomy0.000description5
- 206010041235SnoringDiseases0.000description4
- 238000005534hematocritMethods0.000description4
- 238000001228spectrumMethods0.000description4
- 238000012360testing methodMethods0.000description4
- 230000007704transitionEffects0.000description4
- 230000017531blood circulationEffects0.000description3
- 230000036772blood pressureEffects0.000description3
- 230000003247decreasing effectEffects0.000description3
- 238000010586diagramMethods0.000description3
- 230000004886head movementEffects0.000description3
- 238000001208nuclear magnetic resonance pulse sequenceMethods0.000description3
- 230000035515penetrationEffects0.000description3
- 230000036544postureEffects0.000description3
- 230000002792vascularEffects0.000description3
- OKTJSMMVPCPJKN-UHFFFAOYSA-NCarbonChemical compound[C]OKTJSMMVPCPJKN-UHFFFAOYSA-N0.000description2
- 208000004756Respiratory InsufficiencyDiseases0.000description2
- 240000004808Saccharomyces cerevisiaeSpecies0.000description2
- 230000004913activationEffects0.000description2
- 230000002411adverseEffects0.000description2
- 210000002565arterioleAnatomy0.000description2
- 229910052799carbonInorganic materials0.000description2
- 238000006243chemical reactionMethods0.000description2
- 230000008602contractionEffects0.000description2
- 125000004122cyclic groupChemical group0.000description2
- 230000007423decreaseEffects0.000description2
- 230000010339dilationEffects0.000description2
- 238000006073displacement reactionMethods0.000description2
- 238000000537electroencephalographyMethods0.000description2
- 230000004907fluxEffects0.000description2
- 210000001061foreheadAnatomy0.000description2
- 230000006870functionEffects0.000description2
- 230000013632homeostatic processEffects0.000description2
- 238000000338in vitroMethods0.000description2
- 210000003205muscleAnatomy0.000description2
- 238000002496oximetryMethods0.000description2
- 238000006213oxygenation reactionMethods0.000description2
- 230000007170pathologyEffects0.000description2
- 230000002685pulmonary effectEffects0.000description2
- 230000002829reductive effectEffects0.000description2
- 201000004193respiratory failureDiseases0.000description2
- 244000038022Chenopodium capitatumSpecies0.000description1
- 235000004391Chenopodium capitatumNutrition0.000description1
- 102000018832CytochromesHuman genes0.000description1
- 108010052832CytochromesProteins0.000description1
- 208000001705Mouth breathingDiseases0.000description1
- 241001494479PecoraSpecies0.000description1
- 239000004743PolypropyleneSubstances0.000description1
- 241000785681Sander vitreusSpecies0.000description1
- XUIMIQQOPSSXEZ-UHFFFAOYSA-NSiliconChemical compound[Si]XUIMIQQOPSSXEZ-UHFFFAOYSA-N0.000description1
- 210000001015abdomenAnatomy0.000description1
- 230000009471actionEffects0.000description1
- 238000013019agitationMethods0.000description1
- 230000002238attenuated effectEffects0.000description1
- 230000008901benefitEffects0.000description1
- 230000033228biological regulationEffects0.000description1
- 230000000903blocking effectEffects0.000description1
- 210000004204blood vesselAnatomy0.000description1
- 210000000988bone and boneAnatomy0.000description1
- 210000004556brainAnatomy0.000description1
- 239000008366buffered solutionSubstances0.000description1
- 238000004364calculation methodMethods0.000description1
- 230000000747cardiac effectEffects0.000description1
- 230000003727cerebral blood flowEffects0.000description1
- 230000004087circulationEffects0.000description1
- 238000003759clinical diagnosisMethods0.000description1
- 239000011248coating agentSubstances0.000description1
- 238000000576coating methodMethods0.000description1
- 230000000052comparative effectEffects0.000description1
- 208000020020complex sleep apneaDiseases0.000description1
- 230000001010compromised effectEffects0.000description1
- 230000001186cumulative effectEffects0.000description1
- 230000001419dependent effectEffects0.000description1
- 230000001627detrimental effectEffects0.000description1
- 230000008181diaphragm contractionEffects0.000description1
- 239000000945fillerSubstances0.000description1
- 239000007789gasSubstances0.000description1
- 230000004217heart functionEffects0.000description1
- 230000001939inductive effectEffects0.000description1
- 230000003993interactionEffects0.000description1
- 230000031700light absorptionEffects0.000description1
- 230000000670limiting effectEffects0.000description1
- 230000007774longtermEffects0.000description1
- 210000004072lungAnatomy0.000description1
- 239000000463materialSubstances0.000description1
- 230000004066metabolic changeEffects0.000description1
- 230000002503metabolic effectEffects0.000description1
- 230000004060metabolic processEffects0.000description1
- 201000006646mixed sleep apneaDiseases0.000description1
- 230000004118muscle contractionEffects0.000description1
- 210000002464muscle smooth vascularAnatomy0.000description1
- 230000001537neural effectEffects0.000description1
- 230000000926neurological effectEffects0.000description1
- 210000000056organAnatomy0.000description1
- TWNQGVIAIRXVLR-UHFFFAOYSA-Noxo(oxoalumanyloxy)alumaneChemical compoundO=[Al]O[Al]=OTWNQGVIAIRXVLR-UHFFFAOYSA-N0.000description1
- 239000002245particleSubstances0.000description1
- 210000003516pericardiumAnatomy0.000description1
- 230000002093peripheral effectEffects0.000description1
- 230000010363phase shiftEffects0.000description1
- 230000035790physiological processes and functionsEffects0.000description1
- -1polypropylenePolymers0.000description1
- 229920001155polypropylenePolymers0.000description1
- 239000000843powderSubstances0.000description1
- 230000008569processEffects0.000description1
- 210000004129prosencephalonAnatomy0.000description1
- 230000009325pulmonary functionEffects0.000description1
- 230000009467reductionEffects0.000description1
- 230000036387respiratory rateEffects0.000description1
- 210000005245right atriumAnatomy0.000description1
- 229920006395saturated elastomerPolymers0.000description1
- 238000012216screeningMethods0.000description1
- 229910052710siliconInorganic materials0.000description1
- 239000010703siliconSubstances0.000description1
- 210000003625skullAnatomy0.000description1
- 230000003595spectral effectEffects0.000description1
- 230000008093supporting effectEffects0.000description1
- 230000003319supportive effectEffects0.000description1
- 230000001360synchronised effectEffects0.000description1
- 238000012876topographyMethods0.000description1
- 238000012546transferMethods0.000description1
- 230000001052transient effectEffects0.000description1
- 230000001960triggered effectEffects0.000description1
- 210000005166vasculatureAnatomy0.000description1
- 210000003462veinAnatomy0.000description1
- 230000000007visual effectEffects0.000description1
Images


Classifications
- A—HUMAN NECESSITIES
- A61—MEDICAL OR VETERINARY SCIENCE; HYGIENE
- A61B—DIAGNOSIS; SURGERY; IDENTIFICATION
- A61B5/00—Measuring for diagnostic purposes; Identification of persons
- A61B5/103—Measuring devices for testing the shape, pattern, colour, size or movement of the body or parts thereof, for diagnostic purposes
- A61B5/11—Measuring movement of the entire body or parts thereof, e.g. head or hand tremor or mobility of a limb
- A61B5/1116—Determining posture transitions
- A—HUMAN NECESSITIES
- A61—MEDICAL OR VETERINARY SCIENCE; HYGIENE
- A61B—DIAGNOSIS; SURGERY; IDENTIFICATION
- A61B5/00—Measuring for diagnostic purposes; Identification of persons
- A61B5/145—Measuring characteristics of blood in vivo, e.g. gas concentration or pH-value ; Measuring characteristics of body fluids or tissues, e.g. interstitial fluid or cerebral tissue
- A61B5/1455—Measuring characteristics of blood in vivo, e.g. gas concentration or pH-value ; Measuring characteristics of body fluids or tissues, e.g. interstitial fluid or cerebral tissue using optical sensors, e.g. spectral photometrical oximeters
- A61B5/14551—Measuring characteristics of blood in vivo, e.g. gas concentration or pH-value ; Measuring characteristics of body fluids or tissues, e.g. interstitial fluid or cerebral tissue using optical sensors, e.g. spectral photometrical oximeters for measuring blood gases
- A61B5/14553—Measuring characteristics of blood in vivo, e.g. gas concentration or pH-value ; Measuring characteristics of body fluids or tissues, e.g. interstitial fluid or cerebral tissue using optical sensors, e.g. spectral photometrical oximeters for measuring blood gases specially adapted for cerebral tissue
- A—HUMAN NECESSITIES
- A61—MEDICAL OR VETERINARY SCIENCE; HYGIENE
- A61B—DIAGNOSIS; SURGERY; IDENTIFICATION
- A61B5/00—Measuring for diagnostic purposes; Identification of persons
- A61B5/145—Measuring characteristics of blood in vivo, e.g. gas concentration or pH-value ; Measuring characteristics of body fluids or tissues, e.g. interstitial fluid or cerebral tissue
- A61B5/1495—Calibrating or testing of in-vivo probes
- A—HUMAN NECESSITIES
- A61—MEDICAL OR VETERINARY SCIENCE; HYGIENE
- A61B—DIAGNOSIS; SURGERY; IDENTIFICATION
- A61B5/00—Measuring for diagnostic purposes; Identification of persons
- A61B5/48—Other medical applications
- A61B5/4806—Sleep evaluation
- A61B5/4818—Sleep apnoea
- A—HUMAN NECESSITIES
- A61—MEDICAL OR VETERINARY SCIENCE; HYGIENE
- A61B—DIAGNOSIS; SURGERY; IDENTIFICATION
- A61B2560/00—Constructional details of operational features of apparatus; Accessories for medical measuring apparatus
- A61B2560/02—Operational features
- A61B2560/0242—Operational features adapted to measure environmental factors, e.g. temperature, pollution
- A61B2560/0247—Operational features adapted to measure environmental factors, e.g. temperature, pollution for compensation or correction of the measured physiological value
- A—HUMAN NECESSITIES
- A61—MEDICAL OR VETERINARY SCIENCE; HYGIENE
- A61B—DIAGNOSIS; SURGERY; IDENTIFICATION
- A61B5/00—Measuring for diagnostic purposes; Identification of persons
- A61B5/145—Measuring characteristics of blood in vivo, e.g. gas concentration or pH-value ; Measuring characteristics of body fluids or tissues, e.g. interstitial fluid or cerebral tissue
- A61B5/1455—Measuring characteristics of blood in vivo, e.g. gas concentration or pH-value ; Measuring characteristics of body fluids or tissues, e.g. interstitial fluid or cerebral tissue using optical sensors, e.g. spectral photometrical oximeters
- A—HUMAN NECESSITIES
- A61—MEDICAL OR VETERINARY SCIENCE; HYGIENE
- A61B—DIAGNOSIS; SURGERY; IDENTIFICATION
- A61B5/00—Measuring for diagnostic purposes; Identification of persons
- A61B5/68—Arrangements of detecting, measuring or recording means, e.g. sensors, in relation to patient
- A61B5/6801—Arrangements of detecting, measuring or recording means, e.g. sensors, in relation to patient specially adapted to be attached to or worn on the body surface
- A61B5/6813—Specially adapted to be attached to a specific body part
- A61B5/6814—Head
Definitions
- the present inventionrelates generally to medical devices that provide information regarding respiratory parameters.
- Respiratory monitoringis a crucial tool for clinical diagnostics and patient safety, particularly when a subject is unconscious, such as during sleep or an induced unconscious state.
- Nasal airflow (or pressure) transducersare generally used to provide the main signal for apnea/hypoapnea scoring, although pulse oximetry (as a measure of arterial blood-oxygen) and electroencephalography (as a measure of arousal) are used as confirmatory information.
- Linear displacement transducersmay be used for detecting chest and abdomen expansion as a measure of respiration and sound (snoring) levels recorded. Some of these transducers have been modified for home monitoring, thus reducing costs associated with sleep clinical diagnostics, however, technical assistance at set up is still recommended based on studies comparing user or technician monitoring set up (Gaqnadoux and Pelletier-Fleury, Chest (March) 2002).
- the signal derived from the transducerprovides a trace showing the inhalation/exhalation cycle, and time periods of no respiratory activity. It is also useful in estimating periods of insufficient respiration, such as those characteristic of hypopnea (Hemdndez et al., Chest 2001; 119:442-450), although confirmatory evidence is generally needed for the latter, either oxygen desaturation (pulse oximeter) or else arousal (usually EEG or accelerometer) or both.
- OSAObstructive sleep apnea
- OSAis the more common form, characterised by the soft palette blocking the air passage.
- diaphragm movementpersists in respiratory effort. This does not occur with central sleep apnea, where breathing stops due to lack of respiratory muscle effort induced by lack of cerebral signal for respiratory muscle contraction.
- Mixed sleep apnearesults when both of these effects occur.
- nasal prongsDuring mouth breathing, nasal prongs give false positive apnea events, and generally the signal is poor during periods of snoring, a parameter which in itself is characteristic of sleep apnea.
- monitoring snoring as a diagnostic parameterhas limited diagnostic value unless used in conjunction with other transducers (Hemdndez et al., Chest 2001; 119:442-450).
- Pulse oximetryis universally used to monitor blood-oxygen saturation in patients during respiratory studies.
- the pulse oximeter probeis designed for clamping to a finger, and provides a measure of the arterial blood-oxygen saturation level mainly in the skin.
- a positive diagnosis of sleep apneais generally made if the instruments recording signals indicate five or more apnea events per hour (each exceeding 10 seconds) during sleep. An excess of 30 apneas per hour is usually required for a clinical diagnosis of severe sleep apnea. Many clinics also include hypoapnea scoring (insufficient respiratory rates for >2 minutes) based on respiratory airflow data and/or the number of arousal's recorded per hour.
- Diagnostic scoringcan be ambiguous for milder to moderate sleep-apnea conditions, with some clinicians recommending studies over two nights to reduce false positive/negative diagnosis (Le Bon et al., Chest (March) 2000).
- the high cost of sleep clinic studies, and the number of possible candidates to be screened,means that screening of all patients requiring this extended testing is not cost effective, and thus often not feasible.
- NIRSnear infrared spectroscopy
- NIRS methodologydiffers from pulse oximetry in two important respects:
- the low penetration depth of the radiation used in pulse oximetry(less than 10 mm at a wavelength of ⁇ 660 nm), means it is unsuitable for non-invasive deep tissue blood-oxygen assessment.
- a device using NIR-radiationonly can readily penetrate bone and assess deep tissue.
- the present inventionrelates to methods and devices for monitoring or diagnosing disordered respiration in a patient.
- the inventionprovides a method of detecting disordered respiration in a patient, the method comprising:
- the disordered respirationis a sleep-related respiratory deregulation and in a particularly preferred form, is obstructive sleep apnea, central sleep apnea or both.
- the first and second patient orientationsinclude:
- the blood oxygen indexis determined in accordance with the equation:
- the blood oxygen indexis determined in accordance with one of the following equations:
- the calibration factoris determined empirically so as to reduce effects of hydrostatic head change effect on the blood oxygen index.
- the methodincludes using first and second light-emitting diodes (LEDs) to generate the first and second wavelengths respectively.
- LEDslight-emitting diodes
- the methodincludes using a photodiode to sense the absorbed radiation.
- the methodincludes:
- the reflected values for the first and second wavelengths and ambient lightare consecutively sampled at least 30 times per second.
- the methodincludes using algorithms to calculate parameters selected from the group consisting of oxygen debt accumulation value during insufficient respiration, hypoxic value of apnea events, pulsatile flow, blood volume cycling, diaphragm movements during respiration patient wherein a movement is indicative of obstructive, central or mixed type sleep apnea, arousals during an unconscious state and recovery time to quiescent saturation.
- the methodincludes performing the monitoring step for a predetermined time period.
- the inventionrelates to a method of monitoring flow response times to hydrostatic pressure adjustments in a patient, the method comprising:
- the inventionin another broad form, relates to an apparatus for detecting disordered respiration or a flow response time to a hydrostatic pressure adjustment in a patient, the apparatus comprising:
- the radiation sourceincludes first and second LEDs for generating the first and second predetermined wavelengths respectively.
- the senorincludes a photodiode for sensing the reflected radiation.
- the apparatusincludes controller for controlling the operation of the radiation source and the sensor.
- controlleris adapted to:
- the controlleris adapted to cause reflected values for the first and second wavelengths and ambient light to be consecutively sampled at least 30 times per second.
- the controllerincludes:
- the processoris adapted to control a pulsed radiation source, and even more preferably, a sampling time interval of the sensor.
- the processoris adapted to perform at least some processing of the reflected level signals.
- the controllerincludes a communication means for transferring data to a remote processing system, the remote processing system being adapted to perform at least some processing of the reflected level.
- the remote processing systemis adapted to display a reflected level.
- the apparatusincludes a user input for controlling the controller.
- the user inputis used for selectively activating at least one of the calibration step and the monitoring step.
- the controlleris provided in a housing.
- the housingis suitable for home use by a patient.
- the radiation source and the sensorare provided in a probe coupled to the housing, the probe being adapted for attachment to the patient in use.
- the probeis formed from silicon rubber.
- the apparatusis adapted to perform the methods of the invention.
- FIG. 1is a graphical representation of a spectral scan of whole blood in a near infrared range
- FIG. 2Aillustrates an example of experimental conditions suitable for testing response of the respiratory monitor to changes in blood oxygen in vitro
- FIG. 2Bis a graphical representation of sample traces for a solution of 5% hematocrit, showing voltage level at 750 nm, 810 nm and a calculated blood oxygen index;
- FIG. 3Ais a schematic representation of an apparatus according to an embodiment of the invention.
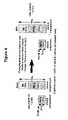
- FIG. 3Bis a schematic representation of a pulse sequence for components in the apparatus of the invention.
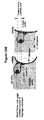
- FIG. 3Cis a schematic illustration of an apparatus according to a preferred embodiment of the invention.
- FIG. 4is a schematic diagram illustrating changes in blood oxygenation measure caused by a postural change
- FIG. 5Ais a schematic diagram showing a sample patient calibration step of a preferred device of the invention.
- FIG. 5Bis a graphical representation of the data generated by the sample patient calibration step of FIG. 5A ;
- FIG. 6Ais a graphical representation of respiratory-related parameters obtained by an apparatus according to an embodiment of the invention.
- FIG. 6Bis a graphical representation of respiratory-related parameters obtained by an apparatus according to an embodiment of the invention.
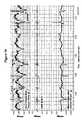
- FIG. 7is a graphical representation showing sample comparative respiratory data
- FIG. 8is a graphical representation of respiratory data showing blood volume cycling in response to a hypopnea event
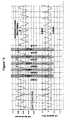
- FIG. 9is a graphical representation of respiratory data during hypopnea
- FIG. 10is a graphical representation of respiratory data during hypopnea
- FIG. 11is a graphical representation of interference in a nasal air flow reading caused by patient arousal during sleep but accurately interpreted as postural movements in the blood volume trace;
- FIG. 12Ais a graphical representation of phase relationship between respiratory airflow, blood volume and blood hydrostatic head changes
- FIG. 12Bis a schematic representation of blood volume and venous hydrostatic head changes in a patient
- FIG. 13is a graphical representation of blood volume and nasal air flow during apnea
- FIG. 14is a graphical representation of blood volume and nasal air flow during obstructive sleep apnea.
- the present inventioninvolves apparatus and methods, for the diagnosis or monitoring of disordered respiratory regulation or flow response time to hydrostatic pressure adjustment in a patient.
- FIG. 3AAn example of apparatus suitable for detecting sleep apnoea will now be described with reference to FIG. 3A .
- the apparatusis adapted to perform near infra-red spectroscopy (NIRS) and is therefore typically formed from a processing system 10 coupled to suitable radiation sources 11 , 12 , a detector 13 , and an amplifier 14 .
- the processing system 10is formed from a microprocessor 20 , a memory 21 , and an external interface 24 , coupled together via a bus 23 .
- the radiation sources 11 , 12 and the amplifier 14are coupled to the external interface 24 as shown.
- the radiation sources 11 , 12are adapted to generate near infra-red radiation at respective predetermined wavelengths, with the radiation being detected by the detector 13 .
- the output from the detector 13is amplified and sampled by the amplifier, which therefore typically includes an analogue-to-digital converter, to provide a digital signal to the processing system 10 .
- the detector 13is typically a photodiode adapted to detect radiation at these wavelengths, which may be achieved through the use of a standard photodiode and an appropriate bandpass filter, as will be appreciated by persons skilled in the art.
- the processing system 10is adapted to control the operation of the LEDs 11 , 12 , the detector 13 and the amplifier 14 , as well as to store and optionally process any sampled signals.
- the processing systemmay be any form of processing system provided with suitable applications software and a suitable external interface.
- the processing systemmay be formed from a suitably programmed personal computer, lap-top, palm-top, PDA, mobile phone, or the like, or may be implemented using a suitable custom hardware configuration, as will be described in more detail below.
- the processing systemis adapted to selectively activate the radiation sources 11 , 12 in accordance with a predetermined pulse sequence. This is typically performed such that each radiation source 11 , 12 is activated at a respective time, with signals from the detector 13 being sampled at times to coincide with times at which the radiation sources 11 , 12 are activated.
- An example of a suitable pulse sequenceis shown in FIG. 3B . Additional sampling may also be performed at times during which the radiation sources 11 , 12 are not active to thereby allow ambient radiation levels only to be detected. The signals caused by ambient radiation levels alone can then be subtracted from signals detected during activation of the LEDs, to thereby allow the effects of ambient radiation to be accounted for.
- the devicemay be formed on specialised hardware or the like.
- the deviceincludes a probe 30 containing the LEDs 11 , 12 , the photodiode 13 and the supporting electronics such as the amplifier 14 .
- the probe 30is typically formed by having the LEDs 11 , 12 and the detector being embedded in soft silicon rubber.
- the size of the probe 30is approximately 50 mm ⁇ 20 mm ⁇ 10 mm.
- the shape of the probeis fashioned to conform to the surface topography of the forehead, to minimise ambient radiation access to the sensor, or prevent dislogement with rapid head movement.
- Electronic componentscan be incorporated into the probe by any suitable technique, such as by first coating in high resistive silicon rubber, then mixing the remaining silicon with a carbon filler (black) to eliminate ambient light accessing the photodiode.
- the photodiodeis coupled to an electrometer amplifier 14 whose external signal input terminals are impedance matched to the photodiode to reduce the photodiode's capacitive load, and thereby improve response time to signal changes.
- the probeis coupled to a housing 31 via a 2 meter flexible polypropylene 6-core ribbon cable 32 .
- the housing 31houses the processing system 10 , and an associated power source, such as a battery, and is provided with a number of input and output devices including an on/off switch 33 , a calibration switch 34 , and three visual indicators 35 , 36 and 37 .
- activation of the on/off switch 33causes power to be supplied to the processing system allowing the system to be activated. In general, this also triggers the LEDs 11 , 12 and the detector 13 , thereby causing measurements to be made.
- the indicating devices 35 , 36which are typically LEDs are utilised to indicate mark signal levels of the orientation of the patient whilst an indicating device 37 is used to indicate whether the device is active.
- the calibration switch 34is used to cause the device to be calibrated.
- the LEDs, 35 , 36are illuminated when the device is turned on via the on/off switch 33 . When the patient is lying on their back, the calibration switch, 34 , is pressed.
- This actionextinguishes indicating device 35 , suitably providing a specific voltage to be recorded within a blood volume signal which provides a mark for the blood volume level present when the patient is on their back.
- the calibration button, 34is again pressed so that device 35 is extinguished and a specific voltage included with the blood volume signal to indicate blood volume level expected when the patient is lying on their side.
- the graphical representation of these calibration stepsare shown in FIG. 5B . The calibration is complete when both LEDs 35 and 36 extinguished.
- the probe 30also include a ground plate, which in use is in contact with the patient's skin, thereby reducing AC-line pickup.
- the deviceOnce the device is activated, by turning on the on/off switch 33 , sampling of signals from the photodiode 13 will begin immediately.
- the signals from the photodiode 13are amplified by the amplifier 14 , before being transferred to the processing system 10 , where the signals undergo 10-bit analogue-to-digital conversion by the processor 20 .
- Signals for each wavelength plus ambient lightare consecutively sampled at 50-times per second, with the ambient light signal voltage being subtracted from each NIR-LED signal voltage.
- An indication of the signal voltageis stored in the memory 21 , which may be a Flash-RAM memory module, or the like.
- the stored datacan then be subsequently transferred to a remote system, such as PC, for analysis.
- a remote systemsuch as PC
- thisis achieved using a USB port 38 , although it will be appreciated that this could also be achieved by wireless communication between the processing system 10 , and the remote system, or by removal and physical transfer of the memory 22 , for example if the memory 22 is provided on removable media.
- the datais transferred to a remote system for analysis.
- the processing system 10it is also possible for the processing system 10 to perform initial analysis of the result, with an indication being provided by a suitable output.
- the stored signalwould be processed to identify events within physiological parameters, such as a peak-to-peak time for a pulsatile flow, respiration ratess, blood flow cycling with hypopnea and voltage transitions characteristic of arousal peaks in the blood volume signal. Analysis simultaneous transitions in blood volume and blood oxygen transitions may be used for characterising apnea events. Deregulation in a respiratory parameter could then suitably be displayed to an inbuilt LCD screen, or be used to set off an alarm.
- Physiological eventscan be obtained for use in the methods of the invention using an apparatus shown in FIG. 3C , where the sensor can be formed as a probe which is placed centrally on the forehead, and secured, such as by way of an adjustable elastic strap, on the central axis of body rotation of a patient.
- the probecan be attached to the device via a flexible ribbon cable which allows maximum body movement without dislodgment.
- the trace in FIG. 5Bshows a subject's blood volume increase invoked by postural change.
- a subject's blood concentrationincreases in the tissue being interrogated, and fewer photons manage to pass through the tissue, hence the signal level drops.
- the signal values for these different postural positionsare marked on the trace in FIG. 5B during the calibration. These values will be different for each subject, depending on attenuation differences such as skull thickness.
- the device's calibration set upis needed (provides the trace's calibration mark) while the subject is in each postural position.
- the values measuredcan then be used to track postural changes during a monitoring or diagnostic study.
- the trace obtained during such a studycan be used to infer other postures.
- the trace in FIG. 5Bas an illustration, if the signal plateaus above 1.2 volts then the subject has increased pillow height or if a large signal shift, more likely to a sitting position. A signal plateau below 0.58 volts for this patient may indicate lower head height, consequent to, for example, reduced pillow height. A semi-circular movement in the trace may be consistent with an 180° roll over.
- the subject's positionshows the difference in hydrostatic head with the corresponding representation on the blood volume trace.
- the reasoning for this changeis presented schematically in FIG. 4 , where a small movement in venous volume results in a significant change in the Hb:HbO2 ratio ( ⁇ 7%). The movement indicated for arterial volume is likely overstated so that the ratio is likely>7%.
- FIG. 6shows a segment from a sleep study in which the subject rolls from their side to their back at which point there were racked, with shallow apneas until again they returned on their side.
- FIG. 6Ashow the signal changes in response to postural shifts.
- the third trace, blood-oxygen index, 750 nm-810 nmalso shows this change.
- This algorithmis modified to 750 nm ⁇ k-810 nm, where “k” was empirically determined as the value that removed hydrostatic blood changes from the blood-oxygen index trace.
- Cerebral blood flowis controlled by arteriole contraction/dilation and hydrostatic head height, assuming constant mean blood pressure.
- hydrostatic headWhen the hydrostatic head is increased, such as when a subject moves from their side to their back, flow has to readjust.
- cerebral flow rateincreases until the arteriole's vascular smooth muscle adjusts flow rates back to homeostasis. Accordingly, the rapid transient positive peak in the FIG. 6B provides a response time to homeostasis ( ⁇ 20 sec.). Similarly, as the subject rolls back onto their side a negative peak response (10 seconds) to vascular adjustment is observed.
- FIG. 1illustrates the response of infrared light when transmitted through blood.
- the relatively low absorption of photons in the infrared part of the spectrum compared to that of the visible part of the spectrum (below 700 nm)is shown, as is an absorption peak centered at ⁇ 760 nm evident with deoxygenated blood compared to oxygenated blood (StO2);
- the wavelength at which the light absorption is independent of blood oxygen saturation levels810 ⁇ 5 nm, called the isosbestic wavelength, is also marked indicated in FIG. 1 .
- oxyhemoglobinshows a higher absorption than deoxyhemoglobin, the converse occurs below 810 nm.
- a percentage of oxygen saturation of the hemoglobin within a tissue of interestcan be calculated using NIRS from the following equation:
- Blood volume within a tissuecan be quantified using NIRS by measurement of the concentration of hemoglobin or red blood cells within the photon path.
- Incident photons from NIRSare attenuated due to scattering by tissue, and also by absorption, the latter principally by hemoglobin (Sevick et al., (1991) Anal. Biochem. 195: 330-351). While attenuation due to photon scattering in tissue will be constant (for a given measurement site), hemoglobin absorption will vary as the tissue blood content changes.
- Relative blood volume measurementscan be obtained from a signal generated from photons at around the isosbestic wavelength of 810 nm, which is independent of changes in tissue hemoglobin oxygenation percentage (StO2) (ie cross talk between oxyhemoglobin-to-deoxyhemoglobin proportions).
- StO2tissue hemoglobin oxygenation percentage
- tissue chromophorescan also absorb in the near infrared range, particularly in neural tissue (eg cytochrome C), their effect on signals derived from wavelengths of 810 nm or lower is minimal, relative to the degree of hemoglobin absorption within the tissue.
- Tissue Blood ContentTPC
- Non-invasive blood volume measurements using NIRScan show changes in hemoglobin concentration in the photon path and indirectly, blood flow changes.
- Hemoglobinis confined to blood vessels, where the red blood-cell concentration of blood or hematocrit (Hct) is generally between 40 to 45% (packed red blood cells/100 ml whole blood).
- the average hemoglobin concentration distribution within a volume of tissue through which the photons passwill average one tenth or less of this value.
- the TBC for forebrainranges between 2 to 5% Hct, (as a proportion of packed red blood cells/100 ml tissue volume). This is similar to blood hematocrit (Hct) except that it applies to whole tissue rather than just blood.
- FIG. 2Ashows experimental conditions for testing the response of the device to changes in blood oxygen experimentally in vitro.
- the equipment in the top of FIG. 2Ashows a method for obtaining a 0 to 100% oxygen saturation in blood (ignoring the likely 1% oxidized hemoglobin) in pH-buffered solutions containing a known concentration of hemoglobin (5%, 4%, 3%, 3%, 2%, 1%, 0.5%, 0%) (in sheep red blood cells).
- Oxygenis stripped from the hemoglobin via competition with activated aerobic yeast, which consume oxygen in their metabolic activity. Increased/decreased pressures above the solution help confirm that total oxygen saturation/desaturation of the hemoglobin has occurred.
- the hemoglobinis again oxygen saturated by aspirating fine bubbles of oxygen through the solution for some minutes.
- FIG. 2Bshows a spectrum with three traces, for a solution of 5% Hct.
- the lower traceis for the calculated value of 810 nm-750 nm, derived from the top two traces (750 nm and 810 nm signals).
- a linear change in the signal over the full blood-oxygen saturation rangeis evident, see linear dotted line.
- the 810 nm signal(top trace) remained insensitive to the changing blood-oxygen level, consistent with it being the isosbestic wavelength.
- the 850 nm-750 nm signalrepresents the blood-oxygen index while the 810 nm signal represents blood volume index.
- 750 nm -810 mmwas found to be particularly suitable, as use of a calibration factor in further Examples allowed the voltage signal of the 750 nm value to remain positive.
- the signal750 nm-810 nm, provides an index of venous blood-oxygen (SvO2) proportion. This assumes an arterial oxyhemoglobin value greater than 95%. This is not the case during respiratory insufficiency, in which case the blood-oxygen index is proportional to the global blood-oxygen saturation in the measured light path.
- SvO2venous blood-oxygen
- FIG. 3CThe apparatus schematically depicted in FIG. 3C was used for detecting respiratory parameters in a patient.
- FIG. 6shows multiple peaks in both blood volume and blood oxygen while the subject is on their back. These are multiple mild apnea events, not present when the patient is lying on their side. Over the approximately 24 minutes of repeated apnea events there were no cumulative changes in blood volume or blood oxygen levels (average voltage maintained).
- FIG. 7Three traces recording a series of deep apnea events in a patient, recorded over an approximate time period of ten minutes, are shown in FIG. 7 .
- the top traceis the respiratory airflow (pressure signal) from nasal prongs
- the second and third tracesare from the blood-oxygen index acquired by the apparatus depicted schematically by FIG. 3C
- the pulse oximeterwas affixed to the subject to measure finger, arterial-blood oxygen saturation.
- each apnea eventis ranked according to the period for no nasal airflow (absence of signal cycling). Given constant body metabolism, the level of blood-oxygen desaturation should be proportional to the time of no respiration shown by the airflow transducer. The ‘depth’ of each apnea event should correlate with the time for which no air is exchanged in the lung.
- the signals from both the apparatus according to FIG. 3C and the pulse oximeterare ranked according to the depth of desaturation. Using a Spearsman's ranking correlation test, the desaturation levels were each compared to the ranking shown in the nasal prong's trace.
- the slope of the dotted line through the trace in FIG. 7demonstrates a reducing base line consistent with a reduction in global saturation, not compensated for during each apnea's brief recovery phase. This is consistent with incurring an oxygen debt over the 10 minute period of multiple apneas. This contrasts to the much longer apnea cycle presented in FIG. 6 , where there was no long term build up in oxygen debt.
- An oxygen debt indexcan be calculated based on the slope of the decrease in blood oxygen (dotted line) multiplied by the time period for which blood-oxygen remained below the quiescent value. This would draw a sharper distinction between adverse effects resulting from repeat arousals and effects due to periods of hypoxia.
- the thin vertical dotted lines in FIG. 7show alignment of respiration restart with recovery from hypoxia at each apnea event, 7 ⁇ 2 seconds. It is likely that the rate of response to resaturation correlates with pulmonary efficiency. A possible outcome would be to see a longer recovery time in patients with compromised pulmonary efficiency/function, such as a heavy smoker. This response time would also have diagnostic value.
- Oxygen debtwas not apparent in the arterial oxygen saturation trace recorded by the pulse oximeter.
- FIG. 8shows a three minute segment of signals from the apparatus schematically depicted in FIG. 3C , and the nasal airflow transducer monitoring, during a sleep study.
- the top traceis of blood volume index in which approximately 15 second cycling was occurring.
- An expanded segment of the traceresolves systole pulsatile flow (top right in blood volume trace) from which the heart rate was calculated.
- Beats per minute (BPM) for peaks and troughswere calculated in the cycling blood volume. The cycles evident in the blood volume can just be distinguished within the airflow trace, shown by dotted lines.
- hypopnea eventsare made to score hypopnea events as part of the overall diagnosis of sleep apnea. It is difficult to estimate pathologies that may result from repeated nightly hypopnea events. Although inducing repeated arousals is an obvious detrimental effect which often accompanies hypopnea.
- FIG. 9shows a 10 minute segment from a sleep study in which nasal airflow and the signals from the device in FIG. 3A are shown.
- respiratory cyclingThere is evident respiratory cycling.
- the hatched vertical regionsshow alignment for all three signals.
- cycling in the blood volume indexwas responding to the respiration insufficiency.
- the dotted line through the blood volumeindicates an increase in blood volume, especially in the first five minutes.
- cerebral blood oxygenThere is no evidence of a drop in cerebral blood oxygen, suggesting that increased flow adequately compensates reduced respiratory efficiency.
- the minor cycling within the bottom traceis consistent with blood-oxygen changes with the cycling blood flow. Rapid vertical movements in the blood volume trace near the start and end of the sequence were consistent with arousal's. These hydrostatic shifts to head movement were effectively suppressed in the blood oxygen trace by the algorithm used (750 nm ⁇ k-810 nm). The arousals would appear not to be in response to cerebral blood oxygen falls.
- One of the characteristics of sleep apneais the repeated arousals in response to respiratory blockage or insufficiency.
- FIG. 10is a five minute segment of hypopnea from a sleep study whose characteristic is similar to that in FIG. 9 , although the patient data in FIG. 10 indicates a number of arousals which are evident on the blood oxygen trace. These transitions are large enough to have an effect on the calculated blood-oxygen signal, although this may in part be vascular adjustment.
- FIG. 11suggests that some arousals involving large body movement interfere with the airflow transducer signal. Signals on the airflow trace may well be interpreted as deep inhalation/exhalations or apnea events. While nuances within the blood volume signal are lost during large body movements, they are not likely to be misinterpreted as apnea events.
- the correlation of blood volume peaksare synchronous with respiration.
- the peak amplitude in the blood volume signalcorrelates to that of the nasal prong's, which fluctuate with the depth of respiration, when movement artifact is absent.
- FIG. 12shows the phase relationship between respiratory airflow and the tracking by the blood volume signal.
- the rise timesare faster than fall rates in the peaks.
- amplitudes of the blood volume peakscorrelate with that in the respiratory peaks. These peaks have lower amplitude in a subject who is standing and are absent from signals acquired from limb muscle.
- FIG. 13The difference between obstructive sleep apnea and central sleep apnea is the lack of movement of respiratory muscle with the latter. This can be observed in FIG. 13 where a two-minute sequence of a blood volume trace and nasal prong trace are compared during apnea events. Based on the blood volume trace it is observed that the respiratory cycling is absent during the apnea periods (based on the nasal prongs). The vertical dotted lines shows alignment between the respiratory activity for both transducers. In contrast, FIG. 14 characterises obstructive sleep apnea, where respiratory effort persists during apnea events.
Landscapes
- Health & Medical Sciences (AREA)
- Life Sciences & Earth Sciences (AREA)
- Physics & Mathematics (AREA)
- Heart & Thoracic Surgery (AREA)
- Molecular Biology (AREA)
- Veterinary Medicine (AREA)
- Biophysics (AREA)
- Pathology (AREA)
- Engineering & Computer Science (AREA)
- Biomedical Technology (AREA)
- Public Health (AREA)
- Medical Informatics (AREA)
- General Health & Medical Sciences (AREA)
- Surgery (AREA)
- Animal Behavior & Ethology (AREA)
- Optics & Photonics (AREA)
- Neurology (AREA)
- Spectroscopy & Molecular Physics (AREA)
- Physiology (AREA)
- Dentistry (AREA)
- Oral & Maxillofacial Surgery (AREA)
- Measurement Of The Respiration, Hearing Ability, Form, And Blood Characteristics Of Living Organisms (AREA)
Abstract
Description
- 1) The skin (finger) is a low metabolizing tissue that is unlikely to reflect the oxygen saturation changes experienced by high metabolizing organs, particularly the heart and brain.
- 2) The finger attachment is not appropriate for use on subjects who thrash around during the study, as a consequence of continual arousal (dislodgment of the oximeter probe is one of the most common equipment failures in respiratory monitoring). Body movement leads to changes in baseline referred to as movement artefact, which can be inaccurately interpreted as desaturation events. Tightly clamping probes, which can reduce this movement artefact, tends to be uncomfortable when used for long periods.
- 3) The accuracy of pulse oximetry at low blood-oxygen saturation levels has been called into question by investigators (Mertzluffi and Zander, (1991); In the Oxygen Status of Arterial Blood. Ed. Zander R. and Mertzlufft F., Publ. Karger, N.Y., p 106-123).
- 4) The pulse-oximeter depends on pulsatile blood flow for timing in sampling. During hypoxia, pulsatile flow can be difficult to pick up in the skin due to tissue capillary-bed bypassing of the blood in the skin, via arteriolar-venular shunts, when oxygenated blood is diverted to increase critical tissue perfusion.
- (1) Pulse oximetry relies in part on visible radiation, usually at 660 nm, which limits photon penetration to several millimeters travel through tissue, whereas near infrared radiation has significantly greater penetration;
- (2) NIRS is optimized to measure deoxyhemoglobin proportions, whereas pulse oximetry which is optimized to measure oxyhemoglobin levels.
- (a) exposing the patient's cerebral tissue to radiation, the radiation having at least first and second predetermined wavelengths, the first and second predetermined wavelengths being between about 730 nm to 770 nm, and 790 nm to 830 nm respectively;
- (b) sensing the levels of radiation reflected by the cerebral tissue at the first and second predetermined wavelengths;
- (c) in a calibration step:
- (i) determining reflection levels for first and second patient orientations; and,
- (ii) using the determined reflection levels to determine a calibration factor; and
- (d) in a monitoring step:
- (i) calculating a blood oxygen index in accordance with the sensed reflected radiation and the calibration factor; and,
- (ii) detecting a presence or absence of disordered respiration in the patient based at least in part on changes in the blood oxygen index determined in accordance with the calibration factor.
- (e) the patient lying on their back; and,
- (f) the patient lying on their side.
|B−A|
- wherein:
- A is the reflected level at the first predetermined frequency; and,
- B is the reflected level at the second predetermined frequency.
- wherein:
|B−kA| or [Ak−B]
- wherein:
- k is the calibration factor.
- wherein:
- a) selectively exposing the patient's cerebral tissue to radiation;
- b) sensing reflected radiation when the patient's cerebral tissue is exposed, to determine an exposed level;
- c) sensing radiation when the patient's cerebral tissue is not exposed to determine an ambient radiation level; and,
- d) determining a reflected level by subtracting the ambient radiation level from the exposed level.
- (a) exposing the patient's cerebral tissue to radiation, the radiation having at least first and second predetermined wavelengths, the first and second predetermined wavelengths being between about 730 nm to 770 nm, and 790 nm to 830 nm respectively;
- (b) sensing the levels of radiation absorbed by the cerebral tissue at the first and second predetermined wavelengths;
- (c) in a calibration step:
- (i) determining absorption levels for first and second patient orientations; and,
- (ii) using the determined absorption levels to determine a calibration factor; and
- (d) in a monitoring step:
- (i) calculating a blood oxygen index in accordance with the sensed absorbed radiation and the calibration factor; and,
detecting a flow response time to a hydrostatic pressure adjustment in the patient based at least in part on changes in the blood oxygen index determined in accordance with the calibration factor.
- (i) calculating a blood oxygen index in accordance with the sensed absorbed radiation and the calibration factor; and,
- (a) a radiation source for exposing the patient's cerebral tissue to radiation, the radiation having at least first and second predetermined wavelengths, the first and second predetermined wavelengths being between about 730 nm to 770 nm, and 790 nm to 830 nm respectively;
- (b) a sensor for sensing the level of radiation reflected by the cerebral tissue at the first and second predetermined wavelengths; and,
- (c) a processor for:
- (i) in a calibration step:
- (a) determining reflected radiation levels for first and second patient orientations; and,
- (b) using the determined absorption levels to determine a calibration factor; and
- (ii) in a monitoring step:
- (a) calculating a blood oxygen index in accordance with the sensed absorbed radiation and the calibration factor; and,
- (b) detecting a presence or absence of disordered respiration in the patient based at least in part on changes in the blood oxygen index determined in accordance with the calibration factor.
- (i) in a calibration step:
- (a) selectively activate the radiation source to thereby expose the patient's cerebral tissue to radiation;
- (b) selectively sample signals from the sensor to thereby sense radiation when:
- (i) the patient's cerebral tissue is exposed to determine an exposed radiation level;
- (ii) the patient's cerebral tissue is not exposed to determine an ambient radiation level; and,
- (c) determine a reflected level by subtracting the ambient level from the exposed level.
- (a) a processor for controlling the radiation source and the sampling time interval of the sensor; and,
- (b) a memory for storing reflected level signal values.
Claims (31)
|B−A|
|B−kA| or [Ak−B]
Priority Applications (1)
| Application Number | Priority Date | Filing Date | Title |
|---|---|---|---|
| US11/091,396US7570979B2 (en) | 2004-03-30 | 2005-03-29 | Methods and apparatus for patient monitoring |
Applications Claiming Priority (2)
| Application Number | Priority Date | Filing Date | Title |
|---|---|---|---|
| US55836404P | 2004-03-30 | 2004-03-30 | |
| US11/091,396US7570979B2 (en) | 2004-03-30 | 2005-03-29 | Methods and apparatus for patient monitoring |
Publications (2)
| Publication Number | Publication Date |
|---|---|
| US20050222502A1 US20050222502A1 (en) | 2005-10-06 |
| US7570979B2true US7570979B2 (en) | 2009-08-04 |
Family
ID=35055319
Family Applications (1)
| Application Number | Title | Priority Date | Filing Date |
|---|---|---|---|
| US11/091,396Expired - Fee RelatedUS7570979B2 (en) | 2004-03-30 | 2005-03-29 | Methods and apparatus for patient monitoring |
Country Status (1)
| Country | Link |
|---|---|
| US (1) | US7570979B2 (en) |
Cited By (12)
| Publication number | Priority date | Publication date | Assignee | Title |
|---|---|---|---|---|
| US20070181127A1 (en)* | 2006-01-20 | 2007-08-09 | Shenzhen Mindray Bio-Medical Electronics Co., Ltd | Method for judging the reverse connection of a flow sensor and a respiratory mechanics measuring module used therein |
| US20100312076A1 (en)* | 2009-06-03 | 2010-12-09 | Bly Deborah C | Pop box methods and systems for assessing risk of pressure related skin injury and determining a recommended treatment thereof |
| WO2014035947A1 (en)* | 2012-08-28 | 2014-03-06 | Fresenius Medical Care Holdings, Inc. | Detecting indications of intradialytic morbid events by measurement of relative blood volume, blood pressure and heart rate |
| US8790269B2 (en) | 2011-05-09 | 2014-07-29 | Xerox Corporation | Monitoring respiration with a thermal imaging system |
| US8971985B2 (en) | 2012-06-01 | 2015-03-03 | Xerox Corporation | Minute ventilation estimation based on depth maps |
| US9226691B2 (en) | 2012-06-01 | 2016-01-05 | Xerox Corporation | Processing a video for tidal chest volume estimation |
| US9301710B2 (en) | 2012-06-01 | 2016-04-05 | Xerox Corporation | Processing a video for respiration rate estimation |
| US9514537B2 (en) | 2013-12-27 | 2016-12-06 | Xerox Corporation | System and method for adaptive depth map reconstruction |
| US11350874B2 (en) | 2016-10-11 | 2022-06-07 | ResMed Pty Ltd | Apparatus and methods for screening, diagnosis and monitoring of respiratory disorders |
| US20220265240A1 (en)* | 2006-03-23 | 2022-08-25 | Michael E. Sabatino | Acquiring and processing acoustic energy emitted by at least one organ in a biological system |
| US20220287630A1 (en)* | 2013-06-28 | 2022-09-15 | North Carolina State University | Systems and methods for determining sleep patterns and circadian rhythms |
| US11864923B2 (en) | 2021-08-09 | 2024-01-09 | JMad Creations, LLC | Method for reducing melanin bias in pulse oximeters |
Families Citing this family (62)
| Publication number | Priority date | Publication date | Assignee | Title |
|---|---|---|---|---|
| WO2004075746A2 (en) | 2003-02-27 | 2004-09-10 | Cardiodigital Limited | Method and system for analysing and processing ph0t0plethysmogram signals using wavelet transform |
| US8055320B2 (en)* | 2005-10-31 | 2011-11-08 | Konica Minolta Sensing, Inc. | Vital information measuring device |
| US7942824B1 (en)* | 2005-11-04 | 2011-05-17 | Cleveland Medical Devices Inc. | Integrated sleep diagnostic and therapeutic system and method |
| US7678058B2 (en)* | 2006-06-22 | 2010-03-16 | Cardiac Pacemakers, Inc. | Apnea type determining apparatus and method |
| US8360983B2 (en) | 2006-06-22 | 2013-01-29 | Cardiac Pacemakers, Inc. | Apnea type determining apparatus and method |
| US8195264B2 (en) | 2006-09-22 | 2012-06-05 | Nellcor Puritan Bennett Llc | Medical sensor for reducing signal artifacts and technique for using the same |
| US8175671B2 (en) | 2006-09-22 | 2012-05-08 | Nellcor Puritan Bennett Llc | Medical sensor for reducing signal artifacts and technique for using the same |
| US8396527B2 (en) | 2006-09-22 | 2013-03-12 | Covidien Lp | Medical sensor for reducing signal artifacts and technique for using the same |
| US7643858B2 (en) | 2006-09-28 | 2010-01-05 | Nellcor Puritan Bennett Llc | System and method for detection of brain edema using spectrophotometry |
| EP2083687A1 (en)* | 2006-09-29 | 2009-08-05 | Ottawa Health Research Institute | Correlation technique for analysis of clinical condition |
| US8265724B2 (en) | 2007-03-09 | 2012-09-11 | Nellcor Puritan Bennett Llc | Cancellation of light shunting |
| US12245852B2 (en) | 2007-06-12 | 2025-03-11 | Sotera Wireless, Inc. | Optical sensors for use in vital sign monitoring |
| US20090247837A1 (en)* | 2008-03-27 | 2009-10-01 | Nellcor Puritan Bennett Llc | System And Method For Diagnosing Sleep Apnea |
| US8398555B2 (en) | 2008-09-10 | 2013-03-19 | Covidien Lp | System and method for detecting ventilatory instability |
| US9314168B2 (en) | 2008-09-30 | 2016-04-19 | Nellcor Puritan Bennett Ireland | Detecting sleep events using localized blood pressure changes |
| US9155493B2 (en) | 2008-10-03 | 2015-10-13 | Nellcor Puritan Bennett Ireland | Methods and apparatus for calibrating respiratory effort from photoplethysmograph signals |
| US9011347B2 (en) | 2008-10-03 | 2015-04-21 | Nellcor Puritan Bennett Ireland | Methods and apparatus for determining breathing effort characteristics measures |
| EP2348960A1 (en) | 2008-11-05 | 2011-08-03 | Nellcor Puritan Bennett LLC | System and method for facilitating observation of monitored physiologic data |
| US20110092839A1 (en)* | 2008-11-17 | 2011-04-21 | Toronto Rehabilitation Institute | Mask and method for use in respiratory monitoring and diagnostics |
| CA2739351C (en) | 2008-11-17 | 2013-01-29 | Toronto Rehabilitation Institute | Method and apparatus for monitoring breathing cycle by frequency analysis of an acoustic data stream |
| US9949667B2 (en) | 2008-11-17 | 2018-04-24 | University Health Network | Mask and method for use in respiratory monitoring and diagnostics |
| CN102316800A (en)* | 2009-02-12 | 2012-01-11 | 俄勒冈健康科学大学 | Method and device for preventing apnea |
| JP5196323B2 (en)* | 2009-02-23 | 2013-05-15 | 日本光電工業株式会社 | Blood oxygen saturation measuring device |
| US8515515B2 (en) | 2009-03-25 | 2013-08-20 | Covidien Lp | Medical sensor with compressible light barrier and technique for using the same |
| US8460196B2 (en)* | 2009-05-29 | 2013-06-11 | Atlantis Limited Partnership | Method and apparatus for monitoring brain activity |
| US8444570B2 (en)* | 2009-06-09 | 2013-05-21 | Nellcor Puritan Bennett Ireland | Signal processing techniques for aiding the interpretation of respiration signals |
| US9775529B2 (en)* | 2009-06-17 | 2017-10-03 | Sotera Wireless, Inc. | Body-worn pulse oximeter |
| US20100331716A1 (en)* | 2009-06-26 | 2010-12-30 | Nellcor Puritan Bennett Ireland | Methods and apparatus for measuring respiratory function using an effort signal |
| US8755854B2 (en) | 2009-07-31 | 2014-06-17 | Nellcor Puritan Bennett Ireland | Methods and apparatus for producing and using lightly filtered photoplethysmograph signals |
| CN102035917A (en)* | 2009-09-29 | 2011-04-27 | 深圳富泰宏精密工业有限公司 | Mobile telephone |
| US9066660B2 (en) | 2009-09-29 | 2015-06-30 | Nellcor Puritan Bennett Ireland | Systems and methods for high-pass filtering a photoplethysmograph signal |
| US8428677B2 (en) | 2010-05-28 | 2013-04-23 | Covidien Lp | Retinopathy of prematurity determination and alarm system |
| US8374666B2 (en) | 2010-05-28 | 2013-02-12 | Covidien Lp | Retinopathy of prematurity determination and alarm system |
| US8834378B2 (en) | 2010-07-30 | 2014-09-16 | Nellcor Puritan Bennett Ireland | Systems and methods for determining respiratory effort |
| US8521247B2 (en) | 2010-12-29 | 2013-08-27 | Covidien Lp | Certification apparatus and method for a medical device computer |
| EP2709525B1 (en) | 2011-05-17 | 2022-02-23 | University Health Network | Apnea and hypopnea detection using breath pattern recognition |
| US9801590B2 (en) | 2011-05-17 | 2017-10-31 | University Health Network | Breathing disorder identification, characterization and diagnosis methods, devices and systems |
| US9402554B2 (en) | 2011-09-23 | 2016-08-02 | Nellcor Puritan Bennett Ireland | Systems and methods for determining respiration information from a photoplethysmograph |
| US9675274B2 (en) | 2011-09-23 | 2017-06-13 | Nellcor Puritan Bennett Ireland | Systems and methods for determining respiration information from a photoplethysmograph |
| US9693709B2 (en) | 2011-09-23 | 2017-07-04 | Nellcot Puritan Bennett Ireland | Systems and methods for determining respiration information from a photoplethysmograph |
| US9119597B2 (en) | 2011-09-23 | 2015-09-01 | Nellcor Puritan Bennett Ireland | Systems and methods for determining respiration information from a photoplethysmograph |
| US8880576B2 (en) | 2011-09-23 | 2014-11-04 | Nellcor Puritan Bennett Ireland | Systems and methods for determining respiration information from a photoplethysmograph |
| US9693736B2 (en) | 2011-11-30 | 2017-07-04 | Nellcor Puritan Bennett Ireland | Systems and methods for determining respiration information using historical distribution |
| US8755871B2 (en) | 2011-11-30 | 2014-06-17 | Covidien Lp | Systems and methods for detecting arrhythmia from a physiological signal |
| US9138181B2 (en)* | 2011-12-16 | 2015-09-22 | Covidien Lp | Medical sensor for use with headband |
| US9247896B2 (en) | 2012-01-04 | 2016-02-02 | Nellcor Puritan Bennett Ireland | Systems and methods for determining respiration information using phase locked loop |
| US8880155B2 (en) | 2012-02-24 | 2014-11-04 | Covidien Lp | Hypovolemia diagnosis technique |
| US9179876B2 (en) | 2012-04-30 | 2015-11-10 | Nellcor Puritan Bennett Ireland | Systems and methods for identifying portions of a physiological signal usable for determining physiological information |
| US8740806B2 (en)* | 2012-11-07 | 2014-06-03 | Somnarus Inc. | Methods for detection of respiratory effort and sleep apnea monitoring devices |
| RU2653799C2 (en)* | 2012-11-23 | 2018-05-14 | Конинклейке Филипс Н.В. | Device and method for extracting physiological information |
| US9560978B2 (en) | 2013-02-05 | 2017-02-07 | Covidien Lp | Systems and methods for determining respiration information from a physiological signal using amplitude demodulation |
| US9554712B2 (en) | 2013-02-27 | 2017-01-31 | Covidien Lp | Systems and methods for generating an artificial photoplethysmograph signal |
| US9687159B2 (en) | 2013-02-27 | 2017-06-27 | Covidien Lp | Systems and methods for determining physiological information by identifying fiducial points in a physiological signal |
| US10022068B2 (en) | 2013-10-28 | 2018-07-17 | Covidien Lp | Systems and methods for detecting held breath events |
| US9848820B2 (en) | 2014-01-07 | 2017-12-26 | Covidien Lp | Apnea analysis system and method |
| CA2932826A1 (en) | 2014-02-20 | 2015-08-27 | Covidien Lp | Systems and methods for filtering autocorrelation peaks and detecting harmonics |
| CN106031639A (en)* | 2015-03-07 | 2016-10-19 | 上海贝瑞电子科技有限公司 | A high precision blood oxygen detection management method and system |
| US10506969B2 (en) | 2015-11-03 | 2019-12-17 | University Health Network | Acoustic upper airway assessment system and method, and sleep apnea assessment system and method relying thereon |
| KR101844669B1 (en)* | 2016-08-10 | 2018-04-02 | 한국과학기술원 | Method, system and non-transitory computer-readable recording medium for monitoring hemodynamics |
| CN114246549A (en)* | 2020-09-23 | 2022-03-29 | 京东方科技集团股份有限公司 | Electronic device and computer-readable storage medium for detecting apnea |
| EP4342374A4 (en)* | 2021-08-11 | 2024-08-28 | Samsung Electronics Co., Ltd. | ELECTRONIC OXYGEN SATURATION CORRECTION DEVICE AND ASSOCIATED CONTROL METHOD |
| CN114366089A (en)* | 2022-01-11 | 2022-04-19 | 陈瑞燕 | Near infrared spectrum device capable of being worn on head |
Citations (20)
| Publication number | Priority date | Publication date | Assignee | Title |
|---|---|---|---|---|
| US4086915A (en)* | 1975-04-30 | 1978-05-02 | Harvey I. Kofsky | Ear oximetry process and apparatus |
| US4796636A (en)* | 1987-09-10 | 1989-01-10 | Nippon Colin Co., Ltd. | Noninvasive reflectance oximeter |
| US5482034A (en)* | 1993-05-28 | 1996-01-09 | Somanetics Corporation | Method and apparatus for spectrophotometric cerebral oximetry and the like |
| US5542421A (en)* | 1992-07-31 | 1996-08-06 | Frederick Erdman Association | Method and apparatus for cardiovascular diagnosis |
| US5795292A (en)* | 1994-10-14 | 1998-08-18 | Somanetics Corporation | Method for improving signal-to-noise in clinical spectrometric procedures |
| US5902235A (en)* | 1989-03-29 | 1999-05-11 | Somanetics Corporation | Optical cerebral oximeter |
| US6171258B1 (en)* | 1998-10-08 | 2001-01-09 | Sleep Solutions, Inc. | Multi-channel self-contained apparatus and method for diagnosis of sleep disorders |
| US6421549B1 (en)* | 1999-07-14 | 2002-07-16 | Providence Health System-Oregon | Adaptive calibration pulsed oximetry method and device |
| US20020099295A1 (en)* | 1999-11-26 | 2002-07-25 | Applied Spectral Imaging Ltd. | System and method for functional brain mapping and an oxygen saturation difference map algorithm for effecting same |
| US6438399B1 (en)* | 1999-02-16 | 2002-08-20 | The Children's Hospital Of Philadelphia | Multi-wavelength frequency domain near-infrared cerebral oximeter |
| US6498942B1 (en)* | 1999-08-06 | 2002-12-24 | The University Of Texas System | Optoacoustic monitoring of blood oxygenation |
| US6615065B1 (en)* | 1998-10-13 | 2003-09-02 | Somanetics Corporation | Multi-channel non-invasive tissue oximeter |
| US20040039270A1 (en)* | 2000-07-21 | 2004-02-26 | Emmaneula Keller | Probe and apparatus for measuring cerebral hemodynamics and oxygenation |
| US20040054290A1 (en)* | 1995-01-03 | 2004-03-18 | Britton Chance | Spectrophotometer for in vivo examination of biological tissue |
| US6711425B1 (en)* | 2002-05-28 | 2004-03-23 | Ob Scientific, Inc. | Pulse oximeter with calibration stabilization |
| US6811538B2 (en)* | 2000-12-29 | 2004-11-02 | Ares Medical, Inc. | Sleep apnea risk evaluation |
| US6839580B2 (en)* | 2001-12-06 | 2005-01-04 | Ric Investments, Inc. | Adaptive calibration for pulse oximetry |
| US20050189861A1 (en)* | 2004-02-27 | 2005-09-01 | Matsushita Toshiba Picture Display Co., Ltd. | Projection tube apparatus |
| US20050277818A1 (en)* | 2004-05-18 | 2005-12-15 | Hutchinson Technology Incorporated | Optimized wavelength gap for improved StO2 measurement |
| US20060173257A1 (en)* | 2005-01-31 | 2006-08-03 | Konica Minolta Sensing, Inc. | Sleep evaluation method, sleep evaluation system, operation program for sleep evaluation system, pulse oximeter, and sleep support system |
- 2005
- 2005-03-29USUS11/091,396patent/US7570979B2/ennot_activeExpired - Fee Related
Patent Citations (21)
| Publication number | Priority date | Publication date | Assignee | Title |
|---|---|---|---|---|
| US4086915A (en)* | 1975-04-30 | 1978-05-02 | Harvey I. Kofsky | Ear oximetry process and apparatus |
| US4796636A (en)* | 1987-09-10 | 1989-01-10 | Nippon Colin Co., Ltd. | Noninvasive reflectance oximeter |
| US5902235A (en)* | 1989-03-29 | 1999-05-11 | Somanetics Corporation | Optical cerebral oximeter |
| US5542421A (en)* | 1992-07-31 | 1996-08-06 | Frederick Erdman Association | Method and apparatus for cardiovascular diagnosis |
| US5482034A (en)* | 1993-05-28 | 1996-01-09 | Somanetics Corporation | Method and apparatus for spectrophotometric cerebral oximetry and the like |
| US5795292A (en)* | 1994-10-14 | 1998-08-18 | Somanetics Corporation | Method for improving signal-to-noise in clinical spectrometric procedures |
| US20040054290A1 (en)* | 1995-01-03 | 2004-03-18 | Britton Chance | Spectrophotometer for in vivo examination of biological tissue |
| US6171258B1 (en)* | 1998-10-08 | 2001-01-09 | Sleep Solutions, Inc. | Multi-channel self-contained apparatus and method for diagnosis of sleep disorders |
| US6615065B1 (en)* | 1998-10-13 | 2003-09-02 | Somanetics Corporation | Multi-channel non-invasive tissue oximeter |
| US6438399B1 (en)* | 1999-02-16 | 2002-08-20 | The Children's Hospital Of Philadelphia | Multi-wavelength frequency domain near-infrared cerebral oximeter |
| US6421549B1 (en)* | 1999-07-14 | 2002-07-16 | Providence Health System-Oregon | Adaptive calibration pulsed oximetry method and device |
| US6498942B1 (en)* | 1999-08-06 | 2002-12-24 | The University Of Texas System | Optoacoustic monitoring of blood oxygenation |
| US20020099295A1 (en)* | 1999-11-26 | 2002-07-25 | Applied Spectral Imaging Ltd. | System and method for functional brain mapping and an oxygen saturation difference map algorithm for effecting same |
| US20040039270A1 (en)* | 2000-07-21 | 2004-02-26 | Emmaneula Keller | Probe and apparatus for measuring cerebral hemodynamics and oxygenation |
| US6811538B2 (en)* | 2000-12-29 | 2004-11-02 | Ares Medical, Inc. | Sleep apnea risk evaluation |
| US7297119B2 (en)* | 2000-12-29 | 2007-11-20 | Ares Medical, Inc. | Sleep apnea risk evaluation |
| US6839580B2 (en)* | 2001-12-06 | 2005-01-04 | Ric Investments, Inc. | Adaptive calibration for pulse oximetry |
| US6711425B1 (en)* | 2002-05-28 | 2004-03-23 | Ob Scientific, Inc. | Pulse oximeter with calibration stabilization |
| US20050189861A1 (en)* | 2004-02-27 | 2005-09-01 | Matsushita Toshiba Picture Display Co., Ltd. | Projection tube apparatus |
| US20050277818A1 (en)* | 2004-05-18 | 2005-12-15 | Hutchinson Technology Incorporated | Optimized wavelength gap for improved StO2 measurement |
| US20060173257A1 (en)* | 2005-01-31 | 2006-08-03 | Konica Minolta Sensing, Inc. | Sleep evaluation method, sleep evaluation system, operation program for sleep evaluation system, pulse oximeter, and sleep support system |
Non-Patent Citations (26)
| Title |
|---|
| Boushel, R. et al., "Monitoring availability with near infrared spectroscopy (NIRS) in health and disease," Scandinavian Journal of Medicine and Science in Sports, vol. 11, pp. 213-222, 2001. |
| Brazy, Jane E. et al., "Noninvasive Monitoring of Cerebral Oxygenation in Preterm Infants: Preliminary Observations," Pediatrics, Vo. 75, No. 2, pp. 217-225, 1985. |
| Chapman, K. R., et al., "Range of Accuracy of Two Wavelength Oximetry," Chest vol. 89, No. 4, pp. 540-542, 1986. |
| Davies, S. W. et al., "Abnormal diastolic filling patterns in chronic heart failure-relationship to exercise capacity," European Heart Journal , vol. 13, pp. 749-757, 1992. |
| Dyer, John R., "Infrared Spectroscopy," Application of Absorption Spectroscopy of Organic Compounds, published by Prentice-Hall Inc., New Jersey, Foundations of Modern Organic Chemistry series, Chap. 3, pp. 22-57, 1965. |
| Editorial, "Sleep Apnea-A major public health problem," N. Engl. J. Med., vol. 328, pp. 1271-1273, 1993. |
| Falke, K. J., "Therapeutic Thresholds for Acute Changes in Arterial O2 Partial Pressure," The Oxygen Status of Arterial Blood, edited by Zander and Mertzlufft, Karger, Basel, pp. 63-71, 1991. |
| Ferrari, M, et al., "Principles, techniques, and limitations of near infrared spectroscopy," Pub. Med., Can. J. Appl. Physiol., vol. 4, pp. 463-487, 2004. |
| Ferrari, Marco, et al., "Effects of graded hypotension on cerebral blood flow, blood volume, and mean transit time in dogs," Am. J. Physiol. 262 (Heart Circ. Physiol. 31) pp. H1908-H1914, 1992. |
| Ferrari, Marco, et al., "Noninvasive determination of hemoglobin saturation in dogs by derivative near-infrared spectroscopy," Am. J. Physiol. 256 (Heart Circ. Phsiol. 25) pp. H1493-H1499, 1989. |
| Gagnadoux, Frédéric, MD, et al., "Home Unattended vs Hospital Telemonitored Polysomnography in Suspected Obstructive Sleep Apnea Syndrome," Chest, vol. 121, pp. 753-758, 2002. |
| Grace, R.F., "Pulse oximetry, Gold standard of false sense of security?," abstract only, Pub Med., Med. J.Aust. vol. 160, No. 10, pp. 638-644, 1994. |
| Guilleminault, Christian, MD, et al., "Cardiac Arrhythmia and Conduction Disturbances During Sleep in 400 Patients with Sleep Apnea Syndrome," Am. J. Cardio., vol. 52, pp. 490-494, 1983. |
| Hayakawa, T., et al., "Changes in Cerebral Oxygenation and Hernodynamics During Obstructive Sleep Apneas," Chest, vol. 109, No. 4, pp. 916-921, 1996. |
| He, J. et al., "Mortality and apnea index in obstructive sleep apnea. Experience in 385 male patients," abstract only, Pub. Med., Chest, vol. 94, No. 1, pp. 9-14, 1988. |
| Hernández, Lourdes, MD, "Performance of Nasal Prongs in Sleep Studies," Chest, vol. 119, No. 2, pp. 442-450, 2001. |
| Jöbsis, Franz F., "Noninvasive, Infrared Monitoring of Cerebral and Myocardial Oxygen Sufficiency and Circulatory Parameters," Science, vol. 198, pp. 1264-1267, 1977. |
| Le Bon, Oliver, et al., "Mild to Moderate Sleep Respiratory Events," Chest, vol. 118, No. 2, pp. 353-359, 2000. |
| Leger, Damien, "The Cost of Sleep-Related Accidents: A Report for the National Commission on Sleep Disorders Research," Sleep, vol. 17, No. 1, pp. 84-93, 1994. |
| Mertzlufft, F. et al., "Non-Invasive Continuous Measurement of Arterial Partial O2 Saturation: Pulse Oxymetry," The Oxygen Status of Arterial Blood, edited by Zander and Mertzlufft, Pub. Karger, pp. 106-123, 1991. |
| Severinghaus, John W. MD et al., "Accuracy of Response of Six Pulse Oximeters to Profound Hypoxia," Anesthesiology, vol. 67, pp. 551-558, 1987. |
| Sevick, E. M. et al., "Quantitation of Time-and Frequency-Resolved Optical Spectra for the Determination of Tissue Oxygenation," Analytical Biochemistry, vol. 195, pp. 330-351, 1991. |
| Wahr, Joyce A. et al., "Near-Infrared Spectroscopy: Theory and Applications," Journal of Cardiothoracic and Vascular Anesthesia, vol. 10, No. 3, pp. 405-418, 1996. |
| Wilson, John R. MD et al., "Noninvasive Detection of Skeletal Muscle Underperfusion With Near-Infrared Spectroscopy in Patients With Heart Failure," Circulation, vol. 80, No. 6, pp. 1668-1674, 1989. |
| Young, Terry et al., "The Occurrence of Sleep-Disordered Breathing among Middle-Aged Adults," New England Journal of Medicine, vol. 328, pp. 1230-1235, 1993. |
| Zafar, Subooha MD et al., "Choice of Oximeter Affects Apnea-Hypopnea Index," Chest, vol. 127, pp. 80-88, 2005. |
Cited By (19)
| Publication number | Priority date | Publication date | Assignee | Title |
|---|---|---|---|---|
| US7861711B2 (en)* | 2006-01-20 | 2011-01-04 | Shenzhen Mindray Bio-Medical Electronics Co., Ltd. | Method for judging the reverse connection of a flow sensor and a respiratory mechanics measuring module used therein |
| US20070181127A1 (en)* | 2006-01-20 | 2007-08-09 | Shenzhen Mindray Bio-Medical Electronics Co., Ltd | Method for judging the reverse connection of a flow sensor and a respiratory mechanics measuring module used therein |
| US12138106B2 (en)* | 2006-03-23 | 2024-11-12 | Michael E. Sabatino | Acquiring and processing acoustic energy emitted by at least one organ in a biological system |
| US20220265240A1 (en)* | 2006-03-23 | 2022-08-25 | Michael E. Sabatino | Acquiring and processing acoustic energy emitted by at least one organ in a biological system |
| US11172871B2 (en) | 2009-06-03 | 2021-11-16 | Deborah C Bly | Method of treatment of pressure related skin injury |
| US20100312076A1 (en)* | 2009-06-03 | 2010-12-09 | Bly Deborah C | Pop box methods and systems for assessing risk of pressure related skin injury and determining a recommended treatment thereof |
| US8790269B2 (en) | 2011-05-09 | 2014-07-29 | Xerox Corporation | Monitoring respiration with a thermal imaging system |
| US9301710B2 (en) | 2012-06-01 | 2016-04-05 | Xerox Corporation | Processing a video for respiration rate estimation |
| US9226691B2 (en) | 2012-06-01 | 2016-01-05 | Xerox Corporation | Processing a video for tidal chest volume estimation |
| US8971985B2 (en) | 2012-06-01 | 2015-03-03 | Xerox Corporation | Minute ventilation estimation based on depth maps |
| US9974491B2 (en) | 2012-08-28 | 2018-05-22 | Fresenius Medical Care Holdings, Inc. | Detecting indications of intradialytic morbid events by measurement of relative blood volume, blood pressure and heart rate |
| WO2014035947A1 (en)* | 2012-08-28 | 2014-03-06 | Fresenius Medical Care Holdings, Inc. | Detecting indications of intradialytic morbid events by measurement of relative blood volume, blood pressure and heart rate |
| US20220287630A1 (en)* | 2013-06-28 | 2022-09-15 | North Carolina State University | Systems and methods for determining sleep patterns and circadian rhythms |
| US12114997B2 (en)* | 2013-06-28 | 2024-10-15 | North Carolina State University | Systems and methods for determining sleep patterns and circadian rhythms |
| US9514537B2 (en) | 2013-12-27 | 2016-12-06 | Xerox Corporation | System and method for adaptive depth map reconstruction |
| US11350874B2 (en) | 2016-10-11 | 2022-06-07 | ResMed Pty Ltd | Apparatus and methods for screening, diagnosis and monitoring of respiratory disorders |
| US11986314B2 (en) | 2016-10-11 | 2024-05-21 | ResMed Pty Ltd | Apparatus and methods for screening, diagnosis and monitoring of respiratory disorders |
| US11864923B2 (en) | 2021-08-09 | 2024-01-09 | JMad Creations, LLC | Method for reducing melanin bias in pulse oximeters |
| US11864921B2 (en) | 2021-08-09 | 2024-01-09 | JMad Creations, LLC | Melanin-bias reducing pulse oximeter and patient monitoring systems and devices |
Also Published As
| Publication number | Publication date |
|---|---|
| US20050222502A1 (en) | 2005-10-06 |
Similar Documents
| Publication | Publication Date | Title |
|---|---|---|
| US7570979B2 (en) | Methods and apparatus for patient monitoring | |
| US12419588B2 (en) | System and method for monitoring respiratory rate measurements | |
| US11571139B2 (en) | Wearable system and method for measuring oxygen saturation | |
| KR102386000B1 (en) | System for sleep apnea monitoring | |
| US6529752B2 (en) | Sleep disorder breathing event counter | |
| JP5296312B2 (en) | Blood volume evaluation method using photoelectric volumetric pulse wave method | |
| KR100552681B1 (en) | Sleep apnea diagnostic apparatus and method | |
| US20110082357A1 (en) | Method and apparatus for co2 evaluation | |
| EP4218558A1 (en) | System and method for monitoring respiratory rate and oxygen saturation | |
| Foo et al. | Estimation of breathing interval from the photoplethysmographic signals in children | |
| US20230157572A1 (en) | Continuous Self-Recalibrating System and Method for Monitoring Oxygen Saturation | |
| García-López et al. | Characterization study of neck photoplethysmography | |
| JP2022167320A (en) | Pulse wave analysis device, pulse wave analysis method, and pulse wave analysis program | |
| Bhadra | Intraoral Monitoring of Photoplethysmogram Signal to Estimate Cardiorespiratory | |
| Huotari et al. | Arterial pulse wave analysis based on PPG and EMFi measurements | |
| Chuang | Quantification of Nocturnal Blood Pressure Oscillations in Obstructive Sleep Apnea Patients | |
| Debbarma et al. | Intraoral Monitoring of Photoplethysmogram Signal to Estimate Cardiorespiratory Parameters | |
| WO2024157240A1 (en) | Continuous self-recalibrating system and method for monitoring oxygen saturation | |
| Mainsah et al. | Design of a Dual Heart Rate Variability Monitor | |
| Magee | Physiological monitoring: principles and non-invasive monitoring | |
| Berelowitz | The development of a neonatal vital signs database | |
| Cysewska-Sobusiak | Noninvasive optoelectronic monitoring of the living tissues vitality | |
| Priyadharshini et al. | Pulse Sensor for Diagnosis and Analysis of Heart Rate Using Peak Detection Technique | |
| Yuan et al. | Motion Artefact Minimisation from Photoplethysmography based Non-invasive Hemoglobin Sensor by the Envelope Method | |
| Frazier et al. | Physiological Data Collection Methods |
Legal Events
| Date | Code | Title | Description |
|---|---|---|---|
| FEPP | Fee payment procedure | Free format text:PETITION RELATED TO MAINTENANCE FEES FILED (ORIGINAL EVENT CODE: PMFP); ENTITY STATUS OF PATENT OWNER: SMALL ENTITY Free format text:PETITION RELATED TO MAINTENANCE FEES GRANTED (ORIGINAL EVENT CODE: PMFG); ENTITY STATUS OF PATENT OWNER: SMALL ENTITY | |
| REMI | Maintenance fee reminder mailed | ||
| LAPS | Lapse for failure to pay maintenance fees | ||
| REIN | Reinstatement after maintenance fee payment confirmed | ||
| FPAY | Fee payment | Year of fee payment:4 | |
| PRDP | Patent reinstated due to the acceptance of a late maintenance fee | Effective date:20130916 | |
| STCF | Information on status: patent grant | Free format text:PATENTED CASE | |
| SULP | Surcharge for late payment | ||
| FP | Lapsed due to failure to pay maintenance fee | Effective date:20130804 | |
| FPAY | Fee payment | Year of fee payment:8 | |
| AS | Assignment | Owner name:PORT-A-NIRS PTY LTD., AUSTRALIA Free format text:ASSIGNMENT OF ASSIGNORS INTEREST;ASSIGNOR:COOPER, PHILIP GEORGE;REEL/FRAME:045086/0722 Effective date:20180205 | |
| FEPP | Fee payment procedure | Free format text:MAINTENANCE FEE REMINDER MAILED (ORIGINAL EVENT CODE: REM.); ENTITY STATUS OF PATENT OWNER: SMALL ENTITY | |
| LAPS | Lapse for failure to pay maintenance fees | Free format text:PATENT EXPIRED FOR FAILURE TO PAY MAINTENANCE FEES (ORIGINAL EVENT CODE: EXP.); ENTITY STATUS OF PATENT OWNER: SMALL ENTITY | |
| STCH | Information on status: patent discontinuation | Free format text:PATENT EXPIRED DUE TO NONPAYMENT OF MAINTENANCE FEES UNDER 37 CFR 1.362 | |
| FP | Lapsed due to failure to pay maintenance fee | Effective date:20210804 |