US7518724B2 - Image acquisition, processing, and display - Google Patents
Image acquisition, processing, and displayDownload PDFInfo
- Publication number
- US7518724B2 US7518724B2US11/321,168US32116805AUS7518724B2US 7518724 B2US7518724 B2US 7518724B2US 32116805 AUS32116805 AUS 32116805AUS 7518724 B2US7518724 B2US 7518724B2
- Authority
- US
- United States
- Prior art keywords
- specimen
- array
- data
- spot
- spatially distributed
- Prior art date
- Legal status (The legal status is an assumption and is not a legal conclusion. Google has not performed a legal analysis and makes no representation as to the accuracy of the status listed.)
- Expired - Fee Related, expires
Links
Images


Classifications
- G—PHYSICS
- G06—COMPUTING OR CALCULATING; COUNTING
- G06T—IMAGE DATA PROCESSING OR GENERATION, IN GENERAL
- G06T7/00—Image analysis
- G06T7/0002—Inspection of images, e.g. flaw detection
- G06T7/0012—Biomedical image inspection
- G—PHYSICS
- G01—MEASURING; TESTING
- G01N—INVESTIGATING OR ANALYSING MATERIALS BY DETERMINING THEIR CHEMICAL OR PHYSICAL PROPERTIES
- G01N21/00—Investigating or analysing materials by the use of optical means, i.e. using sub-millimetre waves, infrared, visible or ultraviolet light
- G01N21/17—Systems in which incident light is modified in accordance with the properties of the material investigated
- G01N21/21—Polarisation-affecting properties
- G—PHYSICS
- G01—MEASURING; TESTING
- G01N—INVESTIGATING OR ANALYSING MATERIALS BY DETERMINING THEIR CHEMICAL OR PHYSICAL PROPERTIES
- G01N21/00—Investigating or analysing materials by the use of optical means, i.e. using sub-millimetre waves, infrared, visible or ultraviolet light
- G01N21/17—Systems in which incident light is modified in accordance with the properties of the material investigated
- G01N21/25—Colour; Spectral properties, i.e. comparison of effect of material on the light at two or more different wavelengths or wavelength bands
- G01N21/251—Colorimeters; Construction thereof
- G01N21/253—Colorimeters; Construction thereof for batch operation, i.e. multisample apparatus
- G—PHYSICS
- G01—MEASURING; TESTING
- G01N—INVESTIGATING OR ANALYSING MATERIALS BY DETERMINING THEIR CHEMICAL OR PHYSICAL PROPERTIES
- G01N21/00—Investigating or analysing materials by the use of optical means, i.e. using sub-millimetre waves, infrared, visible or ultraviolet light
- G01N21/17—Systems in which incident light is modified in accordance with the properties of the material investigated
- G01N21/55—Specular reflectivity
- G01N21/552—Attenuated total reflection
- G—PHYSICS
- G01—MEASURING; TESTING
- G01N—INVESTIGATING OR ANALYSING MATERIALS BY DETERMINING THEIR CHEMICAL OR PHYSICAL PROPERTIES
- G01N21/00—Investigating or analysing materials by the use of optical means, i.e. using sub-millimetre waves, infrared, visible or ultraviolet light
- G01N21/17—Systems in which incident light is modified in accordance with the properties of the material investigated
- G01N21/21—Polarisation-affecting properties
- G01N21/211—Ellipsometry
- G01N2021/212—Arrangement with total internal reflection
- G—PHYSICS
- G06—COMPUTING OR CALCULATING; COUNTING
- G06T—IMAGE DATA PROCESSING OR GENERATION, IN GENERAL
- G06T2207/00—Indexing scheme for image analysis or image enhancement
- G06T2207/30—Subject of image; Context of image processing
- G06T2207/30004—Biomedical image processing
- G06T2207/30072—Microarray; Biochip, DNA array; Well plate
Definitions
- This inventionrelates to acquisition and processing of data and more particularly to acquisition and processing of microarray data for displaying, monitoring, and/or demonstrating the progress of an experiment substantially in real-time.
- an array of biologically or chemically active spots on the surface of a substrate for identifying constituents in test material brought into contact with the arrayis known, such as with a biochip (also referred to as a gene chip, protein chip, microarray, and others).
- a biochipalso referred to as a gene chip, protein chip, microarray, and others.
- microarray experimentshave been analyzed at or near the approximate endpoint of reactions, which is presumed to be equilibrium, and real-time and/or time-resolved information have not been provided.
- endpoint analysisdoes not allow for monitoring of or collaboration about the process under investigation, thus losing kinetic data, affinity data, and other time-resolved data regarding the process.
- Such endpoint analysisalso does not allow for modification or early termination of the experiment if an error occurs, thus wasting time and resources.
- Image datais acquired and processed in accordance with an embodiment of the present invention to display, monitor, and/or demonstrate the progress of an experiment substantially in real-time and with high sensitivity.
- the present inventionallows for real-time processing and display of data such that discussion and collaboration about the experiment may occur, time-resolved data is not lost, and resources are not wasted.
- an image processorincluding a data acquisition application adapted to receive spatially distributed polarization change data caused by a specimen array; and a data analyzer operably coupled to the data acquisition application, the data analyzer adapted to calculate at least one time-resolved value of the spatially distributed polarization change data.
- an apparatus for imagingincluding a light source emitting a polarized light beam; an optical assembly including a light reflection surface, wherein the light beam from the light source is reflected by the light reflection surface to provide an evanescent field adjacent the light reflection surface, the light reflection surface being adapted to allow placing thereon a specimen array such that the specimen array in the evanescent field causes spatially distributed polarization changes in the cross-section of the light beam; and a two-dimensional array detector positioned to detect the spatially distributed polarization changes caused by the specimen array.
- a processoris operably coupled to the two-dimensional array detector, the processor processing data from the two-dimensional array detector to provide a two-dimensional representation of the spatially distributed polarization changes occurring in the specimen array in real-time.
- a method of processing image dataincluding receiving spatially distributed polarization change data caused by a specimen array; and calculating at least one time-resolved value of the spatially distributed polarization change data.
- a method of imagingincluding passing a polarized light beam into an optical assembly including a control layer and a light reflection surface to provide an evanescent field with controlled height and intensity adjacent the light reflection surface, a specimen array in the evanescent field causing spatially distributed polarization changes in the cross-section of the light beam; passing the reflected light beam out of the optical structure; and detecting the spatially distributed polarization changes caused by the specimen array.
- the methodfurther includes processing the detected spatially distributed polarization changes to provide a two-dimensional representation of the spatially distributed polarization changes occurring in the specimen array in real-time.
- FIG. 1is a block diagram of an illustrative system in accordance with an embodiment of the present invention
- FIG. 2is a block diagram of an embodiment of the system of FIG. 1 ;
- FIG. 3is a block diagram of a processor in accordance with an embodiment of the present invention.
- FIG. 4is a block diagram of image measurements in accordance with an embodiment of the present invention.
- FIG. 5is a block diagram of parameter inputs in accordance with an embodiment of the present invention.
- FIG. 6is a block diagram of a measurement module of an imaging method in accordance with an embodiment of the present invention.
- FIG. 7is a block diagram of a modeling module of an imaging method in accordance with an embodiment of the present invention.
- FIG. 8is a block diagram of a data handling method in accordance with an embodiment of the present invention.
- FIG. 9is a block diagram of an image data analysis method in accordance with an embodiment of the present invention.
- FIG. 10is a block diagram of an image data display method in accordance with an embodiment of the present invention.
- FIG. 11is a block diagram of coordinate inversion of an image slide in accordance with an embodiment of the present invention.
- FIG. 12is a block diagram of outputs in accordance with an embodiment of the present invention.
- FIG. 13is a graph of specimen spot intensity over time
- FIG. 14is a display of a frame of time-resolved specimen spot intensity
- FIG. 15illustrates a TIFF image of time-resolved specimen spot intensity at a first time
- FIG. 16illustrates a TIFF image of time-resolved specimen spot intensity at a second time
- FIG. 17illustrates a differential TIFF image between the images shown in FIGS. 15 and 16 ;
- FIGS. 18 and 19are histograms of the TIFF images shown in FIGS. 16 and 17 .
- the inventiongenerally comprises a method and apparatus for acquiring, processing, and displaying data, and in one embodiment relates to acquiring, processing, and display of data from a two-dimensional arrangement of chemical substances obtained by an imaging technique and apparatus, such as that disclosed in U.S. Pat. No. 6,594,011, the contents of which have been previously incorporated by reference.
- a polarized light source of known polarization stateis directed into an optical assembly, for example a total internal reflection member (TIR member), configured for a reflection at a light reflection surface, for example a total internal reflection surface (TIR surface), and then allowed to exit the optical assembly.
- TIR membertotal internal reflection member
- TIR surfacetotal internal reflection surface
- superposition of reflections as encountered at a layered optical structure where the layer thicknesses are smaller than the coherence length of the illuminating lightis referred to as a single reflection.
- the chemical specimenis in place above the light reflection surface in the evanescent field of the reflected light beam.
- the beamis passed to a polarization-sensitive two-dimensional detector such as a polarizer and a camera or other types of detectors.
- the beam's contentcan then be processed to determine the change in polarization state, locally in the two-dimensional cross-section of the beam. This provides a spatially distributed map of change of polarization state in the specimen.
- a variety of techniquesare available to determine the change in polarization such as measuring the deviation from a null condition or by comparing the input polarization state to the output polarization state.
- the refractive index composition of the materials within the evanescent fielddetermines the change in the polarization state of the beam due to the reflection at the light reflection surface.
- a two-dimensional variation of this composition within the light reflection surfaceis associated with a respective variation of the polarization state spatially distributed across the cross-section of the reflected light beam.
- the chemical specimenforms a two-dimensional array of molecules (referred to herein as receptors and generally referred to as capture agents or affinity agents) with specific affinities towards respective other molecules (referred to herein as ligands).
- the inventionis utilized to indicate the presence or absence or rate of binding between ligands and receptors on the array.
- arrayscommonly consist of a plurality of discrete specimen spots.
- the present method and apparatusimages the array so as to distinguish each of the discrete specimen spots represented by the local change in polarization state in the cross-section of the reflected beam.
- Measurementsare designed for maximum practical sensitivity and triggered at discrete intervals appropriate for the experiment, determined by a three-component analysis based on the affinity constants, size, and concentration of the analytes. Data is culled for conservation of computing and storage resources. If, for instance, it is known that the sample system contains low-affinity components, generally longer incubation or dwell time is required. If size of the analyte is small, maximum sensitivity settings of the instrument are required which in turn generally requires longer measurements and correspondingly longer intervals. If the concentration is low, such that a long incubation or dwell time is required, measurements will be timed accordingly so that excess data is not taken. If the reaction involves high affinity components, measurement intervals will be minimized, so that more data points are taken. Incubation and dwell time refer to the period of time in which the sample is in contact with the sensing array at nearly full concentration.
- an auto-tuning and data culling methodin which binned low-spatial-resolution data is taken at moderate sensitivity settings and minimized intervals, the resultant differential images are analyzed for change, and once signals become evident or fail to become evident in a given time period, kinetic analyses of reactive areas are used to adjust measurement intervals, sensitivity, and spatial resolution to appropriate levels, while the data that displays no differential is discarded except for a few measurements, such as every fifth, tenth. If, for instance, the reaction becomes evident in the first ten seconds of incubation, measurement will proceed at maximal speed and moderate sensitivity for the duration, binning will continue to be employed and all data will be saved.
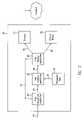
- FIGS. 1 and 2show an apparatus which implements one embodiment of the invention.
- the apparatus 10can be described conveniently as comprising three general portions.
- a first portionincludes a polarized light source assembly 12
- a second portionincludes an optical assembly 14 providing a control layer and/or a light reflection surface
- a third portionincludes a polarization-sensitive imaging detector assembly 16 which can employ for example a two-dimensional array detector.
- Data from detector assembly 16is sent by an electrical signal along a connector 24 to processor 18 such as a specially programmed computer and user access system including an image display. Data can be presented as an image, a data table, a graph, or in other forms.
- the polarized light source assembly 12passes polarized light of known polarization state 20 , which may be varied or varying to optical assembly 14 where a light beam reflection occurs.
- Reflected light 22having a changed polarization state, passes to detector assembly 16 , where it is recorded spatially over the cross-section of the beam.
- the recorded datais sent to processor 18 where the change of polarization state is determined to provide a spatially resolved map of changes in polarization state. Where the specimens are presented as an array of discrete spots, each spot will be imaged for its change in polarization state within the spot area.
- FIG. 2shows a more detailed schematic block diagram of one embodiment of apparatus 10 .
- the polarized light source assembly 12has a light source 26 , a beam forming member 28 (if the nature of the light source is such as to make beam forming useful or necessary), a polarizer 30 , and an optical retarder 32 .
- the light sourcemay include a laser and a moving diffuser adapted to produce speckle-offsetting fluctuation of the minima and maxima in the speckle pattern caused by the laser.
- the moving diffusermay be attached to a mechanical actuator which is preferably a motor and servo-apparatus for providing the speckle offsetting fluctuations.
- the light beamthen proceeds through the beam-forming element 28 , the polarizer 30 , and the optical retarder 32 , exiting light source assembly 12 as light beam 20 .
- the optical assembly 14has an optical element 34 which has an optical surface 36 . Also shown is a control layer 38 over optical surface 36 , and between them an index matching substance 40 . A specimen 42 is positioned on light reflection surface 39 of control layer 38 in one example. In an alternative optical arrangement, a control layer is placed above an index matching substance which in turn is placed above a flat optical member.
- the inventionincorporates an optical structure having a light reflection surface and the beam reflects at the reflection surface between entering and leaving the optical structure. In other words, there is a light reflection surface in optical contact with the specimen, such that the evanescent field associated with the total internal reflection interacts with the specimen.
- the post-reflection detector assembly 16has a polarizer 44 and an imaging detector, for example a two-dimensional array detector 46 and preferably a camera of the CCD or CMOS array type.
- the post-reflection detector assembly 16 through which the beam 22 passescan alternatively consist of a polarizer member, a beam forming member, and an imaging detector such as a two dimensional array detector or other type of imaging detector.
- the processor 18is a specially programmed computer (or processor) and output means for processing the imagery into a representation of film thickness variations spatially resolved over the cross-section of the area imaged.
- the imagingis acquired by detecting changes spatially distributed in the local polarization state in the beam's cross-section caused by the total internal reflection. This provides information about the presence and composition in the array of substances on the substrate surface for each resolvable point on the surface. Different polarization state changes are included in the cross-section of the reflected beam indicative of the substances on the specimen in the location in the specimen array corresponding to a position in the detector.
- Processor 18receives the data as an electrical signal (on connector 24 ) and characterizes the change of polarization state spatially over the two-dimensional array.
- the analysis and processingis done in one embodiment by comparing the known polarization state of the incoming light from the light source assembly 12 with the changed polarization state of the reflected light 22 , spatially resolved two-dimensionally within the beam which provides a map of spatially distributed points or spots in the specimen array.
- the polarization shiftis then analyzed by processor 18 to provide information of the presence and properties of elements in the chemical specimen.
- Other known techniques, such as null processingcan be used to determine the change in polarization state.
- the processorcan be a general or special purpose processor, preferably with network capabilities. It comprises a central processing unit (CPU), a memory, and a network adapter, which are interconnected by a main bus. Other conventional means, such as a display, a keyboard, a printer, a bulk storage device, and a read-only memory (ROM), may also be connected to the main bus.
- the memorymay store network and telecommunications programs and an operating system (OS).
- OSoperating system
- the invention as described aboveprovides an extremely sensitive optical imaging system for real-time imaging of the binding status of biochip array elements on the surface of an optically transparent material such as a glass or plastic chip.
- Sensor sensitivity to surface attachmentis in the femtogram/mm.sup.2 range (e.g., one DNA per square micron).
- the apparatus of FIG. 1operates by imaging the pattern of reactions on the biochip. Those reactions produce changes in the height, surface concentration, and/or refractive index of the material that reacts at each spot.
- the area imagedcould be the entire biochip array or a portion of the entire biochip array.
- By providing an array of spots of different materialsdifferent constituents in test material flowed over the spots bind in a manner which identifies those constituents.
- the image produced by the apparatus of FIG. 1identifies the constituents in the test material and can also determine the rate at which the reactions occur by imaging successively over time.
- height differencescan be imaged dynamically over such short periods of time that intermediate height change readings can be recorded and therefore height change rates can be determined as well as allowing comparison of the rate of height change or intermediate amount of height change among the spots on the biochip array.
- microarray experimentshave been analyzed at or near the approximate endpoint of reactions, which is presumed to be equilibrium, and have not provided real-time and/or time-resolved information.
- Endpoint analysisshows whether the experiment has worked or not but does not provide a way for real-time analysis and time-resolved analysis.
- such endpoint analysisdoes not allow for monitoring of the process under investigation, thus losing kinetic data, affinity data, and other time-resolved data regarding the process.
- the present inventionallows for the detection of time-related affinity data if certain molecules bind to a part of the array at the beginning of an experiment but the binding does not persist until the end of the experiment.
- endpoint analysiswould not capture this type of data.
- Such endpoint analysisalso does not allow for modification or early termination of the experiment if an error occurs, thus wasting time and resources.
- the present inventionallows a user to change certain parameters to focus on an area of the array after viewing the progress of the experiments if so desired. Positive controls may be observed to verify that the chemistry and detection is working.
- the present invention's real-time and/or time-resolved imaging and displayallows the user to stop the process and restart or modify the experiments or to correct the system failure.
- An endpoint analysis after full preparation and completion of the experimental processwould be a waste of the precursor materials, money, time, and other experimental resources.
- processor 18includes a specially programmed computer (or processor) and display means for processing the image data in real-time into a representation of film thickness variations time-resolved and spatially-resolved over the cross-section of the area imaged.
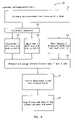
- FIG. 3illustrates one embodiment of processor 18 , which includes a data acquisition application 80 operably coupled to a data analysis application 82 which in turn is operably coupled to a data display application 85 .
- Processor 18further includes a parameter input interface 90 which is operably coupled to data analysis application 82 .
- a browser 87operably couples data display application 85 to a communication network, for example the Internet.
- a display device 89is operably coupled to data display application 85 for displaying the graphical representations of the image data to a viewer. Both browser 87 and display device 89 are commercially available and known to those of ordinary skill in the art.
- the image datamay be presented in a hypertext markup language (HTML) format or any similar or succeeding similar language such as PHP: Hypertext Preprocessor (PHP), Active Server Pages, or Perl.
- HTTPhypertext markup language
- PHPHypertext Preprocessor
- PerlActive Server Pages
- Thisallows for ease of communication and sharing of the image display at remote locations through the Internet or other networking means via various display devices, such as PC display screens, personal digital assistants (PDAs), wireless telephones, and other mobile devices, as well as display near or proximate data acquisition application 80 as shown by dashed line 83 .
- Data from detector assembly 16( FIG. 1 ) is sent along connector 24 in real-time and acquired by data acquisition application 80 .
- the data outputted from data acquisition application 80is sent along line 81 to data analysis application 82 , where the data for multiple microarray spots is analyzed and normalized to quantify an intensity value and corresponding thickness value in real-time and over time (i.e., the data is time-resolved).
- Output data from data analysis application 82is sent along line 84 to data display application 85 which converts the output data into graphical representations for the viewer.
- the intensity valueis posted in a grid that represents the microarray itself and allows for display of the grid development in real-time and over time as will be explained in greater detail below.
- microarray experimentsinclude positive controls, negative controls, and/or dilutions over certain areas of the grid. Negative controls should not react during the experiments and are used to determine the background or baseline for the intensity measurements. Theoretically, positive controls and/or dilutions should produce reactions during the experiments and are therefore the brightest (or darkest depending on the display convention) areas of the image.
- positive controls on microarraysare set at the margins or other easily located positions, so that they may be used to determine a frame of reference or establish a reference direction, correct image aberration and distortion, or accomplish registration of images to be compared.
- many controlsare utilized so as to evaluate spot-to-spot variance.
- the present inventionallows for instant feedback on the progress of a large number of experiments, ranging from 1 spot to about 50,000 spots, as real-time and time-resolved information about the microarray can be on display.
- Data acquisition application 80receives the image data from detector assembly 16 ( FIG. 1 ) and can be used to not only receive the image data but to also run the imaging apparatus in one embodiment.
- data acquisition application 80can comprise the software package IGOR commercially available from WaveMetrics, Inc. of Lake Oswego, Oreg., appropriately modified to be integrated with at least light source assembly 12 ( FIG. 1 ), optical assembly 14 ( FIG. 1 ), detector assembly 16 ( FIG. 1 ), and data analysis application 82 , for automatic data collection and retrieval.
- FIG. 4is a block diagram of an example of image measurements that may be collected and processed by data acquisition application 80 ( FIG. 3 ) and sent to data analysis application 82 ( FIG. 3 ) along line 81 .
- Data acquisition application 80receives raw images 101 taken at predetermined and/or user-selected time intervals “t n ” and provides horizontal pixel location/coordinate “x”, vertical pixel location/coordinate “y”, and an intensity value “z” at the pixel coordinates x and y.
- ellipsometry analysis routines in data acquisition application 80extract intensity values from the four images 102 , 103 , 104 , and 105 at different polarizer positions (in phase modulation mode) and from these four readings determine the ellipsometric x and y value for each pixel in the image. This data is then fitted to a lookup table based on a selected optical model which results in a thickness map of x,y coordinates and thickness z.
- the intensity map of an image at a fixed polarizer position(e.g., “direct” settings are in the IGOR control panel and allow these to be set) is fitted to a Jones or Mueller matrix optical model and a thickness map is generated.
- the unpolarized imageis one of the four images used to generate x,y coordinates and is useful as a demonstration of the imbedded reflectometry measurement capabilities.
- data acquisition application 80outputs image data x, y, and z along line 81 to data analysis application 82 which then analyzes the image data substantially in real-time to produce spatially-resolved images in real-time and over time.
- Data analysis application 82is able to evaluate and quantify values inside and outside of each spot in the array. In one example, at predetermined time intervals, the mean value of a spot and a local background value are selected as the parameters used to approximate an intensity value and a corresponding approximation of thickness over a spot normalized against aberrations such as drift and local noise. Thus, data analysis application 82 is able to quantify and qualify the microarray data from data acquisition application 80 .
- data analysis application 82can be the software package ImaGene commercially available from BioDiscovery, Inc. of El Segundo, Calif., appropriately modified to be integrated at least with data acquisition application 80 , parameter input interface 90 , and data display application 85 for data retrieval, analysis, and image processing.
- Parameter input interface 90is used to input parameters into data analysis application 82 via line 91 .
- FIG. 5is a block diagram of an example of parameter values that may be inputted into data analysis application 82 from parameter input interface 90 via line 91 .
- parametersmay be inputted for the following although not limited thereto: a physical model 110 , a spot template construction 112 , an optical model 116 , assay conditions 114 , and a thickness lookup table 118 .
- Parameters for physical model 110include but are not limited to the length, width, height, density, orientation, hydrophilicity profile, and affinity profile of the array.
- Parameters for spot template construction 112include but are not limited to the number of subarrays, rows and columns, and spot identification.
- Parameters for optical model 116include but are not limited to wavelength, angle, ambient refractive index (n) and extinction coefficient (k), layer of interest n and k, and media n and k.
- Parameters for assay conditions 114include but are not limited to the media type, sample handling, temperature profiling, pump rate profiling, and measurement profile.
- step 121a block diagram is shown illustrating an example of a measurement module 120 of an imaging method that can be utilized by data acquisition application 80 and data analysis application 82 .
- step 121six frames (a frame is a single still image from a dynamic series) per measurement are taken over timecourse t 0 to t final .
- the raw datais processed in step 122 using ellipsometry calculations to calculate measured ellipsometric X values and measured ellipsometric Y values 123 and 124 , respectively.
- the raw dataalso includes measured intensity values in step 125 .
- Reference framesare designated and averaged in step 126 and then subtracted from the measurement frames in step 127 .
- the final frame or the frame demonstrating the most change from the initial frameis processed in step 128 to flag spots which are oversized, undersized, and donut-shaped.
- FIG. 7is a block diagram illustrating an example of a modeling module 130 of an imaging method that can be utilized by data analysis application 82 .
- Parameters to be entered for the physical model 131include but are not limited to the geometry (from molecular models, crystal structure), orientation, and multi-segment optical density assignment.
- Parameters for the optical model 132include the n, k, and depth of ambient, substrate, functional layer, biolayer, and media. Wavelength and angle(s) of the light source is also entered. These modeling parameters are fit into a Beaglehole Multilayer Model 133 and/or an Evanescent Model 134 .
- a lookup table 135is created including ellipsometric x and y values versus thickness of the biolayer based upon the Beaglehole Multilayer Model.
- a lookup table 136is also created including intensity versus thickness of the biolayer based upon the Evanescent Model.
- FIG. 8is a block diagram of an example of a data handling method 140 that can be utilized by data analysis application 82 .
- a differential imageis provided by subtracting a reference image (t 0 ) from the latest (current) image (t n ) in step 141 .
- Such a differential imagecan advantageously show change with high resolution in real-time to a viewer when the image is displayed (see, e.g., FIGS. 15-17 ).
- a spotis then quantified in step 142 by various parameters including but not limited to a spot mean, median, and mode (MMM), a local background MMM, a spot size, and a spot qualitative score.
- the local backgroundis then subtracted from the spot value in step 143 .
- the spot valueis then normalized to the background and the positive controls in step 144 , thus controlling for drift noise or other experimental fluctuations.
- an affinity analysismay be conducted based upon the normalized spot value in step 145 .
- Table 1 belowshows a table including possible output from data analysis application 82 but the present invention is not limited to such a list.
- Open PerimeterComputes the proportion of signal perimeter that touches the border of rectangular snip around the spot XCoord X coordinate (in pixels) of grid circle corresponding to the spot YCoord Y coordinate (in pixels) of grid circle corresponding to the spot Diameter Diameter (in pixels) of grid circle corresponding to the spot Position Offset Offset (in pixels) of the center of the grid circle from the expected position in the grid Offset X X offset (in pixels) of the center of the grid circle from the expected position in the grid Offset Y Y offset (in pixels) of the center of the grid circle from the expected position in the grid Expected X X coordinate of expected position of the circle in the grid.
- Expected position in the gridis computed fitting least square lines to circle centers in every row and column Expected Y Y coordinate of expected position of the circle in the grid.
- Expected position in the gridis computed fitting least square lines to circle centers in every row and column CM-X X coordinate of the center of the mass of spot's signal region CM-Y Y coordinate of the center of the mass of spot's signal region CM Offset Offset (in pixels) of the spot's center of the mass from the expected position in the grid CM Offset-X X offset (in pixels) of the spot's center of the mass from the expected position in the grid CM Offset-Y Y offset (in pixels) of the spot's center of the mass from the expected position in the grid
- Max Diam Diameter of the circlethe spot's signal region can be inscribed in Control Name of a control type for current spot (no name means the spot is not a control spot) Failed Control 0
- FIG. 9a block diagram is shown illustrating an example of an image data analysis method 150 of the present invention.
- each of the spots in the microarrayare measured and the mean value of each spot is calculated using the measurement module.
- the modeling moduleis then called at step 153 to calculate thickness of the biolayer.
- the kinetic course of each spotis then calculated and plotted at step 155 .
- Spot identification informationis called at step 157 and image output tables and graphics are displayed in real-time and over time at step 159 .
- Data display application 85includes commercially available database and spreadsheet programs such as Microsoft Access and Microsoft Excel which can receive data from data analysis application 82 and can then be manipulated by an algorithm for graphical representation of the data.
- FIG. 10is a flowchart of an example of an image data display method 160 .
- the value of a spotis first calculated by subtracting a background value from the signal (step 161 ).
- the coordinates of the spotare retrieved, based upon quadrant A-D, row 1 - 12 , and column 1 - 16 (step 163 ).
- a coloris generated according to a range such that change of thickness (shown through a change in color/contrast of the spot) is easily visible to the user (step 165 ).
- the spot valueis 8-bits
- the image data display method of FIG. 10assigns a gray scale value to every number between 0 and 4,096.
- the methodinverts the y coordinate values for redisplay based on the viewer's perspective since the image view is from below the microarray in this example.
- Table 2 belowshows an example of software code for displaying time-resolved values of the ellipsometric z shift data, which is proportional to film thickness change, according to the method illustrated by the flowchart in FIG. 10 .
- FIG. 11is a block diagram of the coordinate inversion of an image slide noted above with respect to FIG. 10 .
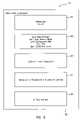
- FIG. 12is a block diagram of an example of outputs from data display application 85 which can be sent via lines 86 and/or 88 to browser 87 and display device 89 , respectively.
- Outputsinclude but are not limited to real-time (live) displays, text files, and binary image files (x, y, and z values from IGOR).
- Real-time displayscan include but are not limited to an initial image, a current image, a differential image, a thickness “map” which shows thickness over the microarray, spot “meters”, and a plot of thickness versus time.
- Text filescan include but are not limited to spot information and related affinity information.
- FIG. 13is a graph of specimen spot intensity over time in seconds. Positive and negative controls are utilized to normalize the measured data as mentioned above. The graph demonstrates a steeper affinity slope, indicating fast interaction and more change, at the end of 75 minutes in the positive control 171 than in the other specimen spots, sample 173 , and negative control 175 . Correlation with labelled and conventionally scanned data is also demonstrated.
- FIG. 14is an example of an html display of a frame of time-resolved specimen spot intensity.
- each frameconstitutes 78 kilobytes rather than the typical 600 kilobytes to 30 megabytes of the differential image. The data economy is thus demonstrated.
- FIGS. 13 and 14are just two of a variety of graphical representations of the time-resolved image data which can be provided.
- time-resolved image datacould be displayed in various tables, graphs, and charts.
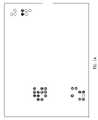
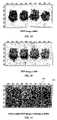
- FIGS. 15-17illustrate graphical representations of image subtraction, specifically subtraction of a reference image ( FIG. 15 ) from each subsequent image ( FIG. 16 ) in a time-resolved sequence of images, resulting in a “differential image” ( FIG. 17 ) that may increase the practical sensitivity and dynamic range of the resultant image upon digitization. For example, if measurements can be made to seven significant digits, and a surface is monitored over time for small changes, but the surface already has irregularities such as gross features, roughness, or a tilt, much of the range of the resultant digitized image will be occupied by the “background” and not the data.
- 16-bit TIFF imagesare currently the most common and practical format for scientific imaging and analysis, due to dynamic range of the detection methods used to create them and the data storage considerations of larger bit-depth images. With 65,500 levels per pixel, if the roughness and tilt remain in the image, the small surface changes of interest will comprise only a tiny range within the image, and comparison to the reference image will reveal no discernable changes. However, if the differential image is generated before conversion to an image format such as a 16-bit TIFF, the full bit-depth of the image format is utilized for just the data of interest, rather than the background.
- FIGS. 15 and 16a surface is measured at two different times, producing an initial and subsequent binary image.
- the initial imageis subtracted from the subsequent image, producing the differential image in FIG. 17 .
- All three imagesare then digitized into 16-bit TIFFs by identical means.
- a region of interest of the initial, subsequent, and differential TIFF imagesis displayed and analyzed.
- a differential image of areas 181 and 182show a change in the areas whereas a change is difficult to notice when visually comparing the individual binary images of FIGS. 15 and 16 .
- the initial and subsequent imageshave a 10,000 count range, containing 40 distinct levels, while the differential image covers a 25,000 count range with 112 levels. The changes would be undetectable if comparing the post-digitization TIFF images.
- the present inventionallows for clear visualization of experimental progress in a microarray containing a plurality of specimen spots.
- a user interface with display device 89is also within the scope of the present invention such that information regarding the graphical representations may be provided to the user at his request. For example, if the user were to position a pointer at a certain area of the graphical representation, actual data regarding the microarray, such as X and Y coordinates, thickness value, and gene ID of that sensing spot, could be displayed for the user.
- the present inventionalso allows for ease of communication of a microarray's experimental progress outside of the laboratory to a plurality of parties. It is apparent that the present invention is not limited to displaying data on a single display device 89 ( FIG. 3 ) but may be used to display data on a plurality of display devices using browser 87 .
- Such communication of the real-time and time-resolved image dataallows for enhanced collaboration between researchers on experiments in a real-time setting.
- the data streamis smaller than would be required to transmit the images, which are at least 600 kilobytes.
Landscapes
- Physics & Mathematics (AREA)
- Engineering & Computer Science (AREA)
- General Health & Medical Sciences (AREA)
- Health & Medical Sciences (AREA)
- General Physics & Mathematics (AREA)
- Chemical & Material Sciences (AREA)
- Life Sciences & Earth Sciences (AREA)
- Pathology (AREA)
- Immunology (AREA)
- Biochemistry (AREA)
- Analytical Chemistry (AREA)
- Nuclear Medicine, Radiotherapy & Molecular Imaging (AREA)
- Medical Informatics (AREA)
- Theoretical Computer Science (AREA)
- Quality & Reliability (AREA)
- Radiology & Medical Imaging (AREA)
- Computer Vision & Pattern Recognition (AREA)
- Spectroscopy & Molecular Physics (AREA)
- Investigating Or Analysing Materials By Optical Means (AREA)
Abstract
Description
| TABLE 1 | |
| Output | Definition |
| Field | Name of a field where the spot is located |
| Metarow | Number of metarow in the metagrid where the |
| spot is located | |
| Metacolumn | Number of metacolumn in the metagrid where the |
| spot is located | |
| Row | Number of row in the subgrid where the spot is |
| located | |
| Column | Number of column in the subgrid where the spot |
| is located | |
| GeneID | Gene ID information for the spot |
| Flag | Numeric code of the quality flag for the spot (0 - |
| no flag, | |
| Signal Mean | Pixel intensity averaged over the local signal |
| region | |
| Background Mean | Pixel intensity averaged over the local |
| background region | |
| Signal Median | Median pixel intensity computed over the local |
| signal region | |
| Background Median | Median pixel intensity computed over the local |
| background region | |
| Signal Mode | Mode pixel intensity computed over the local |
| signal region (mode corresponds to the pick | |
| location in intensity distribution) | |
| Background Mode | Mode pixel intensity computed over the local |
| background region | |
| Signal Area | Number of pixels in the local signal region |
| Background Area | Number of pixels in the local background region |
| Signal Total | Total pixel intensity summed over the local signal |
| region | |
| Background Total | Total pixel intensity summed over the local |
| background region | |
| Signal Stdev | Standard deviation of pixel intensities over the |
| local signal region | |
| Background Stdev | Standard deviation of pixel intensities over the |
| local background region | |
| Shape Regularity | First signal area of a spot is inscribed into a |
| circle. Than number of non-signal pixels that fall | |
| within this circle is computed and divided by | |
| circle's area. This ratio is subtracted from 1 and is | |
| called “shape regularity” | |
| Ignored Area | Area of ignored regions directly neighboring |
| (“touching”) the signal area is computed | |
| Spot Area | Signal Area plus Ignored Area |
| Ignored Median | Median pixel intensity computed over the local |
| ignored region | |
| Area To Perimeter | This quality measure defines spot's circularity. |
| Area of a spot is divided by a square of spot | |
| perimeter and multiplied by π4. As a result, this | |
| measure ranges from 0 (highly non-circular | |
| shape) to 1 (a perfect circle) | |
| Open Perimeter | Computes the proportion of signal perimeter that |
| touches the border of rectangular snip around the | |
| spot | |
| XCoord | X coordinate (in pixels) of grid circle |
| corresponding to the spot | |
| YCoord | Y coordinate (in pixels) of grid circle |
| corresponding to the spot | |
| Diameter | Diameter (in pixels) of grid circle corresponding |
| to the spot | |
| Position Offset | Offset (in pixels) of the center of the grid circle |
| from the expected position in the grid | |
| Offset X | X offset (in pixels) of the center of the grid circle |
| from the expected position in the grid | |
| Offset Y | Y offset (in pixels) of the center of the grid circle |
| from the expected position in the grid | |
| Expected X | X coordinate of expected position of the circle in |
| the grid. Expected position in the grid is | |
| computed fitting least square lines to circle | |
| centers in every row and column | |
| Expected Y | Y coordinate of expected position of the circle in |
| the grid. Expected position in the grid is | |
| computed fitting least square lines to circle | |
| centers in every row and column | |
| CM-X | X coordinate of the center of the mass of spot's |
| signal region | |
| CM-Y | Y coordinate of the center of the mass of spot's |
| signal region | |
| CM Offset | Offset (in pixels) of the spot's center of the mass |
| from the expected position in the grid | |
| CM Offset-X | X offset (in pixels) of the spot's center of the |
| mass from the expected position in the grid | |
| CM Offset-Y | Y offset (in pixels) of the spot's center of the |
| mass from the expected position in the grid | |
| Min Diam | Diameter of the circle inscribed into the spot's |
| signal region | |
| Max Diam | Diameter of the circle, the spot's signal region |
| can be inscribed in | |
| Control | Name of a control type for current spot (no name |
| means the spot is not a control spot) | |
| Failed Control | 0 if the control passed all tests, 1 if at least one of |
| the tests failed | |
| Background | 0 if the spot passed background contamination |
| Contamination Present | test, 1 if it did not |
| Signal Contamination | 0 if the spot passed signal contamination test, 1 if |
| Present | it did not |
| Ignored % failed | 0 if the spot passed ignored percentage test, 1 if it |
| did not | |
| Open Perimeter Failed | 0 if the spot open perimeter test, 1 if it did not |
| Shape Regularity | 0 if the spot passed shape regularity test, 1 if it |
| Failed | did not |
| Perim-To-Area | 0 if the spot passed perimeter-to-area test, 1 if it |
| did not (see section 1.4) | |
| Offset failed | 0 if the spot passed offset test, 1 if it did not |
| Empty spot | 1 if the spot was qualified as empty, 0 if it was |
| not | |
| Negative spot | 1 if the spot was qualified as negative, 0 if it was |
| not | |
| TABLE 2 | |
| 1: | <% |
| 2: | Set Connl = Server.CreateObject(“ADODB.Connection”) |
| 3: | MdbFilePath = Server.MapPath(“../private/maven.mdb”) |
| 4: | Connl.Open “Driver={Microsoft Access Driver (*.mdb)}; |
| DBQ=” & MdbFilePath & “;” | |
| 5: | |
| 6: | Set diff = Connl.Execute(“SELECT value FROM diff”& |
| Request(“n”) &“ ORDER BY field,row,column”) | |
| 7: | %> |
| 8: | |
| 9: | <% |
| 10: | |
| 11: | Function GenerateColor(NumberToConvert, MinValue, MaxValue) |
| 12: | |
| 13: | If NumberToConvert <= MinValue Then |
| 14: | GenerateColor = “#000000” |
| 15: | Exit Function |
| 16: | End If |
| 17: | |
| 18: | If NumberToConvert >= MaxValue Then |
| 19: | GenerateColor = “ftffffff” |
| 20: | Exit Function |
| 21: | End If |
| 22: | |
| 23: | Numerator = NumberToConvert − MinValue |
| 24: | Denominator = MaxValue − MinValue |
| 25: | |
| 26: | ScaledValue = Round(((Numerator * 255) / Denominator), 0) |
| 27: | GenerateColor = lCase(“#” &Right(“0” & |
| Hex(ScaledValue), 2) &Right(“O” & | |
| Hex(ScaledValue), 2) &RightC‘O” &Hex(ScaledValue), 2)) | |
| 28: | |
| 29: | End Function |
| 30: | |
| 31: | %> |
| 32: | <html> |
| 33: | <head> |
| 34: | <title>Maven</title> |
| 35: | </head> |
| 36: | <body bgcolor=“#000000”> |
| 37: | |
| 38: | <table cellspacing=“0” cellpadding=“0” border=“0” |
| width=“100%” height=“100%”> | |
| 39: | <tr><td align=“center”> |
| 40: | |
| 41: | <!-- main start --> |
| 42: | <table cellspacing=“0” cellpadding=“10” border=“0”> |
| 43: | <tr><td> |
| 44: | |
| 45: | <!-- 1 start --> |
| 46: | |
| 47: | |
| 48: | <table cellspacing=“20”> |
| 49: | <% |
| 50: | For Quadrant = 1 to 4 |
| 51: | Select Case Quadrant |
| 52: | Case 1: QuadrantLetter = “C” |
| 53: | Case 2: QuadrantLetter = “D” |
| 54: | Case 3: QuadrantLetter = “A” |
| 55: | Case 4: QuadrantLetter = “B” |
| 56: | End Select |
| 57: | %> |
| 58: | <%If Quadrant Mod 2=1 Then%><tr><%End If%> |
| 59: | <td> |
| 60: | |
| 61: | <table cellspacing=“4” cellpadding=“0” border=“0”> |
| 62: | |
| 63: | <% |
| 64: | Set diff = Connl.Execute(“SELECT value FROM diff”& |
| Request(“n”) &“ WHERE Field = ‘” & | |
| QuadrantLetter &“’ ORDER BY row,column”) | |
| 65: | For Row = 1 To 12 |
| 66: | %> |
| 67: | <tr> |
| 68: | <% |
| 69: | For Column = 1 To 16 |
| 70: | %> |
| 71: | |
| 72: | <% |
| 73: | ‘ ranges for different slides |
| 74: | ‘ slide # = min,max |
| 75: | ‘00 = 0,0 |
| 76: | ‘01= 4320,4900 |
| 77: | ‘02 = 2660,3060 |
| 78: | ‘03 = 10550,11000 |
| 79: | ‘04 = 6220,6700 |
| 80: | ‘05 = 1520,2200 |
| 81: | ‘06 = 1240,1900 |
| 82: | ‘07 = 60,500 |
| 83: | ‘08 = 1630,2200 |
| 84: | ‘09 = 90,700 |
| 85: | ‘10 = 70,650 |
| 86: | ‘11 = 90,650 |
| 87: | ‘12 = 100,800 |
| 88: | ‘13 = 3260,3900 |
| 89: | ‘14 = 10890,11700 |
| 90: | ‘15 = 7620,8500 |
| 91: | ‘16 = 9630,10500 |
| 92: | ‘17 = 12450,13500 |
| 93: | ‘18 = 5970,6950 |
| 94: | ‘19 = 7730,8920 |
| 95: | ‘20 = 8490,9500 |
| 96: | ‘21 = 8500,9500 |
| 97: | ‘22 = 2580,3550 |
| 98: | ‘23 = 10050,11000 |
| 99: | ‘24 = 8000,8700 |
| 100: | ‘25 = 6120,6720 |
| 101: | ‘26 = 6360,7100 |
| 102: | ‘27 = 6050,6800 |
| 103: | ‘28 = 2600,3200 |
| 104: | ‘29 = 6920,7500 |
| 105: | %> |
| 106: | <td |
| bgcolor=“<%=GenerateColor(diff(“value”),2600,3200)%>”><img | |
| src=“cover.gif” width=“15” height=“15” alt=“”></td> | |
| 107: | <% |
| 108: | diff.MoveNext |
| 109: | Next |
| 110: | %> |
| 111: | <% |
| 112: | Next |
| 113: | %> |
| 114: | </tr> |
| 115: | |
| 116: | |
| 117: | </table> |
| 118: | |
| 119: | </td> |
| 120: | <%If Quadrant Mod 2=0 Then%></tr><%End If%> |
| 121: | <% |
| 122: | Next |
| 123: | Set diff = Nothing |
| 124: | %> |
| 125: | </table> |
| 126: | |
| 127: | |
| 128: | </td></tr> |
| 129: | </table> |
| 130: | <!-- main end --> |
| 131: | |
| 132: | </td></tr> |
| 133: | </table> |
| 134: | |
| 135: | </body> |
| 136: | </html> |
| 137: | |
| 138: | <% |
| 139: | Set diff = Nothing |
| 140: | Connl.Close |
| 141: | Set Connl = Nothing |
| 142: | %> |
Claims (15)
Priority Applications (3)
| Application Number | Priority Date | Filing Date | Title |
|---|---|---|---|
| US11/321,168US7518724B2 (en) | 2000-07-11 | 2005-12-29 | Image acquisition, processing, and display |
| PCT/US2006/049316WO2007079094A2 (en) | 2005-12-29 | 2006-12-26 | Image acquisition, processing, and display |
| US12/117,245US20080204750A1 (en) | 2000-07-11 | 2008-05-08 | Image acquisition, processing, and display |
Applications Claiming Priority (3)
| Application Number | Priority Date | Filing Date | Title |
|---|---|---|---|
| US09/614,503US6594011B1 (en) | 2000-07-11 | 2000-07-11 | Imaging apparatus and method |
| US09/838,700US7023547B2 (en) | 2000-07-11 | 2001-04-19 | Apparatus including a biochip for imaging of biological samples and method |
| US11/321,168US7518724B2 (en) | 2000-07-11 | 2005-12-29 | Image acquisition, processing, and display |
Related Parent Applications (1)
| Application Number | Title | Priority Date | Filing Date |
|---|---|---|---|
| US09/838,700Continuation-In-PartUS7023547B2 (en) | 2000-07-11 | 2001-04-19 | Apparatus including a biochip for imaging of biological samples and method |
Related Child Applications (1)
| Application Number | Title | Priority Date | Filing Date |
|---|---|---|---|
| US12/117,245DivisionUS20080204750A1 (en) | 2000-07-11 | 2008-05-08 | Image acquisition, processing, and display |
Publications (2)
| Publication Number | Publication Date |
|---|---|
| US20070058166A1 US20070058166A1 (en) | 2007-03-15 |
| US7518724B2true US7518724B2 (en) | 2009-04-14 |
Family
ID=38228813
Family Applications (2)
| Application Number | Title | Priority Date | Filing Date |
|---|---|---|---|
| US11/321,168Expired - Fee RelatedUS7518724B2 (en) | 2000-07-11 | 2005-12-29 | Image acquisition, processing, and display |
| US12/117,245AbandonedUS20080204750A1 (en) | 2000-07-11 | 2008-05-08 | Image acquisition, processing, and display |
Family Applications After (1)
| Application Number | Title | Priority Date | Filing Date |
|---|---|---|---|
| US12/117,245AbandonedUS20080204750A1 (en) | 2000-07-11 | 2008-05-08 | Image acquisition, processing, and display |
Country Status (2)
| Country | Link |
|---|---|
| US (2) | US7518724B2 (en) |
| WO (1) | WO2007079094A2 (en) |
Cited By (5)
| Publication number | Priority date | Publication date | Assignee | Title |
|---|---|---|---|---|
| US8345241B1 (en)* | 2006-12-19 | 2013-01-01 | J. A. Woollam Co., Inc. | Application of digital light processor in imaging ellipsometer and the like systems |
| US9063072B1 (en) | 2012-06-12 | 2015-06-23 | Maven Technologies, Llc | Birefringence correction for imaging ellipsometric bioassay system and method |
| US20160061964A1 (en)* | 2013-04-09 | 2016-03-03 | Hamamatsu Photonics K.K. | Radiation image detection device |
| US10314549B1 (en) | 2013-07-16 | 2019-06-11 | Alacrity Patient Services, Inc. | Method and apparatus for monitoring development of medication induced febrile neutropenia |
| US12318228B2 (en) | 2013-07-16 | 2025-06-03 | Alacrity Patient Services, Inc. | Method and apparatus for monitoring development of medication induced side effects |
Families Citing this family (2)
| Publication number | Priority date | Publication date | Assignee | Title |
|---|---|---|---|---|
| US8223334B1 (en)* | 2008-09-26 | 2012-07-17 | J.A. Woollam Co., Inc. | Method of improving ellipsometric and the like data |
| US20240296546A1 (en)* | 2020-12-24 | 2024-09-05 | Safeguard Biosystems Holdings Ltd. | Systems and methods for quality control of microarray printing |
Citations (84)
| Publication number | Priority date | Publication date | Assignee | Title |
|---|---|---|---|---|
| US1637141A (en) | 1922-08-09 | 1927-07-26 | Cooper Herbert | Flexible tubing |
| US3415825A (en) | 1965-07-07 | 1968-12-10 | Ciba Ltd | Anthraquinone dyestuffs |
| US3858616A (en) | 1972-12-08 | 1975-01-07 | Inst Francais Du Petrole | Tight flexible pipe |
| US4238565A (en) | 1978-06-22 | 1980-12-09 | Miles Laboratories, Inc. | Specific binding assay with a prosthetic group as a label component |
| US4256834A (en) | 1979-04-09 | 1981-03-17 | Syva Company | Fluorescent scavenger particle immunoassay |
| US4508832A (en) | 1981-06-22 | 1985-04-02 | Battelle Memorial Institute | Ellipsometrically measuring rate of optical change in immunoassay |
| WO1989011057A1 (en) | 1988-05-09 | 1989-11-16 | Institut Français Du Petrole | Flexible tube comprising an aluminium alloy |
| WO1991000467A1 (en) | 1989-06-30 | 1991-01-10 | Institut Français Du Petrole | Flexible tube with at least one t-shaped elongate reinforcement element |
| US5164589A (en) | 1988-11-10 | 1992-11-17 | Pharmacia Biosensor Ab | Reusable optical interface for non-permanent passive light coupling |
| US5229833A (en) | 1990-09-26 | 1993-07-20 | Gec-Marconi Limited | Optical sensor |
| US5234769A (en) | 1992-04-16 | 1993-08-10 | Deposition Sciences, Inc. | Wear resistant transparent dielectric coatings |
| US5255075A (en) | 1991-03-22 | 1993-10-19 | Gec-Marconi Limited | Optical sensor |
| US5341215A (en)* | 1991-06-08 | 1994-08-23 | Hewlett-Packard Company | Method and apparatus for detecting the presence and/or concentration of biomolecules |
| US5437840A (en) | 1994-04-15 | 1995-08-01 | Hewlett-Packard Company | Apparatus for intracavity sensing of macroscopic properties of chemicals |
| US5446534A (en)* | 1993-03-05 | 1995-08-29 | Optical Solutions, Inc. | Broad band waveguide spectrometer |
| US5483346A (en) | 1994-04-11 | 1996-01-09 | Butzer; Dane C. | Polarization based optical sensor utilizing total internal reflection |
| US5485277A (en)* | 1994-07-26 | 1996-01-16 | Physical Optics Corporation | Surface plasmon resonance sensor and methods for the utilization thereof |
| US5491097A (en) | 1989-06-15 | 1996-02-13 | Biocircuits Corporation | Analyte detection with multilayered bioelectronic conductivity sensors |
| US5491556A (en) | 1992-01-11 | 1996-02-13 | Fisons, Plc | Analytical device with variable angle of incidence |
| WO1996008720A1 (en) | 1994-09-15 | 1996-03-21 | Biacore Ab | Milk assay |
| US5573956A (en) | 1991-08-20 | 1996-11-12 | Hanning; Anders | Assay method based upon refractive index changes at a solid optical surface |
| WO1996038729A1 (en) | 1995-06-02 | 1996-12-05 | Biacore Ab | Pathogen assay method |
| US5593130A (en) | 1993-06-09 | 1997-01-14 | Pharmacia Biosensor Ab | Valve, especially for fluid handling bodies with microflowchannels |
| US5633724A (en) | 1995-08-29 | 1997-05-27 | Hewlett-Packard Company | Evanescent scanning of biochemical array |
| WO1997019375A1 (en) | 1995-11-24 | 1997-05-29 | Biacore Ab | Optical coupling device and method for its production |
| US5641640A (en) | 1992-06-29 | 1997-06-24 | Biacore Ab | Method of assaying for an analyte using surface plasmon resonance |
| USRE35715E (en) | 1992-09-09 | 1998-01-13 | Circeo, Jr.; Louis J. | In-situ remediation and vitrification of contaminated soils, deposits and buried materials |
| US5753518A (en) | 1993-05-24 | 1998-05-19 | Pharmacia Ab | Method of determining affinity and kinetic properties |
| WO1998032002A1 (en) | 1997-01-22 | 1998-07-23 | Biacore Ab | Pipette and carrier assembly for a sensor |
| US5796858A (en) | 1996-05-10 | 1998-08-18 | Digital Persona, Inc. | Fingerprint sensing system using a sheet prism |
| US5813439A (en) | 1990-06-29 | 1998-09-29 | Herrero; Jose Mallen | Flexible tubular pipe comprising an interlocked armoring web and process for producing it |
| US5856873A (en) | 1996-04-30 | 1999-01-05 | Fuji Photo Film Co., Ltd. | Ellipso sensor using a prism |
| US5922604A (en) | 1997-06-05 | 1999-07-13 | Gene Tec Corporation | Thin reaction chambers for containing and handling liquid microvolumes |
| US5922594A (en) | 1994-09-26 | 1999-07-13 | Biacore Ab | Method of producing bilayer lipid membranes |
| US5955729A (en) | 1995-09-08 | 1999-09-21 | Biacore Ab | Surface plasmon resonance-mass spectrometry |
| US5965456A (en) | 1992-06-11 | 1999-10-12 | Biacore Ab | Analyte detection |
| US5972612A (en) | 1995-07-14 | 1999-10-26 | Biacore Ab | Surface-sensitive detection of hybridization at equilibrium |
| US6008893A (en) | 1999-03-22 | 1999-12-28 | Biacore Ab | Reversible-flow conduit system |
| US6008010A (en) | 1996-11-01 | 1999-12-28 | University Of Pittsburgh | Method and apparatus for holding cells |
| US6026053A (en) | 1999-05-21 | 2000-02-15 | The United States Of America As Represented By The Director Of The National Security Agency | Photorefractive read-only optical memory apparatus using phase, frequency, and angular modulation |
| US6045996A (en) | 1993-10-26 | 2000-04-04 | Affymetrix, Inc. | Hybridization assays on oligonucleotide arrays |
| US6065501A (en) | 1989-06-30 | 2000-05-23 | Institute Francais Du Petrole | Flexible tube having at least one elongated reinforcing element with a T-shaped profile |
| US6127183A (en) | 1995-09-01 | 2000-10-03 | Biacore Ab | Monitoring of refractive index of optical sensor for determination of surface structure changes |
| US6140044A (en) | 1994-06-08 | 2000-10-31 | Affymetrix, Inc. | Method and apparatus for packaging a probe array |
| US6143513A (en) | 1999-06-23 | 2000-11-07 | Biacore Ab | Method and kit for detecting betalactam-containing compounds |
| US6143574A (en) | 1995-11-14 | 2000-11-07 | Biacore Ab | Method of determining affinity or kinetic properties in solution |
| US6197595B1 (en) | 1995-06-29 | 2001-03-06 | Affymetrix, Inc. | Integrated nucleic acid diagnostic device |
| US6200814B1 (en) | 1998-01-20 | 2001-03-13 | Biacore Ab | Method and device for laminar flow on a sensing surface |
| US6207381B1 (en) | 1996-04-04 | 2001-03-27 | Biacore Ab | Method for nucleic acid analysis |
| US6253793B1 (en) | 1998-08-10 | 2001-07-03 | Corlexip | Flexible pipe with i-shaped wire winding |
| US6277330B1 (en) | 1996-09-30 | 2001-08-21 | Aventis Research & Technologies Gmbh & Co K.G. | Optical sensor for detecting chemical substances dissolved or dispersed in water |
| US6289286B1 (en) | 1998-05-29 | 2001-09-11 | Biacore Ab | Surface regeneration of biosensors and characterization of biomolecules associated therewith |
| AU742417B2 (en) | 1997-02-04 | 2002-01-03 | Ge Healthcare Bio-Sciences Ab | Analytical method and apparatus |
| US20020019019A1 (en) | 1999-06-18 | 2002-02-14 | Markku Hamalainen | Method and apparatus for assaying a drug candidate to estimate a pharmacokinetic parameter associated therewith |
| US6355429B1 (en) | 1985-02-26 | 2002-03-12 | Thermo Biostar Inc. | Devices and methods for optical detection of nucleic acid hybridization |
| US6354333B1 (en) | 1998-08-10 | 2002-03-12 | Coflexip | Resistant flexible pipe comprising sealing sleeve with limited creep |
| US20020154311A1 (en) | 2001-03-14 | 2002-10-24 | Biacore Ab | Apparatus and method for total internal reflection spectroscopy |
| US6475809B1 (en) | 1998-07-14 | 2002-11-05 | Zyomyx, Incorporated | Protein arrays for high-throughput screening |
| US20020182717A1 (en) | 2001-03-14 | 2002-12-05 | Biacore Ab | Method of preparing supported lipid film membranes and use thereof |
| US6493097B1 (en) | 1997-02-04 | 2002-12-10 | Biacore Ab | Analytical method and apparatus |
| US6503760B2 (en) | 2000-03-16 | 2003-01-07 | Biacore Ab | Method for capturing analytes eluted from surface-bound ligands |
| US20030022388A1 (en) | 2001-06-29 | 2003-01-30 | Biacore Ab | Flow cell method |
| USD472644S1 (en) | 2001-05-16 | 2003-04-01 | Biacore Ab | Chip carrier for biosensor apparatus |
| US6549011B2 (en) | 2000-12-20 | 2003-04-15 | Radiodetection Limited | Conductor tracing system |
| US20030112432A1 (en) | 2001-09-05 | 2003-06-19 | Genicon Sciences Corporation | Apparatus for reading signals generated from resonance light scattered particle labels |
| US6589798B1 (en) | 1996-12-12 | 2003-07-08 | Biacore Ab | Method and system for analyte determination |
| WO2003056337A1 (en) | 2001-12-21 | 2003-07-10 | Biacore Ab | Immobilization of binding agents |
| US6594011B1 (en) | 2000-07-11 | 2003-07-15 | Maven Technologies, Llc | Imaging apparatus and method |
| US20030205681A1 (en) | 1998-07-22 | 2003-11-06 | Ljl Biosystems, Inc. | Evanescent field illumination devices and methods |
| WO2003102580A1 (en) | 2002-05-31 | 2003-12-11 | Biacore Ab | Method of coupling binding agents to a substrate surface |
| US20040002167A1 (en) | 2002-03-27 | 2004-01-01 | Biacore Ab | Method and system for curve quality control |
| US20040012676A1 (en) | 2002-03-15 | 2004-01-22 | Affymetrix, Inc., A Corporation Organized Under The Laws Of Delaware | System, method, and product for scanning of biological materials |
| US20040023247A1 (en) | 2002-07-31 | 2004-02-05 | Affymetrix, Inc. | Quality control methods for microarray production |
| US20040030504A1 (en) | 2002-04-26 | 2004-02-12 | Affymetrix, Inc. A Corporation Organized Under The Laws Of Delaware | System, method, and computer program product for the representation of biological sequence data |
| US20040038268A1 (en) | 1989-06-07 | 2004-02-26 | Affymetrix, Inc. | Support bound probes and methods of analysis using the same |
| US6698454B2 (en) | 2000-11-02 | 2004-03-02 | Biacore Ab | Valve integrally associated with microfluidic liquid transport assembly |
| US6710870B1 (en) | 1998-02-05 | 2004-03-23 | Novartis Ag | Method and device for measuring luminescence |
| US6806051B2 (en) | 2000-09-25 | 2004-10-19 | Picoliter Inc. | Arrays of partially nonhybridizing oligonucleotides and preparation thereof using focused acoustic energy |
| US6810286B2 (en) | 2000-03-06 | 2004-10-26 | Medtronic, Inc | Stimulation for delivery of molecular therapy |
| US6833920B2 (en) | 2000-07-11 | 2004-12-21 | Maven Technologies Llc | Apparatus and method for imaging |
| US20050148063A1 (en) | 2003-12-24 | 2005-07-07 | Cracauer Raymond F. | Disposable reaction vessel with integrated optical elements |
| US6981526B2 (en) | 1998-12-16 | 2006-01-03 | Nkt Flexibles I/S | Armoured flexible pipe and use of same |
| US7045287B2 (en) | 1999-07-20 | 2006-05-16 | Agilent Technologies, Inc. | Method for contacting fluid components with moieties on a surface |
| US7193711B2 (en) | 2000-07-11 | 2007-03-20 | Maven Technologies, Llc | Imaging method and apparatus |
Family Cites Families (16)
| Publication number | Priority date | Publication date | Assignee | Title |
|---|---|---|---|---|
| US4238586A (en)* | 1978-09-29 | 1980-12-09 | Standard Oil Company (Indiana) | Group Va and VII oxygen mineral acids as catalyst modifiers |
| US5631370A (en)* | 1988-01-20 | 1997-05-20 | Regents Of The University Of Minnesota | Optically-active isomers of dideoxycarbocyclic nucleosides |
| USRE35716E (en)* | 1988-08-02 | 1998-01-20 | Gene Tec Corporation | Temperature control apparatus and method |
| US5076696A (en)* | 1989-03-16 | 1991-12-31 | The Johns Hopkins University | Dynamic imaging microellipsometry |
| US5541057A (en)* | 1989-09-18 | 1996-07-30 | Biostar, Inc. | Methods for detection of an analyte |
| US5885364A (en)* | 1991-05-16 | 1999-03-23 | H.E.R.C. Products Incorporated | Method of cleaning and maintaining potable water distribution pipe systems |
| US6028053A (en)* | 1995-10-27 | 2000-02-22 | Mount Sinai Hospital Corporation | Peptide inhibitors of a phosphotyrosine-binding domain containing protein |
| SE9602545L (en)* | 1996-06-25 | 1997-12-26 | Michael Mecklenburg | Method of discriminating complex biological samples |
| US6503711B1 (en)* | 1997-06-18 | 2003-01-07 | Ulrich J. Krull | Nucleic acid biosensor diagnostics |
| EP0919811A1 (en)* | 1997-12-01 | 1999-06-02 | Universiteit Maastricht | Immunoassay method and kit |
| US6381029B1 (en)* | 1998-12-23 | 2002-04-30 | Etrauma, Llc | Systems and methods for remote viewing of patient images |
| JP4147709B2 (en)* | 1999-03-05 | 2008-09-10 | 株式会社デンソー | Refrigerant condenser |
| FR2817318B1 (en)* | 2000-11-24 | 2002-12-27 | Coflexip | FLEXIBLE TUBULAR CONDUCT |
| KR100404071B1 (en)* | 2001-06-18 | 2003-11-03 | 한국기초과학지원연구원 | Apparatus for protein chip analysis using a white-light SPR |
| US6549001B1 (en)* | 2001-11-02 | 2003-04-15 | Skf Usa Inc. | Unitized tone ring assembly |
| EP1470401A4 (en)* | 2002-01-12 | 2007-08-29 | Maven Technologies Llc | Apparatus and method for imaging |
- 2005
- 2005-12-29USUS11/321,168patent/US7518724B2/ennot_activeExpired - Fee Related
- 2006
- 2006-12-26WOPCT/US2006/049316patent/WO2007079094A2/enactiveApplication Filing
- 2008
- 2008-05-08USUS12/117,245patent/US20080204750A1/ennot_activeAbandoned
Patent Citations (89)
| Publication number | Priority date | Publication date | Assignee | Title |
|---|---|---|---|---|
| US1637141A (en) | 1922-08-09 | 1927-07-26 | Cooper Herbert | Flexible tubing |
| US3415825A (en) | 1965-07-07 | 1968-12-10 | Ciba Ltd | Anthraquinone dyestuffs |
| US3858616A (en) | 1972-12-08 | 1975-01-07 | Inst Francais Du Petrole | Tight flexible pipe |
| US4238565A (en) | 1978-06-22 | 1980-12-09 | Miles Laboratories, Inc. | Specific binding assay with a prosthetic group as a label component |
| US4256834A (en) | 1979-04-09 | 1981-03-17 | Syva Company | Fluorescent scavenger particle immunoassay |
| US4508832A (en) | 1981-06-22 | 1985-04-02 | Battelle Memorial Institute | Ellipsometrically measuring rate of optical change in immunoassay |
| US6355429B1 (en) | 1985-02-26 | 2002-03-12 | Thermo Biostar Inc. | Devices and methods for optical detection of nucleic acid hybridization |
| WO1989011057A1 (en) | 1988-05-09 | 1989-11-16 | Institut Français Du Petrole | Flexible tube comprising an aluminium alloy |
| US5164589A (en) | 1988-11-10 | 1992-11-17 | Pharmacia Biosensor Ab | Reusable optical interface for non-permanent passive light coupling |
| US5313264A (en) | 1988-11-10 | 1994-05-17 | Pharmacia Biosensor Ab | Optical biosensor system |
| US20040038268A1 (en) | 1989-06-07 | 2004-02-26 | Affymetrix, Inc. | Support bound probes and methods of analysis using the same |
| US5491097A (en) | 1989-06-15 | 1996-02-13 | Biocircuits Corporation | Analyte detection with multilayered bioelectronic conductivity sensors |
| US6065501A (en) | 1989-06-30 | 2000-05-23 | Institute Francais Du Petrole | Flexible tube having at least one elongated reinforcing element with a T-shaped profile |
| WO1991000467A1 (en) | 1989-06-30 | 1991-01-10 | Institut Français Du Petrole | Flexible tube with at least one t-shaped elongate reinforcement element |
| US5813439A (en) | 1990-06-29 | 1998-09-29 | Herrero; Jose Mallen | Flexible tubular pipe comprising an interlocked armoring web and process for producing it |
| US5229833A (en) | 1990-09-26 | 1993-07-20 | Gec-Marconi Limited | Optical sensor |
| US5255075A (en) | 1991-03-22 | 1993-10-19 | Gec-Marconi Limited | Optical sensor |
| US5341215A (en)* | 1991-06-08 | 1994-08-23 | Hewlett-Packard Company | Method and apparatus for detecting the presence and/or concentration of biomolecules |
| US5573956A (en) | 1991-08-20 | 1996-11-12 | Hanning; Anders | Assay method based upon refractive index changes at a solid optical surface |
| US5491556A (en) | 1992-01-11 | 1996-02-13 | Fisons, Plc | Analytical device with variable angle of incidence |
| US5234769A (en) | 1992-04-16 | 1993-08-10 | Deposition Sciences, Inc. | Wear resistant transparent dielectric coatings |
| US5965456A (en) | 1992-06-11 | 1999-10-12 | Biacore Ab | Analyte detection |
| US5641640A (en) | 1992-06-29 | 1997-06-24 | Biacore Ab | Method of assaying for an analyte using surface plasmon resonance |
| USRE35715E (en) | 1992-09-09 | 1998-01-13 | Circeo, Jr.; Louis J. | In-situ remediation and vitrification of contaminated soils, deposits and buried materials |
| US5446534A (en)* | 1993-03-05 | 1995-08-29 | Optical Solutions, Inc. | Broad band waveguide spectrometer |
| US5753518A (en) | 1993-05-24 | 1998-05-19 | Pharmacia Ab | Method of determining affinity and kinetic properties |
| US5593130A (en) | 1993-06-09 | 1997-01-14 | Pharmacia Biosensor Ab | Valve, especially for fluid handling bodies with microflowchannels |
| US6045996A (en) | 1993-10-26 | 2000-04-04 | Affymetrix, Inc. | Hybridization assays on oligonucleotide arrays |
| US5483346A (en) | 1994-04-11 | 1996-01-09 | Butzer; Dane C. | Polarization based optical sensor utilizing total internal reflection |
| US5437840A (en) | 1994-04-15 | 1995-08-01 | Hewlett-Packard Company | Apparatus for intracavity sensing of macroscopic properties of chemicals |
| US6140044A (en) | 1994-06-08 | 2000-10-31 | Affymetrix, Inc. | Method and apparatus for packaging a probe array |
| US5485277A (en)* | 1994-07-26 | 1996-01-16 | Physical Optics Corporation | Surface plasmon resonance sensor and methods for the utilization thereof |
| WO1996008720A1 (en) | 1994-09-15 | 1996-03-21 | Biacore Ab | Milk assay |
| US5922594A (en) | 1994-09-26 | 1999-07-13 | Biacore Ab | Method of producing bilayer lipid membranes |
| WO1996038729A1 (en) | 1995-06-02 | 1996-12-05 | Biacore Ab | Pathogen assay method |
| US6197595B1 (en) | 1995-06-29 | 2001-03-06 | Affymetrix, Inc. | Integrated nucleic acid diagnostic device |
| US5972612A (en) | 1995-07-14 | 1999-10-26 | Biacore Ab | Surface-sensitive detection of hybridization at equilibrium |
| US5633724A (en) | 1995-08-29 | 1997-05-27 | Hewlett-Packard Company | Evanescent scanning of biochemical array |
| US6127183A (en) | 1995-09-01 | 2000-10-03 | Biacore Ab | Monitoring of refractive index of optical sensor for determination of surface structure changes |
| US5955729A (en) | 1995-09-08 | 1999-09-21 | Biacore Ab | Surface plasmon resonance-mass spectrometry |
| US6143574A (en) | 1995-11-14 | 2000-11-07 | Biacore Ab | Method of determining affinity or kinetic properties in solution |
| WO1997019375A1 (en) | 1995-11-24 | 1997-05-29 | Biacore Ab | Optical coupling device and method for its production |
| US6207381B1 (en) | 1996-04-04 | 2001-03-27 | Biacore Ab | Method for nucleic acid analysis |
| US5856873A (en) | 1996-04-30 | 1999-01-05 | Fuji Photo Film Co., Ltd. | Ellipso sensor using a prism |
| US5796858A (en) | 1996-05-10 | 1998-08-18 | Digital Persona, Inc. | Fingerprint sensing system using a sheet prism |
| US6277330B1 (en) | 1996-09-30 | 2001-08-21 | Aventis Research & Technologies Gmbh & Co K.G. | Optical sensor for detecting chemical substances dissolved or dispersed in water |
| US6008010A (en) | 1996-11-01 | 1999-12-28 | University Of Pittsburgh | Method and apparatus for holding cells |
| US6589798B1 (en) | 1996-12-12 | 2003-07-08 | Biacore Ab | Method and system for analyte determination |
| WO1998032002A1 (en) | 1997-01-22 | 1998-07-23 | Biacore Ab | Pipette and carrier assembly for a sensor |
| US20030067612A1 (en) | 1997-02-04 | 2003-04-10 | Biacore Ab | Analytical method and apparatus |
| AU742417B2 (en) | 1997-02-04 | 2002-01-03 | Ge Healthcare Bio-Sciences Ab | Analytical method and apparatus |
| US6493097B1 (en) | 1997-02-04 | 2002-12-10 | Biacore Ab | Analytical method and apparatus |
| US5922604A (en) | 1997-06-05 | 1999-07-13 | Gene Tec Corporation | Thin reaction chambers for containing and handling liquid microvolumes |
| US6200814B1 (en) | 1998-01-20 | 2001-03-13 | Biacore Ab | Method and device for laminar flow on a sensing surface |
| US6710870B1 (en) | 1998-02-05 | 2004-03-23 | Novartis Ag | Method and device for measuring luminescence |
| US6289286B1 (en) | 1998-05-29 | 2001-09-11 | Biacore Ab | Surface regeneration of biosensors and characterization of biomolecules associated therewith |
| US6475809B1 (en) | 1998-07-14 | 2002-11-05 | Zyomyx, Incorporated | Protein arrays for high-throughput screening |
| US20030205681A1 (en) | 1998-07-22 | 2003-11-06 | Ljl Biosystems, Inc. | Evanescent field illumination devices and methods |
| US6253793B1 (en) | 1998-08-10 | 2001-07-03 | Corlexip | Flexible pipe with i-shaped wire winding |
| US6354333B1 (en) | 1998-08-10 | 2002-03-12 | Coflexip | Resistant flexible pipe comprising sealing sleeve with limited creep |
| US6981526B2 (en) | 1998-12-16 | 2006-01-03 | Nkt Flexibles I/S | Armoured flexible pipe and use of same |
| US6008893A (en) | 1999-03-22 | 1999-12-28 | Biacore Ab | Reversible-flow conduit system |
| US6026053A (en) | 1999-05-21 | 2000-02-15 | The United States Of America As Represented By The Director Of The National Security Agency | Photorefractive read-only optical memory apparatus using phase, frequency, and angular modulation |
| US20020019019A1 (en) | 1999-06-18 | 2002-02-14 | Markku Hamalainen | Method and apparatus for assaying a drug candidate to estimate a pharmacokinetic parameter associated therewith |
| US6143513A (en) | 1999-06-23 | 2000-11-07 | Biacore Ab | Method and kit for detecting betalactam-containing compounds |
| US7045287B2 (en) | 1999-07-20 | 2006-05-16 | Agilent Technologies, Inc. | Method for contacting fluid components with moieties on a surface |
| US6810286B2 (en) | 2000-03-06 | 2004-10-26 | Medtronic, Inc | Stimulation for delivery of molecular therapy |
| US6503760B2 (en) | 2000-03-16 | 2003-01-07 | Biacore Ab | Method for capturing analytes eluted from surface-bound ligands |
| US7193711B2 (en) | 2000-07-11 | 2007-03-20 | Maven Technologies, Llc | Imaging method and apparatus |
| US6594011B1 (en) | 2000-07-11 | 2003-07-15 | Maven Technologies, Llc | Imaging apparatus and method |
| US6882420B2 (en) | 2000-07-11 | 2005-04-19 | Maven Technologies, Llc | Apparatus and method for imaging |
| US6859280B2 (en) | 2000-07-11 | 2005-02-22 | Maven Technologies Llc | Imaging apparatus and method |
| US6833920B2 (en) | 2000-07-11 | 2004-12-21 | Maven Technologies Llc | Apparatus and method for imaging |
| US6806051B2 (en) | 2000-09-25 | 2004-10-19 | Picoliter Inc. | Arrays of partially nonhybridizing oligonucleotides and preparation thereof using focused acoustic energy |
| US6698454B2 (en) | 2000-11-02 | 2004-03-02 | Biacore Ab | Valve integrally associated with microfluidic liquid transport assembly |
| US6549011B2 (en) | 2000-12-20 | 2003-04-15 | Radiodetection Limited | Conductor tracing system |
| US20020182717A1 (en) | 2001-03-14 | 2002-12-05 | Biacore Ab | Method of preparing supported lipid film membranes and use thereof |
| US20020154311A1 (en) | 2001-03-14 | 2002-10-24 | Biacore Ab | Apparatus and method for total internal reflection spectroscopy |
| USD472644S1 (en) | 2001-05-16 | 2003-04-01 | Biacore Ab | Chip carrier for biosensor apparatus |
| USD480149S1 (en) | 2001-05-16 | 2003-09-30 | Biacore Ab | Cover for a measuring cassette for biosensor apparatus |
| US20030022388A1 (en) | 2001-06-29 | 2003-01-30 | Biacore Ab | Flow cell method |
| US20030112432A1 (en) | 2001-09-05 | 2003-06-19 | Genicon Sciences Corporation | Apparatus for reading signals generated from resonance light scattered particle labels |
| WO2003056337A1 (en) | 2001-12-21 | 2003-07-10 | Biacore Ab | Immobilization of binding agents |
| US20040012676A1 (en) | 2002-03-15 | 2004-01-22 | Affymetrix, Inc., A Corporation Organized Under The Laws Of Delaware | System, method, and product for scanning of biological materials |
| US20040002167A1 (en) | 2002-03-27 | 2004-01-01 | Biacore Ab | Method and system for curve quality control |
| US20040030504A1 (en) | 2002-04-26 | 2004-02-12 | Affymetrix, Inc. A Corporation Organized Under The Laws Of Delaware | System, method, and computer program product for the representation of biological sequence data |
| WO2003102580A1 (en) | 2002-05-31 | 2003-12-11 | Biacore Ab | Method of coupling binding agents to a substrate surface |
| US20040023247A1 (en) | 2002-07-31 | 2004-02-05 | Affymetrix, Inc. | Quality control methods for microarray production |
| US20050148063A1 (en) | 2003-12-24 | 2005-07-07 | Cracauer Raymond F. | Disposable reaction vessel with integrated optical elements |
Non-Patent Citations (39)
| Title |
|---|
| "Handbook of Optics", Michael Bass Editor in Chief, by The Optical Society of America; vol. 1; pp. 4.23, 4.24; 1995 McGraw-Hill, Inc. |
| A. Ahluwalia et al. "A comparative study of protein immobilization techniques for optical immunosensors", Biosensors and Bioelectronics 7, (1991) pp. 207-214, 1992 Elsevier Science Publishers Ltd. |
| A. Brecht et al. "Biosensors: Fundamentals, Technologies and Applications" GBF Monographs, vol. 17, pp. 174-178, 1991 Germany. |
| A.W. Flounders et al. "Patterning of immobilized antibody layers via photolithography and oxygen plasma exposure", Biosensors and Bioelectronics, vol. 12, No. 6 pp. 447-456, 1997 Elsevier Science Ltd. Great Britain. |
| Bass, et al. "Handbook of Optics", by The Optical Society of America; vol. 1; Section 41.10; 1995 McGraw-Hill, Inc. |
| C.F. Mandenius et al. "Coupling of Biomolecules to Silicon Surfaces for use in ellipsometry and other related techniques", Methods in Enzymology, vol. 137, pp. 389-394, 1988 Academic Press, Inc. |
| CH Striebel et al. "Characterization of Biomembranes by Spectral Ellipsometry, Surface Plasmon Resonance and Interferometry with Regard to Biosensor Application", Biosensors & Bioelectronics 9, pp. 139-146, 1994 Elsevier Science Publishers Ltd. |
| Christopher Palmer "Diffraction Grating Handbook", pp. 35-44, 2000 Richardson Grating Laboratory, Rochester, New York. |
| Clifford C. Hoyt et al. "Structural analysis with quantitative birefringence imaging", American Laboratory, pp. 34-42, Jul. 1999. |
| Danny Van Noort et al. "Monitoring Specific Interaction of Low Molecular Weight Biomolecules on Oxidized Porous Slicon Ellipsometry", Biosensors & Bioelectronics vol. 13, No. 3-4 pp. 439-449, 1998 Elsevier Science, S.A. Great Britain. |
| Dirk Honig et al. "Direct visualization of monolayers at the air-water interface by Brewster angle microscopy", J. Phys. Chem., pp. 4590 & 4592, 1991 American Chemical Society. |
| Dr. Rudolf Oldenbourg "A new view on polarization microscopy", Nature, vol. 381, pp. 811-812, Jun. 27, 1996. |
| Dr. Rudolf Oldenbourg "Metamorph Imaging System", http://www.image1.com/products/metapolscope/ Universal Imaging Corporation Last Updated Jun. 10, 1999 pp. 1-2. |
| Eggins, "Biosensors: An Introduction", pp. 112-113, 1987 John Wiley & Sons No Date. |
| Erwin G. Loewen "Diffraction Gratings, Ruled and Holographic", Applied Optics and Optical Engineering, vol. IX, pp. 33-71, Bausch and Lomb, Inc., Rochester, New York 1983 Academic Press, Inc. |
| G. Elender et al. "Wetting and Dewetting of Si/SiO2-Wafers by Free and Lipid-Monolayer Covered Aqueous Solutions Under Controlled Humidity", Journal de Physique, II France 4 pp. 455-479, Mar. 1994. |
| Gang Jin et al. "A biosensor concept based on imaging ellipsometry for visualization of biomolecular interactions", Analytical Biochemistry 232, pp. 69-72, 1995. |
| Gang Jin et al. "Imaging Ellipsometry for Biosensor Applications" Transducers '95, Eurosensors IX, Digest of Technical Papers vol. 2, Sessions A7-D13, Papers No. 232-496 pp. 509-512, Stockholm, Sweden, Jun. 1995. |
| Gang Jin et al. "Imaging Ellipsometry Revisited: Developments for Visualization of Thin Transparent Layers on Silicon Substrates", American Institute of Physics, Rev. Sci. Instrum., pp. 2930-2936, Aug. 1996. |
| H. Arwin "Spectroscopic ellipsometry and biology: recent developments and challenges", Thin Solid Films 313-314, pp. 7640774, 1998 Elsevier Science S.A. |
| Hakan Nygren et al., "Kinetics of Antibody-Binding to Surface-Immobilized Antigen: Influence of Mass Transport on the Enzyme-Linked Immunosorbent Assay (ELISA)", Journal of Colloid and Interface Science, vol. 107, No. 2 pp. 560-566, Oct. 1985 Academic Press, Inc. |
| Haken Nygren et al. "Determination by Ellipsometry of the Affinity of Monoclonal Antibodies", Journal of Immunological Methods, 92, pp. 219-225, 1986 Elsevier Science Publishers Ltd. 1992. |
| Harland G. Tompkins, et al. "Spectroscopic Ellipsometry and Reflectometry A User's Guide" A Wiley-Interscience Publication, John Wiley & Sons, Inc., 1999. |
| Huaiyou Wang et al. "Assembly of Antibodies in Lipid Membranes for Biosensor Development", Applied Biochemistry and Biotechnology, vol. 53 pp. 163-181, 1995 Humana Press Inc. |
| Jinyu Wang "Waveguide Ellipsometry Biosensors: Concept and Preliminary Analysis", SPIE vol. 1648, Fiber Optical Medical and Fluorescent Sensors and Applications pp. 44-50, 1992. |
| John F. Place et al. "Opto-electronic Immunosensors: A Review of Optical Immunoassay At Continuous Surfaces", Biosensors 1, pp. 321-353, 1985 Elsevier Applied Science Publishers Ltd., England. |
| Jonsson, Ulf et al. "Biosensors Based on Surface Concentration Measuring Devices-The Concept of Surface Concentration" Progress in Colloid and Polymer Sci. vol. 70, pp. 96-100, 1985. |
| Martin Malmsten et al. "Effects of Hydrophilization and Immobilization on the Interfacial Behavior of Immunoglobulins", Journal of Colloid and Interface Sicence 177, pp. 70-78, 1996 Academic Press, Inc. No Date. |
| Max Born et al. "Principles of Optics-Electromagnetic Theory of Propagation, Interference and Diffraction of Light", Sixth Edition, pp. 47-51 Pergamon Press No Date. |
| Pentti Tengvall et al. "Complement activation by 3-mercapto-1,2-propanediol immobilized on gold surfaces", Biomaterials vol. 17, No. 10 pp. 1001-1007, 1995 Elseviar Science Ltd., Great Britain. |
| Pentti Tengvall et al. "Temporal Studies on the Deposition of Complement on Human Colostrum IgA and Serum Immobilized on Methylated Silicon", Journal of Biomedical Materials Research, vol. 35, pp. 81-91, 1997 John Wiley & Sons, Inc. |
| S. Henon et al. "Microscope at the Brewster angle: direct observation of first-order phase transitions in monolayers", Rev. Sci. Instrum. 62, (4) pp. 936-939, Apr. 1991 American Institute of Physics. |
| Schema, PhD. Mark, "Microarray Biochip Technology" TeleChem International, Inc., Sunnyvale, California, USA, A BioTechniques Books Publication, Eaton Publishing, pp. 10-11, 2000. |
| Schena, Mark "DNA Microarrays: A Practical Approach" Edited by Mark Schena, Department of Biochemistry, Beckman Center, Stanford University Medical Center, Stanford, USA, Oxford University Press, 1999. |
| T.A. Ruzgas et al. "Ellipsometric Immunosensors for the Determination of gamma-Interferon and Human Serum Albumin", Biosensors & Bioelectronics 7, pp. 305-308, 1992 Elsevier Science Publishers Ltd. |
| Tadashi Saitoh, et al. "Optical Characterization of Very Thin Hydrogenated Amorphous Silicon Films Using Spectroscopic Ellipsometry"; Japanese Journal of Applied Physics; vol. 30, No. 11B, Nov. 1991, pp. L1914-L1916. |
| Ulf Jonsson et al. "Flow-Injection Ellipsometry-An in Situ Method for the Study of Biomolecular Adsorption and Interaction at Solid Surfaces," Colloids and Surfaces, 13 (1985) pp. 333-339, 1985 Elsevier Science Publishers BV, Amsterdam, The Netherlands. |
| Ulf Jonsson et al. "Surface Immobilization Techniques in Combination with Ellipsometry" Methods in Enzymology vol. 137, Immobilized Enzymes and Cells Part D pp. 381-1351, 1988 Academic Press, Inc. Harcourt Brace Jovanovich, Publishers. |
| Willems, Goerge M., et al., Adsorption and Conversion of Prothrombin on a Rotating Disc, Blood, Jul. 15, 1993, vol. 82, No. 2, pp. 497-504. |
Cited By (7)
| Publication number | Priority date | Publication date | Assignee | Title |
|---|---|---|---|---|
| US8345241B1 (en)* | 2006-12-19 | 2013-01-01 | J. A. Woollam Co., Inc. | Application of digital light processor in imaging ellipsometer and the like systems |
| US9063072B1 (en) | 2012-06-12 | 2015-06-23 | Maven Technologies, Llc | Birefringence correction for imaging ellipsometric bioassay system and method |
| US20160061964A1 (en)* | 2013-04-09 | 2016-03-03 | Hamamatsu Photonics K.K. | Radiation image detection device |
| US9823359B2 (en)* | 2013-04-09 | 2017-11-21 | Hamamatsu Photonics K.K. | Radiation image detection device |
| US10314549B1 (en) | 2013-07-16 | 2019-06-11 | Alacrity Patient Services, Inc. | Method and apparatus for monitoring development of medication induced febrile neutropenia |
| US11045149B2 (en) | 2013-07-16 | 2021-06-29 | Alacrity Patient Services, Inc. | Method and apparatus for monitoring development of medication induced febrile neutropenia |
| US12318228B2 (en) | 2013-07-16 | 2025-06-03 | Alacrity Patient Services, Inc. | Method and apparatus for monitoring development of medication induced side effects |
Also Published As
| Publication number | Publication date |
|---|---|
| US20080204750A1 (en) | 2008-08-28 |
| US20070058166A1 (en) | 2007-03-15 |
| WO2007079094A2 (en) | 2007-07-12 |
| WO2007079094A3 (en) | 2009-04-23 |
Similar Documents
| Publication | Publication Date | Title |
|---|---|---|
| US11698371B2 (en) | Method for determining the output of an assay with a mobile device | |
| US20080204750A1 (en) | Image acquisition, processing, and display | |
| Giavazzi et al. | A fast and simple label-free immunoassay based on a smartphone | |
| US5717778A (en) | Optical specimen analysis system and method | |
| AU758339B2 (en) | Agglutination assays | |
| EP3596232B1 (en) | Digital molecular assays | |
| US10527549B2 (en) | Cross-talk correction in multiplexing analysis of biological sample | |
| US20050131650A1 (en) | Method and system for interaction analysis | |
| CA2684636A1 (en) | Multiplex microarrays and methods for the quantification of analytes | |
| CN113820286A (en) | Chip and calibration method for DNA ploidy analysis system calibration | |
| WO2013133283A1 (en) | Determination method, determination device, determination system, and program | |
| CN109060802B (en) | A mobile phone-based paper-based analytical sensor quantitative analysis system and analysis method | |
| EP1788523B1 (en) | Image based correction for unwanted light signals in a specific region of interest | |
| US7811824B2 (en) | Method and apparatus for monitoring the properties of a biological or chemical sample | |
| JP3541232B2 (en) | Method for measuring the degree of coloration of immunochromatographic test strips | |
| JP3385471B2 (en) | Surface analysis method | |
| RU2824292C2 (en) | Method for determining concentration of analyte in physiological fluid | |
| JP2022539402A (en) | Methods for Determining Concentrations of Analytes in Body Fluids | |
| Dimech et al. | A Proposed Approach to Estimating Uncertainty of Measurement in Serological Assays |
Legal Events
| Date | Code | Title | Description |
|---|---|---|---|
| AS | Assignment | Owner name:MAVEN TECHNOLOGIES, INC., CALIFORNIA Free format text:ASSIGNMENT OF ASSIGNORS INTEREST;ASSIGNOR:OPTECH VENTURES LLC;REEL/FRAME:018064/0994 Effective date:20060727 | |
| STCF | Information on status: patent grant | Free format text:PATENTED CASE | |
| FPAY | Fee payment | Year of fee payment:4 | |
| AS | Assignment | Owner name:SHAPIRO, HERB, CALIFORNIA Free format text:SECURITY AGREEMENT;ASSIGNOR:MAVEN TECHNOLOGIES, LLC;REEL/FRAME:029922/0633 Effective date:20130201 Owner name:SCHWARTZBARD, MICHAEL, NEW JERSEY Free format text:SECURITY AGREEMENT;ASSIGNOR:MAVEN TECHNOLOGIES, LLC;REEL/FRAME:029922/0633 Effective date:20130201 Owner name:SCHWARTZBARD, JANET, NEW JERSEY Free format text:SECURITY AGREEMENT;ASSIGNOR:MAVEN TECHNOLOGIES, LLC;REEL/FRAME:029922/0633 Effective date:20130201 Owner name:RASSMAN, SEAN, CALIFORNIA Free format text:SECURITY AGREEMENT;ASSIGNOR:MAVEN TECHNOLOGIES, LLC;REEL/FRAME:029922/0633 Effective date:20130201 Owner name:FINNE, RONALD, CALIFORNIA Free format text:SECURITY AGREEMENT;ASSIGNOR:MAVEN TECHNOLOGIES, LLC;REEL/FRAME:029922/0633 Effective date:20130201 Owner name:RASSMAN, WILLIAM, CALIFORNIA Free format text:SECURITY AGREEMENT;ASSIGNOR:MAVEN TECHNOLOGIES, LLC;REEL/FRAME:029922/0633 Effective date:20130201 Owner name:O'HARA, MAUREEN, WASHINGTON Free format text:SECURITY AGREEMENT;ASSIGNOR:MAVEN TECHNOLOGIES, LLC;REEL/FRAME:029922/0633 Effective date:20130201 | |
| AS | Assignment | Owner name:RASSMAN, WILLIAM RICHARD, CALIFORNIA Free format text:SECURITY AGREEMENT;ASSIGNOR:MAVEN TECHNOLOGIES, LLC;REEL/FRAME:031498/0530 Effective date:20131001 | |
| AS | Assignment | Owner name:STRATEC BIOTECHNOLOGIES USA, INC., CALIFORNIA Free format text:SECURITY INTEREST;ASSIGNOR:MAVEN TECHNOLOGIES, LLC, A NEVADA LIMITED LIABILILTY COMPANY DBA MAVEN BIOTECHNOLOGIES;REEL/FRAME:032462/0029 Effective date:20140228 | |
| AS | Assignment | Owner name:MAVEN TECHNOLOGIES LLC, CALIFORNIA Free format text:RELEASE BY SECURED PARTY;ASSIGNOR:STRATEC BIOMEDICAL USA, INC;REEL/FRAME:039808/0990 Effective date:20160824 | |
| FPAY | Fee payment | Year of fee payment:8 | |
| AS | Assignment | Owner name:MAVEN TECHNOLOGIES, LLC, CALIFORNIA Free format text:RELEASE BY SECURED PARTY;ASSIGNOR:RASSMAN, WILLIAM;REEL/FRAME:044854/0531 Effective date:20180123 Owner name:MAVEN TECHNOLOGIES, LLC, CALIFORNIA Free format text:RELEASE BY SECURED PARTY;ASSIGNORS:RASSMAN, WILLIAM;RASSMAN, SEAN;SCHWARTZBARD, MICHAEL;AND OTHERS;REEL/FRAME:044854/0370 Effective date:20180123 Owner name:RASSMAN, WILLIAM, CALIFORNIA Free format text:ASSIGNMENT OF ASSIGNORS INTEREST;ASSIGNOR:MAVEN TECHNOLOGIES, LLC;REEL/FRAME:044855/0142 Effective date:20180207 | |
| AS | Assignment | Owner name:MAVEN BIOTECHNOLOGIES, LLC, CALIFORNIA Free format text:ASSIGNMENT OF ASSIGNORS INTEREST;ASSIGNOR:RASSMAN, WILLIAM;REEL/FRAME:046862/0501 Effective date:20180712 | |
| FEPP | Fee payment procedure | Free format text:MAINTENANCE FEE REMINDER MAILED (ORIGINAL EVENT CODE: REM.); ENTITY STATUS OF PATENT OWNER: SMALL ENTITY | |
| LAPS | Lapse for failure to pay maintenance fees | Free format text:PATENT EXPIRED FOR FAILURE TO PAY MAINTENANCE FEES (ORIGINAL EVENT CODE: EXP.); ENTITY STATUS OF PATENT OWNER: SMALL ENTITY | |
| STCH | Information on status: patent discontinuation | Free format text:PATENT EXPIRED DUE TO NONPAYMENT OF MAINTENANCE FEES UNDER 37 CFR 1.362 | |
| FP | Lapsed due to failure to pay maintenance fee | Effective date:20210414 |