US7502715B1 - Observability in metrology measurements - Google Patents
Observability in metrology measurementsDownload PDFInfo
- Publication number
- US7502715B1 US7502715B1US11/233,527US23352705AUS7502715B1US 7502715 B1US7502715 B1US 7502715B1US 23352705 AUS23352705 AUS 23352705AUS 7502715 B1US7502715 B1US 7502715B1
- Authority
- US
- United States
- Prior art keywords
- observability
- output measurement
- output
- state
- ability
- Prior art date
- Legal status (The legal status is an assumption and is not a legal conclusion. Google has not performed a legal analysis and makes no representation as to the accuracy of the status listed.)
- Expired - Fee Related
Links
Images


Classifications
- G—PHYSICS
- G05—CONTROLLING; REGULATING
- G05B—CONTROL OR REGULATING SYSTEMS IN GENERAL; FUNCTIONAL ELEMENTS OF SUCH SYSTEMS; MONITORING OR TESTING ARRANGEMENTS FOR SUCH SYSTEMS OR ELEMENTS
- G05B17/00—Systems involving the use of models or simulators of said systems
- G05B17/02—Systems involving the use of models or simulators of said systems electric
- G—PHYSICS
- G05—CONTROLLING; REGULATING
- G05B—CONTROL OR REGULATING SYSTEMS IN GENERAL; FUNCTIONAL ELEMENTS OF SUCH SYSTEMS; MONITORING OR TESTING ARRANGEMENTS FOR SUCH SYSTEMS OR ELEMENTS
- G05B13/00—Adaptive control systems, i.e. systems automatically adjusting themselves to have a performance which is optimum according to some preassigned criterion
- G05B13/02—Adaptive control systems, i.e. systems automatically adjusting themselves to have a performance which is optimum according to some preassigned criterion electric
- G05B13/04—Adaptive control systems, i.e. systems automatically adjusting themselves to have a performance which is optimum according to some preassigned criterion electric involving the use of models or simulators
- G05B13/048—Adaptive control systems, i.e. systems automatically adjusting themselves to have a performance which is optimum according to some preassigned criterion electric involving the use of models or simulators using a predictor
- G—PHYSICS
- G05—CONTROLLING; REGULATING
- G05B—CONTROL OR REGULATING SYSTEMS IN GENERAL; FUNCTIONAL ELEMENTS OF SUCH SYSTEMS; MONITORING OR TESTING ARRANGEMENTS FOR SUCH SYSTEMS OR ELEMENTS
- G05B23/00—Testing or monitoring of control systems or parts thereof
- G05B23/02—Electric testing or monitoring
- G05B23/0205—Electric testing or monitoring by means of a monitoring system capable of detecting and responding to faults
- G05B23/0218—Electric testing or monitoring by means of a monitoring system capable of detecting and responding to faults characterised by the fault detection method dealing with either existing or incipient faults
- G05B23/0243—Electric testing or monitoring by means of a monitoring system capable of detecting and responding to faults characterised by the fault detection method dealing with either existing or incipient faults model based detection method, e.g. first-principles knowledge model
- G05B23/0254—Electric testing or monitoring by means of a monitoring system capable of detecting and responding to faults characterised by the fault detection method dealing with either existing or incipient faults model based detection method, e.g. first-principles knowledge model based on a quantitative model, e.g. mathematical relationships between inputs and outputs; functions: observer, Kalman filter, residual calculation, Neural Networks
Definitions
- Metrology measurementsare used in many environments for controlling system processes. For example, in semiconductor manufacturing environments, metrology measurements are frequently used to confirm that products are defect free and that the process is operating within the specified parameters. Sometimes such measurements are also used as an output feedback signal for model-predictive control algorithms that regulate the process.
- metrology measurementsare made across the wafer randomly.
- the randomly selected measurement pointsare usually somewhat correlated, therefore they provide redundant information. Stated another way, it is possible to obtain the same amount of information without requiring as many measurements. Since metrology measurements are often expensive to make, it would be useful to have a way of obtaining metrology measurements that contains (or, as used throughout this specification, observes) more information with a smaller number of measurements.
- FIG. 1is a block diagram illustrating an embodiment of a model predictive controller.
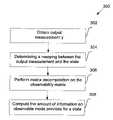
- FIG. 2is a flowchart illustrating an embodiment of a process for evaluating the observability of a system.
- FIG. 3is a flowchart illustrating another embodiment of a process for evaluating the observability of a system.
- FIGS. 4A-4Gare diagrams illustrating an example of determining the effectiveness of several different measurement schemes for a system with a cubic model.
- FIGS. 5A-5Kare diagrams illustrating another example of evaluating observability based on various measurement schemes.
- the inventioncan be implemented in numerous ways, including as a process, an apparatus, a system, a composition of matter, a computer readable medium such as a computer readable storage medium or a computer network wherein program instructions are sent over optical or electronic communication links.
- these implementations, or any other form that the invention may take,may be referred to as techniques.
- a componentsuch as a processor or a memory described as being configured to perform a task includes both a general component that is temporarily configured to perform the task at a given time or a specific component that is manufactured to perform the task.
- the order of the steps of disclosed processesmay be altered within the scope of the invention.
- a systemcan typically by characterized by a set of information referred to as its states, which typically have some correspondence with the inputs. It is common for a system to have states that can be inferred but not directly measured. Observability measures how well the states of a system can be inferred based on its output measurements. A system is observable when it is possible to establish, in a finite interval of time, the time history of the vector x given the time history of the output vector y over the same interval. In some embodiments, one or more output measurements are obtained according to a measurement scheme. As used herein, a measurement scheme refers to a specific way of obtaining a set of measurements.
- a measurement schemeis characterized by, for example, the design, behavior, and placement of the sensors used to make the measurement samples, the time and frequency of measurement samples, or any other appropriated factors that may affect the measurements taken. Based on the measurement scheme, the ability of the measurement scheme to provide information about a state of the system is quantified. In some embodiments, singular value decomposition is used for quantifying the observability of one or more states.
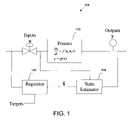
- FIG. 1is a block diagram illustrating an embodiment of a model predictive controller.
- model predictive controller 100is used to estimate and regulate a system that implements a process 106 .
- a semiconductor manufacturing process and metrology associated with the processare described throughout this specification for purposes of illustration, the technique described is also applicable to other systems implementing different processes.
- the controllerincludes a state estimator 104 and a regulator 102 .
- the state estimator and the regulatormay be implemented using hardware (e.g., a processor, a circuitry with a sensor, etc.), software, or a combination.
- the estimator and regulatorare separate system components. In some embodiments, they are an integral part.
- System process 106is modeled using a set of equations based on the input vector u, the output vector y and the state vector x of the system.
- the state vectorincludes one or more states that characterize the system, such as states that define the optical system, the kinetics of the resist, as well as process disturbances and/or any other appropriate parameters.
- the states and the inputsmay share certain variables, although they are not necessarily equivalent.
- the statesare not directly measured but inferred from metrology measurements of the outputs.
- a state modelis known.
- the state estimatorestimates the current system states based on the output y, using the state model.
- the estimated state vectoris denoted as ⁇ circumflex over (x) ⁇ .
- a desired target stateis provided.
- Regulator 102varies the system's inputs according to the estimated state and attempts to drive the estimated states to track desired targets, which in turn would result in desired outputs.
- regulator 102provides feedback to controller 100 by using the estimated states as the initial starting point. In some embodiments, the regulator determines how much the input parameters are to be varied, and injects the input into the process.
- the state estimation problemrefers to finding the most likely values of the states given the measured outputs, the dynamic model of the process, and the measurement sensor.
- the state vector xis governed by a dynamic differential equation and the output y is a function, either linear or nonlinear, of the state vector.
- State estimator 104is configured to infer, or reconstruct the system states by balancing the contribution made by the process model with the measurements.
- Effective state estimationrequires that the measured outputs contain information about the states.
- the statesshould be observable from the output measurements.
- a systemis said to be completely observable if given the measurements, all the states are observable.
- Many systems, however,are only partially observable due to factors such as only certain aspects of the process are measurable, the limitations of the measurement sensors, etc.
- Process observabilityis dependent on, among other things, what is measured and where it is measured. As will be shown in more details below, it is possible to quantify the amount of information an output measurement contains about a certain state, allowing the analysis and comparison of the effectiveness of different output measurement schemes.
- FIG. 2is a flowchart illustrating an embodiment of a process for evaluating the observability of a system.
- Process 200may be implemented by, for example, the estimator 104 .
- an output measurement schemeis determined ( 202 ).
- the output measurement schemeis determined based on the system model, actual output measurements taken, and/or a variety of other factors. A detailed example of how to determine a measurement scheme is discussed below.
- the measurement schemeputs the output measurements in context of the system model. Based on the output measurement and the model, the ability of the output measurement to provide information about one or more states of the system is quantified ( 204 ).
- FIG. 3is a flowchart illustrating another embodiment of a process for evaluating the observability of a system.
- determining the output measurement schemeincludes obtaining one or more output measurements y ( 302 ), and determining a mapping between one or more system states and the output measurements ( 304 ).
- the mappingis dependent on the measurement scheme and the system model. Thus, the mapping is affected by factors related to the measurement scheme, such as the choice of sensors, the time, location and frequency of the measurement samples, as well as by factors related to the system model, such as the system fundamentals and empirical measurement data used to construct the model.
- the mappingincludes an observability matrix (also referred to as a Grammian matrix) C that maps the states of the system to the measured outputs.
- observability matrixalso referred to as a Grammian matrix
- Cmaps the states of the system to the measured outputs.
- matrix decompositionis performed to determine how observable each state is ( 306 ). In other words, the amount of information an output measurement contains about a state of the system is quantified.
- singular value decompositionis used to decompose the observability matrix C to the following form:
- CUSV T , where S is a diagonal matrix that includes the singular values of C and has the same dimension as C, U and V are both unitary matrices.
- the columns of Uare referred to as the left singular vectors of C, and the columns of V are referred to as the right singular vectors of C.
- the singular values and their associated singular vectorscharacterize matrix C.
- U T yS(V T x), where V T x is a linear transformation of x.
- V T xis a linear transformation of x.
- modeslinear combinations of the states, such as V T x, are referred to as modes.
- Singular value decompositionpartitions matrix S according to the relative magnitudes of the singular values, ⁇ i .
- a threshold operationis performed on S.
- Each ⁇ iis compared to a threshold, and any value that is below the threshold is set to zero.
- Smay include one or more rows having only zeros.
- An example of Sis shown as follows:
- the ratio of the largest singular value to the smallest singular valueindicates how singular, in other words how invertible, the observability matrix C is.
- the non-zero rows of Smap the modes V T x to the observable space and the zero rows of S map the modes to the null space.
- the rows of V T that correspond to the non-zero singular valuesmap the state vector to the observable subspace.
- the number of singular values that are greater than zerois equal to the number of observable modes.
- the norm of each column of V T(i.e., the norm of each right singular vector of C) is calculated ( 308 ).
- the computed normis a value no less than 0 and no greater than 1.
- the normindicates how much information the mode provides for a state.
- a norm of 100%indicates that the given measurement scheme provides all the information that is necessary to determine the particular state.
- Process 300may be repeated for one or more sets of output measurement schemes. Different measurement schemes may result in different norm values. The effectiveness of various measurements schemes can be determined by comparing the results.
- FIGS. 4A-4Gare diagrams illustrating an example of determining the effectiveness of several different measurement schemes for a system with a cubic model.
- the model used in this exampledescribes the temperature loss at the edge of the wafer.
- the modelis applicable to processes such as post exposure bake (PEB), chemical vapor deposition (CVD), etch, etc.
- [ y 1 y 2 ⁇ y n ][ 1 r 1 r 1 2 r 1 3 1 r 2 r 2 2 r 2 3 ⁇ ⁇ ⁇ ⁇ 1 r n r n 2 r n 3 ] ⁇ [ x 1 x 2 x 3 x 4 ] .
- the solution to the estimation problem in this exampleinvolves finding the four states based on measurements y.
- the number and the locations of measurementsaffect the amount of information about the states.
- the states of the systemis determined by computing C ⁇ 1 y. If C is invertible, the states will be completely observable (i.e., the estimated states will be equal to the true states). If, however, C is not invertible, the estimated states will likely deviate from the true states because the measurements do not provide sufficient information for describing the states.
- FIG. 4Ais a diagram illustrating the true process output 406 .
- FIG. 4Bis a diagram illustrating the results of a measurement scheme example. The diagram shows the true process output 406 and a predicted output 404 . The predicted output is inferred given the process model and two measurement points ( 400 and 402 ) made of the true output.
- FIG. 4Cis a table showing the comparison of the true states and the inferred states based on the measurements. The observability of each state of the system is quantified using previously described processes. The resulting observability values, which do not reach 100% for every state, indicate that the states are not completely observable based on the measurements given. As a result, the inferred output diverges from the true output.
- FIG. 4Dis a diagram illustrating the results of another measurement scheme.
- the diagramshows the true process output 406 , and the predicted output 416 that is inferred given the process model and three measurement points, 410 , 412 and 414 .
- FIG. 4Eis a table showing the comparison of the true states, the inferred states based on the measurements, and the observability for the states. The observability values indicate that the set of measurements taken in this example provide more information about the states than measurements 400 and 402 . As a result, the predicted output more accurately predicts the true output.
- FIG. 4Fis a diagram illustrating the results of yet another measurement scheme.
- the diagramshows the true process output 406 and the predicted output 428 that is inferred given the process model and four measurement points, 420 , 422 , 424 and 426 .
- FIG. 4Gis a table showing the comparison of the true states, the inferred states based on the measurement, and the observability values are 100% for all the states, indicating that the states are completely observable given this set of measurements. As a result, the predicted output perfectly predicts the true output.
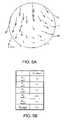
- FIGS. 5A-5Killustrate another example of evaluating observability based on various measurement schemes.
- FIG. 5Ais a diagram illustrating a wafer under process by an overlay system. The arrows indicate the outputs at various locations on the wafer.
- FIG. 5Bis a table showing the true states of the system. The states include x-translation (Tx), y-translation (Ty), scale-x (Sx), scale-y (Sy), grid rotation (Grot), and grid non-orthogonal rotation (Gnon-orth).
- Txx-translation
- Tyy-translation
- Sxscale-x
- Scal-yScal-y
- Grotgrid rotation
- Gnon-orthgrid non-orthogonal rotation
- FIG. 5Ca single measurement point is taken at 500 .
- the inferred outputsare shown as a second set of arrows.
- FIG. 5Dis a table showing the true states, the inferred states, and the
- FIG. 5Ehas three measurement points at 510 , 512 and 514 . Two sets of arrows show the actual outputs and the extrapolated outputs at various other locations on the wafer.
- FIG. 5Fis a table showing the true states, the inferred states, and the observability associated with each state. The observability values are greater or equal to the corresponding values shown in FIG. 5D . Thus, the three measurements in this example provide more information regarding the states than the previous measurement.
- FIG. 5Gillustrates yet another set of measurement points, 520 , 522 , 524 and 526 .
- the measurementsprovide the same amount of observability as the set of three measurements shown in FIGS. 5E-5F . This result may be explained by the fact that the measurements in both cases are taken along the same line on the wafer, thus providing redundant information regarding the states.
- FIGS. 5J-5Kthe system is shown to be completely observable based on three data points 530 , 532 and 534 . The comparison of the measurements indicate that of the measurement schemes used, FIG. 5J provides the most information with the smallest number of measurements.
- Quantification of the observability of various measurement schemesis used in some embodiments to improve the estimator design. As illustrated in the examples above, comparing the observability gives insight into the selection of measurement locations. Other considerations affecting the measurements may also be compared by using the observability values. For example, in some embodiments, the observability of measurement schemes using different types of sensors is quantified. The observability values give indication of how well different types of sensors perform. Comparison of the observability is made to select suitable sensors for the estimator.
Landscapes
- Engineering & Computer Science (AREA)
- Physics & Mathematics (AREA)
- General Physics & Mathematics (AREA)
- Automation & Control Theory (AREA)
- Artificial Intelligence (AREA)
- Evolutionary Computation (AREA)
- Mathematical Physics (AREA)
- Health & Medical Sciences (AREA)
- Computer Vision & Pattern Recognition (AREA)
- Medical Informatics (AREA)
- Software Systems (AREA)
- Testing Or Measuring Of Semiconductors Or The Like (AREA)
Abstract
Description
y=Cx
{circumflex over (x)}=C−1y
y=x1+x2·r+x3·r2+x4·r3.
y=Cx,
where the size and structure of the matrix C is dependent on the measurements and the system fundamentals. Given the radius r and the measured outputs y, the model can be expressed using the following alternative form:
Claims (11)
Priority Applications (1)
| Application Number | Priority Date | Filing Date | Title |
|---|---|---|---|
| US11/233,527US7502715B1 (en) | 2004-09-21 | 2005-09-21 | Observability in metrology measurements |
Applications Claiming Priority (2)
| Application Number | Priority Date | Filing Date | Title |
|---|---|---|---|
| US61182604P | 2004-09-21 | 2004-09-21 | |
| US11/233,527US7502715B1 (en) | 2004-09-21 | 2005-09-21 | Observability in metrology measurements |
Publications (1)
| Publication Number | Publication Date |
|---|---|
| US7502715B1true US7502715B1 (en) | 2009-03-10 |
Family
ID=40417095
Family Applications (1)
| Application Number | Title | Priority Date | Filing Date |
|---|---|---|---|
| US11/233,527Expired - Fee RelatedUS7502715B1 (en) | 2004-09-21 | 2005-09-21 | Observability in metrology measurements |
Country Status (1)
| Country | Link |
|---|---|
| US (1) | US7502715B1 (en) |
Cited By (7)
| Publication number | Priority date | Publication date | Assignee | Title |
|---|---|---|---|---|
| US20110010000A1 (en)* | 2009-06-24 | 2011-01-13 | Asml Netherlands B.V. | Method for Selecting Sample Positions on a Substrate, Method for Providing a Representation of a Model of Properties of a Substrate, Method of Providing a Representation of the Variation of Properties of a Substrate Across the Substrate and Device Manufacturing Method |
| US20120239164A1 (en)* | 2011-03-18 | 2012-09-20 | Rockwell Automation Technologies, Inc. | Graphical language for optimization and use |
| US20120239169A1 (en)* | 2011-03-18 | 2012-09-20 | Rockwell Automation Technologies, Inc. | Transparent models for large scale optimization and control |
| CN107025609A (en)* | 2017-03-16 | 2017-08-08 | 河海大学 | Electrical Power System Dynamic method for estimating state based on singular value decomposition CDKF |
| WO2019168711A1 (en)* | 2018-02-27 | 2019-09-06 | Woodward, Inc. | Anomaly detection and anomaly-based control |
| US10481592B2 (en)* | 2017-10-27 | 2019-11-19 | Globalfoundries Inc. | Selecting manufacturing settings based on historical data from manufacturing tools |
| WO2021107986A1 (en)* | 2019-11-28 | 2021-06-03 | Kla Corporation | Systems and methods for metrology optimization based on metrology landscapes |
Citations (22)
| Publication number | Priority date | Publication date | Assignee | Title |
|---|---|---|---|---|
| US5402367A (en)* | 1993-07-19 | 1995-03-28 | Texas Instruments, Incorporated | Apparatus and method for model based process control |
| US5519605A (en)* | 1994-10-24 | 1996-05-21 | Olin Corporation | Model predictive control apparatus and method |
| US5711843A (en)* | 1995-02-21 | 1998-01-27 | Orincon Technologies, Inc. | System for indirectly monitoring and controlling a process with particular application to plasma processes |
| US6230069B1 (en)* | 1998-06-26 | 2001-05-08 | Advanced Micro Devices, Inc. | System and method for controlling the manufacture of discrete parts in semiconductor fabrication using model predictive control |
| US6263355B1 (en)* | 1997-12-23 | 2001-07-17 | Montell North America, Inc. | Non-linear model predictive control method for controlling a gas-phase reactor including a rapid noise filter and method therefor |
| US6285971B1 (en)* | 1997-08-22 | 2001-09-04 | Voyan Technology | Method for real-time nonlinear system state estimation and control |
| US6373033B1 (en)* | 1996-01-31 | 2002-04-16 | Asm America, Inc. | Model-based predictive control of thermal processing |
| US6718224B2 (en)* | 2001-09-17 | 2004-04-06 | Yield Dynamics, Inc. | System and method for estimating error in a manufacturing process |
| US6725098B2 (en)* | 2001-10-23 | 2004-04-20 | Brooks Automation, Inc. | Semiconductor run-to-run control system with missing and out-of-order measurement handling |
| US6738677B2 (en)* | 1996-05-06 | 2004-05-18 | Pavilion Technologies, Inc. | Method and apparatus for modeling dynamic and steady-state processes for prediction, control and optimization |
| US6738682B1 (en)* | 2001-09-13 | 2004-05-18 | Advances Micro Devices, Inc. | Method and apparatus for scheduling based on state estimation uncertainties |
| US6757579B1 (en)* | 2001-09-13 | 2004-06-29 | Advanced Micro Devices, Inc. | Kalman filter state estimation for a manufacturing system |
| US6766214B1 (en)* | 2003-04-03 | 2004-07-20 | Advanced Micro Devices, Inc. | Adjusting a sampling rate based on state estimation results |
| US20040167655A1 (en)* | 2003-02-22 | 2004-08-26 | Scott Middlebrooks | Optimal model predictive control of overlay implemented in a ASIC fab |
| US6826521B1 (en)* | 2000-04-06 | 2004-11-30 | Abb Automation Inc. | System and methodology and adaptive, linear model predictive control based on rigorous, nonlinear process model |
| US20050187643A1 (en)* | 2004-02-19 | 2005-08-25 | Pavilion Technologies, Inc. | Parametric universal nonlinear dynamics approximator and use |
| US20050209714A1 (en)* | 2004-02-06 | 2005-09-22 | Rawlings James B | SISO model predictive controller |
| US6988017B2 (en)* | 2000-09-15 | 2006-01-17 | Advanced Micro Devices, Inc. | Adaptive sampling method for improved control in semiconductor manufacturing |
| US7006900B2 (en)* | 2002-11-14 | 2006-02-28 | Asm International N.V. | Hybrid cascade model-based predictive control system |
| US7092863B2 (en)* | 2000-12-26 | 2006-08-15 | Insyst Ltd. | Model predictive control (MPC) system using DOE based model |
| US7330804B2 (en)* | 2000-06-29 | 2008-02-12 | Aspen Technology, Inc. | Computer method and apparatus for constraining a non-linear approximator of an empirical process |
| US7376472B2 (en)* | 2002-09-11 | 2008-05-20 | Fisher-Rosemount Systems, Inc. | Integrated model predictive control and optimization within a process control system |
- 2005
- 2005-09-21USUS11/233,527patent/US7502715B1/ennot_activeExpired - Fee Related
Patent Citations (23)
| Publication number | Priority date | Publication date | Assignee | Title |
|---|---|---|---|---|
| US5402367A (en)* | 1993-07-19 | 1995-03-28 | Texas Instruments, Incorporated | Apparatus and method for model based process control |
| US5519605A (en)* | 1994-10-24 | 1996-05-21 | Olin Corporation | Model predictive control apparatus and method |
| US5711843A (en)* | 1995-02-21 | 1998-01-27 | Orincon Technologies, Inc. | System for indirectly monitoring and controlling a process with particular application to plasma processes |
| US6373033B1 (en)* | 1996-01-31 | 2002-04-16 | Asm America, Inc. | Model-based predictive control of thermal processing |
| US6738677B2 (en)* | 1996-05-06 | 2004-05-18 | Pavilion Technologies, Inc. | Method and apparatus for modeling dynamic and steady-state processes for prediction, control and optimization |
| US6285971B1 (en)* | 1997-08-22 | 2001-09-04 | Voyan Technology | Method for real-time nonlinear system state estimation and control |
| US6263355B1 (en)* | 1997-12-23 | 2001-07-17 | Montell North America, Inc. | Non-linear model predictive control method for controlling a gas-phase reactor including a rapid noise filter and method therefor |
| US6230069B1 (en)* | 1998-06-26 | 2001-05-08 | Advanced Micro Devices, Inc. | System and method for controlling the manufacture of discrete parts in semiconductor fabrication using model predictive control |
| US6826521B1 (en)* | 2000-04-06 | 2004-11-30 | Abb Automation Inc. | System and methodology and adaptive, linear model predictive control based on rigorous, nonlinear process model |
| US7330804B2 (en)* | 2000-06-29 | 2008-02-12 | Aspen Technology, Inc. | Computer method and apparatus for constraining a non-linear approximator of an empirical process |
| US6988017B2 (en)* | 2000-09-15 | 2006-01-17 | Advanced Micro Devices, Inc. | Adaptive sampling method for improved control in semiconductor manufacturing |
| US7092863B2 (en)* | 2000-12-26 | 2006-08-15 | Insyst Ltd. | Model predictive control (MPC) system using DOE based model |
| US6757579B1 (en)* | 2001-09-13 | 2004-06-29 | Advanced Micro Devices, Inc. | Kalman filter state estimation for a manufacturing system |
| US6738682B1 (en)* | 2001-09-13 | 2004-05-18 | Advances Micro Devices, Inc. | Method and apparatus for scheduling based on state estimation uncertainties |
| US6718224B2 (en)* | 2001-09-17 | 2004-04-06 | Yield Dynamics, Inc. | System and method for estimating error in a manufacturing process |
| US6725098B2 (en)* | 2001-10-23 | 2004-04-20 | Brooks Automation, Inc. | Semiconductor run-to-run control system with missing and out-of-order measurement handling |
| US6748280B1 (en)* | 2001-10-23 | 2004-06-08 | Brooks Automation, Inc. | Semiconductor run-to-run control system with state and model parameter estimation |
| US7376472B2 (en)* | 2002-09-11 | 2008-05-20 | Fisher-Rosemount Systems, Inc. | Integrated model predictive control and optimization within a process control system |
| US7006900B2 (en)* | 2002-11-14 | 2006-02-28 | Asm International N.V. | Hybrid cascade model-based predictive control system |
| US20040167655A1 (en)* | 2003-02-22 | 2004-08-26 | Scott Middlebrooks | Optimal model predictive control of overlay implemented in a ASIC fab |
| US6766214B1 (en)* | 2003-04-03 | 2004-07-20 | Advanced Micro Devices, Inc. | Adjusting a sampling rate based on state estimation results |
| US20050209714A1 (en)* | 2004-02-06 | 2005-09-22 | Rawlings James B | SISO model predictive controller |
| US20050187643A1 (en)* | 2004-02-19 | 2005-08-25 | Pavilion Technologies, Inc. | Parametric universal nonlinear dynamics approximator and use |
Non-Patent Citations (4)
| Title |
|---|
| Dougherty et al., A Practice Multiple Model Adaptive Stategy for Multivariable Model Predictive Control, 2003, Control Engineering Practice, pp. 649-664.* |
| Middlebrooks, Scott Anderson. "Modelling and Control of Silicon and Germanium Thin Film Chemical Vapor Deposition," Diss. U of Wisconsin-Madison, 2001. pp. 42-43. |
| Muske, K., Linear Model predictive Control of Chemical Processes, Univ. of Texas at Austin, May 1995.* |
| Waller, J., Concept and Methodologies in Non-Linear Model Predictive Control, Jan. 26, 2000.* |
Cited By (13)
| Publication number | Priority date | Publication date | Assignee | Title |
|---|---|---|---|---|
| US20110010000A1 (en)* | 2009-06-24 | 2011-01-13 | Asml Netherlands B.V. | Method for Selecting Sample Positions on a Substrate, Method for Providing a Representation of a Model of Properties of a Substrate, Method of Providing a Representation of the Variation of Properties of a Substrate Across the Substrate and Device Manufacturing Method |
| US8504333B2 (en) | 2009-06-24 | 2013-08-06 | Asml Netherlands B.V. | Method for selecting sample positions on a substrate, method for providing a representation of a model of properties of a substrate, method of providing a representation of the variation of properties of a substrate across the substrate and device manufacturing method |
| US20120239164A1 (en)* | 2011-03-18 | 2012-09-20 | Rockwell Automation Technologies, Inc. | Graphical language for optimization and use |
| US20120239169A1 (en)* | 2011-03-18 | 2012-09-20 | Rockwell Automation Technologies, Inc. | Transparent models for large scale optimization and control |
| US8874242B2 (en)* | 2011-03-18 | 2014-10-28 | Rockwell Automation Technologies, Inc. | Graphical language for optimization and use |
| CN107025609B (en)* | 2017-03-16 | 2020-10-16 | 河海大学 | Dynamic State Estimation Method of Power System Based on Singular Value Decomposition CDKF |
| CN107025609A (en)* | 2017-03-16 | 2017-08-08 | 河海大学 | Electrical Power System Dynamic method for estimating state based on singular value decomposition CDKF |
| US10481592B2 (en)* | 2017-10-27 | 2019-11-19 | Globalfoundries Inc. | Selecting manufacturing settings based on historical data from manufacturing tools |
| WO2019168711A1 (en)* | 2018-02-27 | 2019-09-06 | Woodward, Inc. | Anomaly detection and anomaly-based control |
| US10642262B2 (en) | 2018-02-27 | 2020-05-05 | Woodward, Inc. | Anomaly detection and anomaly-based control |
| US10921798B2 (en) | 2018-02-27 | 2021-02-16 | Woodward, Inc. | Anomaly detection and anomaly-based control |
| WO2021107986A1 (en)* | 2019-11-28 | 2021-06-03 | Kla Corporation | Systems and methods for metrology optimization based on metrology landscapes |
| US11725934B2 (en) | 2019-11-28 | 2023-08-15 | Kla Corporation | Systems and methods for metrology optimization based on metrology landscapes |
Similar Documents
| Publication | Publication Date | Title |
|---|---|---|
| KR100824443B1 (en) | Adaptive Sampling Method and Apparatus for Improved Control of Semiconductor Manufacturing | |
| US9934351B2 (en) | Wafer point by point analysis and data presentation | |
| US6748280B1 (en) | Semiconductor run-to-run control system with state and model parameter estimation | |
| Ingolfsson et al. | Stability and sensitivity of an EWMA controller | |
| Warne et al. | Statistical and computational intelligence techniques for inferential model development: a comparative evaluation and a novel proposition for fusion | |
| US6766214B1 (en) | Adjusting a sampling rate based on state estimation results | |
| US11474150B2 (en) | Data processing method, data processing device, and non-transitory computer-readable recording medium | |
| US8924001B2 (en) | Etching apparatus, control simulator, and semiconductor device manufacturing method | |
| CN101790726B (en) | Monitoring methods and equipment | |
| US20070276528A1 (en) | Management system of semiconductor fabrication apparatus, abnormality factor extraction method of semiconductor fabrication apparatus, and management method of the same | |
| US7840298B2 (en) | Method and system for advanced process control using measurement uncertainty as control input | |
| US7869894B2 (en) | Method and system for advanced process control using a combination of weighted relative bias values | |
| US7502715B1 (en) | Observability in metrology measurements | |
| Zhang et al. | Dynamical process monitoring using dynamical hierarchical kernel partial least squares | |
| JP2009532897A (en) | Time weighted moving average filter | |
| KR20080079328A (en) | Improved State Estimation Based on Information Reliability | |
| US8355810B2 (en) | Method and system for estimating context offsets for run-to-run control in a semiconductor fabrication facility | |
| CN113945262B (en) | Offset load error correction method and system | |
| US6895295B1 (en) | Method and apparatus for controlling a multi-chamber processing tool | |
| EP1444556A1 (en) | Semiconductor run-to-run control system with state and model parameter estimation | |
| WO2010119939A1 (en) | Process parameter selection apparatus, process parameter selection method, process parameter selection program, and program storage medium | |
| Gins et al. | The RAYMOND simulation package—Generating RAYpresentative MONitoring Data to design advanced process monitoring and control algorithms | |
| US6912433B1 (en) | Determining a next tool state based on fault detection information | |
| US6931301B2 (en) | System processing time computation method computation device, and recording medium with computation program recorded thereon | |
| Brauner et al. | Identifying and removing sources of imprecision in polynomial regression |
Legal Events
| Date | Code | Title | Description |
|---|---|---|---|
| AS | Assignment | Owner name:MODEL PREDICTIVE SYSTEMS, INC., CALIFORNIA Free format text:ASSIGNMENT OF ASSIGNORS INTEREST;ASSIGNOR:MIDDLEBROOKS, SCOTT A;REEL/FRAME:017290/0731 Effective date:20051104 | |
| AS | Assignment | Owner name:ASML NETHERLANDS B.V., ARIZONA Free format text:ASSIGNMENT OF ASSIGNORS INTEREST;ASSIGNOR:MODEL PREDICTIVE SYSTEMS, INC.;REEL/FRAME:018711/0438 Effective date:20061128 | |
| AS | Assignment | Owner name:ASML NETHERLANDS B.V., NETHERLANDS Free format text:CORRECTIVE ASSIGNMENT TO CORRECT THE ASSIGNEE'S ADDRESS PREVIOUSLY RECORDED ON REEL/FRAME 0187;ASSIGNOR:MODEL PREDICTIVE SYSTEMS, INC.;REEL/FRAME:018961/0597 Effective date:20061128 | |
| FEPP | Fee payment procedure | Free format text:PAYOR NUMBER ASSIGNED (ORIGINAL EVENT CODE: ASPN); ENTITY STATUS OF PATENT OWNER: LARGE ENTITY | |
| FPAY | Fee payment | Year of fee payment:4 | |
| REMI | Maintenance fee reminder mailed | ||
| LAPS | Lapse for failure to pay maintenance fees | ||
| STCH | Information on status: patent discontinuation | Free format text:PATENT EXPIRED DUE TO NONPAYMENT OF MAINTENANCE FEES UNDER 37 CFR 1.362 | |
| FP | Lapsed due to failure to pay maintenance fee | Effective date:20170310 |