US7499161B2 - Depth-resolved spectroscopy method and apparatus - Google Patents
Depth-resolved spectroscopy method and apparatusDownload PDFInfo
- Publication number
- US7499161B2 US7499161B2US11/428,806US42880606AUS7499161B2US 7499161 B2US7499161 B2US 7499161B2US 42880606 AUS42880606 AUS 42880606AUS 7499161 B2US7499161 B2US 7499161B2
- Authority
- US
- United States
- Prior art keywords
- fiber
- light rays
- ball
- specimen
- shaped lens
- Prior art date
- Legal status (The legal status is an assumption and is not a legal conclusion. Google has not performed a legal analysis and makes no representation as to the accuracy of the status listed.)
- Expired - Fee Related, expires
Links
- 238000000034methodMethods0.000titleclaimsabstractdescription28
- 238000003870depth resolved spectroscopyMethods0.000titleabstractdescription4
- 239000000835fiberSubstances0.000claimsabstractdescription102
- 238000005286illuminationMethods0.000claimsabstractdescription45
- 239000000523sampleSubstances0.000claimsabstractdescription40
- 238000001514detection methodMethods0.000claimsabstractdescription38
- 230000005284excitationEffects0.000claimsdescription28
- 230000003287optical effectEffects0.000claimsdescription15
- 238000004611spectroscopical analysisMethods0.000claimsdescription12
- 210000005081epithelial layerAnatomy0.000claimsdescription2
- 210000000056organAnatomy0.000claimsdescription2
- 210000001519tissueAnatomy0.000description30
- 238000013519translationMethods0.000description25
- 230000008859changeEffects0.000description5
- 210000000981epitheliumAnatomy0.000description5
- 238000004519manufacturing processMethods0.000description4
- 238000004458analytical methodMethods0.000description3
- 238000012986modificationMethods0.000description3
- 230000004048modificationEffects0.000description3
- 230000008901benefitEffects0.000description2
- 230000001419dependent effectEffects0.000description2
- 238000009826distributionMethods0.000description2
- 230000006870functionEffects0.000description2
- 238000005259measurementMethods0.000description2
- 230000004044responseEffects0.000description2
- 238000005070samplingMethods0.000description2
- 238000000926separation methodMethods0.000description2
- 102000008186CollagenHuman genes0.000description1
- 108010035532CollagenProteins0.000description1
- 239000004593EpoxySubstances0.000description1
- 102000001554HemoglobinsHuman genes0.000description1
- 108010054147HemoglobinsProteins0.000description1
- 102000011782KeratinsHuman genes0.000description1
- 108010076876KeratinsProteins0.000description1
- QIVBCDIJIAJPQS-VIFPVBQESA-NL-tryptophaneChemical compoundC1=CC=C2C(C[C@H](N)C(O)=O)=CNC2=C1QIVBCDIJIAJPQS-VIFPVBQESA-N0.000description1
- 206010028980NeoplasmDiseases0.000description1
- 238000001069Raman spectroscopyMethods0.000description1
- QIVBCDIJIAJPQS-UHFFFAOYSA-NTryptophanNatural productsC1=CC=C2C(CC(N)C(O)=O)=CNC2=C1QIVBCDIJIAJPQS-UHFFFAOYSA-N0.000description1
- 239000006096absorbing agentSubstances0.000description1
- 230000004075alterationEffects0.000description1
- 230000033115angiogenesisEffects0.000description1
- 238000000149argon plasma sinteringMethods0.000description1
- 238000003491arrayMethods0.000description1
- 210000003679cervix uteriAnatomy0.000description1
- 229920001436collagenPolymers0.000description1
- 238000004891communicationMethods0.000description1
- 238000004132cross linkingMethods0.000description1
- 238000012631diagnostic techniqueMethods0.000description1
- 210000002919epithelial cellAnatomy0.000description1
- 210000003238esophagusAnatomy0.000description1
- VWWQXMAJTJZDQX-UYBVJOGSSA-Nflavin adenine dinucleotideChemical compoundC1=NC2=C(N)N=CN=C2N1[C@@H]([C@H](O)[C@@H]1O)O[C@@H]1CO[P@](O)(=O)O[P@@](O)(=O)OC[C@@H](O)[C@@H](O)[C@@H](O)CN1C2=NC(=O)NC(=O)C2=NC2=C1C=C(C)C(C)=C2VWWQXMAJTJZDQX-UYBVJOGSSA-N0.000description1
- 235000019162flavin adenine dinucleotideNutrition0.000description1
- 239000011714flavin adenine dinucleotideSubstances0.000description1
- 229940093632flavin-adenine dinucleotideDrugs0.000description1
- 238000001506fluorescence spectroscopyMethods0.000description1
- 239000012535impuritySubstances0.000description1
- 238000001727in vivoMethods0.000description1
- 230000002503metabolic effectEffects0.000description1
- 230000000877morphologic effectEffects0.000description1
- 210000000214mouthAnatomy0.000description1
- 229930027945nicotinamide-adenine dinucleotideNatural products0.000description1
- BOPGDPNILDQYTO-NNYOXOHSSA-Nnicotinamide-adenine dinucleotideChemical compoundC1=CCC(C(=O)N)=CN1[C@H]1[C@H](O)[C@H](O)[C@@H](COP(O)(=O)OP(O)(=O)OC[C@@H]2[C@H]([C@@H](O)[C@@H](O2)N2C3=NC=NC(N)=C3N=C2)O)O1BOPGDPNILDQYTO-NNYOXOHSSA-N0.000description1
- 239000013307optical fiberSubstances0.000description1
- 102000004169proteins and genesHuman genes0.000description1
- 108090000623proteins and genesProteins0.000description1
- 238000001055reflectance spectroscopyMethods0.000description1
- 229910052594sapphireInorganic materials0.000description1
- 239000010980sapphireSubstances0.000description1
- 230000008685targetingEffects0.000description1
- 230000007704transitionEffects0.000description1
- 210000003932urinary bladderAnatomy0.000description1
Images


Classifications
- G—PHYSICS
- G01—MEASURING; TESTING
- G01N—INVESTIGATING OR ANALYSING MATERIALS BY DETERMINING THEIR CHEMICAL OR PHYSICAL PROPERTIES
- G01N21/00—Investigating or analysing materials by the use of optical means, i.e. using sub-millimetre waves, infrared, visible or ultraviolet light
- G01N21/17—Systems in which incident light is modified in accordance with the properties of the material investigated
- G01N21/47—Scattering, i.e. diffuse reflection
- G01N21/49—Scattering, i.e. diffuse reflection within a body or fluid
- A—HUMAN NECESSITIES
- A61—MEDICAL OR VETERINARY SCIENCE; HYGIENE
- A61B—DIAGNOSIS; SURGERY; IDENTIFICATION
- A61B5/00—Measuring for diagnostic purposes; Identification of persons
- A61B5/0059—Measuring for diagnostic purposes; Identification of persons using light, e.g. diagnosis by transillumination, diascopy, fluorescence
- A61B5/0071—Measuring for diagnostic purposes; Identification of persons using light, e.g. diagnosis by transillumination, diascopy, fluorescence by measuring fluorescence emission
- A—HUMAN NECESSITIES
- A61—MEDICAL OR VETERINARY SCIENCE; HYGIENE
- A61B—DIAGNOSIS; SURGERY; IDENTIFICATION
- A61B5/00—Measuring for diagnostic purposes; Identification of persons
- A61B5/0059—Measuring for diagnostic purposes; Identification of persons using light, e.g. diagnosis by transillumination, diascopy, fluorescence
- A61B5/0075—Measuring for diagnostic purposes; Identification of persons using light, e.g. diagnosis by transillumination, diascopy, fluorescence by spectroscopy, i.e. measuring spectra, e.g. Raman spectroscopy, infrared absorption spectroscopy
- A—HUMAN NECESSITIES
- A61—MEDICAL OR VETERINARY SCIENCE; HYGIENE
- A61B—DIAGNOSIS; SURGERY; IDENTIFICATION
- A61B5/00—Measuring for diagnostic purposes; Identification of persons
- A61B5/0059—Measuring for diagnostic purposes; Identification of persons using light, e.g. diagnosis by transillumination, diascopy, fluorescence
- A61B5/0082—Measuring for diagnostic purposes; Identification of persons using light, e.g. diagnosis by transillumination, diascopy, fluorescence adapted for particular medical purposes
- A61B5/0088—Measuring for diagnostic purposes; Identification of persons using light, e.g. diagnosis by transillumination, diascopy, fluorescence adapted for particular medical purposes for oral or dental tissue
- A—HUMAN NECESSITIES
- A61—MEDICAL OR VETERINARY SCIENCE; HYGIENE
- A61B—DIAGNOSIS; SURGERY; IDENTIFICATION
- A61B5/00—Measuring for diagnostic purposes; Identification of persons
- A61B5/44—Detecting, measuring or recording for evaluating the integumentary system, e.g. skin, hair or nails
- A61B5/441—Skin evaluation, e.g. for skin disorder diagnosis
- A61B5/443—Evaluating skin constituents, e.g. elastin, melanin, water
- A—HUMAN NECESSITIES
- A61—MEDICAL OR VETERINARY SCIENCE; HYGIENE
- A61B—DIAGNOSIS; SURGERY; IDENTIFICATION
- A61B5/00—Measuring for diagnostic purposes; Identification of persons
- A61B5/44—Detecting, measuring or recording for evaluating the integumentary system, e.g. skin, hair or nails
- A61B5/441—Skin evaluation, e.g. for skin disorder diagnosis
- A61B5/444—Evaluating skin marks, e.g. mole, nevi, tumour, scar
- A—HUMAN NECESSITIES
- A61—MEDICAL OR VETERINARY SCIENCE; HYGIENE
- A61B—DIAGNOSIS; SURGERY; IDENTIFICATION
- A61B2562/00—Details of sensors; Constructional details of sensor housings or probes; Accessories for sensors
- A61B2562/02—Details of sensors specially adapted for in-vivo measurements
- A61B2562/0233—Special features of optical sensors or probes classified in A61B5/00
- A61B2562/0242—Special features of optical sensors or probes classified in A61B5/00 for varying or adjusting the optical path length in the tissue
Definitions
- Embodiments of the present inventionrelate generally to optical spectroscopy. More particularly, embodiments of the present invention relate to depth-resolved measurements of fluorescence and reflectance properties of a specimen.
- Optical spectroscopyis emerging as an effective diagnostic technique for noninvasive detection of cancers and prefacers that originate in the epithelial lining of organs such as the uterine cervix, the oral cavity, the urinary bladder, and the esophagus.
- the progression of precancer in these tissuesproduces morphologic and biochemical changes in the epithelium and supporting stroma. These changes include alterations in epithelial cell morphology and metabolic activity, changes in stromal protein morphology and cross-linking, and increasing stromal angiogenesis.
- Endogenous chromophorescan be detected noninvasively in vivo by use of fiber-optic fluorescence and reflectance spectroscopy.
- Many fiber-optic probe designscollect the integrated signal from both the epithelium (which is typically of the order of 300 ⁇ m thick) and the underlying stroma. In these systems, sophisticated analysis strategies are required for deconvolution of spectroscopic data to yield quantitative concentrations of chromophores, and little information about depth-related changes is obtained.
- Fiber-optic probes that can localize spectroscopic information by depth to distinguish epithelial and stromal optical signaturesshould improve the ability of spectroscopy to evaluate noninvasively the progression of precancerous changes.
- Single-fiber probe configurationsin which the same fiber is used for illumination and collection, are sensitive to light scattering from superficial tissue regions.
- the use of single-fiber probes for optical measurementsis limited by lower signal-to-noise ratios that are due to autofluorescence generated by impurities in the fiber core and by specular reflection from fiber surfaces.
- multiple-fiber probesmany configurations are possible.
- Straight-fiber geometries with different source detector separationspermit some depth discrimination; however, in epithelial tissue the signal from the stroma tends to dominate, even at minimum source-detector separation.
- Angled illumination and collection fiberscan be used to target specific depth regions. Targeting the epithelial layer, however, requires steep angles that may increase the diameter of the probe so as to be impractical for clinical probe designs.
- Embodiments of the present disclosureprovide a method and apparatus for depth-resolved spectroscopy of a specimen.
- Embodimentscomprise a method of obtaining spectroscopic data using a fiber-optic probe comprising an excitation source, a collection fiber and a ball lens to redirect the light from the excitation source. The light is redirected so that it intersects a detection region of the collection fiber in a specific depth layer. The light illuminates a target, which generates an optical signal that is received by the collection fiber.
- the fiber-optic probecomprises a pair of excitation fibers equidistant from a collection fiber that is proximal to a central axis of the ball lens.
- ball-shaped lensor “ball lens” refers to any lens that is substantially spherical in shape.
- substantiallyand its variations are defined as being largely but not necessarily wholly what is specified as understood by one of ordinary skill in the art, and in one non-limiting embodiment the term “substantially” refers to ranges within 10%, preferably within 5%, more preferably within 1%, and most preferably within 0.5% of what is specified.
- a step of a method or an element of a devicethat “comprises,” “has,” “includes” or “contains” one or more features possesses those one or more features, but is not limited to possessing only those one or more features.
- a device or structure that is configured in a certain wayis configured in at least that way, but may also be configured in ways that are not listed.
- Coupledis defined as connected, although not necessarily directly, and not necessarily mechanically
- FIG. 1is a section side view, in accordance with embodiments of this disclosure.
- FIG. 2is an end view, in accordance with embodiments of this disclosure.
- FIG. 3is a detailed view of a fiber-optic probe, in accordance with embodiments of this disclosure.
- FIG. 4is a detailed view of a fiber-optic probe and a ball-shaped lens, in accordance with embodiments of this disclosure.
- FIG. 5is a detailed view of a fiber-optic probe and a ball-shaped lens, in accordance with embodiments of this disclosure.
- FIG. 6is a flowchart of steps performed by a software program operating a spectroscopic system, in accordance with embodiments of this disclosure.
- FIG. 7is a flowchart of steps performed by a software program analyzing data collected by a spectroscopic system, in accordance with embodiments of this disclosure.
- Embodiments of this disclosureprovide a method and apparatus for obtaining depth-dependent spectrographic data from targets distributed throughout a specimen.
- FIG. 1is a cross-section side view (taken along line 1 - 1 in FIG. 2 ) of a fiber-optic probe 100 in accordance with embodiments of this disclosure.
- FIG. 2is a end view of probe 100 , with certain components omitted for clarity (discussed more fully below).
- Fiber-optic probe 100comprises a central collection fiber 110 , a pair of deep tissue collection fibers 120 , 130 , and a generally spherical ball or ball-shaped lens 150 .
- Distributed around central collection fiber 110are a plurality of medium tissue illumination fibers 112 and a plurality of shallow tissue illumination fibers 114 .
- Located adjacent to deep tissue collection fiber 120are a pair of deep tissue illumination fibers 122 , 124 and adjacent to deep tissue collection fiber 130 are a pair of deep tissue illumination fibers 132 , 134 .
- a sheath 160encases the collection and illumination fibers and terminates at a plate 165 .
- An extension member 170extends beyond plate 165 and is coupled to a retaining member 175 , which retains ball-shaped lens 150 .
- central collection fiber 110 and medium illumination fibers 112terminate at plate 165 .
- deep tissue collection fibers 120 , 130 and deep tissue illumination fibers 122 , 124 , 132 and 134extend through plate 165 and terminate at retaining member 175 .
- Ball-shaped lens 150is secured to retaining member 175 (via epoxy or other suitable means) and is located proximal to the ends of central collection fiber 110 , medium tissue illumination fibers 112 and shallow tissue illumination fibers 114 .
- ball-shaped lens 150is a 2.0 millimeter diameter sapphire lens. Retaining member 175 , extension member 170 and plate 165 are not shown in FIG. 2 for purposes of clarity.
- FIG. 3deep tissue collection fiber 120 and illumination fibers 122 , 124 (which are not refracted by ball-shaped lens 150 ) are shown.
- the general operating principles of fiber-optic probesare well-known and will not be discussed in detail in this disclosure. For an overview of such principles, see U. Utzinger and R. Richards-Kortum, “Fiber Optic Probes for Biomedical Optical Spectroscopy,” Journal of Biomedical Optics 8(1), 121-147 (January 2003), herein incorporated by reference.
- FIG. U. Utzinger and R. Richards-Kortum“Fiber Optic Probes for Biomedical Optical Spectroscopy,” Journal of Biomedical Optics 8(1), 121-147 (January 2003), herein incorporated by reference.
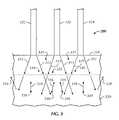
- FIG. 3provides a detailed view of the ends of a deep tissue collection fiber 120 and illumination fibers 122 , 124 in contact with or coupled with a specimen 200 , which comprises a top layer 210 and a supporting layer 220 .
- illumination fibers 122 and 124emit light rays 313 and 317 that illuminate specimen 200 .
- Specimen 200comprises targets 340 in supporting layer 220 that are located within a detection region or cone 311 of collection fiber 120 and targets 320 in supporting layer 220 that are outside of detection cone 311 .
- Light rays 313 and 317are received by targets 320 and 340 , which remit light rays 318 and 316 , respectively.
- Specimen 200also comprises targets 330 , 331 and 332 in top layer 210 .
- Targets 330are illuminated by fibers 122 , 124
- targets 332are in detection cone 311 .
- Targets 331do not lie within detection cone 311 and are not illuminated by fibers 122 , 124 .
- Remitted light rays 318are outside a detection region or cone 311 of collection fiber 120 , while remitted light rays 316 are inside detection cone 311 .
- Detection cone 311is a generally cone-shaped volume of space extending from the end of collection fiber 120 in which collection fiber 120 is capable of detecting light rays.
- “remitted” light raysinclude light rays reflected or fluoresced from a specimen as a result of illuminating the specimen with an illumination or excitation light ray.
- Collection fiber 120detects remitted light rays 316 that are within detection cone 311 and remitted light rays 316 are then transmitted to a spectrograph (not shown) for analysis. As shown in FIG.
- any targets 330 in top layer 210will be illuminated, but will not be detected.
- targets 332are in detection cone 311 , but will not be illuminated.
- Targets 331will be neither illuminated nor detected.
- Conventional fiber-optic probe arrangements(such as deep tissue collection fiber 120 and illumination fibers 122 , 124 ) are therefore not suited for illuminating and detecting targets near the surface of a specimen.
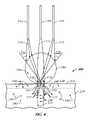
- Specimen 200comprises a top layer 210 (such as an epithelium) and a supporting layer 220 (such as a stroma). Distributed throughout top layer 210 are a plurality of targets 230 and distributed throughout supporting layer 220 are a plurality of targets 240 . As explained previously in this disclosure, it is sometimes desirable to determine the depth of a target 230 or 240 for diagnostic or other purposes.
- ball-shaped lens 150refracts a set of light rays 113 and 117 from shallow tissue illumination fibers 114 .
- ball-shaped lens 150modifies detection region 111 of collection fiber 110 so that detection region 111 converges, rather than continually diverges.
- the geometry of collection fiber 110 , illumination fibers 114 and ball-shaped lens 150determines a refraction angle 118 of light rays 113 and a refraction angle 119 of light rays 117 .
- refraction angles 118 and 119are shown where light rays 113 and 117 enter ball-shaped lens 150 . Additional refraction occurs where light rays 113 and 117 exit ball-shaped lens 150 .
- the greater the spacing between collection fiber 110 and shallow tissue illumination fibers 114the greater the refraction angle.
- the geometry of fiber-optic probe 100can be configured so that light rays 113 and 117 intersect detection region 111 in an intersection region 155 that is located proximal to top layer 210 . Light rays 113 and 117 then diverge away from detection region 111 in the area just below top layer 210 . In this configuration, light rays 113 and 117 are heavily concentrated within top layer 210 . In addition, detection region 111 is focused so that light rays 113 and 117 do not significantly intersect detection region 111 in supporting layer 220 .
- a target 230 located within top layer 210 and detection region 111will be illuminated with a greater number of light rays 113 and 117 than a target 240 located in supporting layer 220 and detection region 111 .
- Targets 230 in top layer 210 and detection region 111will therefore produce a greater number of remitted light rays 116 as compared to targets 240 in supporting layer 220 and detection region 111 .
- FIG. 5depicts an arrangement similar to that of FIG. 4 , but shows medium tissue illumination fibers 112 instead of shallow tissue illumination fibers 114 .
- deep tissue fibers 120 , 122 , 124 , 130 , 132 and 134are omitted only for the sake of clarity.
- Embodiments of this disclosurecan comprise a fiber-optic probe 100 with any combination of shallow tissue illumination fibers 114 , medium tissue illumination fibers 112 , or deep tissue illumination fibers (as well as their associated collection fibers).
- FIG. 5depicts an arrangement similar to that of FIG. 4 , but shows medium tissue illumination fibers 112 instead of shallow tissue illumination fibers 114 .
- deep tissue fibers 120 , 122 , 124 , 130 , 132 and 134are omitted only for the sake of clarity.
- Embodiments of this disclosurecan comprise a fiber-optic probe 100 with any combination of shallow tissue illumination fibers 114 , medium tissue illumination fibers 112 , or deep tissue illumination fibers (as
- medium tissue illumination fibers 112emit a set of light rays 213 and 217 that are refracted by ball-shaped lens 150 such that light rays 213 and 217 intersect in a medium depth region 255 that is just below top layer 210 .
- a plurality of targets 250 located in medium depth region 255will receive the highest number of light rays 213 and 217 and will therefore provide the strongest remission signal.
- embodiments of this disclosuremay comprise any combination of shallow, medium and deep tissue illumination and collection fibers.
- the wavelength of the illumination lightmay be sequentially altered depending on the response properties of the targets of interest.
- the shallow, medium and deep tissue fiberscan be connected to separate channels that are independently displayed. In such embodiments, the separate channels can be compared to create a spectrographic profile of the specimen.
- the ability to determine the specific depth region of a targetprovides an important additional component of information. For example, the ability to determine whether a target producing an optical signature is in the epithelial and/or the stromal layer should improve the ability to evaluate noninvasively the progression of precancerous changes.
- embodiments of the present disclosuremay be connected or coupled to a spectroscopic system (not shown) which is operated by a software program.
- a spectroscopic system(not shown) which is operated by a software program.
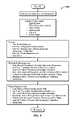
- FIG. 6a logic flowchart of one embodiment of such a software program 600 is displayed.
- FIG. 7A logic flowchart of the analysis of data obtained during operation of the spectroscopic system is shown in FIG. 7 .
- the software described in this disclosurecan be embodied on any computer-readable media known in the art, including but not limited to, hard drives, flash devices, optical drives, etc.
- Fast EEM (excitation emission matrix) softwareis programmed with Labview software, which controls components of a spectroscopic system comprising light sources, a fiber translation system, a filter wheel, a camera and a powermeter.
- Labview softwarecontrols components of a spectroscopic system comprising light sources, a fiber translation system, a filter wheel, a camera and a powermeter.
- Fast EEM softwaresupports a script engine. The measurement procedure is programmed by script engine.
Landscapes
- Health & Medical Sciences (AREA)
- Life Sciences & Earth Sciences (AREA)
- Physics & Mathematics (AREA)
- General Health & Medical Sciences (AREA)
- Pathology (AREA)
- Biomedical Technology (AREA)
- Engineering & Computer Science (AREA)
- Heart & Thoracic Surgery (AREA)
- Medical Informatics (AREA)
- Molecular Biology (AREA)
- Surgery (AREA)
- Animal Behavior & Ethology (AREA)
- Biophysics (AREA)
- Public Health (AREA)
- Veterinary Medicine (AREA)
- Dermatology (AREA)
- Spectroscopy & Molecular Physics (AREA)
- Audiology, Speech & Language Pathology (AREA)
- Dentistry (AREA)
- Oral & Maxillofacial Surgery (AREA)
- Chemical & Material Sciences (AREA)
- Analytical Chemistry (AREA)
- Biochemistry (AREA)
- General Physics & Mathematics (AREA)
- Immunology (AREA)
- Investigating Or Analysing Materials By Optical Means (AREA)
- Investigating, Analyzing Materials By Fluorescence Or Luminescence (AREA)
Abstract
Description
- This vi finds the status of 4832 and sets the initial values.
- Step 1: check system (system status and system information) and active channels.
- Step 2: find detector models, calibration date, serial numbers, and attenuator serial numbers.
- Step 3: channel initialize
- Step 4: set initial value
- Responsivity data=>F=calibration Mode, T=user responsivity
- Sample precision=>F=12 bit, T=15 bit
- Step 5: confirm the setting of step 4 by reading the status of power meter.
- Return error code: 5024
- This vi sets the zero state, wavelength, channel range, attenuator, 5 Hz filter and zero state. Only the variables selected by switch cluster are changed, but all state variables are read and checked with global variables. Whenever auto range is selected, which means a channel range value is 7, the power meter's channel range is automatically changed by environment's light, so the returned channel range is different from input value.
- This vi must be called after 4832-C init lowlevel.vi and 4832-C Prepare.vi for the first time.
- Step 1: (If each setting switch is true) set initial values (zero mode, wavelength, channel range, attenuator, 5 Hz filter) if the power meter returns false, setting switches also indicate false.
- Step 2: (If zero meter switch is true) set zero reference (1. 5 Hz on, 2. zero disable, 3. measure watts for zero reference value, 4. set zero when set zero global value is true 5. set 5 Hz filter set as filter set global value)
- Step 3: (Always execution) check the read value from power meter and input value. Read the zero reference.
- Input value: setting switch (Boolean cluster=1. zerostate, 2. wavelength, 3. channel range, 4. attenuator, 5.5 Hz filter),
- Each setting value (Zero state: Boolean array, wavelength: I16 array, Attenuator: Boolean array, 5 Hz filter: Boolean array, Channel Range: I16 array (0, 1, 2, 3, 4, 5, 6, 7 means autorange)
- Power setting switch (Boolean)
- Return value: status value arrays (same format with input variables & auto range status), zero reference value (DBL), error code (5025)
- This vi resets the power meter as default values which values were defined by the manufacturing company. This vi must be called at the first time, unless the power meter has a problem.
- Most of the reset values are executed for the interface of between the computer and the powermeter.
- Return value: error code (5023)
- This vi measures the 2 channel data (Watts units) of power meter simultaneously and continually during measuring time, every measuring interval time.
- Input value: measuring time [seconds] (DBL), measuring interval time [msec](DBL)
- Output value: measured data array (DBL), error code (5021) it returns error code, if executed measuring time is more than input measuring time.
- This vi measures the 1 channel data (Watts units) of power meter continually during measuring time, every measuring interval time.
- Input value: measuring time [seconds] (DBL), measuring interval time [msec](DBL)
- Output value: measured Watts value data array (DBL), error code (5021). it returns error code, if executed measuring time is more than input measuring time.
- This vi resets and initializes the power meter with global values. This vi calls initialize low level.vi 4832-c prepare.vi and 4832-c setup.vi
- This vi is based on the program supported from the manufacturing company. This vi can set all environments value and measure all channels data. When this vi is called, it reads and displays the current status of power meter.
- This vi supports the hardware reset, environment values set, zero meter set, displaying global variables or changing global variables.
- Data Cluster 1: base address, channel units, sample precision, and user responsivity.
- Data Cluster 2: zero state, wavelength, channel range, attenuator and 5 Hz filter
- Step 1: Read the global variables and display the front panel.
- Step 2: If reset is true,
- 1. Save front panel's Data cluster 1 and 2 to global variables.
- 2. Call low initialize sub vi, 4832-C prepare.vi and 4832-C setup.vi
- Step 3: If operate is true
- Call 4832-C operate.c vi
- Step 4: If initializes is true
- 1. Save front panel's Data cluster 1 and 2 to global variables.
- 2. Call 4832-C prepare.vi and 4832-C setup.vi
- Step 5. If zero meter is true
- 1. Save only front panel's Data cluster 2 to global variables
- 2. Call 4832-C setup.vi for setting zero meter.
- Zero Meter will also apply 5 Hz input zero mode input to device
- Step 6: If Ok is true
- 1. Save only front panel's Data cluster 2 to global variables
- 2. Call 4832-C setup.vi
- Step 7: If Display global is true
- Replace the front panel's variables as global variables
- Step 8: If Exit is true
- This program is finished.
- This vi sets an image, shutter, and exposure time when each setting switch turns on.
- Input: Bin setting switch (Boolean), HorizontalBin (I16), Vertical Bin(I16),
- Start Column(I16), EndColumn(I16), Start Row(I16), EndRow(I16)
- Shutter setting switch (Boolean), Openshuttersignal(I16, low=0, high=1), shutterMode (I16, auto=0, open=1, close=2)
- Exposure time setting switch (Boolean), Exposure time (I16)
- Output: Exposure Time Used (SGL)
- This vi calculates the camera data acquisition time.
- Total time=shutter transition time×2+Exposure time+Vertical speed×256+Horizontal speed×measuring pixels/bin
- Input: Exposure time (SGL)
- Output: total time (SGL)
- This vi initializes the translation stage by calling the initialize 6200 Device.vi and Home Translation Stage.vi
- This vi initializes the translation stage and sets environments variables with default variables.
- This vi sets the communication between pc and translation, sets 1 axis motion, and enables hardware limit, absolute move position coordination, 25000setp/revolution. This program sets Configure Homming.vi with default values and sets the velocity, accelerates and decelerates with default values.
- This vi makes the translation stage move to home position.
- This program calls Configure Homming.vi
- This vi makes the translation stage move to new position units absolute step.
- It calculates the real steps from Set distance.vi supported by the manufacturing company, and commands the go by calling Initiate Motion.vi supported by the manufacturing company.
- Input: newposition (DBL)
- This vi finds the real translation stage position of the selected position ID by reading the table which was read form ini file and save the value to location Scaled, global variable.
- This value will be the input value of Move Translation Stage.vi without converting the dimension.
- Input: Selected Position (String)
- Output: Location (DBL)
- This vi can move the translation stage to the selected position when set translation switch turns on.
- This vi can move the translation stage to any position, change translation stage moving speed and display the real translation stage position. This is programmed for finding the real translation stage.
- Translation stage is moved by step when the forward/backward switch turns on and is moved by 1/10 of step when the forward/backward fine switch turns on. This program can change the speed and can save to global variable when set store speed turns on. This program also can execute the initialize by calling initialize 6200 device.vi and move to home position by calling Home Translation Stage.vi.
- This vi returns the translation stage position global variable in table format, which is used in Operate Translation Stage.vi
- This vi calls allgoblavaluesave.vi every input second until the stop variable turns on.
- This vi makes a filename using the input filename and serial number from 0.
- Input: save interval time (DBL) [sec], Stop (Boolean), save path (string), filename (string),
- This vi saves all global variables in txt file format, when it is called. This program should be called from main program
- This vi opens or creates a new text file with the input file name. Because of allocating some memory, it takes much longer time when the first few times of running program.
- Input: the save filename (string)
- This vi executes the matlab function command and returns the matlab function result. When this program is called, the matlab program is executed automatically.
- Input: matlab command (string)
- Output: return of matlab command (I32)
- Script engine generates the data file at the specific directory as like these. In the below, some variables which are used at script engine for data saving are explained. Software changes include from: FastEEM v0.4.1 (used for FastEEM 3) to: FastEEM4 v1.0 (used for FastEEM 4).
Following are the modifications made to FastEEM v0.4.1 to generate FastEEM4 v1.0. The software had to be changed because FastEEM v0.4. 1 has four 12 position filter wheels and FastEEM4 v1.0 has three 10 position filter wheels.
Fast EEM.ini
Removed:
Wheel 4=3
Power 4=ON
Speed 4=3
Folder: Main
VI: Readini.vi
Lambda 12 cont 2—changed 4 to 3
Lambda 12 cont 3—changed 4 to 3
Lambda 12 cont 4—changed 4 to 3
Filter selection: changed 5 to 4
Folder: Filters
VI: Lambda 12 change Spx Wheel.vi\
Changed from:
0, 0, 0, 1
To:
0, 0, 1, 0
Removed the last row with the zero to get rid of the fourth wheel assignment.
Folder: Filters
VI: Lambda 12 initialize Serial port.vi
Changed from:
131, 147, 163, 179
To:
131, 147, 163
Folder: Filters
VI: Lambda12 serial comm (in series).vi
Removed:
Wheel 4 commands
Folder: Filters
VI: Lambda 12 change wavelength.vi
Changed from:
1, 1, 1, 1
To:
1, 1, 1, 0
Removed the last row with the zero to get rid of the fourth wheel assignment.
Folder: Filter
VI: Lambda 12 get status.vi
Send request to controller: 1. [0.3]
Removed:
Wheel 4 commands
Get response 2. [0.3]
Deleted case with wheel 4 commands
Changed the number next to the case structure from 4 to 3.
Folder: Filters
VI: Lambda 12 setup.vi:
Outer case [0[0.1]]—initialize
Inner case [2[0.2]]
Changed loop value from 4 to 3
Removed the fourth case with the wheel 4 controls.
Outer case [1. [0.1]]—change globals and operate
Inner case [8. [0.10]]—exit and execute global
Changed from:
1, 1, 1, 1
To:
1, 1, 1, 0
Removed the last row with the zero to get rid of the fourth wheel assignment
Folder: Filters
VI: Lambda 12 change Spx wheel vi
- Script engine generates the data file at the specific directory as like these. In the below, some variables which are used at script engine for data saving are explained. Software changes include from: FastEEM v0.4.1 (used for FastEEM 3) to: FastEEM4 v1.0 (used for FastEEM 4).
Claims (22)
Priority Applications (1)
| Application Number | Priority Date | Filing Date | Title |
|---|---|---|---|
| US11/428,806US7499161B2 (en) | 2005-07-05 | 2006-07-05 | Depth-resolved spectroscopy method and apparatus |
Applications Claiming Priority (2)
| Application Number | Priority Date | Filing Date | Title |
|---|---|---|---|
| US69665505P | 2005-07-05 | 2005-07-05 | |
| US11/428,806US7499161B2 (en) | 2005-07-05 | 2006-07-05 | Depth-resolved spectroscopy method and apparatus |
Publications (2)
| Publication Number | Publication Date |
|---|---|
| US20070038120A1 US20070038120A1 (en) | 2007-02-15 |
| US7499161B2true US7499161B2 (en) | 2009-03-03 |
Family
ID=37605239
Family Applications (1)
| Application Number | Title | Priority Date | Filing Date |
|---|---|---|---|
| US11/428,806Expired - Fee RelatedUS7499161B2 (en) | 2005-07-05 | 2006-07-05 | Depth-resolved spectroscopy method and apparatus |
Country Status (3)
| Country | Link |
|---|---|
| US (1) | US7499161B2 (en) |
| EP (1) | EP1903930A2 (en) |
| WO (1) | WO2007006039A2 (en) |
Cited By (3)
| Publication number | Priority date | Publication date | Assignee | Title |
|---|---|---|---|---|
| US20120236303A1 (en)* | 2009-12-03 | 2012-09-20 | Marple Eric T | Filtered fiber optic probe |
| US9042967B2 (en) | 2008-05-20 | 2015-05-26 | University Health Network | Device and method for wound imaging and monitoring |
| US10438356B2 (en) | 2014-07-24 | 2019-10-08 | University Health Network | Collection and analysis of data for diagnostic purposes |
Families Citing this family (16)
| Publication number | Priority date | Publication date | Assignee | Title |
|---|---|---|---|---|
| WO2008115043A1 (en)* | 2007-03-22 | 2008-09-25 | Diaz Sanchez Joel Gerardo | Combination of a standard vaginal speculum and an excitation system for broad-spectrum variable fluorescence, intended for the diagnosis of diseases of the female genital tract |
| US20090099460A1 (en)* | 2007-10-16 | 2009-04-16 | Remicalm Llc | Method and device for the optical spectroscopic identification of cervical cancer |
| CA2749953A1 (en)* | 2009-01-16 | 2010-07-22 | The Brigham And Women's Hospital, Inc. | System and method for characterization of oral, systemic and mucosal tissue utilizing raman spectroscopy |
| FR2949560A1 (en)* | 2009-09-02 | 2011-03-04 | Centre Nat Rech Scient | WAVEGUIDE SPECTROSCOPY SYSTEM FOR ANALYSIS OF PARTICLES IN A MEDIUM |
| US9451885B2 (en)* | 2010-12-22 | 2016-09-27 | University of Pittsburgh—of the Commonwealth System of Higher Education | Depth-selective fiber-optic probe |
| US20130142381A1 (en)* | 2011-12-02 | 2013-06-06 | Field Tested Software Llc | Real time spectroscopy processing and analysis system |
| CN103841875A (en)* | 2012-02-10 | 2014-06-04 | 奥林巴斯医疗株式会社 | Bio-optical measurement device and measurement probe |
| US11331038B2 (en) | 2012-03-08 | 2022-05-17 | Koninklijke Philips N.V. | Apparatus for determining a property of a tissue |
| CN105723195B (en)* | 2013-08-07 | 2019-09-03 | 撒拉弗生物科学有限责任公司 | Hand-held detection instrument and detection method based on micro-Raman |
| CN103900471A (en)* | 2014-03-20 | 2014-07-02 | 哈尔滨工业大学 | Micro-measuring-force collimation sensor based on double-incidence optical fiber ball-sharing coupling |
| CN109069007A (en)* | 2016-03-08 | 2018-12-21 | 泽博拉医疗科技公司 | Non-invasive detection of skin diseases |
| EP3614915A4 (en) | 2017-04-28 | 2021-01-20 | Enspectra Health, Inc. | Systems and methods for imaging and measurement of sarcomeres |
| WO2019213594A1 (en)* | 2018-05-03 | 2019-11-07 | The General Hospital Corporation | Systems, methods, and media for capsule-based multimode endoscopy |
| CN113473900B (en) | 2018-11-13 | 2024-09-24 | 恩斯派克特拉健康公司 | Method and system for generating depth profiles |
| US11698304B2 (en) | 2019-02-15 | 2023-07-11 | Wayne State University | Apparatuses, systems, and methods for detecting materials based on Raman spectroscopy |
| US20240426659A1 (en)* | 2021-11-11 | 2024-12-26 | Agency For Science, Technology And Research | Optical detection device, system, and method for omnidirectional photodetection |
Citations (34)
| Publication number | Priority date | Publication date | Assignee | Title |
|---|---|---|---|---|
| US5201318A (en) | 1989-04-24 | 1993-04-13 | Rava Richard P | Contour mapping of spectral diagnostics |
| US5205291A (en) | 1988-11-08 | 1993-04-27 | Health Research, Inc. | In vivo fluorescence photometer |
| US5419323A (en) | 1988-12-21 | 1995-05-30 | Massachusetts Institute Of Technology | Method for laser induced fluorescence of tissue |
| US5421337A (en) | 1989-04-14 | 1995-06-06 | Massachusetts Institute Of Technology | Spectral diagnosis of diseased tissue |
| US5421339A (en) | 1993-05-12 | 1995-06-06 | Board Of Regents, The University Of Texas System | Diagnosis of dysplasia using laser induced fluoroescence |
| US5612540A (en) | 1995-03-31 | 1997-03-18 | Board Of Regents, The University Of Texas Systems | Optical method for the detection of cervical neoplasias using fluorescence spectroscopy |
| US5697373A (en) | 1995-03-14 | 1997-12-16 | Board Of Regents, The University Of Texas System | Optical method and apparatus for the diagnosis of cervical precancers using raman and fluorescence spectroscopies |
| US5699795A (en) | 1995-03-31 | 1997-12-23 | Board Of Regents, The University Of Texas System | Optical probe for the detection of cervical neoplasia using fluorescence spectroscopy and apparatus incorporating same |
| US5842995A (en) | 1996-06-28 | 1998-12-01 | Board Of Regents, The Univerisity Of Texas System | Spectroscopic probe for in vivo measurement of raman signals |
| US5920399A (en) | 1997-03-18 | 1999-07-06 | Sandia Corporation | Multispectral imaging method and apparatus |
| US5929985A (en) | 1997-03-18 | 1999-07-27 | Sandia Corporation | Multispectral imaging probe |
| US5953477A (en)* | 1995-11-20 | 1999-09-14 | Visionex, Inc. | Method and apparatus for improved fiber optic light management |
| US5991653A (en) | 1995-03-14 | 1999-11-23 | Board Of Regents, The University Of Texas System | Near-infrared raman spectroscopy for in vitro and in vivo detection of cervical precancers |
| WO2000042906A2 (en) | 1999-01-22 | 2000-07-27 | Massachusetts Institute Of Technology | Fiber optic needle probes for optical coherence tomography imaging |
| US6135965A (en) | 1996-12-02 | 2000-10-24 | Board Of Regents, The University Of Texas System | Spectroscopic detection of cervical pre-cancer using radial basis function networks |
| US6174424B1 (en)* | 1995-11-20 | 2001-01-16 | Cirrex Corp. | Couplers for optical fibers |
| US6187289B1 (en) | 1997-10-20 | 2001-02-13 | Board Of Regents, The University Of Texas System | Acetic acid as a contrast in reflectance confocal imaging of tissue |
| US6258576B1 (en) | 1996-06-19 | 2001-07-10 | Board Of Regents, The University Of Texas System | Diagnostic method and apparatus for cervical squamous intraepithelial lesions in vitro and in vivo using fluorescence spectroscopy |
| US20010055462A1 (en) | 2000-06-19 | 2001-12-27 | Seibel Eric J. | Medical imaging, diagnosis, and therapy using a scanning single optical fiber system |
| US6370422B1 (en) | 1998-03-19 | 2002-04-09 | Board Of Regents, The University Of Texas System | Fiber-optic confocal imaging apparatus and methods of use |
| US20020065468A1 (en) | 2000-03-28 | 2002-05-30 | Urs Utzinger | Methods and apparatus for diagnostic multispectral digital imaging |
| US20020127632A1 (en) | 2000-03-28 | 2002-09-12 | Richards-Kortum Rebecca R. | Enhancing contrast in biological imaging |
| US20020135752A1 (en) | 2000-03-28 | 2002-09-26 | Konstantin Sokolov | Methods and apparatus for polarized reflectance spectroscopy |
| US6571118B1 (en) | 1998-05-04 | 2003-05-27 | Board Of Regents, The University Of Texas System | Combined fluorescence and reflectance spectroscopy |
| US20030103262A1 (en) | 2001-09-07 | 2003-06-05 | Board Of Regents, The University Of Texas System | Multimodal miniature microscope |
| US6608671B2 (en)* | 1998-07-17 | 2003-08-19 | Vertex Pharmaceuticals (San Diego) Llc | Detector and screening device for ion channels |
| US20030191398A1 (en) | 2002-04-05 | 2003-10-09 | Massachusetts Institute Of Technology | Systems and methods for spectroscopy of biological tissue |
| US20040023415A1 (en) | 2002-03-05 | 2004-02-05 | Konstantin Sokolov | Biospecific contrast agents |
| US6697666B1 (en) | 1999-06-22 | 2004-02-24 | Board Of Regents, The University Of Texas System | Apparatus for the characterization of tissue of epithelial lined viscus |
| US20040064053A1 (en) | 2002-09-30 | 2004-04-01 | Chang Sung K. | Diagnostic fluorescence and reflectance |
| US20040073120A1 (en)* | 2002-04-05 | 2004-04-15 | Massachusetts Institute Of Technology | Systems and methods for spectroscopy of biological tissue |
| US20040162489A1 (en) | 1995-03-14 | 2004-08-19 | Board Of Regents, The University Of Texas System. | Method and apparatus for probabilistically classifying tissue in vitro and in vivo using fluorescence spectroscopy |
| WO2005031291A1 (en) | 2003-09-22 | 2005-04-07 | Wang-Long Zhou | Bifurcated fiber optic probe and system |
| US20050080343A1 (en) | 2002-12-10 | 2005-04-14 | Board Of Regents, The University Of Texas System | Vision enhancement system for improved detection of epithelial neoplasia and other conditions |
Family Cites Families (1)
| Publication number | Priority date | Publication date | Assignee | Title |
|---|---|---|---|---|
| US5974211A (en) | 1997-02-07 | 1999-10-26 | Kaiser Optical Systems | Enhanced collection efficiency fiber-optic probe |
- 2006
- 2006-07-05EPEP06786589Apatent/EP1903930A2/ennot_activeWithdrawn
- 2006-07-05USUS11/428,806patent/US7499161B2/ennot_activeExpired - Fee Related
- 2006-07-05WOPCT/US2006/026481patent/WO2007006039A2/enactiveApplication Filing
Patent Citations (51)
| Publication number | Priority date | Publication date | Assignee | Title |
|---|---|---|---|---|
| US5205291A (en) | 1988-11-08 | 1993-04-27 | Health Research, Inc. | In vivo fluorescence photometer |
| US5562100A (en) | 1988-12-21 | 1996-10-08 | Massachusetts Institute Of Technology | Method for laser induced fluorescence of tissue |
| US5419323A (en) | 1988-12-21 | 1995-05-30 | Massachusetts Institute Of Technology | Method for laser induced fluorescence of tissue |
| US5421337A (en) | 1989-04-14 | 1995-06-06 | Massachusetts Institute Of Technology | Spectral diagnosis of diseased tissue |
| US5345941A (en) | 1989-04-24 | 1994-09-13 | Massachusetts Institute Of Technology | Contour mapping of spectral diagnostics |
| US5201318A (en) | 1989-04-24 | 1993-04-13 | Rava Richard P | Contour mapping of spectral diagnostics |
| US5421339A (en) | 1993-05-12 | 1995-06-06 | Board Of Regents, The University Of Texas System | Diagnosis of dysplasia using laser induced fluoroescence |
| US5623932A (en) | 1993-05-12 | 1997-04-29 | Board Of Regents, The University Of Texas System | Diagnosis of dysplasia using laser induced fluorescence |
| US5991653A (en) | 1995-03-14 | 1999-11-23 | Board Of Regents, The University Of Texas System | Near-infrared raman spectroscopy for in vitro and in vivo detection of cervical precancers |
| US5697373A (en) | 1995-03-14 | 1997-12-16 | Board Of Regents, The University Of Texas System | Optical method and apparatus for the diagnosis of cervical precancers using raman and fluorescence spectroscopies |
| US6095982A (en) | 1995-03-14 | 2000-08-01 | Board Of Regents, The University Of Texas System | Spectroscopic method and apparatus for optically detecting abnormal mammalian epithelial tissue |
| US20040162489A1 (en) | 1995-03-14 | 2004-08-19 | Board Of Regents, The University Of Texas System. | Method and apparatus for probabilistically classifying tissue in vitro and in vivo using fluorescence spectroscopy |
| US5612540A (en) | 1995-03-31 | 1997-03-18 | Board Of Regents, The University Of Texas Systems | Optical method for the detection of cervical neoplasias using fluorescence spectroscopy |
| US5699795A (en) | 1995-03-31 | 1997-12-23 | Board Of Regents, The University Of Texas System | Optical probe for the detection of cervical neoplasia using fluorescence spectroscopy and apparatus incorporating same |
| US6366726B1 (en)* | 1995-11-20 | 2002-04-02 | Cirrex Corp. | Fiber optic probes for indwelling investigations |
| US5953477A (en)* | 1995-11-20 | 1999-09-14 | Visionex, Inc. | Method and apparatus for improved fiber optic light management |
| US6416234B1 (en)* | 1995-11-20 | 2002-07-09 | Cirrex, Corp. | Couplers for optical fibers |
| US6370406B1 (en)* | 1995-11-20 | 2002-04-09 | Cirrex Corp. | Method and apparatus for analyzing a test material by inducing and detecting light-matter interactions |
| US6144791A (en)* | 1995-11-20 | 2000-11-07 | Cirrex Corp. | Beam steering for optical fibers and other related devices |
| US6174424B1 (en)* | 1995-11-20 | 2001-01-16 | Cirrex Corp. | Couplers for optical fibers |
| US6487349B2 (en)* | 1995-11-20 | 2002-11-26 | Cirrex Corp. | Method and apparatus for improved fiber optic light management |
| US6222970B1 (en)* | 1995-11-20 | 2001-04-24 | Cirrex Corp. | Methods and apparatus for filtering an optical fiber |
| US6258576B1 (en) | 1996-06-19 | 2001-07-10 | Board Of Regents, The University Of Texas System | Diagnostic method and apparatus for cervical squamous intraepithelial lesions in vitro and in vivo using fluorescence spectroscopy |
| US5842995A (en) | 1996-06-28 | 1998-12-01 | Board Of Regents, The Univerisity Of Texas System | Spectroscopic probe for in vivo measurement of raman signals |
| US6135965A (en) | 1996-12-02 | 2000-10-24 | Board Of Regents, The University Of Texas System | Spectroscopic detection of cervical pre-cancer using radial basis function networks |
| US5929985A (en) | 1997-03-18 | 1999-07-27 | Sandia Corporation | Multispectral imaging probe |
| US5920399A (en) | 1997-03-18 | 1999-07-06 | Sandia Corporation | Multispectral imaging method and apparatus |
| US6241662B1 (en) | 1997-10-20 | 2001-06-05 | Lifespex, Inc. | Acetic acid as a signal enhancing contrast agent in fluorescence spectroscopy |
| US6187289B1 (en) | 1997-10-20 | 2001-02-13 | Board Of Regents, The University Of Texas System | Acetic acid as a contrast in reflectance confocal imaging of tissue |
| US6370422B1 (en) | 1998-03-19 | 2002-04-09 | Board Of Regents, The University Of Texas System | Fiber-optic confocal imaging apparatus and methods of use |
| US6571118B1 (en) | 1998-05-04 | 2003-05-27 | Board Of Regents, The University Of Texas System | Combined fluorescence and reflectance spectroscopy |
| US7002671B2 (en)* | 1998-07-17 | 2006-02-21 | Aurora Discovery, Inc. | Detector and screening device for ion channels |
| US7142290B2 (en)* | 1998-07-17 | 2006-11-28 | Aurora Discovery, Inc. | Detector and screening device for ion channels |
| US6608671B2 (en)* | 1998-07-17 | 2003-08-19 | Vertex Pharmaceuticals (San Diego) Llc | Detector and screening device for ion channels |
| WO2000042906A2 (en) | 1999-01-22 | 2000-07-27 | Massachusetts Institute Of Technology | Fiber optic needle probes for optical coherence tomography imaging |
| US6697666B1 (en) | 1999-06-22 | 2004-02-24 | Board Of Regents, The University Of Texas System | Apparatus for the characterization of tissue of epithelial lined viscus |
| US6593101B2 (en) | 2000-03-28 | 2003-07-15 | Board Of Regents, The University Of Texas System | Enhancing contrast in biological imaging |
| US20020135752A1 (en) | 2000-03-28 | 2002-09-26 | Konstantin Sokolov | Methods and apparatus for polarized reflectance spectroscopy |
| US6639674B2 (en) | 2000-03-28 | 2003-10-28 | Board Of Regents, The University Of Texas System | Methods and apparatus for polarized reflectance spectroscopy |
| US20020127632A1 (en) | 2000-03-28 | 2002-09-12 | Richards-Kortum Rebecca R. | Enhancing contrast in biological imaging |
| US6766184B2 (en) | 2000-03-28 | 2004-07-20 | Board Of Regents, The University Of Texas System | Methods and apparatus for diagnostic multispectral digital imaging |
| US20020065468A1 (en) | 2000-03-28 | 2002-05-30 | Urs Utzinger | Methods and apparatus for diagnostic multispectral digital imaging |
| US20010055462A1 (en) | 2000-06-19 | 2001-12-27 | Seibel Eric J. | Medical imaging, diagnosis, and therapy using a scanning single optical fiber system |
| US20030103262A1 (en) | 2001-09-07 | 2003-06-05 | Board Of Regents, The University Of Texas System | Multimodal miniature microscope |
| US20060058611A1 (en) | 2001-09-07 | 2006-03-16 | Michael Descour | Multimodal miniature microscope |
| US20040023415A1 (en) | 2002-03-05 | 2004-02-05 | Konstantin Sokolov | Biospecific contrast agents |
| US20030191398A1 (en) | 2002-04-05 | 2003-10-09 | Massachusetts Institute Of Technology | Systems and methods for spectroscopy of biological tissue |
| US20040073120A1 (en)* | 2002-04-05 | 2004-04-15 | Massachusetts Institute Of Technology | Systems and methods for spectroscopy of biological tissue |
| US20040064053A1 (en) | 2002-09-30 | 2004-04-01 | Chang Sung K. | Diagnostic fluorescence and reflectance |
| US20050080343A1 (en) | 2002-12-10 | 2005-04-14 | Board Of Regents, The University Of Texas System | Vision enhancement system for improved detection of epithelial neoplasia and other conditions |
| WO2005031291A1 (en) | 2003-09-22 | 2005-04-07 | Wang-Long Zhou | Bifurcated fiber optic probe and system |
Non-Patent Citations (2)
| Title |
|---|
| International Search Report and Written Opinion mailed Apr. 27, 2007. |
| Schwarz et al., "Ball lens coupled fiber-optic probe for depth-resolved spectroscopy of epithelial tissue," Optics Letters, 30:1159-1161, 2005. |
Cited By (14)
| Publication number | Priority date | Publication date | Assignee | Title |
|---|---|---|---|---|
| US12226186B2 (en) | 2008-05-20 | 2025-02-18 | University Health Network | Devices, methods, and systems with spectral filtering for detecting wound and identifying bacteria based on fluorescence signature |
| US9042967B2 (en) | 2008-05-20 | 2015-05-26 | University Health Network | Device and method for wound imaging and monitoring |
| US11154198B2 (en) | 2008-05-20 | 2021-10-26 | University Health Network | Method and system for imaging and collection of data for diagnostic purposes |
| US11284800B2 (en) | 2008-05-20 | 2022-03-29 | University Health Network | Devices, methods, and systems for fluorescence-based endoscopic imaging and collection of data with optical filters with corresponding discrete spectral bandwidth |
| US11375898B2 (en) | 2008-05-20 | 2022-07-05 | University Health Network | Method and system with spectral filtering and thermal mapping for imaging and collection of data for diagnostic purposes from bacteria |
| US12251191B2 (en) | 2008-05-20 | 2025-03-18 | University Health Network | Diagnostic method and system with optical and temperature sensors for imaging and mapping fluorescence intensities of tissue |
| US8702321B2 (en)* | 2009-12-03 | 2014-04-22 | Eric T. Marple | Filtered fiber optic probe |
| US20120236303A1 (en)* | 2009-12-03 | 2012-09-20 | Marple Eric T | Filtered fiber optic probe |
| US10438356B2 (en) | 2014-07-24 | 2019-10-08 | University Health Network | Collection and analysis of data for diagnostic purposes |
| US11961236B2 (en) | 2014-07-24 | 2024-04-16 | University Health Network | Collection and analysis of data for diagnostic purposes |
| US12169935B2 (en) | 2014-07-24 | 2024-12-17 | University Health Network | Systems, devices, and methods for visualization of tissue and collection and analysis of data regarding same |
| US11954861B2 (en) | 2014-07-24 | 2024-04-09 | University Health Network | Systems, devices, and methods for visualization of tissue and collection and analysis of data regarding same |
| US11676276B2 (en) | 2014-07-24 | 2023-06-13 | University Health Network | Collection and analysis of data for diagnostic purposes |
| US12387335B2 (en) | 2014-07-24 | 2025-08-12 | University Health Network | Systems, devices, and methods for visualization of tissue and collection and analysis of data regarding same |
Also Published As
| Publication number | Publication date |
|---|---|
| WO2007006039A3 (en) | 2007-06-14 |
| US20070038120A1 (en) | 2007-02-15 |
| WO2007006039A2 (en) | 2007-01-11 |
| EP1903930A2 (en) | 2008-04-02 |
Similar Documents
| Publication | Publication Date | Title |
|---|---|---|
| US7499161B2 (en) | Depth-resolved spectroscopy method and apparatus | |
| JP6770109B2 (en) | Omnidirectional visual device | |
| US10314490B2 (en) | Method and device for multi-spectral photonic imaging | |
| US20230363646A1 (en) | System and method for large field of view, single cell analysis | |
| US8780176B2 (en) | Vessel imaging system and method | |
| CN112869691B (en) | Dual-wavelength enhanced Raman endoscopic non-invasive pathological detection device and detection method | |
| US8804115B2 (en) | Systems and methods for performing optical spectroscopy using a self-calibrating fiber optic probe | |
| US10895692B2 (en) | Fiber optic rotary joints and methods of using and manufacturing same | |
| JP2022133448A (en) | Apparatus, device and method for in vivo imaging and diagnosis | |
| CN100557420C (en) | device and method for blood analysis | |
| US7202947B2 (en) | Depth-resolved fluorescence instrument with angled excitation | |
| US20070129615A1 (en) | Apparatus for recognizing abnormal tissue using the detection of early increase in microvascular blood content | |
| JPH11510254A (en) | Optical microprobe and method for spectral analysis of materials | |
| CN101553162A (en) | Obtaining optical tissue properties | |
| CN101606052A (en) | Apparatus and method for acquiring image data from turbid media | |
| US20200390323A1 (en) | Fluorescence or auto-fluorescence trigger or triggers | |
| WO2023088100A1 (en) | Multi-modal imaging apparatus based on raman spectrum and optical coherence tomography | |
| US12366441B2 (en) | Detector or photomultiplier tube (PMT) gain control over time | |
| CN101303315B (en) | Optical fiber common focusing micro spectrum and imaging apparatus of cell analysis | |
| US20250076201A1 (en) | Multispectral In-Vivo Imaging Probe Device for Enhanced Tissue Visualization | |
| EP3408650B1 (en) | Portable optical apparatus for diffuse reflectance spectroscopy | |
| CN208705561U (en) | A kind of mini microscope for Analysis of epidemic disease | |
| Vega et al. | Model and evaluation of face forward illumination for multimodal endoscopic probes | |
| Tumlinson et al. | Miniature endoscope for a combined OCT-LIF system |
Legal Events
| Date | Code | Title | Description |
|---|---|---|---|
| AS | Assignment | Owner name:THE BOARD OF REGENTS OF THE UNIVERSITY OF TEXAS SY Free format text:ASSIGNMENT OF ASSIGNORS INTEREST;ASSIGNORS:RICHARDS-KORTUM, REBECCA;SCHWARZ, RICHARD A;GILLENWATER, ANN M;REEL/FRAME:018413/0558;SIGNING DATES FROM 20061013 TO 20061019 | |
| STCF | Information on status: patent grant | Free format text:PATENTED CASE | |
| CC | Certificate of correction | ||
| AS | Assignment | Owner name:NATIONAL INSTITUTES OF HEALTH (NIH), U.S. DEPT. OF Free format text:CONFIRMATORY LICENSE;ASSIGNOR:UNIVERSITY OF TEXAS, AUSTIN;REEL/FRAME:025014/0737 Effective date:20090410 | |
| REMI | Maintenance fee reminder mailed | ||
| FPAY | Fee payment | Year of fee payment:4 | |
| SULP | Surcharge for late payment | ||
| AS | Assignment | Owner name:NATIONAL INSTITUTES OF HEALTH (NIH), U.S. DEPT. OF Free format text:CONFIRMATORY LICENSE;ASSIGNOR:UNIVERSITY OF TEXAS, AUSTIN;REEL/FRAME:035830/0393 Effective date:20150527 | |
| FPAY | Fee payment | Year of fee payment:8 | |
| FEPP | Fee payment procedure | Free format text:MAINTENANCE FEE REMINDER MAILED (ORIGINAL EVENT CODE: REM.); ENTITY STATUS OF PATENT OWNER: SMALL ENTITY | |
| LAPS | Lapse for failure to pay maintenance fees | Free format text:PATENT EXPIRED FOR FAILURE TO PAY MAINTENANCE FEES (ORIGINAL EVENT CODE: EXP.); ENTITY STATUS OF PATENT OWNER: SMALL ENTITY | |
| STCH | Information on status: patent discontinuation | Free format text:PATENT EXPIRED DUE TO NONPAYMENT OF MAINTENANCE FEES UNDER 37 CFR 1.362 | |
| FP | Lapsed due to failure to pay maintenance fee | Effective date:20210303 |