US7428325B2 - Method and apparatus for automated image analysis of biological specimens - Google Patents
Method and apparatus for automated image analysis of biological specimensDownload PDFInfo
- Publication number
- US7428325B2 US7428325B2US11/685,717US68571707AUS7428325B2US 7428325 B2US7428325 B2US 7428325B2US 68571707 AUS68571707 AUS 68571707AUS 7428325 B2US7428325 B2US 7428325B2
- Authority
- US
- United States
- Prior art keywords
- slide
- value
- image
- interest
- focus
- Prior art date
- Legal status (The legal status is an assumption and is not a legal conclusion. Google has not performed a legal analysis and makes no representation as to the accuracy of the status listed.)
- Expired - Fee Related
Links
Images


Classifications
- G—PHYSICS
- G01—MEASURING; TESTING
- G01N—INVESTIGATING OR ANALYSING MATERIALS BY DETERMINING THEIR CHEMICAL OR PHYSICAL PROPERTIES
- G01N15/00—Investigating characteristics of particles; Investigating permeability, pore-volume or surface-area of porous materials
- G01N15/10—Investigating individual particles
- G01N15/14—Optical investigation techniques, e.g. flow cytometry
- G01N15/1429—Signal processing
- G01N15/1433—Signal processing using image recognition
- G—PHYSICS
- G02—OPTICS
- G02B—OPTICAL ELEMENTS, SYSTEMS OR APPARATUS
- G02B21/00—Microscopes
- G02B21/36—Microscopes arranged for photographic purposes or projection purposes or digital imaging or video purposes including associated control and data processing arrangements
- G02B21/365—Control or image processing arrangements for digital or video microscopes
- G02B21/367—Control or image processing arrangements for digital or video microscopes providing an output produced by processing a plurality of individual source images, e.g. image tiling, montage, composite images, depth sectioning, image comparison
- G—PHYSICS
- G06—COMPUTING OR CALCULATING; COUNTING
- G06T—IMAGE DATA PROCESSING OR GENERATION, IN GENERAL
- G06T5/00—Image enhancement or restoration
- G06T5/20—Image enhancement or restoration using local operators
- G06T5/30—Erosion or dilatation, e.g. thinning
- G—PHYSICS
- G06—COMPUTING OR CALCULATING; COUNTING
- G06T—IMAGE DATA PROCESSING OR GENERATION, IN GENERAL
- G06T5/00—Image enhancement or restoration
- G06T5/70—Denoising; Smoothing
- G—PHYSICS
- G06—COMPUTING OR CALCULATING; COUNTING
- G06T—IMAGE DATA PROCESSING OR GENERATION, IN GENERAL
- G06T5/00—Image enhancement or restoration
- G06T5/77—Retouching; Inpainting; Scratch removal
- G—PHYSICS
- G06—COMPUTING OR CALCULATING; COUNTING
- G06T—IMAGE DATA PROCESSING OR GENERATION, IN GENERAL
- G06T7/00—Image analysis
- G06T7/10—Segmentation; Edge detection
- G06T7/136—Segmentation; Edge detection involving thresholding
- G—PHYSICS
- G06—COMPUTING OR CALCULATING; COUNTING
- G06V—IMAGE OR VIDEO RECOGNITION OR UNDERSTANDING
- G06V10/00—Arrangements for image or video recognition or understanding
- G06V10/10—Image acquisition
- G—PHYSICS
- G06—COMPUTING OR CALCULATING; COUNTING
- G06V—IMAGE OR VIDEO RECOGNITION OR UNDERSTANDING
- G06V10/00—Arrangements for image or video recognition or understanding
- G06V10/20—Image preprocessing
- G06V10/25—Determination of region of interest [ROI] or a volume of interest [VOI]
- G—PHYSICS
- G06—COMPUTING OR CALCULATING; COUNTING
- G06V—IMAGE OR VIDEO RECOGNITION OR UNDERSTANDING
- G06V10/00—Arrangements for image or video recognition or understanding
- G06V10/20—Image preprocessing
- G06V10/26—Segmentation of patterns in the image field; Cutting or merging of image elements to establish the pattern region, e.g. clustering-based techniques; Detection of occlusion
- G06V10/267—Segmentation of patterns in the image field; Cutting or merging of image elements to establish the pattern region, e.g. clustering-based techniques; Detection of occlusion by performing operations on regions, e.g. growing, shrinking or watersheds
- G—PHYSICS
- G06—COMPUTING OR CALCULATING; COUNTING
- G06V—IMAGE OR VIDEO RECOGNITION OR UNDERSTANDING
- G06V10/00—Arrangements for image or video recognition or understanding
- G06V10/40—Extraction of image or video features
- G06V10/44—Local feature extraction by analysis of parts of the pattern, e.g. by detecting edges, contours, loops, corners, strokes or intersections; Connectivity analysis, e.g. of connected components
- G06V10/443—Local feature extraction by analysis of parts of the pattern, e.g. by detecting edges, contours, loops, corners, strokes or intersections; Connectivity analysis, e.g. of connected components by matching or filtering
- G—PHYSICS
- G06—COMPUTING OR CALCULATING; COUNTING
- G06V—IMAGE OR VIDEO RECOGNITION OR UNDERSTANDING
- G06V10/00—Arrangements for image or video recognition or understanding
- G06V10/40—Extraction of image or video features
- G06V10/56—Extraction of image or video features relating to colour
- G—PHYSICS
- G06—COMPUTING OR CALCULATING; COUNTING
- G06V—IMAGE OR VIDEO RECOGNITION OR UNDERSTANDING
- G06V20/00—Scenes; Scene-specific elements
- G06V20/60—Type of objects
- G06V20/69—Microscopic objects, e.g. biological cells or cellular parts
- G—PHYSICS
- G06—COMPUTING OR CALCULATING; COUNTING
- G06V—IMAGE OR VIDEO RECOGNITION OR UNDERSTANDING
- G06V20/00—Scenes; Scene-specific elements
- G06V20/60—Type of objects
- G06V20/69—Microscopic objects, e.g. biological cells or cellular parts
- G06V20/693—Acquisition
- G—PHYSICS
- G06—COMPUTING OR CALCULATING; COUNTING
- G06T—IMAGE DATA PROCESSING OR GENERATION, IN GENERAL
- G06T2207/00—Indexing scheme for image analysis or image enhancement
- G06T2207/10—Image acquisition modality
- G06T2207/10024—Color image
- G—PHYSICS
- G06—COMPUTING OR CALCULATING; COUNTING
- G06T—IMAGE DATA PROCESSING OR GENERATION, IN GENERAL
- G06T2207/00—Indexing scheme for image analysis or image enhancement
- G06T2207/10—Image acquisition modality
- G06T2207/10056—Microscopic image
- G—PHYSICS
- G06—COMPUTING OR CALCULATING; COUNTING
- G06T—IMAGE DATA PROCESSING OR GENERATION, IN GENERAL
- G06T2207/00—Indexing scheme for image analysis or image enhancement
- G06T2207/20—Special algorithmic details
- G06T2207/20004—Adaptive image processing
- G06T2207/20012—Locally adaptive
- G—PHYSICS
- G06—COMPUTING OR CALCULATING; COUNTING
- G06T—IMAGE DATA PROCESSING OR GENERATION, IN GENERAL
- G06T2207/00—Indexing scheme for image analysis or image enhancement
- G06T2207/20—Special algorithmic details
- G06T2207/20016—Hierarchical, coarse-to-fine, multiscale or multiresolution image processing; Pyramid transform
- G—PHYSICS
- G06—COMPUTING OR CALCULATING; COUNTING
- G06T—IMAGE DATA PROCESSING OR GENERATION, IN GENERAL
- G06T2207/00—Indexing scheme for image analysis or image enhancement
- G06T2207/30—Subject of image; Context of image processing
- G06T2207/30004—Biomedical image processing
- G06T2207/30024—Cell structures in vitro; Tissue sections in vitro
Definitions
- the inventionrelates generally to light microscopy and, more particularly, to automated light microscopic methods and an apparatus for detection of objects in a sample.
- a biological specimensuch as bone marrow, lymph nodes, peripheral blood, cerebrospinal fluid, urine, effusions, fine needle aspirates, peripheral blood scrapings or other materials are prepared by staining the specimen to identify cells of interest.
- a specific probewhich can be a monoclonal antibody, a polyclonal antiserum, or a nucleic acid which is reactive with a component of the cells of interest, such as tumor cells.
- the reactionmay be detected using an enzymatic reaction, such as alkaline phosphatase or glucose oxidase or peroxidase to convert a soluble colorless substrate to a colored insoluble precipitate, or by directly conjugating a dye or a fluorescent molecule to the probe.
- an enzymatic reactionsuch as alkaline phosphatase or glucose oxidase or peroxidase to convert a soluble colorless substrate to a colored insoluble precipitate, or by directly conjugating a dye or a fluorescent molecule to the probe.
- Examination of biological specimens in the pasthas been performed manually by either a lab technician or a pathologist.
- a slide prepared with a biological specimenis viewed at a low magnification under a microscope to visually locate candidate cells or objects of interest. Those areas of the slide where cells of interest are located are then viewed at a higher magnification to confirm the objects or cells, such as tumor or cancer cells.
- the manual methodis time consuming and prone to error including missing areas
- One known interactive systemincludes a single high power microscope objective for scanning a rack of slides, portions of which have been previously identified for assay by an operator.
- the operatorfirst scans each slide at a low magnification similar to the manual method and notes the points of interest on the slide for later analysis.
- the operatorthen stores the address of the noted location and the associated function in a data file.
- the slideis then positioned in an automated analysis apparatus which acquires images of the slide at the marked points and performs an image analysis.
- a problem with the foregoing automated systemis the continued need for operator input to initially locate cell objects for analysis. Such continued dependence on manual input can lead to errors including cells or objects of interest being missed. Such errors can be critical especially in assays for so-called rare events, e.g., finding one tumor cell in a cell population of one million normal cells. Additionally, manual methods can be extremely time consuming and can require a high degree of training to identify and/or quantify cells. This is not only true for tumor cell identification and detection, but also for other applications ranging from neutrophil alkaline phosphatase assays, reticulocyte counting and maturation assessment, and others. The associated manual labor leads to a high cost for these procedures in addition to the potential errors that can arise from long, tedious manual examinations. A need exists, therefore, for an improved automated cell analysis system which can quickly and accurately scan large amounts of biological material on a slide. Accordingly, the present invention provides a method and apparatus for automated cell analysis which eliminates the need for operator input to locate cell objects for analysis.
- a slide prepared with a biological specimen and reagentis placed in a slide carrier which preferably holds four slides.
- the slide carriersare loaded into an input hopper of the automated system.
- the operatormay then enter data identifying the size, shape and location of a scan area on each slide, or, preferably, the system automatically locates a scan area for each slide during slide processing.
- An operatorthen activates the system for slide processing.
- the processing parameters of the slidemay be identified by a bar code present on the slide or slide carrier.
- a slide carrieris positioned on an X-Y stage, the entire slide is rapidly scanned at a low magnification, typically 10 ⁇ .
- a low magnification imageis acquired and processed to detect candidate objects of interest.
- color, size and shapeare used to identify objects of interest.
- the location of each candidate object of interestis stored.
- the optical systemis adjusted to a high magnification such as 40 ⁇ or 60 ⁇ , and the X-Y stage is positioned to the stored locations for the candidate objects of interest on each slide in the carrier.
- a high magnification imageis acquired for each candidate object of interest and a series of image processing steps are performed to confirm the analysis which was performed at low magnification.
- a high magnification imageis stored for each confirmed object of interest.
- a mosaic comprised of the candidate objects of interest for a slidemay be generated and stored.
- the pathologist or cytotechnologistmay view the mosaic or may also directly view the slide at the location of an object of interest in the mosaic for further evaluation.
- the mosaicmay be stored on magnetic media for future reference or may be transmitted to a remote site for review and/or storage. The entire process involved in examining a single slide takes on the order of 2-15 minutes depending on scan area size and the number of detected candidate objects of interest.
- the present inventionhas utility in the field of oncology for the early detection of minimal residual disease (“micrometastases”).
- Other useful applicationsinclude prenatal diagnosis of fetal cells in maternal blood and in the field of infectious diseases to identify pathogens and viral loads, alkaline phosphatase assessments, reticulocyte counting, and others.
- the processing of images acquired in the automated scanning of the present inventionpreferably includes the steps of transforming the image to a different color space; filtering the transformed image with a low pass filter; dynamically thresholding the pixels of the filtered image to suppress background material; performing a morphological function to remove artifacts from the thresholded image; analyzing the thresholded image to determine the presence of one or more regions of connected pixels having the same or similar color; and categorizing every region having a size greater than a minimum size as a candidate object of interest.
- the scan areais automatically determined by scanning the slide; acquiring an image at each slide position; analyzing texture information of each image to detect the edges of the specimen; and storing the locations corresponding to the detected edges to define the scan area.
- automated focusing of the optical systemis achieved by initially determining a focal plane from an array of points or locations in the scan area.
- the derived focal planeenables subsequent rapid automatic focusing in the low power scanning operation.
- the focal planeis determined by determining proper focal positions across an array of locations and performing an analysis such as a least squares fit of the array of focal positions to yield a focal plane across the array.
- a focal position at each locationis determined by incrementing the position of a Z stage for a fixed number of coarse and fine iterations.
- an imageis acquired and a pixel variance or other optical parameter about a pixel mean for the acquired image is calculated to form a set of variance data.
- a least squares fitis performed on the variance data according to a known function. The peak value of the least squares fit curve is selected as an estimate of the best focal position.
- another focal position method for high magnificationlocates a region of interest centered about a candidate object of interest within a slide which was located during an analysis of the low magnification images.
- the region of interestis preferably n columns wide, where n is a power of 2.
- the pixels of this regionare then processed using a Fast Fourier Transform to generate a spectra of component frequencies and corresponding complex magnitude for each frequency component. Magnitude of the frequency components which range from 25% to 75% of the maximum frequency component are squared and summed to obtain the total power for the region of interest. This process is repeated for other Z positions and the Z position corresponding to the maximum total power for the region of interest is selected as the best focal position.
- This processis preferably used to select a Z position for regions of interest for slides containing preferably, the complex neutrophils stained with Fast Red to identify alkaline phosphatase in cell cytoplasm and counterstained with hematoxylin to identify the nucleus of the neutrophil cell.
- This focal methodmay be used with other stains and types of biological specimens, as well.
- a method and apparatus for automated slide handlingis provided.
- a slideis mounted onto a slide carrier with a number of other slides side-by-side.
- the slide carrieris positioned in an input feeder with other slide carriers to facilitate automatic analysis of a batch of slides.
- the slide carrieris loaded onto the X-Y stage of the optical system for the analysis of the slides thereon.
- the first slide carrieris unloaded into an output feeder after automatic image analysis and the next carrier is automatically loaded.
- the apparatusincludes a computer having at least one system processor with image processing capability, a computer monitor, an input device, a power supply and a microscope subsystem.
- the microscope subsystemincludes an optical sensing array for acquiring images.
- a two dimensional motion stagefor sample movement and for focus adjustment, and input and output mechanisms for multiple sample analysis and storage.
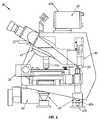
- FIG. 1is a perspective view of an apparatus for automated cell analysis embodying the present invention.
- FIG. 2is a block diagram of the apparatus shown in FIG. 1 .
- FIG. 3is a block diagram of the system processor of FIG. 2 .
- FIG. 4is a plan view of the apparatus of FIG. 1 having the housing removed.
- FIG. 5is a side view of a microscope subsystem of the apparatus of FIG. 1
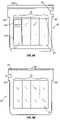
- FIG. 6 ais a top view of a slide carrier for use with the apparatus of FIG. 1 .
- FIG. 6 bis a bottom view of the slide carrier of FIG. 6 a.
- FIG. 7 ais a top view of an automated slide handling subsystem of the apparatus of FIG. 1
- FIG. 7 bis a partial cross-sectional view of the automated slide handling subsystem of FIG. 7 a taken on line A-A.
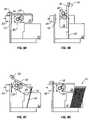
- FIG. 8is an end view of the input module of the automated slide handling subsystem. 8 a - 8 d illustrate the input operation of the automatic slide handling subsystem.
- FIGS. 9 a - 9 dillustrate the output operation of the automated slide handling subsystem.
- FIG. 10is a flow diagram of the procedure for automatically determining a scan area.
- FIG. 11shows the scan path on a prepared slide in the procedure of FIG. 10 .
- FIG. 12illustrates an image of a field acquired in the procedure of FIG. 10 .
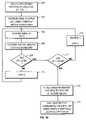
- FIG. 13Ais a flow diagram of a preferred procedure for determining a focal position.
- FIG. 13Bis a flow diagram of a preferred procedure for determining a focal position for neutrophils stained with Fast Red and counterstained with hematoxylin.
- FIG. 14is a flow diagram of a procedure for automatically determining initial focus
- FIG. 15shows an array of slide positions for use in the procedure of FIG. 14 .
- FIG. 16is a flow diagram of a procedure for automatic focusing at a high magnification.
- FIG. 17Ais a flow diagram of an overview of the preferred process to locate and identify objects of interest in a stained biological specimen on a slide.
- FIG. 17Bis a flow diagram of a procedure for color space conversion.
- FIG. 18is a flow diagram of a procedure for background suppression via dynamic thresholding.
- FIG. 19is a flow diagram of a procedure for morphological processing.
- FIG. 20is a flow diagram of a procedure for blob analysis.
- FIG. 21is a flow diagram of a procedure for image processing at a high magnification.
- FIG. 22illustrates a mosaic of cell images produced by the apparatus.
- FIG. 23is a flow diagram of a procedure for estimating the number of nucleated cells in a field.
- FIGS. 24 a and 24 billustrates the apparatus functions available in a user interface of the, apparatus.
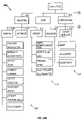
- an apparatus for automated cell analysis of biological specimensis generally indicated by reference numeral 10 as shown in perspective view in FIG. 1 and in block diagram form in FIG. 2 .
- the apparatus 10comprises a microscope subsystem 32 housed in a housing 12 .
- the housing 12includes a slide carrier input hopper 16 and a slide carrier output hopper 18 .
- a door 14 in the housing 12secures the microscope subsystem from the external environment.
- a computer subsystemcomprises a computer 22 having at least one system processor 23 , and a communications modem 29 .
- the computer subsystemfurther includes a computer monitor 26 and other external peripherals including storage device 21 , a pointing device, such as a track ball device 30 , a user input device, such as a touch screen, keyboard, or voice recognition unit 28 and color printer 35 .
- An external power supply 24is also shown for power outage protection.
- the apparatus 10further includes an optical sensing array 42 , such as a camera, preferably a CCD camera, for acquiring images. Microscope movements are under the control of system processor 23 through a number of microscopesubsystem functions described further in detail.
- An automatic slide feed mechanism in conjunction with X-Y stage 38provide automatic slide handling in the apparatus 10 .
- An illumination light source 48projects light onto the X-Y stage 38 which is subsequently imaged through the microscope subsystem 32 and acquired through optical sensing array 42 for processing by the system processor 23 .
- a Z stage or focus stage 46under control of the system processor 23 provides displacement of the microscope subsystem in the Z plane for focusing.
- the microscope subsystem 32further includes a motorized objective turret 44 for selection of objectives.
- the purpose of the apparatus 10is for the unattended automatic scanning of prepared microscope slides for the detection and counting of candidate objects of interest such as normal and abnormal cells, e.g., tumor cells.
- candidate objects of interestsuch as normal and abnormal cells, e.g., tumor cells.
- the preferred embodimentmay be utilized for rare event detection in which there may be only one candidate object of interest per several hundred thousand normal cells, e.g., one to five candidate objects of interest per 2 square centimeter area of the slide.
- the apparatus 10automatically locates and counts candidate objects of interest and estimates normal cells present in a biological specimen on the basis of color, size and shape characteristics. A number of stains are used to preferentially stain candidate objects of interest and Normal cells different colors so that such cells can be distinguished from each other.
- a biological specimenmay be prepared with a reagent to obtain a colored insoluble precipitate.
- the apparatus of the present inventionis used to detect this precipitate as a candidate object of interest.
- a pathologist or laboratory technicianmounts prepared slides onto slide carriers.
- a slide carrier 60is illustrated in FIG. 8 and will be described further below. Each slide carrier holds up to 4 slides. Up to 25 slide carriers are then loaded into input hopper 16 .
- the operatorcan specify the size, shape and location of the area to be scanned or alternatively, the system can automatically locate this area.
- the operatorthen commands the system to begin automated scanning of the slides through a graphical user interface. Unattended scanning begins with the automatic loading of the first carrier and slide onto the precision motorized X-Y stage 38 .
- a bar code label affixed to the slide or slide carrieris read by a bar code reader 33 during this loading operation.
- Each slideis then scanned at a user selected low microscope magnification, for example, 10 ⁇ , to identify candidate cells based on their color, size and shape characteristics.
- the locations, coordinate or address of candidate objects of interestare stored, such as by X-Y, r- . ⁇ , polar, vector or other coordinate systems well known in the art, until scanning is completed.
- the apparatusAfter the low magnification scanning is completed, the apparatus automatically returns to each candidate cell, reimages and refocuses at a higher magnification such as 40 ⁇ and performs further analysis to confirm the cell candidate.
- the systemmay process low magnification images by reconstructing the image from individual fields of view and then determining objects of interest. In this manner, objects of interest that overlap more than one objective field of view may be identified.
- the apparatusstores an image of the object of interest for later review by a pathologist. All results and images can be stored to a storage device 21 such as a removable hard drive, DAT tape, local hard drive, optical disk, or transmitted to a remote site for review or storage.
- the stored images for each slidecan be viewed in a mosaic of images for further review.
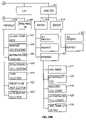
- the microscope controlincludes a number of subsystems.
- the apparatus system processor 23controls these subsystems.
- the system processor 23controls a set of motor-control subsystems 114 through 124 which control the input and output feeder, the motorized turret 44 , the X-Y stage 38 , and the Z stage 46 ( FIG. 2 ).
- the system processor 23further controls an illumination controller 106 for control of substage illumination 48 .
- the light output from the halogen light bulb which supplies illumination for the systemcan vary over time due to bulb aging, changes in optical alignment, and other factors.
- the illumination controller 106is included. This controller is used in conjunction with camera and image collection adjustments to compensate for the variations in light level.
- the light control softwaresamples the output from the camera at intervals (such as between loading of slide carriers), and commands the controller to adjust the light or image collection functions to the desired levels. In this way, light control is automatic and transparent to the user and adds no additional time to system operation.
- the system processor 23is preferably a high performance processor of at least 200 MHz, for example the system processor may comprise dual parallel Intel Pentium 200 MHZ devices.
- FIG. 4shows a plan view of the apparatus 10 with the housing 12 removed.
- a portion of the automatic slide feed mechanism 37is shown to the left of the microscope subsystem 32 and includes slide carrier unloading assembly 34 and unloading platform 36 which in conjunction with slide carrier output hopper 18 function to receive slide carriers which have been analyzed.
- Vibration isolation mounts 40shown in further detail in FIG. 5 , are provided to isolate the microscope subsystem 32 from mechanical shock and vibration that can occur in a typical laboratory environment. In addition to external sources of vibration, the high speed operation of the X-Y stage 38 can induce vibration into the microscope subsystem 32 .
- the isolation mounts 40comprise a spring 40 a and piston 40 b submerged in a high viscosity silicon gel which is enclosed in an elastomer membrane bonded to a casing to achieve damping factors on the order of 17 to 20%
- the automated slide handling subsystemoperates on a single slide carrier at a time.
- a slide carrier 60is shown in FIGS. 6 a and 6 b which provide a top view and a bottom view respectively.
- the slide carrier 60includes up to four slides 70 .
- the carrier 60includes ears 64 for hanging the carrier in the output hopper 18 .
- An undercut 66 and pitch rack 68are formed at the top edge of the slide carrier 60 for mechanical handling of the slide carrier.
- a keyway cutout 65is formed in one side of the carrier 60 to facilitate carrier alignment.
- a prepared slide 72 mounted on the slide carrier 60includes a sample area 72 a and a bar code label area 72 b.
- FIG. 7 aprovides a top view of the slide handling subsystem which comprises a slide input module 15 , a slide output module 17 and X-Y stage drive belt 50 .
- FIG. 7 bprovides a partial cross-sectional view taken along line A-A of FIG. 7 a .
- the slide input module 15comprises a slide carrier input hopper 16 , loading platform 52 and slide carrier loading subassembly 54 .
- the input hopper 16receives a series of slide carriers 60 ( FIGS. 6 a and 6 b ) in a stack on loading platform 52 .
- a guide key 57protrudes from a side of the input hopper 16 to which the keyway cutout 65 ( FIG. 6 a ) of the carrier is fit to achieve proper alignment.
- the input module 15further includes a revolving indexing cam 56 and a switch 90 mounted in the loading platform 52 , the operation of which is described further below.
- the carrier loading subassembly 54comprises an infeed drive belt 59 driven by a motor 86 .
- the infeed drive belt 59includes a pusher tab 58 for pushing the slide carrier horizontally toward the X-Y stage 38 when the belt is driven.
- a homing switch 95senses the pusher tab 58 during a revolution of the belt 59 .
- the X-Y stage 38is shown with x position and y position motors 96 and 97 respectively which are controlled by the system processor 23 ( FIG. 3 ) and are not considered part of the slide handling subsystem.
- the X-Y stage 38further includes an aperture 55 for allowing illumination to reach the slide carrier.
- a switch 91is mounted adjacent the aperture 55 for sensing contact with the carrier and thereupon activating a motor 87 to drive stage drive belt 50 ( FIG. 7 b ).
- the drive belt 50is a double sided timing belt having teeth for engaging pitch rack 68 of the carrier 60 ( FIG. 6 b )
- the slide output module 17includes slide carrier output hopper 18 , unloading platform 36 and slide carrier unloading subassembly 34 .
- the unloading subassembly 34comprises a motor 89 for rotating the unloading platform 36 about shaft 98 during an unloading operation described further below.
- An outfeed gear 93 driven by motor 88rotatably engages the pitch rack 68 of the carrier 60 ( FIG. 6 b ) to transport the carrier to a rest position against switch 92 .
- a spring loaded hold-down mechanismholds the carrier in place on the unloading platform 36 .
- FIG. 8a series of slide carriers 60 are shown stacked in input hopper 16 with the top edges 60 a aligned.
- the indexing cam 56 driven by motor 85advances one revolution to allow only one slide carrier to drop to the bottom of the hopper 16 and onto the loading platform 52 .
- FIGS. 8 a - 8 dshow the cam action in more detail.
- the cam 56includes a hub 56 a to which are mounted upper and lower leaves 56 b and 56 c respectively.
- the leaves 56 b and 56 care semicircular projections oppositely positioned and spaced apart vertically.
- the upper leaf 56 bsupports the bottom carrier at the undercut portion 66 .
- the upper leaf 56 bno longer supports the carrier and instead the carrier has dropped slightly and is supported by the lower leaf 56 c .
- FIG. 8 cshows the position of the cam 56 rotated 2700 wherein the upper leaf 56 b has rotated sufficiently to begin to engage the undercut 66 of the next slide carrier while the opposite facing lower leaf 56 c still supports the bottom carrier. After a full rotation of 360° as shown in FIG. 8 d, the lower leaf 56 c has rotated opposite the carrier stack and no longer supports the bottom carrier which now rests on the loading platform 52 . At the same position, the upper leaf 56 b supports the next carrier for repeating the cycle.
- the X-Y stage 38moves to an unload position and motors 87 and 88 are activated to transport the carrier to the unloading platform 36 using stage drive belt 50 .
- motor 88drives outfeed gear 93 to engage the carrier pitch rack 68 of the carrier 60 ( FIG. 6 b ) until switch 92 is contacted.
- Closing switch 92activates motor 89 to rotate the unloading platform 36 .
- FIGS. 9 a - 9 dThe unloading operation is shown in more detail in end views of the output module 17 ( FIGS. 9 a - 9 d ).
- FIG. 9 athe unloading platform 36 is shown in a horizontal position supporting a slide carrier 60 .
- the hold-down mechanism 94secures the carrier 60 at one end.
- FIG. 9 bshows the output module 17 after motor 89 has rotated the unloading platform 36 to a vertical position, at which point the spring loaded hold-down mechanism 94 releases the slide carrier 60 into the output hopper 18 .
- the carrier 60is supported in the output hopper 18 by means of ears 64 ( FIGS. 6 a and 6 b ).
- FIG. 9 cshows the unloading platform 36 being rotated back towards the 20 horizontal position.
- FIG. 9 dshows the unloading platform 36 at its original horizontal position after having output a series of slide carriers 60 to the output hopper 18 .
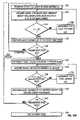
- FIG. 10is a flow diagram that describes the processing associated with the automatic location of a scan area. As shown in this figure, the basic method is to pre-scan the entire slide area to determine texture features that indicate the presence of a smear and to discriminate these areas from dirt and other artifacts.
- an image such as in FIG. 12is acquired and analyzed for texture information at steps 204 and 206 . Since it is desired to locate the edges of the smear sample within a given image, texture analyses are conducted over areas called windows 78 , which are smaller than the entire image as shown in FIG. 12 . The process iterates the scan across the slide at steps 208 , 210 , 212 and 214 .
- the texture analysis processis performed at a lower magnification, preferably at a 4 ⁇ objective.
- a lower magnificationpreferably at a 4 ⁇ objective.
- One reason to operate at low magnificationis to image the largest slide area at any one time. Since cells do not yet need to be resolved at this stage of the overall image analysis, the 4 ⁇ magnification is preferred.
- a portion 72 b of the end of the slide 72is reserved for labeling with identification information. Excepting this label area, the entire slide is scanned in a raster scan fashion to yield a number of adjacent images.
- Texture values for each windowinclude the pixel variance over a window, the difference between the largest and smallest pixel value within a window, and other indicators. The presence of a smear raises the texture values compared with a blank area.
- texture analysisprovides a texture value for each analyzed area.
- the texture valuetends to gradually rise as the scan proceeds across a smear from a thin area to a thick area, reaches a peak, and then falls off again to a lower value as a thin area at the edge is reached.
- the problemis then to decide from the series of texture values the beginning and ending, or the edges, of the smear.
- the texture valuesare fit to a square wave waveform since the texture data does not have sharp beginnings and endings.
- step functionOn a line by line basis, to the texture values in step 216 .
- This functionwhich resembles a single square wave beginning at one edge and ending at the other edge and having an amplitude, provides the means for discrimination.
- the amplitude of the best-fit step functionis utilized to determine whether smear or dirt is present since relatively high values indicate smear. If it is decided that smear is present, the beginning and ending coordinates of this pattern are noted until all lines have been processed, and the smear sample area defined at 218 .
- the scan area of interestis scanned to acquire images for image analysis.
- the preferred method of operationis to initially perform a complete scan of the slide at low magnification to identify and locate candidate objects of interest, followed by further image analysis of the candidate objects of interest at high magnification in order to confirm the objects as cells.
- An alternate method of operationis to perform high magnification image analysis of each candidate object of interest immediately after the object has been identified at low magnification. The low magnification scanning then resumes, searching for additional candidate objects of interest. Since it takes on the order of a few seconds to change objectives, this alternate method of operation would take longer to complete.
- the inventionprovides a method for histological reconstruction to analyze many fields of view on potentially many slides simultaneously.
- the methodcouples composite images in an automated manner for processing and analysis.
- a slide on which is mounted a cellular specimen stained to identify objects of interestis supported on a motorized stage.
- An image of the cellular specimenis generated, digitized, and stored in memory.
- a histological reconstructionis made.
- the operatorcan pre-select a magnification level to be used for the scanning operation.
- a low magnificationsuch as the 10 ⁇ objective is preferred for the scanning operation since a larger area can be initially analyzed for each acquired scan image.
- the overall detection process for a cellincludes a combination of decisions made at both low (10 ⁇ ) and high magnification (40 ⁇ ) levels. Decision making at the 10 ⁇ magnification level is broader in scope, i.e., objects that loosely fit the relevant color, size and shape characteristics are identified at the 10 ⁇ level.
- Analysis at the 40 ⁇ magnification levelthen proceeds to refine the decision making and confirm objects as likely cells or candidate objects of interest. For example, at the 40 ⁇ level it is not uncommon to find that some objects that were identified at 10 ⁇ are artifacts which the analysis process will then reject. In addition, closely packed objects of interest appearing at 10 ⁇ are separated at the 40 ⁇ level
- the scanning operationcompensates by overlapping adjacent image fields in both the x and y directions.
- An overlap amount greater than half the diameter of an average cellis preferred.
- the overlapis specified as a percentage of the image field in the x and y directions.
- a reconstruction method as described abovemay be used to reconstruct the image from multiple fields of view. The reconstructed image is then analyzed and processed to find objects of interest.
- the time to complete an image analysiscan vary depending upon the size of the scan area and the number of candidate cells, or objects of interest identified. For one example, in the preferred embodiment, a complete image analysis of a scan area of two square centimeters in which 50 objects of interest are confirmed can be performed in about 12 to 15 minutes. This example includes not only focusing, scanning and image analysis but also the saving of 40 ⁇ images as a mosaic on hard drive 21 ( FIG. 2 ).
- a complete image analysis of a scan area of two square centimeters in which 50 objects of interest are confirmedcan be performed in about 12 to 15 minutes. This example includes not only focusing, scanning and image analysis but also the saving of 40 ⁇ images as a mosaic on hard drive 21 ( FIG. 2 ).
- a tumor cellfor example, would be about the size of a bottle cap.
- the problemis then to rapidly search the football field and find the very small number of bottle caps and have a high certainty that none have been missed.
- FIG. 13Aprovides a flow diagram describing the “focus point” procedure. The basic method relies on the fact that the pixel value variance (or standard deviation) taken about the pixel value mean is maximum at best focus.
- a “brute-force” methodcould simply step through focus, using the computer controlled Z, or focus stage, calculate the pixel variance at each step, and return to the focus position providing the maximum variance. Such a method would be too time consuming. Therefore, additional features were added as shown in FIG. 13A .
- the Z stageis stepped over a user-specified range of focus positions, with step sizes that are also user-specified. It has been found that for coarse focusing, these data are a close fit to a Gaussian function. Therefore, this initial set of variance versus focus position data are least-squares fit to a Gaussian function at 228 . The location of the peak of this Gaussian curve determines the initial or coarse estimate of focus position for input to step 232 .
- a second stepping operation 232 - 242is performed utilizing smaller steps over a smaller focus range centered on the coarse focus position.
- data taken over this smaller rangeare generally best fit by a second order polynomial. Once this least squares fit is performed at 240 , the peak of the second order curve provides the fine focus position at 244 .
- FIG. 14illustrates a procedure for how this focusing method is utilized to determine the orientation of a slide in its carrier.
- focus positionsare determined, as described above, for a 3 ⁇ 3 grid of points centered on the scan area at 264 . Should one or more of these points lie outside the scan area, the method senses this at 266 by virtue of low values of pixel variance. In this case, additional points are selected closer to the center of the scan area.
- FIG. 15shows the initial array of points 80 and new point 82 selected closer to the center.
- a least squares planeis fit to this data at 270 . Focus points lying too far above or below this best-fit plane are discarded at 272 (such as can occur from a dirty cover glass over the scan area), and the data is then refit. This plane at 274 then provides the desired Z position information for maintaining focus during scanning.
- the scan areais scanned in an X raster scan over the scan area as described earlier.
- the X stageis positioned to the starting point of the scan area
- the focus (Z) stageis positioned to the best fit focus plane
- an imageis acquired and processed as described later, and this process is repeated for all points over the scan area. In this way, focus is maintained automatically without the need for time-consuming refocusing at points during scanning.
- FIG. 16provides the flow diagram for this process. As may be seen, this process is similar to the fine focus method described earlier in that the object is to maximize the image pixel variance. This is accomplished by stepping through a range of focus positions with the Z stage at 276 , 278 , calculating the image variance at each position at 278 , fitting a second order polynomial to these data at 282 , and calculating the peak of this curve to yield an estimate of the best focus position at 284 , 286 .
- This final focusing stepdiffers from previous ones in that the focus range and focus step sizes are smaller since this magnification requires focus settings to within 0.5 micron or better. It should be noted that for some combinations of cell staining characteristics, improved focus can be obtained by numerically selecting the focus position that provides the largest variance, as opposed to selecting the peak of the polynomial. In such cases, the polynomial is used to provide an estimate of best focus, and a final step selects the actual Z position giving highest pixel variance. It should also be noted that if at any time during the focusing process at 40 ⁇ or 60 ⁇ the parameters indicate that the focus position is inadequate, the system automatically reverts to a coarse focusing process as described above with reference to FIG. 13A .
- the focusing methods discussed abovedo not provide optimal focused results.
- certain white blood cells known as neutrophilsmay be stained with Fast Red, a commonly known stain, to identify alkaline phosphatase in the cytoplasm of the cells.
- the specimenmay be counterstained with hematoxylin to identify the nucleus of the cells.
- the cytoplasm bearing alkaline phosphatasebecomes a shade of red proportionate to the amount of alkaline phosphatase in the cytoplasm and the nucleus becomes blue.
- the cytoplasm and nucleus overlapthe cell appears purple.
- a focus methodsuch as the one shown in FIG. 13B , may be used. That method begins by selecting a pixel near the center of a candidate object of interest (Block 248 ) and defining a region of interest centered about the selected pixel (Block 250 ).
- the width of the region of interestis a number of columns which is a power of 2. This width preference arises from subsequent processing of the region of interest preferably using a one dimensional Fast Fourier Transform (FFT) technique.
- FFTFast Fourier Transform
- the height of the region of interestis also a power of two in the preferred embodiment, it need not be unless a two dimensional FFT technique is used to process the region of interest.
- the columns of pixel valuesare processed using the preferred one dimensional FFT to determine a spectra of frequency components for the region of interest (Block 252 ).
- the frequency spectraranges from DC to some highest frequency component.
- a complex magnitudeis computed.
- the complex magnitudes for the frequency components which range from approximately 25% of the highest component to approximately 75% of the highest componentare squared and summed to determine the total power for the region of interest (Block 254 ).
- the region of interestmay be processed with a smoothing window, such as a Harming window, to reduce the spurious high frequency components generated by the FFT processing of the pixel values in the region of interest.
- a smoothing windowsuch as a Harming window
- Such preprocessing of the region of interestpermits all complex magnitude over the complete frequency range to be squared and summed.
- the followingdescribes the image processing methods which are utilized to decide whether a candidate object of interest such as a stained tumor cell is present in a given image, or field, during the scanning process.
- Candidate objects of interest which are detected during scanningare reimaged at higher (40 ⁇ or 60 ⁇ ) magnification, the decision confirmed, and a region of interest for this cell saved for later review.
- the image processingincludes color space conversion, low pass filtering, background suppression, artifact suppression, morphological processing, and blob analysis. One or more of these steps can optionally be eliminated.
- the operatoris provided with an option to configure the system to perform any or all of these steps and whether to perform certain steps more than once or several times in a row. It should also be noted that the sequence of steps may be varied and thereby optimized for specific reagents or reagent combinations; however, the sequence described herein is preferred.
- the image processing steps of low pass filtering, thresholding, morphological processing, and blob analysisare generally known image processing building blocks.
- the preferred process for identifying and locating candidate objects of interest in a stained biological specimen on a slidebegins with an acquisition of images obtained by scanning the slide at low magnification (Block 288 ). Each image is then converted from a first color space to a second color space (Block 290 ) and the color converted image is low pass filtered (Block 292 ). The pixels of the low pass filtered image are then compared to a threshold (Block 294 ) and, preferably, those pixels having a value equal to or greater than the threshold are identified as candidate object of interest pixels and those less than the threshold are determined to be artifact or background pixels.
- the candidate object of interest pixelsare then morphologically processed to identify groups of candidate object of interest pixels as candidate objects of interest (Block 296 ). These candidate objects of interest are then compared to blob analysis parameters (Block 298 ) to further differentiate candidate objects of interest from objects which do not conform to the blob analysis parameters and, thus, do not warrant further processing.
- the location of the candidate objects of interestmay be stored prior to confirmation at high magnification.
- the processcontinues by determining whether the candidate objects of interest have been confirmed (Block 300 ). If they have not been confirmed, the optical system is set to high magnification (Block 302 ) and images of the slide at the locations corresponding to the candidate objects of interest identified in the low magnification images are acquired (Block 288 ).
- the candidate objects of interestare detected based on a combination of characteristics, including size, shape, and color.
- the chain of decision making based on these characteristicspreferably begins with a color space conversion process.
- the optical sensing array coupled to the microscope subsystemoutputs a color image comprising a matrix of 640 ⁇ 480 pixels. Each pixel comprises red, green and blue (RGB) signal values.
- Specimensare generally stained with one or more industry standard stains (e.g., DAB, New Fuchsin, AEC) which are “reddish” in color.
- DABDAB
- New FuchsinAEC
- Candidate objects of interestretain more of the stain and thus appear red while normal cells remain unstained.
- the specimensmay also be counterstained with hematoxylin so the nuclei of normal cells or cells not containing an object of interest appear blue.
- dirt and debriscan appear as black, gray, or can also be lightly stained red or blue depending on the staining procedures utilized.
- the residual plasma or other fluidsalso present on a smear may also possess some color.
- a ratio of two of the RGB signal valuesis formed to provide a means for discriminating color information.
- nine different ratioscan be formed: R/R, R/G, R/B, G/G, G/B, G/R, B/B, B/G, B/R.
- the optimal ratio to selectdepends upon the range of color information expected in the slide specimen. As noted above, typical stains used for detecting candidate objects of interest such as tumor cells are predominantly red, as opposed to predominantly green or blue. Thus, the pixels of a cell of interest which has been stained contain a red component which is larger than either the green or blue components.
- a ratio of red divided by blueprovides a value which is greater than one for tumor cells but is approximately one for any clear or white areas on the slide. Since the remaining cells, i.e., normal cells, typically are stained blue, the R/B ratio for pixels of these latter cells yields values of less than one. The R/B ratio is preferred for clearly separating the color information typical in these applications.
- FIG. 17Billustrates the flow diagram by which this conversion is performed.
- the conversionis implemented with a look up table.
- the use of a look up table for color conversionaccomplishes three functions: 1) performing a division operation; 2) scaling the result for processing as an image having pixel values ranging from 0 to 255; and 3) defining objects which have low pixel values in each color band (R,G,B) as “black” to avoid infinite ratios (i.e., dividing by zero).
- These “black” objectsare typically staining artifacts or can be edges of bubbles caused by pasting a coverglass over the specimen.
- each pixel in the original RGB imageis converted at 308 to produce the output. Since it is of interest to separate the red stained tumor cells from blue stained normal ones, the ratio of color values is then scaled by a user specified factor. As an example, for a factor of 128 and the ratio of (red pixel value)/(blue pixel value), clear areas on the slide would have a ratio of 1 scaled by 128 for a final X value of 128. Pixels which lie in red stained tumor cells would have X value greater than 128, while blue stained nuclei of normal cells would have value less than 128. In this way, the desired objects of interest can be numerically discriminated.
- the resulting 640 ⁇ 480 pixel matrix, referred to as the X-imageis a gray scale image having values ranging from 0 to 255.
- RGB color informationconverts into another color space, such as HSI (hue, saturation, intensity) space.
- HSIhue, saturation, intensity
- distinctly different huessuch as red, blue, green, yellow, may be readily separated.
- relatively lightly stained objectsmay be distinguished from more intensely stained ones by virtue of differing saturations.
- Conversion to a color ratiois faster; for example, a full image can be converted by the ratio technique of the present invention in about 30 ms while an HSI conversion can take several seconds.
- a blue channelin which objects that are red are relatively dark.
- Objects which are blue, or whiteare relatively light in the blue channel.
- illuminationis not uniform. Nonuniformity of illumination results in non-uniformity across the pixel values in any color channel, for example, tending to peak in the middle of the image and dropping off at the edges where the illumination falls off.
- the color conversion schemeis relatively insensitive to changes in color balance, i.e., the relative outputs of the red, green, and blue channels. However, some control is necessary to avoid camera saturation, or inadequate exposures in any one of the color bands.
- This color balancingis performed automatically by utilizing a calibration slide consisting of a clear area, and a “dark” area having a known optical transmission or density. The system obtains images from the clear and “dark” areas, calculates “white” and “black” adjustments for the image-frame grabber or digitizer processor 25 , and thereby provides correct color balance.
- a low pass filtering processprecedes thresholding.
- An objective of thresholdingis to obtain a pixel image matrix having only candidate objects of interest, such as tumor cells above a threshold level and everything else below it.
- an actual acquired imagewill contain noise.
- the noisecan take several forms, including white noise and artifacts.
- the microscope slidecan have small fragments of debris that pick up color in the staining process and these are known as artifacts. These artifacts are generally small and scattered areas, on the order of a few pixels, which are above the threshold.
- low pass filteringis to essentially blur or smear the entire color converted image.
- the low pass filtering processwill smear artifacts more than larger objects of interest, such as tumor cells and thereby eliminate or reduce the number of artifacts that pass the thresholding process.
- the resultis a cleaner thresholded image downstream.
- a 3 ⁇ 3 matrix of coefficientsis applied to each pixel in the 640 ⁇ 480 ⁇ -image.
- a preferred coefficient matrixis as follows:
- a 3 ⁇ 3 matrixcomprising the pixel of interest and its neighbors is multiplied by the coefficient matrix and summed to yield a single value for the pixel of interest.
- the output of this spatial convolution processis again a 640 ⁇ 480 matrix.
- the center pixel and only the center pixelhas a value of 255 and each of its other neighbors, top left, top, top right and so forth, have values of 0.
- This singular white pixel casecorresponds to a small object.
- the result of the matrix multiplication and addition using the coefficient matrixis a value of 1/9 (255) or 28 for the center pixel, a value which is below the nominal threshold of 128.
- large objectsretain their values while small objects are reduced in amplitude or eliminated.
- the low pass filtering processis performed on the X image twice in succession.
- a thresholding operationis performed designed to set pixels within cells of interest to a value of 255, and all other areas to 0. Thresholding ideally yields an image in which cells of interest are white and the remainder of the image is black.
- a problem one faces in thresholdingis where to set the threshold level. One cannot simply assume that cells of interest are indicated by any pixel value above the nominal threshold of 128.
- a typical imaging systemmay use an incandescent halogen light bulb as a light source. As the bulb ages, the relative amounts of red and blue output can change. The tendency as the bulb ages is for the blue to drop off more than the red and the green. To accommodate for this light source variation over time, a dynamic thresholding process is used whereby the threshold is adjusted dynamically for each acquired image. Thus, for each 640 ⁇ 480 image, a single threshold value is derived specific to that image.
- the basic methodis to calculate, for each field, the mean X value, and the standard deviation about this mean at 312 .
- the thresholdis then set at 314 to the mean plus an amount defined by the product of a (user specified) factor and the standard deviation of the color converted pixel values.
- the standard deviationcorrelates to the structure and number of objects in the image.
- the user specified factoris in the range of approximately 1.5 to 2.5.
- the factoris selected to be in the lower end of the range for slides in which the stain has primarily remained within cell boundaries and the factor is selected to be in the upper end of the range for slides in which the stain is pervasively present throughout the slide.
- the thresholdmay be raised or lowered to help reduce background objects.
- the thresholdchanges in step with the aging of the light source such that the effects of the aging are canceled out.
- the image matrix resulting at 316 from the thresholding stepis a binary image of black (0) and white (255) pixels.
- Morphological processingis similar to the low pass filter convolution process described earlier except that it is applied to a binary image. Similar to spatial convolution, the morphological process traverses an input image matrix, pixel by pixel, and places the processed pixels in an output matrix. Rather than calculating a weighted sum of the neighboring pixels as in the low pass convolution process, the morphological process uses set theory operations to combine neighboring pixels in a nonlinear fashion.
- Erosionis a process whereby a single pixel layer is taken away from the edge of an object. Dilation is the opposite process which adds a single pixel layer to the edges of an object.
- the power of morphological processingis that it provides for further discrimination to eliminate small objects that have survived the thresholding process and yet are not likely tumor cells.
- the erosion and dilation processes that make up a morphological “open” operationpreferably make small objects disappear yet allow large objects to remain. Morphological processing of binary images is described in detail in “Digital Image Processing”, pages 127-137, G. A. Baxes, John Wiley & Sons, (1994)
- FIG. 19illustrates the flow diagram for this process.
- a single morphological openconsists of a single morphological erosion 320 followed by a single morphological dilation 322 .
- Multiple “opens”consist of multiple erosions followed by multiple dilations. In the preferred embodiment, one or two morphological opens are found to be suitable.
- the processed imagecontains thresholded objects of interest, such as tumor cells (if any were present in the original image), and possibly some residual artifacts that were too large to be eliminated by the processes above.
- FIG. 20provides a flow diagram illustrating a blob analysis performed to determine the number, size, and location of objects in the thresholded image.
- a blobis defined as a region of connected pixels having the same “color”, in this case, a value of 255. Processing is performed over the entire image to determine the number of such regions at 324 and to determine the area and coordinates for each detected blob at 326 . Comparison of the size of each blob to a known minimum area at 328 for a tumor cell allows a refinement in decisions about which objects are objects of interest, such as tumor cells, and which are artifacts.
- the term “coordinate” or “address”is used to mean a particular location on a slide or sample.
- the coordinate or addresscan be identified by any number of means including, for example, X-Y coordinates, r- ⁇ coordinates, and others recognized by those skilled in the art.
- the location of objects identified as cells of interest in this stageare saved for the final 40 ⁇ reimaging step described below. Objects not passing the size test are disregarded as artifacts.
- the processing chain described aboveidentifies objects at the scanning magnification as cells of interest candidates.
- the systemswitches to the 40 ⁇ magnification objective at 330 , and each candidate is reimaged to confirm the identification 332 .
- Each 40 ⁇ imageis reprocessed at 334 using the same steps as described above but with test parameters suitably modified for the higher magnification (e.g. area).
- test parameterssuitably modified for the higher magnification (e.g. area).
- a region of interest centered on each confirmed cellis saved to the hard drive for review by the pathologist.
- a mosaic of saved imagesis made available for viewing by the pathologist. As shown in FIG. 22 , a series of images of cells which have been confirmed by the image analysis is presented in the mosaic 150 . The pathologist can then visually inspect the images to make a determination whether to accept ( 152 ) or reject ( 153 ) each cell image. Such a determination can be noted and saved with the mosaic of images for generating a printed report.
- the cell coordinatesare saved should the pathologist wish to directly view the cell through the oculars or on the image monitor.
- the pathologistreloads the slide carrier, selects the slide and cell for review from a mosaic of cell images, and the system automatically positions the cell under the microscope for viewing.
- a single color band(the red channel provides the best contrast for blue stained nucleated cells) is processed by calculating the average pixel value for each field at 342 , establishing two threshold values (high and low) as indicated at 344 , 346 , and counting the number of pixels between these two values at 348 . In the absence of dirt, or other opaque debris, this provides a count of the number of predominantly blue pixels. By dividing this value by the average area for a nucleated cell at 350 , and looping over all fields at 352 , an approximate call count is obtained. Preliminary testing of this process indicates an accuracy with +/ ⁇ 15%. It should be noted that for some slide preparation techniques, the size of nucleated cells can be significantly larger than the typical size. The operator can select the appropriate nucleated cell size to compensate for these characteristics.
- MTFmodulation transfer function
- An MTF compensation, or MTFCis performed as a digital process applied to the acquired digital images.
- a digital filteris utilized to restore the high spatial frequency content of the images upon storage, while maintaining low noise levels.
- image qualityis enhanced, or restored, through the use of digital processing methods as opposed to conventional oil-immersion or other hardware based methods.
- MTFCis described further in “The Image Processing Handbook,” pages 225 and 337, J. C. Rues, CRC Press (1995)
- FIGS. 24 a and 24 bthe functions available in a user interface of the apparatus IO are shown. From the user interface, which is presented graphically on computer monitor 26 , an operator can select among apparatus functions which include acquisition 402 , analysts 404 , and system configuration 406 . At the acquisition level 402 , the operator can select between manual 408 and automatic 410 modes of operation. In the manual mode, the operator is presented with manual operations 409 . Patient information 414 regarding an assay can be entered at 412 . In the analysis level 404 , review 416 and report 418 functions are made available. At the review level 416 , the operator can select a montage function 420 .
- a pathologistcan perform diagnostic review functions including visiting an image 422 , accept/reject of cells 424 , nucleated cell counting 426 , accept/reject of cell counts 428 , and saving of pages at 430 .
- the report level 418allows an operator to generate patient reports 432 .
- the operatorcan select to configure preferences at 434 , input operator information 437 at 436 , create a system log at 438 , and toggle a menu panel at 440 .
- the configuration preferencesinclude scan area selection functions at 442 , 452 ; montage specifications at 444 , bar code handling at 446 , default cell counting at 448 , stain selection at 450 , and scan objective selection at 454 .
Landscapes
- Engineering & Computer Science (AREA)
- Physics & Mathematics (AREA)
- General Physics & Mathematics (AREA)
- Theoretical Computer Science (AREA)
- Multimedia (AREA)
- Computer Vision & Pattern Recognition (AREA)
- Health & Medical Sciences (AREA)
- Life Sciences & Earth Sciences (AREA)
- Chemical & Material Sciences (AREA)
- General Health & Medical Sciences (AREA)
- Molecular Biology (AREA)
- Biomedical Technology (AREA)
- Analytical Chemistry (AREA)
- Optics & Photonics (AREA)
- Signal Processing (AREA)
- Dispersion Chemistry (AREA)
- Biochemistry (AREA)
- Immunology (AREA)
- Pathology (AREA)
- Investigating Or Analysing Materials By Optical Means (AREA)
- Investigating Or Analysing Biological Materials (AREA)
Abstract
Description
| 1/9 | 1/9 | 1/9 |
| 1/9 | 1/9 | 1/9 |
| 1/9 | 1/9 | 1/9 |
Claims (17)
Priority Applications (2)
| Application Number | Priority Date | Filing Date | Title |
|---|---|---|---|
| US11/685,717US7428325B2 (en) | 1996-11-27 | 2007-03-13 | Method and apparatus for automated image analysis of biological specimens |
| US12/201,800US7783098B2 (en) | 1995-11-30 | 2008-08-29 | Method and apparatus for automated image analysis of biological specimens |
Applications Claiming Priority (7)
| Application Number | Priority Date | Filing Date | Title |
|---|---|---|---|
| US08/758,436US6215892B1 (en) | 1995-11-30 | 1996-11-27 | Method and apparatus for automated image analysis of biological specimens |
| US08/827,268US6151405A (en) | 1996-11-27 | 1997-03-28 | System and method for cellular specimen grading |
| US12938499P | 1999-04-13 | 1999-04-13 | |
| US09/344,308US6418236B1 (en) | 1999-06-24 | 1999-06-24 | Histological reconstruction and automated image analysis |
| US09/495,461US6718053B1 (en) | 1996-11-27 | 2000-02-01 | Method and apparatus for automated image analysis of biological specimens |
| US10/746,515US7190818B2 (en) | 1996-11-27 | 2003-12-24 | Method and apparatus for automated image analysis of biological specimens |
| US11/685,717US7428325B2 (en) | 1996-11-27 | 2007-03-13 | Method and apparatus for automated image analysis of biological specimens |
Related Parent Applications (1)
| Application Number | Title | Priority Date | Filing Date |
|---|---|---|---|
| US10/746,515ContinuationUS7190818B2 (en) | 1995-11-30 | 2003-12-24 | Method and apparatus for automated image analysis of biological specimens |
Related Child Applications (1)
| Application Number | Title | Priority Date | Filing Date |
|---|---|---|---|
| US12/201,800ContinuationUS7783098B2 (en) | 1995-11-30 | 2008-08-29 | Method and apparatus for automated image analysis of biological specimens |
Publications (2)
| Publication Number | Publication Date |
|---|---|
| US20070206843A1 US20070206843A1 (en) | 2007-09-06 |
| US7428325B2true US7428325B2 (en) | 2008-09-23 |
Family
ID=32046048
Family Applications (3)
| Application Number | Title | Priority Date | Filing Date |
|---|---|---|---|
| US09/495,461Expired - LifetimeUS6718053B1 (en) | 1995-11-30 | 2000-02-01 | Method and apparatus for automated image analysis of biological specimens |
| US10/746,515Expired - Fee RelatedUS7190818B2 (en) | 1995-11-30 | 2003-12-24 | Method and apparatus for automated image analysis of biological specimens |
| US11/685,717Expired - Fee RelatedUS7428325B2 (en) | 1995-11-30 | 2007-03-13 | Method and apparatus for automated image analysis of biological specimens |
Family Applications Before (2)
| Application Number | Title | Priority Date | Filing Date |
|---|---|---|---|
| US09/495,461Expired - LifetimeUS6718053B1 (en) | 1995-11-30 | 2000-02-01 | Method and apparatus for automated image analysis of biological specimens |
| US10/746,515Expired - Fee RelatedUS7190818B2 (en) | 1995-11-30 | 2003-12-24 | Method and apparatus for automated image analysis of biological specimens |
Country Status (1)
| Country | Link |
|---|---|
| US (3) | US6718053B1 (en) |
Cited By (23)
| Publication number | Priority date | Publication date | Assignee | Title |
|---|---|---|---|---|
| US20060188140A1 (en)* | 2003-09-10 | 2006-08-24 | Bioimagene, Inc. | Method and system for digital image based tissue independent simultaneous nucleus cytoplasm and membrane quantitation |
| US20080090239A1 (en)* | 2006-06-14 | 2008-04-17 | Daniel Shoemaker | Rare cell analysis using sample splitting and dna tags |
| US20090215088A1 (en)* | 2008-02-25 | 2009-08-27 | Cellpoint Diagnostics, Inc. | Tagged Ligands For Enrichment of Rare Analytes From A Mixed Sample |
| US20120307047A1 (en)* | 2011-06-01 | 2012-12-06 | Canon Kabushiki Kaisha | Imaging system and control method thereof |
| US8921102B2 (en) | 2005-07-29 | 2014-12-30 | Gpb Scientific, Llc | Devices and methods for enrichment and alteration of circulating tumor cells and other particles |
| US9017942B2 (en) | 2006-06-14 | 2015-04-28 | The General Hospital Corporation | Rare cell analysis using sample splitting and DNA tags |
| WO2015102948A1 (en)* | 2013-12-31 | 2015-07-09 | Siemens Healthcare Diagnostics Inc. | Urine formed element classification method and apparatus |
| US20150205088A1 (en)* | 2014-01-23 | 2015-07-23 | U&U Engineering Inc. | Bevel-axial auto-focusing microscopic system and method thereof |
| US9310598B2 (en) | 2009-03-11 | 2016-04-12 | Sakura Finetek U.S.A., Inc. | Autofocus method and autofocus device |
| US9541480B2 (en) | 2011-06-29 | 2017-01-10 | Academia Sinica | Capture, purification, and release of biological substances using a surface coating |
| US10007102B2 (en) | 2013-12-23 | 2018-06-26 | Sakura Finetek U.S.A., Inc. | Microscope with slide clamping assembly |
| US10107726B2 (en) | 2016-03-16 | 2018-10-23 | Cellmax, Ltd. | Collection of suspended cells using a transferable membrane |
| US10112198B2 (en) | 2014-08-26 | 2018-10-30 | Academia Sinica | Collector architecture layout design |
| US10139613B2 (en) | 2010-08-20 | 2018-11-27 | Sakura Finetek U.S.A., Inc. | Digital microscope and method of sensing an image of a tissue sample |
| US10269094B2 (en) | 2013-04-19 | 2019-04-23 | Sakura Finetek U.S.A., Inc. | Method for generating a composite image of an object composed of multiple sub-images |
| US10495644B2 (en) | 2014-04-01 | 2019-12-03 | Academia Sinica | Methods and systems for cancer diagnosis and prognosis |
| US11280803B2 (en) | 2016-11-22 | 2022-03-22 | Sakura Finetek U.S.A., Inc. | Slide management system |
| US11378498B2 (en) | 2006-06-14 | 2022-07-05 | Verinata Health, Inc. | Diagnosis of fetal abnormalities using polymorphisms including short tandem repeats |
| USD970033S1 (en) | 2020-10-23 | 2022-11-15 | Becton, Dickinson And Company | Cartridge imaging background device |
| US11988596B2 (en) | 2020-10-23 | 2024-05-21 | Becton, Dickinson And Company | Systems and methods for imaging and image-based analysis of test devices |
| US11996183B2 (en) | 2020-09-17 | 2024-05-28 | Scanwell Health, Inc. | Methods of analyzing diagnostic test kits |
| CN118397518A (en)* | 2024-06-26 | 2024-07-26 | 陕西福坤顺科技有限公司 | Visual detection method for stability of operation state of three-axis turntable |
| US12235217B2 (en) | 2019-11-13 | 2025-02-25 | Scanwell Health, Inc. | Diagnostic test kits for sample preparation and analysis |
Families Citing this family (94)
| Publication number | Priority date | Publication date | Assignee | Title |
|---|---|---|---|---|
| US6718053B1 (en)* | 1996-11-27 | 2004-04-06 | Chromavision Medical Systems, Inc. | Method and apparatus for automated image analysis of biological specimens |
| EP1300713A3 (en) | 1995-11-30 | 2004-11-03 | Chromavision Medical Systems, Inc. | Method and apparatus for automated image analysis of biological specimens |
| US6272235B1 (en)* | 1997-03-03 | 2001-08-07 | Bacus Research Laboratories, Inc. | Method and apparatus for creating a virtual microscope slide |
| DE19983691T1 (en)* | 1998-10-29 | 2001-11-29 | Cell Works Inc | Characterization of multiple markers from single cells |
| US20020051515A1 (en)* | 2000-06-06 | 2002-05-02 | Fuji Photo Film Co., Ltd. | Method of and system for detecting prospective abnormal shadow |
| IL138123A0 (en)* | 2000-08-28 | 2001-10-31 | Accuramed 1999 Ltd | Medical decision support system and method |
| US7711403B2 (en)* | 2001-04-05 | 2010-05-04 | Rhode Island Hospital | Non-invasive determination of blood components |
| WO2003042788A2 (en)* | 2001-11-13 | 2003-05-22 | Chromavision Medical Systems, Inc. | A system for tracking biological samples |
| WO2003095986A1 (en)* | 2002-05-14 | 2003-11-20 | Amersham Biosciences Niagara, Inc. | System and methods for rapid and automated screening of cells |
| US7272252B2 (en)* | 2002-06-12 | 2007-09-18 | Clarient, Inc. | Automated system for combining bright field and fluorescent microscopy |
| US20050037406A1 (en)* | 2002-06-12 | 2005-02-17 | De La Torre-Bueno Jose | Methods and apparatus for analysis of a biological specimen |
| CA2500392C (en) | 2002-09-27 | 2012-11-27 | The General Hospital Corporation | Microfluidic device for cell separation and uses thereof |
| US20040202357A1 (en) | 2003-04-11 | 2004-10-14 | Perz Cynthia B. | Silhouette image acquisition |
| EP1643906A2 (en)* | 2003-06-12 | 2006-04-12 | University of Utah Research Foundation | Apparatus, systems and methods for diagnosing carpal tunnel syndrome |
| US7594188B2 (en)* | 2003-08-21 | 2009-09-22 | Carl Zeiss Ag | Operating menu for a surgical microscope |
| US8068988B2 (en) | 2003-09-08 | 2011-11-29 | Ventana Medical Systems, Inc. | Method for automated processing of digital images of tissue micro-arrays (TMA) |
| US20050136509A1 (en)* | 2003-09-10 | 2005-06-23 | Bioimagene, Inc. | Method and system for quantitatively analyzing biological samples |
| PA8617201A1 (en)* | 2003-11-14 | 2006-09-22 | Israel State | TRANSGENIC BANANA RESISTANT TO DISEASES |
| GB2427825B (en)* | 2004-01-30 | 2007-08-01 | Univ Brown | Non-Invasive Spectroscopy Of Mammalian Tissues |
| US7394530B2 (en)* | 2004-03-30 | 2008-07-01 | Budd Gerald W | Surface inspection technology for the detection of porosity and surface imperfections on machined metal surfaces |
| US7653260B2 (en)* | 2004-06-17 | 2010-01-26 | Carl Zeis MicroImaging GmbH | System and method of registering field of view |
| US8582924B2 (en)* | 2004-06-30 | 2013-11-12 | Carl Zeiss Microimaging Gmbh | Data structure of an image storage and retrieval system |
| FR2872910B1 (en)* | 2004-07-07 | 2006-10-13 | Nanoraptor Sa | OPTICAL COMPONENT FOR OBSERVING A NANOMETRIC SAMPLE, SYSTEM COMPRISING SUCH A COMPONENT, ANALYSIS METHOD USING THE SAME, AND APPLICATIONS THEREOF |
| US20060133657A1 (en)* | 2004-08-18 | 2006-06-22 | Tripath Imaging, Inc. | Microscopy system having automatic and interactive modes for forming a magnified mosaic image and associated method |
| US7113625B2 (en)* | 2004-10-01 | 2006-09-26 | U.S. Pathology Labs, Inc. | System and method for image analysis of slides |
| US7907756B2 (en)* | 2005-01-31 | 2011-03-15 | Siemens Medical Solutions Usa, Inc. | System and method for validating an image segmentation algorithm |
| US20070016081A1 (en)* | 2005-07-12 | 2007-01-18 | Globalmedia Group, Llc | Chroma-photon staining |
| US20070031043A1 (en)* | 2005-08-02 | 2007-02-08 | Perz Cynthia B | System for and method of intelligently directed segmentation analysis for automated microscope systems |
| US7627153B2 (en)* | 2005-08-04 | 2009-12-01 | Carl Zeiss Microimaging Gmbh | Repositioning inaccuracies in an automated imaging system |
| US8041090B2 (en)* | 2005-09-10 | 2011-10-18 | Ge Healthcare Uk Limited | Method of, and apparatus and computer software for, performing image processing |
| AT502854B1 (en)* | 2005-11-30 | 2009-08-15 | Oridis Biomed Forschungs Und E | METHOD AND DEVICE FOR DETERMINING THE RELEVANCE OF SAMPLE ARRAY PREPARATIONS |
| US20070135999A1 (en)* | 2005-12-13 | 2007-06-14 | Applied Spectral Imaging Ltd. | Method, apparatus and system for characterizing pathological specimen |
| US9133506B2 (en)* | 2006-01-10 | 2015-09-15 | Applied Spectral Imaging Ltd. | Methods and systems for analyzing biological samples |
| US8137912B2 (en) | 2006-06-14 | 2012-03-20 | The General Hospital Corporation | Methods for the diagnosis of fetal abnormalities |
| WO2007147074A2 (en) | 2006-06-14 | 2007-12-21 | Living Microsystems, Inc. | Use of highly parallel snp genotyping for fetal diagnosis |
| WO2008007725A1 (en)* | 2006-07-12 | 2008-01-17 | Toyo Boseki Kabushiki Kaisha | Analyzer and use thereof |
| US8067245B2 (en)* | 2006-07-24 | 2011-11-29 | Medica Corporation | Automated microscope for blood cell analysis |
| SE530789C2 (en)* | 2007-01-17 | 2008-09-09 | Hemocue Ab | Apparatus and method for position determination of objects contained in a sample |
| WO2008088249A1 (en)* | 2007-01-17 | 2008-07-24 | Hemocue Ab | Apparatus for determining positions of objects contained in a sample |
| US20110029322A1 (en)* | 2007-04-11 | 2011-02-03 | Dr. Walid Hindo | Health care system |
| WO2008143849A2 (en) | 2007-05-14 | 2008-11-27 | Historx, Inc. | Compartment segregation by pixel characterization using image data clustering |
| US8023714B2 (en)* | 2007-06-06 | 2011-09-20 | Aperio Technologies, Inc. | System and method for assessing image interpretability in anatomic pathology |
| ES2599902T3 (en)* | 2007-06-15 | 2017-02-06 | Novartis Ag | Microscope system and method to obtain standardized sample data |
| CA2604317C (en) | 2007-08-06 | 2017-02-28 | Historx, Inc. | Methods and system for validating sample images for quantitative immunoassays |
| CA2596204C (en)* | 2007-08-07 | 2019-02-26 | Historx, Inc. | Method and system for determining an optimal dilution of a reagent |
| EP2191414B1 (en)* | 2007-08-17 | 2019-02-13 | CDx Medical IP, Inc. | Feature dependent extended depth of focusing on semi-transparent biological specimens |
| US7978258B2 (en)* | 2007-08-31 | 2011-07-12 | Historx, Inc. | Automatic exposure time selection for imaging tissue |
| US20090067700A1 (en)* | 2007-09-10 | 2009-03-12 | Riverain Medical Group, Llc | Presentation of computer-aided detection/diagnosis (CAD) results |
| EP2255310B1 (en) | 2008-02-29 | 2019-02-20 | Dako Denmark A/S | Systems and methods for tracking and providing workflow information |
| WO2012030313A1 (en) | 2008-04-25 | 2012-03-08 | James Winkelman | Method of determining a complete blood count and a white blood cell differential count |
| US9602777B2 (en)* | 2008-04-25 | 2017-03-21 | Roche Diagnostics Hematology, Inc. | Systems and methods for analyzing body fluids |
| DE102008027905A1 (en)* | 2008-06-12 | 2009-12-17 | Olympus Winter & Ibe Gmbh | Method and endoscope for improving endoscope images |
| ES2573945T3 (en)* | 2008-09-16 | 2016-06-13 | Novartis Ag | Reproducible quantification of biomarker expression |
| WO2010033578A2 (en) | 2008-09-20 | 2010-03-25 | The Board Of Trustees Of The Leland Stanford Junior University | Noninvasive diagnosis of fetal aneuploidy by sequencing |
| US20110029865A1 (en)* | 2009-07-31 | 2011-02-03 | Nellcor Puritan Bennett Llc | Control Interface For A Medical Monitor |
| JP5394887B2 (en)* | 2009-10-29 | 2014-01-22 | オリンパス株式会社 | Microscope device and microscope observation method |
| CN102781305B (en)* | 2010-03-09 | 2015-06-03 | 奥林巴斯株式会社 | Fluorescent endoscope device |
| JP5557091B2 (en) | 2010-03-30 | 2014-07-23 | 日本電気株式会社 | Image processing apparatus, image reading apparatus, image processing method, and image processing program |
| US8922633B1 (en) | 2010-09-27 | 2014-12-30 | Given Imaging Ltd. | Detection of gastrointestinal sections and transition of an in-vivo device there between |
| US8965079B1 (en) | 2010-09-28 | 2015-02-24 | Given Imaging Ltd. | Real time detection of gastrointestinal sections and transitions of an in-vivo device therebetween |
| US9041791B2 (en) | 2011-02-01 | 2015-05-26 | Roche Diagnostics Hematology, Inc. | Fast auto-focus in imaging |
| EP2673728B1 (en)* | 2011-02-08 | 2018-09-12 | dacadoo ag | System, method and apparatus for the remote analysis of chemical compound microarrays |
| US9354155B2 (en)* | 2011-05-31 | 2016-05-31 | Bio-Rad Laboratories, Inc. | Cell counting systems and methods |
| ES2882791T3 (en) | 2011-06-17 | 2021-12-02 | Roche Diagnostics Hematology Inc | System and procedure for viewing and reviewing samples |
| JP5580267B2 (en) | 2011-09-08 | 2014-08-27 | 大日本スクリーン製造株式会社 | Detection method |
| JP5615247B2 (en) | 2011-09-27 | 2014-10-29 | 大日本スクリーン製造株式会社 | Imaging device, detection device, and imaging method |
| DE102011084347B4 (en) | 2011-10-12 | 2022-07-21 | Carl Zeiss Microscopy Gmbh | Microscope and microscopy method for carrying out a multi-position experiment |
| US10001622B2 (en)* | 2011-10-25 | 2018-06-19 | Sanford Burnham Medical Research Institute | Multifunction autofocus system and method for automated microscopy |
| JP5690359B2 (en) | 2012-03-30 | 2015-03-25 | 株式会社Screenホールディングス | Imaging apparatus and imaging method |
| JP6172146B2 (en)* | 2012-07-04 | 2017-08-02 | ソニー株式会社 | Information processing apparatus, information processing method, program, and microscope system |
| JP5728042B2 (en) | 2012-08-20 | 2015-06-03 | 株式会社Screenホールディングス | Imaging device |
| US9589172B1 (en)* | 2013-02-25 | 2017-03-07 | Flagship Biosciences, Inc. | Systems and methods for interactive image analysis of digital pathology images |
| DE102013006994A1 (en)* | 2013-04-19 | 2014-10-23 | Carl Zeiss Microscopy Gmbh | Digital microscope and method for optimizing the workflow in a digital microscope |
| US9324145B1 (en) | 2013-08-08 | 2016-04-26 | Given Imaging Ltd. | System and method for detection of transitions in an image stream of the gastrointestinal tract |
| US9585627B2 (en)* | 2013-08-14 | 2017-03-07 | Siemens Healthcare Gmbh | Histological differentiation grade prediction of hepatocellular carcinoma in computed tomography images |
| EP3155592B1 (en) | 2014-06-10 | 2019-09-11 | Leland Stanford Junior University | Predicting breast cancer recurrence directly from image features computed from digitized immunohistopathology tissue slides |
| JP6698663B2 (en)* | 2015-01-31 | 2020-05-27 | ベンタナ メディカル システムズ, インコーポレイテッド | Quality control of automated whole slide analysis |
| JP6586300B2 (en)* | 2015-06-23 | 2019-10-02 | オリンパス株式会社 | Cell counting device |
| GB2542764A (en)* | 2015-09-23 | 2017-04-05 | Pathxl Ltd | Image processing method and apparatus for normalisation and artefact correction |
| US10845245B2 (en)* | 2016-04-20 | 2020-11-24 | Leica Biosystems Imaging, Inc. | Digital pathology color calibration and validation |
| EP3267394A1 (en)* | 2016-07-04 | 2018-01-10 | Centre National De La Recherche Scientifique | Method and apparatus for real-time detection of polyps in optical colonoscopy |
| US10210608B2 (en)* | 2017-02-07 | 2019-02-19 | Xerox Corporation | System and method for detecting defects in an image |
| TWI756365B (en)* | 2017-02-15 | 2022-03-01 | 美商脫其泰有限責任公司 | Image analysis systems and related methods |
| US9738937B1 (en) | 2017-03-31 | 2017-08-22 | Cellmax, Ltd. | Identifying candidate cells using image analysis |
| US11280990B2 (en) | 2018-02-26 | 2022-03-22 | Caliber Imaging & Diagnostics, Inc. | System and method for macroscopic and microscopic imaging ex-vivo tissue |
| KR102140385B1 (en)* | 2018-12-31 | 2020-07-31 | (주)유아이엠디 | Cell-zone labeling apparatus and cell-zone detecting system including the same apparatus |
| CN110993062B (en)* | 2019-10-29 | 2024-05-10 | 北京临近空间飞行器系统工程研究所 | Medical image information system |
| KR102240649B1 (en)* | 2019-12-11 | 2021-04-15 | (주)유아이엠디 | Imaging method of optical apparatus for observing sample of cell |
| KR102613961B1 (en)* | 2020-12-10 | 2023-12-14 | (주)유아이엠디 | Determination method for cell zone of slide sample image smeared with bone-marrow and high magnification imaging method of the same cell zone |
| KR102576041B1 (en)* | 2021-02-09 | 2023-09-07 | (주)유아이엠디 | Acquisition method of high magnification image of slide sample |
| WO2022187079A1 (en)* | 2021-03-04 | 2022-09-09 | Applied Materials, Inc. | Pixel and region classification of film non-uniformity based on processing of substrate images |
| US20230088338A1 (en)* | 2021-09-10 | 2023-03-23 | Illumina, Inc. | Sequencer focus quality metrics and focus tracking for periodically patterned surfaces |
| CN117292267B (en)* | 2023-11-27 | 2024-02-02 | 武汉大学 | A segmented estimation method and system for rice aboveground biomass based on phenological information |
| CN117723768B (en)* | 2023-12-28 | 2024-09-13 | 北京众驰伟业科技发展有限公司 | Reagent automatic identification and positioning system of full-automatic coagulation tester |
Citations (155)
| Publication number | Priority date | Publication date | Assignee | Title |
|---|---|---|---|---|
| US3824393A (en) | 1971-08-25 | 1974-07-16 | American Express Invest | System for differential particle counting |
| US3851972A (en) | 1973-10-18 | 1974-12-03 | Coulter Electronics | Automatic method and system for analysis and review of a plurality of stored slides |
| US4011004A (en) | 1975-02-06 | 1977-03-08 | Geometric Data Corporation | Pivotable stage for microscope system |
| US4125828A (en) | 1972-08-04 | 1978-11-14 | Med-El Inc. | Method and apparatus for automated classification and analysis of cells |
| US4196265A (en) | 1977-06-15 | 1980-04-01 | The Wistar Institute | Method of producing antibodies |
| US4210419A (en) | 1978-02-17 | 1980-07-01 | California Institute Of Technology | Automated quantitative muscle biopsy analysis system |
| US4249825A (en) | 1979-05-14 | 1981-02-10 | The Trustees Of Boston University | Method and apparatus suitable for ocular blood flow analysis |
| US4338024A (en) | 1980-05-02 | 1982-07-06 | International Remote Imaging Systems, Inc. | Flow analyzer and system for analysis of fluids with particles |
| US4342905A (en) | 1979-08-31 | 1982-08-03 | Nippon Kogaku K.K. | Automatic focusing device of a microscope |
| US4393466A (en) | 1980-09-12 | 1983-07-12 | International Remote Imaging Systems | Method of analyzing particles in a dilute fluid sample |
| US4513438A (en) | 1982-04-15 | 1985-04-23 | Coulter Electronics, Inc. | Automated microscopy system and method for locating and re-locating objects in an image |
| DE3340647A1 (en) | 1983-11-10 | 1985-05-23 | Will Wetzlar Gmbh, 6330 Wetzlar | Method for focusing a microscope and microscope for carrying out the method |
| US4612614A (en) | 1980-09-12 | 1986-09-16 | International Remote Imaging Systems, Inc. | Method of analyzing particles in a fluid sample |
| EP0213666A1 (en) | 1985-08-21 | 1987-03-11 | North American Philips Corporation | Method and apparatus for displaying a single parameter image |
| US4656594A (en) | 1985-05-06 | 1987-04-07 | National Biomedical Research Foundation | Operator-interactive automated chromosome analysis system producing a karyotype |
| US4673973A (en) | 1985-02-04 | 1987-06-16 | National Biomedical Research Foundation | Split-image, multi-power microscopic image display system and method |
| US4700298A (en) | 1984-09-14 | 1987-10-13 | Branko Palcic | Dynamic microscope image processing scanner |
| US4710472A (en) | 1985-09-25 | 1987-12-01 | The United States Of America As Represented By The Secretary Of The Navy | Magnetic separation device |
| US4741043A (en) | 1985-11-04 | 1988-04-26 | Cell Analysis Systems, Inc. | Method of and an apparatus for image analyses of biological specimens |
| US4777525A (en) | 1985-12-23 | 1988-10-11 | Preston Jr Kendall | Apparatus and method for a multi-resolution electro-optical imaging, display and storage/retrieval system |
| JPS63256916A (en) | 1987-04-15 | 1988-10-24 | Toshiba Corp | Electronic endoscope device |
| DE3735091C2 (en) | 1986-10-16 | 1990-02-08 | Olympus Optical Co., Ltd., Tokio/Tokyo, Jp | |
| US4945220A (en) | 1988-11-16 | 1990-07-31 | Prometrix Corporation | Autofocusing system for microscope having contrast detection means |
| US4965725A (en) | 1988-04-08 | 1990-10-23 | Nueromedical Systems, Inc. | Neural network based automated cytological specimen classification system and method |
| US4991223A (en) | 1988-06-30 | 1991-02-05 | American Innovision, Inc. | Apparatus and method for recognizing image features using color elements |
| US5003165A (en) | 1989-05-25 | 1991-03-26 | International Remote Imaging Systems, Inc. | Method and an apparatus for selecting the best focal position from a plurality of focal positions |
| US5008185A (en) | 1985-11-04 | 1991-04-16 | Cell Analysis Systems, Inc. | Methods and apparatus for the quantitation of nuclear proteins |
| US5016173A (en) | 1989-04-13 | 1991-05-14 | Vanguard Imaging Ltd. | Apparatus and method for monitoring visually accessible surfaces of the body |
| US5051816A (en) | 1990-10-29 | 1991-09-24 | At&T Bell Laboratories | Pixel generator test set |
| US5053344A (en) | 1987-08-04 | 1991-10-01 | Cleveland Clinic Foundation | Magnetic field separation and analysis system |
| US5068909A (en) | 1989-05-18 | 1991-11-26 | Applied Imaging Corporation | Method and apparatus for generating quantifiable video displays |
| EP0468705A2 (en) | 1990-07-25 | 1992-01-29 | Hitachi, Ltd. | Method and apparatus for investigating and controlling an object |
| US5085325A (en) | 1988-03-08 | 1992-02-04 | Simco/Ramic Corporation | Color sorting system and method |
| US5087965A (en) | 1989-06-28 | 1992-02-11 | American Innovision, Inc. | Recognition of image colors using arbitrary shapes in color space |
| US5123055A (en) | 1989-08-10 | 1992-06-16 | International Remote Imaging Systems, Inc. | Method and an apparatus for differentiating a sample of biological cells |
| WO1992017848A1 (en) | 1991-04-01 | 1992-10-15 | THE UNITED STATES GOVERNMENT, as represented by THE SECRETARY, DEPARTMENT OF HEALTH AND HUMAN SERVICES | Automated method and apparatus for determining characteristics of nerve fibers |
| US5202931A (en) | 1987-10-06 | 1993-04-13 | Cell Analysis Systems, Inc. | Methods and apparatus for the quantitation of nuclear protein |
| US5233684A (en) | 1990-06-26 | 1993-08-03 | Digital Equipment Corporation | Method and apparatus for mapping a digital color image from a first color space to a second color space |
| EP0557871A2 (en) | 1992-02-18 | 1993-09-01 | Cell Analysis Systems, Inc. | Method and apparatus for automated assay of biological specimens |
| JPH0560616B2 (en) | 1986-09-30 | 1993-09-02 | Fujitsu Ltd | |
| US5254845A (en) | 1992-08-18 | 1993-10-19 | Applied Imaging International Limited | Automatic focusing system using focal length-changing element |
| US5257182A (en) | 1991-01-29 | 1993-10-26 | Neuromedical Systems, Inc. | Morphological classification system and method |
| US5268966A (en) | 1989-08-10 | 1993-12-07 | International Remote Imaging Systems, Inc. | Method of differentiating particles based upon a dynamically changing threshold |
| US5275951A (en) | 1991-06-13 | 1994-01-04 | Abbott Laboratories | Liquid level sensing method and device |
| US5317140A (en) | 1992-11-24 | 1994-05-31 | Dunthorn David I | Diffusion-assisted position location particularly for visual pen detection |
| US5321545A (en) | 1988-10-21 | 1994-06-14 | Biocom S.A. | Microscope stage for rapid and indexed analysis of filters and other media carrying multiple samples, and a method of analyzing such samples using said stage |
| US5333207A (en) | 1990-11-07 | 1994-07-26 | Neuromedical Systems, Inc. | Inspection apparatus and method with inspection auditing for images presented on a display |
| US5338924A (en) | 1992-08-11 | 1994-08-16 | Lasa Industries, Inc. | Apparatus and method for automatic focusing of light using a fringe plate |
| US5352613A (en) | 1993-10-07 | 1994-10-04 | Tafas Triantafillos P | Cytological screening method |
| US5375177A (en) | 1991-09-27 | 1994-12-20 | E. I. Du Pont De Nemours And Company | Method of identifying and characterizing a valid object by color |
| US5409007A (en) | 1993-11-26 | 1995-04-25 | General Electric Company | Filter to reduce speckle artifact in ultrasound imaging |
| US5432871A (en) | 1993-08-04 | 1995-07-11 | Universal Systems & Technology, Inc. | Systems and methods for interactive image data acquisition and compression |
| US5449622A (en) | 1993-02-16 | 1995-09-12 | Yabe; Ryohei | Method and apparatus for analyzing stained particles |
| US5450502A (en) | 1993-10-07 | 1995-09-12 | Xerox Corporation | Image-dependent luminance enhancement |
| US5459384A (en) | 1992-04-30 | 1995-10-17 | Becton Dickinson And Company | Method and apparatus for controlling coordinate displacements of a platform |
| US5463470A (en) | 1991-10-09 | 1995-10-31 | Fuji Photo Film Co., Ltd. | Methods of collecting photometric image data and determining light exposure by extracting feature image data from an original image |
| US5469353A (en) | 1993-11-26 | 1995-11-21 | Access Radiology Corp. | Radiological image interpretation apparatus and method |
| US5473706A (en) | 1991-09-23 | 1995-12-05 | Becton Dickinson And Company | Method and apparatus for automated assay of biological specimens |
| US5481401A (en) | 1991-05-16 | 1996-01-02 | Olympus Optical Co., Ltd. | Ultraviolet microscope |
| US5499097A (en) | 1994-09-19 | 1996-03-12 | Neopath, Inc. | Method and apparatus for checking automated optical system performance repeatability |
| US5515172A (en) | 1993-07-19 | 1996-05-07 | Xerox Corporation | Apparatus and method for enhanced color to color conversion |
| EP0713086A1 (en) | 1994-11-17 | 1996-05-22 | Chemunex | Apparatus and process for the detection and counting of rarely occurring mammalian cells |
| US5526258A (en) | 1990-10-10 | 1996-06-11 | Cell Analysis System, Inc. | Method and apparatus for automated analysis of biological specimens |
| US5533628A (en) | 1992-03-06 | 1996-07-09 | Agri Tech Incorporated | Method and apparatus for sorting objects by color including stable color transformation |
| US5548661A (en)* | 1991-07-12 | 1996-08-20 | Price; Jeffrey H. | Operator independent image cytometer |
| US5583666A (en) | 1993-02-12 | 1996-12-10 | Eastman Kodak Company | Method for cross-device color calibration and enhancement using explicit constraints |
| US5585469A (en) | 1993-10-08 | 1996-12-17 | Hitachi, Ltd. | Dyeing agent having at least two dyes for staining a biological sample and staining method employing the dyeing agent |
| US5586160A (en) | 1995-03-20 | 1996-12-17 | The Regents Of The University Of California | Automated analysis for microcalcifications in high resolution digital mammograms |
| US5602941A (en) | 1993-05-21 | 1997-02-11 | Digital Equipment Corporation | Input modification system for multilevel dithering |
| US5602674A (en) | 1993-07-09 | 1997-02-11 | Compucyte Corp. | Computerized specimen encoder |
| US5619032A (en) | 1995-01-18 | 1997-04-08 | International Remote Imaging Systems, Inc. | Method and apparatus for automatically selecting the best focal position from a plurality of focal positions for a focusing apparatus |
| US5625709A (en) | 1994-12-23 | 1997-04-29 | International Remote Imaging Systems, Inc. | Method and apparatus for identifying characteristics of an object in a field of view |
| US5625705A (en)* | 1994-06-03 | 1997-04-29 | Neuromedical Systems, Inc. | Intensity texture based classification system and method |
| US5635402A (en) | 1992-03-05 | 1997-06-03 | Alfano; Robert R. | Technique for determining whether a cell is malignant as opposed to non-malignant using extrinsic fluorescence spectroscopy |
| US5647025A (en)* | 1994-09-20 | 1997-07-08 | Neopath, Inc. | Automatic focusing of biomedical specimens apparatus |
| US5646677A (en) | 1995-02-23 | 1997-07-08 | Motorola, Inc. | Method and apparatus for interactively viewing wide-angle images from terrestrial, space, and underwater viewpoints |
| WO1997020198A3 (en) | 1995-11-30 | 1997-08-28 | Xl Vision Inc | Method and apparatus for automated image analysis of biological specimens |
| US5671288A (en) | 1995-05-31 | 1997-09-23 | Neopath, Inc. | Method and apparatus for assessing slide and specimen preparation quality |
| US5690892A (en) | 1995-09-15 | 1997-11-25 | Accumed, Inc. | Cassette for use with automated specimen handling system |
| US5691779A (en) | 1994-04-14 | 1997-11-25 | Matsushita Electric Industrial Co., Ltd. | Color conversion apparatus that restricts the color reproduction range of primary color signals |
| US5701172A (en) | 1995-06-07 | 1997-12-23 | Gas Research Institute | Optical flowmeter |
| US5706093A (en) | 1995-12-05 | 1998-01-06 | Olympus Optical Co., Ltd. | Color classification apparatus |
| US5726009A (en) | 1989-03-20 | 1998-03-10 | Anticancer, Inc. | Native-state method and system for determining viability and proliferative capacity of tissues in vitro |
| US5731156A (en) | 1996-10-21 | 1998-03-24 | Applied Imaging, Inc. | Use of anti-embryonic hemoglobin antibodies to identify fetal cells |
| US5735387A (en) | 1995-07-14 | 1998-04-07 | Chiron Diagnostics Corporation | Specimen rack handling system |
| US5740267A (en) | 1992-05-29 | 1998-04-14 | Echerer; Scott J. | Radiographic image enhancement comparison and storage requirement reduction system |
| US5740270A (en) | 1988-04-08 | 1998-04-14 | Neuromedical Systems, Inc. | Automated cytological specimen classification system and method |
| US5773459A (en) | 1995-06-07 | 1998-06-30 | Sugen, Inc. | Urea- and thiourea-type compounds |
| US5783814A (en) | 1994-01-18 | 1998-07-21 | Ultrapointe Corporation | Method and apparatus for automatically focusing a microscope |
| US5795723A (en) | 1994-05-06 | 1998-08-18 | Fred Hutchinson Cancer Research Center | Expression of neurogenic bHLH genes in primitive neuroectodermal tumors |
| WO1998044333A1 (en) | 1997-03-28 | 1998-10-08 | Chromavision Medical Systems, Inc. | System and method for cellular specimen grading |
| WO1998045407A1 (en) | 1997-04-09 | 1998-10-15 | Childrens Hospital Los Angeles | Magnetic-based selection of heterogeneous cell populations for the treatment of malignant and hematological diseases |
| US5846749A (en) | 1994-10-12 | 1998-12-08 | The Regents Of The University Of California | Quantitative measurement of tissue protein identified by immunohistochemistry and standardized protein determination |
| US5851186A (en) | 1996-02-27 | 1998-12-22 | Atl Ultrasound, Inc. | Ultrasonic diagnostic imaging system with universal access to diagnostic information and images |
| US5854851A (en) | 1993-08-13 | 1998-12-29 | Sophis View Technologies Ltd. | System and method for diagnosis of living tissue diseases using digital image processing |
| US5867598A (en) | 1996-09-26 | 1999-02-02 | Xerox Corporation | Method and apparatus for processing of a JPEG compressed image |
| US5877161A (en) | 1993-08-05 | 1999-03-02 | University Technologies International Inc. | Cyclin D1 negative regulatory activity |
| US5880473A (en) | 1997-07-28 | 1999-03-09 | Applied Imaging, Inc. | Multifluor-fluorescence in-situ hybridization (M-FISH) imaging techniques using multiple multiband filters with image registration |
| US5889881A (en) | 1992-10-14 | 1999-03-30 | Oncometrics Imaging Corp. | Method and apparatus for automatically detecting malignancy-associated changes |
| US5888742A (en) | 1997-10-28 | 1999-03-30 | Incyte Pharmaceuticals, Inc. | Human phospholipid binding proteins |
| US5911003A (en) | 1996-04-26 | 1999-06-08 | Pressco Technology Inc. | Color pattern evaluation system for randomly oriented articles |
| US5911327A (en) | 1996-10-02 | 1999-06-15 | Nippon Steel Corporation | Method of automatically discriminating and separating scraps containing copper from iron scraps |
| US5932872A (en)* | 1994-07-01 | 1999-08-03 | Jeffrey H. Price | Autofocus system for scanning microscopy having a volume image formation |
| US5962237A (en) | 1996-04-05 | 1999-10-05 | The Johns Hopkins University School Of Medicine | Method of enriching rare cells |
| US5966465A (en) | 1994-09-21 | 1999-10-12 | Ricoh Corporation | Compression/decompression using reversible embedded wavelets |
| US5966309A (en) | 1995-02-16 | 1999-10-12 | Smithkline Beecham Corporation | Clinically testing biological samples |
| US5991028A (en) | 1991-02-22 | 1999-11-23 | Applied Spectral Imaging Ltd. | Spectral bio-imaging methods for cell classification |
| US6006191A (en) | 1996-05-13 | 1999-12-21 | Dirienzo; Andrew L. | Remote access medical image exchange system and methods of operation therefor |
| US6007996A (en) | 1995-12-12 | 1999-12-28 | Applied Spectral Imaging Ltd. | In situ method of analyzing cells |
| US6011595A (en) | 1997-09-19 | 2000-01-04 | Eastman Kodak Company | Method for segmenting a digital image into a foreground region and a key color region |
| US6031929A (en) | 1996-07-18 | 2000-02-29 | University Of Pittsburgh | Image facsimile with real time image segmentation |
| US6031930A (en) | 1996-08-23 | 2000-02-29 | Bacus Research Laboratories, Inc. | Method and apparatus for testing a progression of neoplasia including cancer chemoprevention testing |
| US6040139A (en) | 1995-09-19 | 2000-03-21 | Bova; G. Steven | Laser cell purification system |
| US6058208A (en) | 1994-10-26 | 2000-05-02 | Matsushita Electric Industrial Co., Ltd. | Color correction device and color correction method |
| US6058322A (en) | 1997-07-25 | 2000-05-02 | Arch Development Corporation | Methods for improving the accuracy in differential diagnosis on radiologic examinations |
| US6072570A (en) | 1997-07-24 | 2000-06-06 | Innotech | Image quality mapper for progressive eyeglasses |
| US6091842A (en) | 1996-10-25 | 2000-07-18 | Accumed International, Inc. | Cytological specimen analysis system with slide mapping and generation of viewing path information |
| US6097838A (en) | 1996-12-19 | 2000-08-01 | Xerox Corporation | Color correction of a compressed image |
| WO2000049391A1 (en) | 1999-02-18 | 2000-08-24 | Bio-View Ltd. | System and method for identifying and analyzing rare cell types in a mixed population of cells |
| US6117985A (en) | 1995-06-16 | 2000-09-12 | Stemcell Technologies Inc. | Antibody compositions for preparing enriched cell preparations |
| US6122400A (en) | 1997-09-26 | 2000-09-19 | Sarnoff Corporation | Compression encoder bit allocation utilizing colormetric-adaptive weighting as in flesh-tone weighting |
| US6125194A (en) | 1996-02-06 | 2000-09-26 | Caelum Research Corporation | Method and system for re-screening nodules in radiological images using multi-resolution processing, neural network, and image processing |
| US6141602A (en) | 1997-09-25 | 2000-10-31 | Hitachi, Ltd. | Specimen processing system |
| US6151535A (en) | 1998-05-04 | 2000-11-21 | Olympus Diagnostica Gmbh | Laboratory primary sample distributor with archiving mode |
| US6150089A (en)* | 1988-09-15 | 2000-11-21 | New York University | Method and characterizing polymer molecules or the like |
| US6169816B1 (en) | 1997-05-14 | 2001-01-02 | Applied Imaging, Inc. | Identification of objects of interest using multiple illumination schemes and finding overlap of features in corresponding multiple images |
| US6215894B1 (en) | 1999-02-26 | 2001-04-10 | General Scanning, Incorporated | Automatic imaging and analysis of microarray biochips |
| US6225636B1 (en) | 1996-10-25 | 2001-05-01 | Applied Imaging, Inc. | Multifluor-fluorescence in-situ hybridization (M-FISH) imaging techniques using multiple multiband filters with image registration |
| US6226636B1 (en) | 1998-11-20 | 2001-05-01 | Philips Electronics North America Corp. | System for retrieving images using a database |
| US6236031B1 (en) | 1998-09-04 | 2001-05-22 | Sony Corporation | Optical head, recording and/or reproducing apparatus, and optical disc drive with an auxiliary focus servo system |
| WO2001037206A1 (en) | 1999-11-19 | 2001-05-25 | Applied Imaging Corporation | Identification of objects of interest using a combination of multiple illumination schemes |
| US6238892B1 (en) | 1991-10-25 | 2001-05-29 | N.V. Innogenetics S.A. | Monoclonal antibodies directed against the microtubule-associated protein tau |
| US6272235B1 (en) | 1997-03-03 | 2001-08-07 | Bacus Research Laboratories, Inc. | Method and apparatus for creating a virtual microscope slide |
| WO2001057785A1 (en) | 2000-02-01 | 2001-08-09 | Chromavision Medical Systems, Inc. | Method and apparatus for automated image analysis of biological specimens |
| US6281874B1 (en) | 1998-08-27 | 2001-08-28 | International Business Machines Corporation | Method and system for downloading graphic images on the internet |
| US6290907B1 (en) | 1997-09-11 | 2001-09-18 | Hitachi, Ltd. | Sample handling system |
| US6301025B1 (en) | 1994-06-24 | 2001-10-09 | Mgi Software Corporation | Method for performing a color space transformation |
| US6313452B1 (en) | 1998-06-10 | 2001-11-06 | Sarnoff Corporation | Microscopy system utilizing a plurality of images for enhanced image processing capabilities |
| US6365362B1 (en) | 1998-02-12 | 2002-04-02 | Immunivest Corporation | Methods and reagents for the rapid and efficient isolation of circulating cancer cells |
| US6374989B1 (en) | 1997-11-14 | 2002-04-23 | Bayer Corporation | Conveyor system for clinical test apparatus |
| US6396941B1 (en) | 1996-08-23 | 2002-05-28 | Bacus Research Laboratories, Inc. | Method and apparatus for internet, intranet, and local viewing of virtual microscope slides |
| US20020067409A1 (en) | 2000-12-06 | 2002-06-06 | Bio-View Ltd. | Data acquisition and display system and method |
| US6404906B2 (en) | 1997-03-03 | 2002-06-11 | Bacus Research Laboratories,Inc. | Method and apparatus for acquiring and reconstructing magnified specimen images from a computer-controlled microscope |
| WO2000062247A9 (en) | 1999-04-13 | 2002-06-13 | Chromavision Med Sys Inc | Histological reconstruction and automated image analysis |
| US6418236B1 (en) | 1999-06-24 | 2002-07-09 | Chromavision Medical Systems, Inc. | Histological reconstruction and automated image analysis |
| US6466690B2 (en) | 2000-12-19 | 2002-10-15 | Bacus Research Laboratories, Inc. | Method and apparatus for processing an image of a tissue sample microarray |
| US20020164810A1 (en) | 2000-12-05 | 2002-11-07 | Vysis | Method and system for diagnosing pathology in biological samples by detection of infrared spectral markers |
| US6518554B1 (en) | 2000-05-24 | 2003-02-11 | Chromavision Medical Systems, Inc. | Reverse focusing methods and systems |
| WO2003014795A1 (en) | 2001-08-06 | 2003-02-20 | Bioview Ltd. | Image focusing in fluorescent imaging |
| US20030124589A1 (en) | 2001-10-12 | 2003-07-03 | Vysis, Inc. | Imaging microarrays |
| US20030170703A1 (en) | 2002-01-15 | 2003-09-11 | Vysis, Inc., A Corporation Of The State Of Delaware | Method and/or system for analyzing biological samples using a computer system |
| US6671393B2 (en) | 1995-11-30 | 2003-12-30 | Chromavision Medical Systems, Inc. | Automated method for image analysis of residual protein |
| US6674896B1 (en) | 1999-07-13 | 2004-01-06 | Chromavision Medical Systems, Inc. | Device for applying accurate color thresholds in real time |
| US6697509B2 (en) | 2001-10-04 | 2004-02-24 | Chromavision Medical Systems, Inc. | Method and apparatus for scoring the uptake of markers in cells |
| US6718053B1 (en) | 1996-11-27 | 2004-04-06 | Chromavision Medical Systems, Inc. | Method and apparatus for automated image analysis of biological specimens |
Family Cites Families (8)
| Publication number | Priority date | Publication date | Assignee | Title |
|---|---|---|---|---|
| US587272A (en)* | 1897-07-27 | Oiling device | ||
| BR8107605A (en)* | 1981-11-23 | 1983-07-05 | Oce Nederland Bv | DIAZOTYPE MATERIAL |
| US5085965A (en)* | 1989-03-27 | 1992-02-04 | Ricoh Company, Ltd. | Negative toner for developing latent electrostatic images |
| US5966456A (en)* | 1990-02-05 | 1999-10-12 | Cummins-Allison Corp. | Method and apparatus for discriminating and counting documents |
| US5655029A (en)* | 1990-11-07 | 1997-08-05 | Neuromedical Systems, Inc. | Device and method for facilitating inspection of a specimen |
| AU647609B2 (en)* | 1991-04-18 | 1994-03-24 | Becton Dickinson & Company | Microbial monitoring device |
| EP0658000A3 (en)* | 1993-12-08 | 1996-04-03 | At & T Corp | A fast comparator circuit. |
| DE19617476A1 (en)* | 1996-05-02 | 1997-11-06 | Francotyp Postalia Gmbh | Method and arrangement for data processing in a mail processing system with a franking machine |
- 2000
- 2000-02-01USUS09/495,461patent/US6718053B1/ennot_activeExpired - Lifetime
- 2003
- 2003-12-24USUS10/746,515patent/US7190818B2/ennot_activeExpired - Fee Related
- 2007
- 2007-03-13USUS11/685,717patent/US7428325B2/ennot_activeExpired - Fee Related
Patent Citations (182)
| Publication number | Priority date | Publication date | Assignee | Title |
|---|---|---|---|---|
| US3824393A (en) | 1971-08-25 | 1974-07-16 | American Express Invest | System for differential particle counting |
| US4125828A (en) | 1972-08-04 | 1978-11-14 | Med-El Inc. | Method and apparatus for automated classification and analysis of cells |
| US3851972A (en) | 1973-10-18 | 1974-12-03 | Coulter Electronics | Automatic method and system for analysis and review of a plurality of stored slides |
| US4011004A (en) | 1975-02-06 | 1977-03-08 | Geometric Data Corporation | Pivotable stage for microscope system |
| US4196265A (en) | 1977-06-15 | 1980-04-01 | The Wistar Institute | Method of producing antibodies |
| US4210419A (en) | 1978-02-17 | 1980-07-01 | California Institute Of Technology | Automated quantitative muscle biopsy analysis system |
| US4249825A (en) | 1979-05-14 | 1981-02-10 | The Trustees Of Boston University | Method and apparatus suitable for ocular blood flow analysis |
| US4342905A (en) | 1979-08-31 | 1982-08-03 | Nippon Kogaku K.K. | Automatic focusing device of a microscope |
| US4338024A (en) | 1980-05-02 | 1982-07-06 | International Remote Imaging Systems, Inc. | Flow analyzer and system for analysis of fluids with particles |
| US4612614A (en) | 1980-09-12 | 1986-09-16 | International Remote Imaging Systems, Inc. | Method of analyzing particles in a fluid sample |
| US4393466A (en) | 1980-09-12 | 1983-07-12 | International Remote Imaging Systems | Method of analyzing particles in a dilute fluid sample |
| US4513438A (en) | 1982-04-15 | 1985-04-23 | Coulter Electronics, Inc. | Automated microscopy system and method for locating and re-locating objects in an image |
| DE3340647A1 (en) | 1983-11-10 | 1985-05-23 | Will Wetzlar Gmbh, 6330 Wetzlar | Method for focusing a microscope and microscope for carrying out the method |
| US4700298A (en) | 1984-09-14 | 1987-10-13 | Branko Palcic | Dynamic microscope image processing scanner |
| US4673973A (en) | 1985-02-04 | 1987-06-16 | National Biomedical Research Foundation | Split-image, multi-power microscopic image display system and method |
| US4656594A (en) | 1985-05-06 | 1987-04-07 | National Biomedical Research Foundation | Operator-interactive automated chromosome analysis system producing a karyotype |
| EP0213666A1 (en) | 1985-08-21 | 1987-03-11 | North American Philips Corporation | Method and apparatus for displaying a single parameter image |
| US4710472A (en) | 1985-09-25 | 1987-12-01 | The United States Of America As Represented By The Secretary Of The Navy | Magnetic separation device |
| US4741043A (en) | 1985-11-04 | 1988-04-26 | Cell Analysis Systems, Inc. | Method of and an apparatus for image analyses of biological specimens |
| US4741043B1 (en) | 1985-11-04 | 1994-08-09 | Cell Analysis Systems Inc | Method of and apparatus for image analyses of biological specimens |
| US5008185A (en) | 1985-11-04 | 1991-04-16 | Cell Analysis Systems, Inc. | Methods and apparatus for the quantitation of nuclear proteins |
| US5018209A (en) | 1985-11-04 | 1991-05-21 | Cell Analysis Systems, Inc. | Analysis method and apparatus for biological specimens |
| US4777525A (en) | 1985-12-23 | 1988-10-11 | Preston Jr Kendall | Apparatus and method for a multi-resolution electro-optical imaging, display and storage/retrieval system |
| JPH0560616B2 (en) | 1986-09-30 | 1993-09-02 | Fujitsu Ltd | |
| DE3735091C2 (en) | 1986-10-16 | 1990-02-08 | Olympus Optical Co., Ltd., Tokio/Tokyo, Jp | |
| JPS63256916A (en) | 1987-04-15 | 1988-10-24 | Toshiba Corp | Electronic endoscope device |
| US5053344A (en) | 1987-08-04 | 1991-10-01 | Cleveland Clinic Foundation | Magnetic field separation and analysis system |
| US5202931A (en) | 1987-10-06 | 1993-04-13 | Cell Analysis Systems, Inc. | Methods and apparatus for the quantitation of nuclear protein |
| US5085325A (en) | 1988-03-08 | 1992-02-04 | Simco/Ramic Corporation | Color sorting system and method |
| US5740270A (en) | 1988-04-08 | 1998-04-14 | Neuromedical Systems, Inc. | Automated cytological specimen classification system and method |
| US4965725B1 (en) | 1988-04-08 | 1996-05-07 | Neuromedical Systems Inc | Neural network based automated cytological specimen classification system and method |
| US5287272A (en)* | 1988-04-08 | 1994-02-15 | Neuromedical Systems, Inc. | Automated cytological specimen classification system and method |
| US4965725A (en) | 1988-04-08 | 1990-10-23 | Nueromedical Systems, Inc. | Neural network based automated cytological specimen classification system and method |
| US5287272B1 (en)* | 1988-04-08 | 1996-08-27 | Neuromedical Systems Inc | Automated cytological specimen classification system and method |
| US4991223A (en) | 1988-06-30 | 1991-02-05 | American Innovision, Inc. | Apparatus and method for recognizing image features using color elements |
| US6150089A (en)* | 1988-09-15 | 2000-11-21 | New York University | Method and characterizing polymer molecules or the like |
| US5321545A (en) | 1988-10-21 | 1994-06-14 | Biocom S.A. | Microscope stage for rapid and indexed analysis of filters and other media carrying multiple samples, and a method of analyzing such samples using said stage |
| US4945220A (en) | 1988-11-16 | 1990-07-31 | Prometrix Corporation | Autofocusing system for microscope having contrast detection means |
| US5726009A (en) | 1989-03-20 | 1998-03-10 | Anticancer, Inc. | Native-state method and system for determining viability and proliferative capacity of tissues in vitro |
| US5016173A (en) | 1989-04-13 | 1991-05-14 | Vanguard Imaging Ltd. | Apparatus and method for monitoring visually accessible surfaces of the body |
| US5068909A (en) | 1989-05-18 | 1991-11-26 | Applied Imaging Corporation | Method and apparatus for generating quantifiable video displays |
| US5003165A (en) | 1989-05-25 | 1991-03-26 | International Remote Imaging Systems, Inc. | Method and an apparatus for selecting the best focal position from a plurality of focal positions |
| US5087965A (en) | 1989-06-28 | 1992-02-11 | American Innovision, Inc. | Recognition of image colors using arbitrary shapes in color space |
| US5123055A (en) | 1989-08-10 | 1992-06-16 | International Remote Imaging Systems, Inc. | Method and an apparatus for differentiating a sample of biological cells |
| US5268966A (en) | 1989-08-10 | 1993-12-07 | International Remote Imaging Systems, Inc. | Method of differentiating particles based upon a dynamically changing threshold |
| US5233684A (en) | 1990-06-26 | 1993-08-03 | Digital Equipment Corporation | Method and apparatus for mapping a digital color image from a first color space to a second color space |
| EP0468705A2 (en) | 1990-07-25 | 1992-01-29 | Hitachi, Ltd. | Method and apparatus for investigating and controlling an object |
| US5526258A (en) | 1990-10-10 | 1996-06-11 | Cell Analysis System, Inc. | Method and apparatus for automated analysis of biological specimens |
| US5051816A (en) | 1990-10-29 | 1991-09-24 | At&T Bell Laboratories | Pixel generator test set |
| US5333207A (en) | 1990-11-07 | 1994-07-26 | Neuromedical Systems, Inc. | Inspection apparatus and method with inspection auditing for images presented on a display |
| US5257182B1 (en) | 1991-01-29 | 1996-05-07 | Neuromedical Systems Inc | Morphological classification system and method |
| US5257182A (en) | 1991-01-29 | 1993-10-26 | Neuromedical Systems, Inc. | Morphological classification system and method |
| US5991028A (en) | 1991-02-22 | 1999-11-23 | Applied Spectral Imaging Ltd. | Spectral bio-imaging methods for cell classification |
| WO1992017848A1 (en) | 1991-04-01 | 1992-10-15 | THE UNITED STATES GOVERNMENT, as represented by THE SECRETARY, DEPARTMENT OF HEALTH AND HUMAN SERVICES | Automated method and apparatus for determining characteristics of nerve fibers |
| US5231580A (en) | 1991-04-01 | 1993-07-27 | The United States Of America As Represented By The Secretary Of The Department Of Health And Human Services | Automated method and apparatus for determining characteristics of nerve fibers |
| US5481401A (en) | 1991-05-16 | 1996-01-02 | Olympus Optical Co., Ltd. | Ultraviolet microscope |
| US5275951A (en) | 1991-06-13 | 1994-01-04 | Abbott Laboratories | Liquid level sensing method and device |
| US5548661A (en)* | 1991-07-12 | 1996-08-20 | Price; Jeffrey H. | Operator independent image cytometer |
| US5428690A (en) | 1991-09-23 | 1995-06-27 | Becton Dickinson And Company | Method and apparatus for automated assay of biological specimens |
| US5473706A (en) | 1991-09-23 | 1995-12-05 | Becton Dickinson And Company | Method and apparatus for automated assay of biological specimens |
| US5375177A (en) | 1991-09-27 | 1994-12-20 | E. I. Du Pont De Nemours And Company | Method of identifying and characterizing a valid object by color |
| US5463470A (en) | 1991-10-09 | 1995-10-31 | Fuji Photo Film Co., Ltd. | Methods of collecting photometric image data and determining light exposure by extracting feature image data from an original image |
| US6238892B1 (en) | 1991-10-25 | 2001-05-29 | N.V. Innogenetics S.A. | Monoclonal antibodies directed against the microtubule-associated protein tau |
| EP0557871A2 (en) | 1992-02-18 | 1993-09-01 | Cell Analysis Systems, Inc. | Method and apparatus for automated assay of biological specimens |
| US5635402A (en) | 1992-03-05 | 1997-06-03 | Alfano; Robert R. | Technique for determining whether a cell is malignant as opposed to non-malignant using extrinsic fluorescence spectroscopy |
| US5799105A (en) | 1992-03-06 | 1998-08-25 | Agri-Tech, Inc. | Method for calibrating a color sorting apparatus |
| US5533628A (en) | 1992-03-06 | 1996-07-09 | Agri Tech Incorporated | Method and apparatus for sorting objects by color including stable color transformation |
| US5459384A (en) | 1992-04-30 | 1995-10-17 | Becton Dickinson And Company | Method and apparatus for controlling coordinate displacements of a platform |
| US5740267A (en) | 1992-05-29 | 1998-04-14 | Echerer; Scott J. | Radiographic image enhancement comparison and storage requirement reduction system |
| US5338924A (en) | 1992-08-11 | 1994-08-16 | Lasa Industries, Inc. | Apparatus and method for automatic focusing of light using a fringe plate |
| US5254845A (en) | 1992-08-18 | 1993-10-19 | Applied Imaging International Limited | Automatic focusing system using focal length-changing element |
| US5889881A (en) | 1992-10-14 | 1999-03-30 | Oncometrics Imaging Corp. | Method and apparatus for automatically detecting malignancy-associated changes |
| US5317140A (en) | 1992-11-24 | 1994-05-31 | Dunthorn David I | Diffusion-assisted position location particularly for visual pen detection |
| US5583666A (en) | 1993-02-12 | 1996-12-10 | Eastman Kodak Company | Method for cross-device color calibration and enhancement using explicit constraints |
| US5449622A (en) | 1993-02-16 | 1995-09-12 | Yabe; Ryohei | Method and apparatus for analyzing stained particles |
| US5602941A (en) | 1993-05-21 | 1997-02-11 | Digital Equipment Corporation | Input modification system for multilevel dithering |
| US5602674A (en) | 1993-07-09 | 1997-02-11 | Compucyte Corp. | Computerized specimen encoder |
| US5515172A (en) | 1993-07-19 | 1996-05-07 | Xerox Corporation | Apparatus and method for enhanced color to color conversion |
| US5432871A (en) | 1993-08-04 | 1995-07-11 | Universal Systems & Technology, Inc. | Systems and methods for interactive image data acquisition and compression |
| US5877161A (en) | 1993-08-05 | 1999-03-02 | University Technologies International Inc. | Cyclin D1 negative regulatory activity |
| US5854851A (en) | 1993-08-13 | 1998-12-29 | Sophis View Technologies Ltd. | System and method for diagnosis of living tissue diseases using digital image processing |
| US5352613A (en) | 1993-10-07 | 1994-10-04 | Tafas Triantafillos P | Cytological screening method |
| US5450502A (en) | 1993-10-07 | 1995-09-12 | Xerox Corporation | Image-dependent luminance enhancement |
| US5585469A (en) | 1993-10-08 | 1996-12-17 | Hitachi, Ltd. | Dyeing agent having at least two dyes for staining a biological sample and staining method employing the dyeing agent |
| US5409007A (en) | 1993-11-26 | 1995-04-25 | General Electric Company | Filter to reduce speckle artifact in ultrasound imaging |
| US5469353A (en) | 1993-11-26 | 1995-11-21 | Access Radiology Corp. | Radiological image interpretation apparatus and method |
| US5783814A (en) | 1994-01-18 | 1998-07-21 | Ultrapointe Corporation | Method and apparatus for automatically focusing a microscope |
| US5691779A (en) | 1994-04-14 | 1997-11-25 | Matsushita Electric Industrial Co., Ltd. | Color conversion apparatus that restricts the color reproduction range of primary color signals |
| US5795723A (en) | 1994-05-06 | 1998-08-18 | Fred Hutchinson Cancer Research Center | Expression of neurogenic bHLH genes in primitive neuroectodermal tumors |
| US5625705A (en)* | 1994-06-03 | 1997-04-29 | Neuromedical Systems, Inc. | Intensity texture based classification system and method |
| US6301025B1 (en) | 1994-06-24 | 2001-10-09 | Mgi Software Corporation | Method for performing a color space transformation |
| US5932872A (en)* | 1994-07-01 | 1999-08-03 | Jeffrey H. Price | Autofocus system for scanning microscopy having a volume image formation |
| US5499097A (en) | 1994-09-19 | 1996-03-12 | Neopath, Inc. | Method and apparatus for checking automated optical system performance repeatability |
| US5647025A (en)* | 1994-09-20 | 1997-07-08 | Neopath, Inc. | Automatic focusing of biomedical specimens apparatus |
| US5966465A (en) | 1994-09-21 | 1999-10-12 | Ricoh Corporation | Compression/decompression using reversible embedded wavelets |
| US5846749A (en) | 1994-10-12 | 1998-12-08 | The Regents Of The University Of California | Quantitative measurement of tissue protein identified by immunohistochemistry and standardized protein determination |
| US6058208A (en) | 1994-10-26 | 2000-05-02 | Matsushita Electric Industrial Co., Ltd. | Color correction device and color correction method |
| EP0713086A1 (en) | 1994-11-17 | 1996-05-22 | Chemunex | Apparatus and process for the detection and counting of rarely occurring mammalian cells |
| US5625709A (en) | 1994-12-23 | 1997-04-29 | International Remote Imaging Systems, Inc. | Method and apparatus for identifying characteristics of an object in a field of view |
| US5619032A (en) | 1995-01-18 | 1997-04-08 | International Remote Imaging Systems, Inc. | Method and apparatus for automatically selecting the best focal position from a plurality of focal positions for a focusing apparatus |
| US5966309A (en) | 1995-02-16 | 1999-10-12 | Smithkline Beecham Corporation | Clinically testing biological samples |
| US5646677A (en) | 1995-02-23 | 1997-07-08 | Motorola, Inc. | Method and apparatus for interactively viewing wide-angle images from terrestrial, space, and underwater viewpoints |
| US5586160A (en) | 1995-03-20 | 1996-12-17 | The Regents Of The University Of California | Automated analysis for microcalcifications in high resolution digital mammograms |
| US5671288A (en) | 1995-05-31 | 1997-09-23 | Neopath, Inc. | Method and apparatus for assessing slide and specimen preparation quality |
| US5773459A (en) | 1995-06-07 | 1998-06-30 | Sugen, Inc. | Urea- and thiourea-type compounds |
| US5701172A (en) | 1995-06-07 | 1997-12-23 | Gas Research Institute | Optical flowmeter |
| US6117985A (en) | 1995-06-16 | 2000-09-12 | Stemcell Technologies Inc. | Antibody compositions for preparing enriched cell preparations |
| US5735387A (en) | 1995-07-14 | 1998-04-07 | Chiron Diagnostics Corporation | Specimen rack handling system |
| US5690892A (en) | 1995-09-15 | 1997-11-25 | Accumed, Inc. | Cassette for use with automated specimen handling system |
| US6040139A (en) | 1995-09-19 | 2000-03-21 | Bova; G. Steven | Laser cell purification system |
| EP0864082B1 (en) | 1995-11-30 | 2003-04-02 | Chromavision Medical Systems, Inc. | Method for automated image analysis of biological specimens |
| EP1300713A2 (en) | 1995-11-30 | 2003-04-09 | Chromavision Medical Systems, Inc. | Method and apparatus for automated image analysis of biological specimens |
| US6215892B1 (en) | 1995-11-30 | 2001-04-10 | Chromavision Medical Systems, Inc. | Method and apparatus for automated image analysis of biological specimens |
| US6553135B1 (en) | 1995-11-30 | 2003-04-22 | Chromavision Medical Systems, Inc. | Method and apparatus for automated image analysis of biological specimens |
| US6671393B2 (en) | 1995-11-30 | 2003-12-30 | Chromavision Medical Systems, Inc. | Automated method for image analysis of residual protein |
| US6920239B2 (en) | 1995-11-30 | 2005-07-19 | Chromavision Medical Systems, Inc. | Method and apparatus for automated image analysis of biological specimens |
| US20050185832A1 (en) | 1995-11-30 | 2005-08-25 | Douglass James W. | Method and apparatus for automated image analysis of biological specimens |
| US7133545B2 (en) | 1995-11-30 | 2006-11-07 | Clarient, Inc. | Method and apparatus for automated image analysis of biological specimens |
| WO1997020198A3 (en) | 1995-11-30 | 1997-08-28 | Xl Vision Inc | Method and apparatus for automated image analysis of biological specimens |
| US5706093A (en) | 1995-12-05 | 1998-01-06 | Olympus Optical Co., Ltd. | Color classification apparatus |
| US6007996A (en) | 1995-12-12 | 1999-12-28 | Applied Spectral Imaging Ltd. | In situ method of analyzing cells |
| US6125194A (en) | 1996-02-06 | 2000-09-26 | Caelum Research Corporation | Method and system for re-screening nodules in radiological images using multi-resolution processing, neural network, and image processing |
| US5851186A (en) | 1996-02-27 | 1998-12-22 | Atl Ultrasound, Inc. | Ultrasonic diagnostic imaging system with universal access to diagnostic information and images |
| US5962237A (en) | 1996-04-05 | 1999-10-05 | The Johns Hopkins University School Of Medicine | Method of enriching rare cells |
| US5911003A (en) | 1996-04-26 | 1999-06-08 | Pressco Technology Inc. | Color pattern evaluation system for randomly oriented articles |
| US6006191A (en) | 1996-05-13 | 1999-12-21 | Dirienzo; Andrew L. | Remote access medical image exchange system and methods of operation therefor |
| US6031929A (en) | 1996-07-18 | 2000-02-29 | University Of Pittsburgh | Image facsimile with real time image segmentation |
| US6101265A (en) | 1996-08-23 | 2000-08-08 | Bacus Research Laboratories, Inc. | Method and apparatus for acquiring and reconstructing magnified specimen images from a computer-controlled microscope |
| US6396941B1 (en) | 1996-08-23 | 2002-05-28 | Bacus Research Laboratories, Inc. | Method and apparatus for internet, intranet, and local viewing of virtual microscope slides |
| US6031930A (en) | 1996-08-23 | 2000-02-29 | Bacus Research Laboratories, Inc. | Method and apparatus for testing a progression of neoplasia including cancer chemoprevention testing |
| US6226392B1 (en) | 1996-08-23 | 2001-05-01 | Bacus Research Laboratories, Inc. | Method and apparatus for acquiring and reconstructing magnified specimen images from a computer-controlled microscope |
| US5867598A (en) | 1996-09-26 | 1999-02-02 | Xerox Corporation | Method and apparatus for processing of a JPEG compressed image |
| US5911327A (en) | 1996-10-02 | 1999-06-15 | Nippon Steel Corporation | Method of automatically discriminating and separating scraps containing copper from iron scraps |
| US5731156A (en) | 1996-10-21 | 1998-03-24 | Applied Imaging, Inc. | Use of anti-embryonic hemoglobin antibodies to identify fetal cells |
| US6225636B1 (en) | 1996-10-25 | 2001-05-01 | Applied Imaging, Inc. | Multifluor-fluorescence in-situ hybridization (M-FISH) imaging techniques using multiple multiband filters with image registration |
| US6091842A (en) | 1996-10-25 | 2000-07-18 | Accumed International, Inc. | Cytological specimen analysis system with slide mapping and generation of viewing path information |
| US6718053B1 (en) | 1996-11-27 | 2004-04-06 | Chromavision Medical Systems, Inc. | Method and apparatus for automated image analysis of biological specimens |
| US6151405A (en) | 1996-11-27 | 2000-11-21 | Chromavision Medical Systems, Inc. | System and method for cellular specimen grading |
| US7190818B2 (en) | 1996-11-27 | 2007-03-13 | Clarient, Inc. | Method and apparatus for automated image analysis of biological specimens |
| US6097838A (en) | 1996-12-19 | 2000-08-01 | Xerox Corporation | Color correction of a compressed image |
| US6272235B1 (en) | 1997-03-03 | 2001-08-07 | Bacus Research Laboratories, Inc. | Method and apparatus for creating a virtual microscope slide |
| US6522774B1 (en) | 1997-03-03 | 2003-02-18 | Bacus Research Laboratories, Inc. | Method and apparatus for creating a virtual microscope slide |
| US6404906B2 (en) | 1997-03-03 | 2002-06-11 | Bacus Research Laboratories,Inc. | Method and apparatus for acquiring and reconstructing magnified specimen images from a computer-controlled microscope |
| EP0970364B1 (en) | 1997-03-28 | 2003-05-28 | Chromavision Medical Systems, Inc. | System and method for cellular specimen grading |
| EP1308712A2 (en) | 1997-03-28 | 2003-05-07 | Chromavision Medical Systems, Inc. | System and method for cellular specimen grading |
| WO1998044333A1 (en) | 1997-03-28 | 1998-10-08 | Chromavision Medical Systems, Inc. | System and method for cellular specimen grading |
| WO1998045407A1 (en) | 1997-04-09 | 1998-10-15 | Childrens Hospital Los Angeles | Magnetic-based selection of heterogeneous cell populations for the treatment of malignant and hematological diseases |
| US6169816B1 (en) | 1997-05-14 | 2001-01-02 | Applied Imaging, Inc. | Identification of objects of interest using multiple illumination schemes and finding overlap of features in corresponding multiple images |
| US6259807B1 (en) | 1997-05-14 | 2001-07-10 | Applied Imaging Corp. | Identification of objects of interest using multiple illumination schemes and finding overlap of features in corresponding multiple images |
| US6072570A (en) | 1997-07-24 | 2000-06-06 | Innotech | Image quality mapper for progressive eyeglasses |
| US6058322A (en) | 1997-07-25 | 2000-05-02 | Arch Development Corporation | Methods for improving the accuracy in differential diagnosis on radiologic examinations |
| US5880473A (en) | 1997-07-28 | 1999-03-09 | Applied Imaging, Inc. | Multifluor-fluorescence in-situ hybridization (M-FISH) imaging techniques using multiple multiband filters with image registration |
| US6290907B1 (en) | 1997-09-11 | 2001-09-18 | Hitachi, Ltd. | Sample handling system |
| US6011595A (en) | 1997-09-19 | 2000-01-04 | Eastman Kodak Company | Method for segmenting a digital image into a foreground region and a key color region |
| US6141602A (en) | 1997-09-25 | 2000-10-31 | Hitachi, Ltd. | Specimen processing system |
| US6122400A (en) | 1997-09-26 | 2000-09-19 | Sarnoff Corporation | Compression encoder bit allocation utilizing colormetric-adaptive weighting as in flesh-tone weighting |
| US5888742A (en) | 1997-10-28 | 1999-03-30 | Incyte Pharmaceuticals, Inc. | Human phospholipid binding proteins |
| US6374989B1 (en) | 1997-11-14 | 2002-04-23 | Bayer Corporation | Conveyor system for clinical test apparatus |
| US6365362B1 (en) | 1998-02-12 | 2002-04-02 | Immunivest Corporation | Methods and reagents for the rapid and efficient isolation of circulating cancer cells |
| US6151535A (en) | 1998-05-04 | 2000-11-21 | Olympus Diagnostica Gmbh | Laboratory primary sample distributor with archiving mode |
| US6313452B1 (en) | 1998-06-10 | 2001-11-06 | Sarnoff Corporation | Microscopy system utilizing a plurality of images for enhanced image processing capabilities |
| US6281874B1 (en) | 1998-08-27 | 2001-08-28 | International Business Machines Corporation | Method and system for downloading graphic images on the internet |
| US6236031B1 (en) | 1998-09-04 | 2001-05-22 | Sony Corporation | Optical head, recording and/or reproducing apparatus, and optical disc drive with an auxiliary focus servo system |
| US6226636B1 (en) | 1998-11-20 | 2001-05-01 | Philips Electronics North America Corp. | System for retrieving images using a database |
| WO2000049391A1 (en) | 1999-02-18 | 2000-08-24 | Bio-View Ltd. | System and method for identifying and analyzing rare cell types in a mixed population of cells |
| US6215894B1 (en) | 1999-02-26 | 2001-04-10 | General Scanning, Incorporated | Automatic imaging and analysis of microarray biochips |
| US6947583B2 (en) | 1999-04-13 | 2005-09-20 | Clarient, Inc. | Histological reconstruction and automated image analysis |
| US6631203B2 (en) | 1999-04-13 | 2003-10-07 | Chromavision Medical Systems, Inc. | Histological reconstruction and automated image analysis |
| WO2000062247A9 (en) | 1999-04-13 | 2002-06-13 | Chromavision Med Sys Inc | Histological reconstruction and automated image analysis |
| US6418236B1 (en) | 1999-06-24 | 2002-07-09 | Chromavision Medical Systems, Inc. | Histological reconstruction and automated image analysis |
| US6674896B1 (en) | 1999-07-13 | 2004-01-06 | Chromavision Medical Systems, Inc. | Device for applying accurate color thresholds in real time |
| WO2001037206A1 (en) | 1999-11-19 | 2001-05-25 | Applied Imaging Corporation | Identification of objects of interest using a combination of multiple illumination schemes |
| WO2001057785A1 (en) | 2000-02-01 | 2001-08-09 | Chromavision Medical Systems, Inc. | Method and apparatus for automated image analysis of biological specimens |
| US6518554B1 (en) | 2000-05-24 | 2003-02-11 | Chromavision Medical Systems, Inc. | Reverse focusing methods and systems |
| US20020164810A1 (en) | 2000-12-05 | 2002-11-07 | Vysis | Method and system for diagnosing pathology in biological samples by detection of infrared spectral markers |
| US20020067409A1 (en) | 2000-12-06 | 2002-06-06 | Bio-View Ltd. | Data acquisition and display system and method |
| US6466690B2 (en) | 2000-12-19 | 2002-10-15 | Bacus Research Laboratories, Inc. | Method and apparatus for processing an image of a tissue sample microarray |
| US6466690C1 (en) | 2000-12-19 | 2008-11-18 | Bacus Res Lab Inc | Method and apparatus for processing an image of a tissue sample microarray |
| WO2003014795A1 (en) | 2001-08-06 | 2003-02-20 | Bioview Ltd. | Image focusing in fluorescent imaging |
| US6697509B2 (en) | 2001-10-04 | 2004-02-24 | Chromavision Medical Systems, Inc. | Method and apparatus for scoring the uptake of markers in cells |
| US20030124589A1 (en) | 2001-10-12 | 2003-07-03 | Vysis, Inc. | Imaging microarrays |
| US20030170703A1 (en) | 2002-01-15 | 2003-09-11 | Vysis, Inc., A Corporation Of The State Of Delaware | Method and/or system for analyzing biological samples using a computer system |
Non-Patent Citations (1)
| Title |
|---|
| U.S. Appl. No. 60/129,834, filed Apr. 13, 1999, Ellis et al. |
Cited By (35)
| Publication number | Priority date | Publication date | Assignee | Title |
|---|---|---|---|---|
| US7760927B2 (en)* | 2003-09-10 | 2010-07-20 | Bioimagene, Inc. | Method and system for digital image based tissue independent simultaneous nucleus cytoplasm and membrane quantitation |
| US20060188140A1 (en)* | 2003-09-10 | 2006-08-24 | Bioimagene, Inc. | Method and system for digital image based tissue independent simultaneous nucleus cytoplasm and membrane quantitation |
| US8921102B2 (en) | 2005-07-29 | 2014-12-30 | Gpb Scientific, Llc | Devices and methods for enrichment and alteration of circulating tumor cells and other particles |
| US11781187B2 (en) | 2006-06-14 | 2023-10-10 | The General Hospital Corporation | Rare cell analysis using sample splitting and DNA tags |
| US9347100B2 (en) | 2006-06-14 | 2016-05-24 | Gpb Scientific, Llc | Rare cell analysis using sample splitting and DNA tags |
| US9017942B2 (en) | 2006-06-14 | 2015-04-28 | The General Hospital Corporation | Rare cell analysis using sample splitting and DNA tags |
| US10155984B2 (en) | 2006-06-14 | 2018-12-18 | The General Hospital Corporation | Rare cell analysis using sample splitting and DNA tags |
| US9273355B2 (en) | 2006-06-14 | 2016-03-01 | The General Hospital Corporation | Rare cell analysis using sample splitting and DNA tags |
| US20080090239A1 (en)* | 2006-06-14 | 2008-04-17 | Daniel Shoemaker | Rare cell analysis using sample splitting and dna tags |
| US11378498B2 (en) | 2006-06-14 | 2022-07-05 | Verinata Health, Inc. | Diagnosis of fetal abnormalities using polymorphisms including short tandem repeats |
| US20090215088A1 (en)* | 2008-02-25 | 2009-08-27 | Cellpoint Diagnostics, Inc. | Tagged Ligands For Enrichment of Rare Analytes From A Mixed Sample |
| US8008032B2 (en) | 2008-02-25 | 2011-08-30 | Cellective Dx Corporation | Tagged ligands for enrichment of rare analytes from a mixed sample |
| US10359429B2 (en) | 2008-02-25 | 2019-07-23 | Gpb Scientific, Llc | Tagged ligands for enrichment of rare analytes from a mixed sample |
| US9310598B2 (en) | 2009-03-11 | 2016-04-12 | Sakura Finetek U.S.A., Inc. | Autofocus method and autofocus device |
| US10495867B2 (en) | 2009-03-11 | 2019-12-03 | Sakura Finetek U.S.A., Inc. | Autofocus method and autofocus device |
| US10139613B2 (en) | 2010-08-20 | 2018-11-27 | Sakura Finetek U.S.A., Inc. | Digital microscope and method of sensing an image of a tissue sample |
| US9292925B2 (en)* | 2011-06-01 | 2016-03-22 | Canon Kabushiki Kaisha | Imaging system and control method thereof |
| US20120307047A1 (en)* | 2011-06-01 | 2012-12-06 | Canon Kabushiki Kaisha | Imaging system and control method thereof |
| US9541480B2 (en) | 2011-06-29 | 2017-01-10 | Academia Sinica | Capture, purification, and release of biological substances using a surface coating |
| US11674958B2 (en) | 2011-06-29 | 2023-06-13 | Academia Sinica | Capture, purification, and release of biological substances using a surface coating |
| US10269094B2 (en) | 2013-04-19 | 2019-04-23 | Sakura Finetek U.S.A., Inc. | Method for generating a composite image of an object composed of multiple sub-images |
| US10007102B2 (en) | 2013-12-23 | 2018-06-26 | Sakura Finetek U.S.A., Inc. | Microscope with slide clamping assembly |
| WO2015102948A1 (en)* | 2013-12-31 | 2015-07-09 | Siemens Healthcare Diagnostics Inc. | Urine formed element classification method and apparatus |
| US20150205088A1 (en)* | 2014-01-23 | 2015-07-23 | U&U Engineering Inc. | Bevel-axial auto-focusing microscopic system and method thereof |
| US10495644B2 (en) | 2014-04-01 | 2019-12-03 | Academia Sinica | Methods and systems for cancer diagnosis and prognosis |
| US10112198B2 (en) | 2014-08-26 | 2018-10-30 | Academia Sinica | Collector architecture layout design |
| US10107726B2 (en) | 2016-03-16 | 2018-10-23 | Cellmax, Ltd. | Collection of suspended cells using a transferable membrane |
| US10605708B2 (en) | 2016-03-16 | 2020-03-31 | Cellmax, Ltd | Collection of suspended cells using a transferable membrane |
| US11280803B2 (en) | 2016-11-22 | 2022-03-22 | Sakura Finetek U.S.A., Inc. | Slide management system |
| US12235217B2 (en) | 2019-11-13 | 2025-02-25 | Scanwell Health, Inc. | Diagnostic test kits for sample preparation and analysis |
| US11996183B2 (en) | 2020-09-17 | 2024-05-28 | Scanwell Health, Inc. | Methods of analyzing diagnostic test kits |
| USD970033S1 (en) | 2020-10-23 | 2022-11-15 | Becton, Dickinson And Company | Cartridge imaging background device |
| US11988596B2 (en) | 2020-10-23 | 2024-05-21 | Becton, Dickinson And Company | Systems and methods for imaging and image-based analysis of test devices |
| USD1064316S1 (en) | 2020-10-23 | 2025-02-25 | Becton, Dickinson And Company | Cartridge imaging background device |
| CN118397518A (en)* | 2024-06-26 | 2024-07-26 | 陕西福坤顺科技有限公司 | Visual detection method for stability of operation state of three-axis turntable |
Also Published As
| Publication number | Publication date |
|---|---|
| US7190818B2 (en) | 2007-03-13 |
| US20040136581A1 (en) | 2004-07-15 |
| US6718053B1 (en) | 2004-04-06 |
| US20070206843A1 (en) | 2007-09-06 |
Similar Documents
| Publication | Publication Date | Title |
|---|---|---|
| US7428325B2 (en) | Method and apparatus for automated image analysis of biological specimens | |
| US7783098B2 (en) | Method and apparatus for automated image analysis of biological specimens | |
| US6671393B2 (en) | Automated method for image analysis of residual protein | |
| US7272252B2 (en) | Automated system for combining bright field and fluorescent microscopy | |
| US7226788B2 (en) | Automated slide staining apparatus | |
| US6631203B2 (en) | Histological reconstruction and automated image analysis | |
| US20050037406A1 (en) | Methods and apparatus for analysis of a biological specimen | |
| EP1203343A1 (en) | Automated detection of objects in a biological sample | |
| WO2001057785A1 (en) | Method and apparatus for automated image analysis of biological specimens | |
| WO2001006446A1 (en) | Automated method for image analysis of residual protein |
Legal Events
| Date | Code | Title | Description |
|---|---|---|---|
| AS | Assignment | Owner name:CHROMAVISION MEDICAL SYSTEMS, INC., CALIFORNIA Free format text:ASSIGNMENT OF ASSIGNORS INTEREST;ASSIGNORS:DOUGLASS, JAMES W.;RIDING, THOMAS J.;RING, JAMES E.;REEL/FRAME:021388/0884 Effective date:20040407 Owner name:CLARIENT, INC., CALIFORNIA Free format text:CHANGE OF NAME;ASSIGNOR:CHROMAVISION MEDICAL SYSTEMS, INC.;REEL/FRAME:021390/0047 Effective date:20050315 Owner name:CARL ZEISS MICROIMAGING AIS, INC., NEW YORK Free format text:ASSIGNMENT OF ASSIGNORS INTEREST;ASSIGNOR:CLARIENT, INC.;REEL/FRAME:021390/0154 Effective date:20071016 Owner name:CHROMAVISION MEDICAL SYSTEMS, INC., CALIFORNIA Free format text:ASSIGNMENT OF ASSIGNORS INTEREST;ASSIGNORS:ELLIS, BOB;DECKER, WILLIAM J.;MCLAREN, GINA;REEL/FRAME:021388/0655;SIGNING DATES FROM 20000519 TO 20000528 | |
| STCF | Information on status: patent grant | Free format text:PATENTED CASE | |
| AS | Assignment | Owner name:CHROMAVISION MEDICAL SYSTEMS, INC., CALIFORNIA Free format text:CORRECTIVE ASSIGNMENT TO CORRECT THE SERIAL NUMBER PREVIOUSLY RECORDED ON REEL 021388 FRAME 0655;ASSIGNORS:ELLIS, BOB;DECKER, WILLIAM J.;MCLAREN, GINA;REEL/FRAME:022136/0242;SIGNING DATES FROM 20000519 TO 20000528 | |
| CC | Certificate of correction | ||
| FPAY | Fee payment | Year of fee payment:4 | |
| FPAY | Fee payment | Year of fee payment:8 | |
| FEPP | Fee payment procedure | Free format text:MAINTENANCE FEE REMINDER MAILED (ORIGINAL EVENT CODE: REM.); ENTITY STATUS OF PATENT OWNER: LARGE ENTITY | |
| LAPS | Lapse for failure to pay maintenance fees | Free format text:PATENT EXPIRED FOR FAILURE TO PAY MAINTENANCE FEES (ORIGINAL EVENT CODE: EXP.); ENTITY STATUS OF PATENT OWNER: LARGE ENTITY | |
| STCH | Information on status: patent discontinuation | Free format text:PATENT EXPIRED DUE TO NONPAYMENT OF MAINTENANCE FEES UNDER 37 CFR 1.362 | |
| FP | Lapsed due to failure to pay maintenance fee | Effective date:20200923 |