US7379782B1 - System and method of monitoring and quantifying performance of an automated manufacturing facility - Google Patents
System and method of monitoring and quantifying performance of an automated manufacturing facilityDownload PDFInfo
- Publication number
- US7379782B1 US7379782B1US11/691,083US69108307AUS7379782B1US 7379782 B1US7379782 B1US 7379782B1US 69108307 AUS69108307 AUS 69108307AUS 7379782 B1US7379782 B1US 7379782B1
- Authority
- US
- United States
- Prior art keywords
- time
- workstation
- data
- accumulated
- workstations
- Prior art date
- Legal status (The legal status is an assumption and is not a legal conclusion. Google has not performed a legal analysis and makes no representation as to the accuracy of the status listed.)
- Active
Links
Images


Classifications
- G—PHYSICS
- G06—COMPUTING OR CALCULATING; COUNTING
- G06Q—INFORMATION AND COMMUNICATION TECHNOLOGY [ICT] SPECIALLY ADAPTED FOR ADMINISTRATIVE, COMMERCIAL, FINANCIAL, MANAGERIAL OR SUPERVISORY PURPOSES; SYSTEMS OR METHODS SPECIALLY ADAPTED FOR ADMINISTRATIVE, COMMERCIAL, FINANCIAL, MANAGERIAL OR SUPERVISORY PURPOSES, NOT OTHERWISE PROVIDED FOR
- G06Q10/00—Administration; Management
- G06Q10/06—Resources, workflows, human or project management; Enterprise or organisation planning; Enterprise or organisation modelling
- G—PHYSICS
- G05—CONTROLLING; REGULATING
- G05B—CONTROL OR REGULATING SYSTEMS IN GENERAL; FUNCTIONAL ELEMENTS OF SUCH SYSTEMS; MONITORING OR TESTING ARRANGEMENTS FOR SUCH SYSTEMS OR ELEMENTS
- G05B2219/00—Program-control systems
- G05B2219/30—Nc systems
- G05B2219/31—From computer integrated manufacturing till monitoring
- G05B2219/31412—Calculate machining time, update as function of load, speed
- G—PHYSICS
- G05—CONTROLLING; REGULATING
- G05B—CONTROL OR REGULATING SYSTEMS IN GENERAL; FUNCTIONAL ELEMENTS OF SUCH SYSTEMS; MONITORING OR TESTING ARRANGEMENTS FOR SUCH SYSTEMS OR ELEMENTS
- G05B2219/00—Program-control systems
- G05B2219/30—Nc systems
- G05B2219/31—From computer integrated manufacturing till monitoring
- G05B2219/31413—Estimate capacity of plant
- G—PHYSICS
- G05—CONTROLLING; REGULATING
- G05B—CONTROL OR REGULATING SYSTEMS IN GENERAL; FUNCTIONAL ELEMENTS OF SUCH SYSTEMS; MONITORING OR TESTING ARRANGEMENTS FOR SUCH SYSTEMS OR ELEMENTS
- G05B2219/00—Program-control systems
- G05B2219/30—Nc systems
- G05B2219/31—From computer integrated manufacturing till monitoring
- G05B2219/31415—Cost calculation in real time for a product manufactured
Definitions
- the inventionrelates generally to the field of monitoring performance of manufacturing facilities.
- the inventionrelates to a system and method of monitoring and managing performance of an automated manufacturing facility.
- Locating the constraintsis not an easy task. This may be particularly so in a facility with sequential production lines.
- an automated manufacturing facilityoften consists of a number of sequential production or processing lines.
- Each sequential production lineconsists of several automated workstations linked in a sequential manner.
- Each of the automated workstationsprocesses a workpiece at a fixed pace as the workpiece moves sequentially from one workstation to the next in the line.
- slowdown at any one of the workstationsoften causes a ripple effect that spreads both upstream and downstream from the source. Slowdowns can be attributed to many different causes. “Slow cycles”, or losses due to a workstation running at a slower than the expected pace, can be one of the contributing factors to the slowdown of a production line.
- Metricsare generally used to measure productivity of a manufacturing facility and to measure effectiveness of changes made to workstations or manufacturing environment. Typical approaches to solving the problem of improving performance or productivity in a manufacturing environment generally do not deploy methods of identifying constraints. Instead, these methods focus on collecting a different set of data such as machine faults, overall equipment efficiency (“OEE”), idle time, and scrap rates. These metrics, while providing an indication of the overall performance of a plant, generally do not provide satisfactory guidance as to where a problem may have originated and therefore assist management in locating specific workstations where corrective measures may be required.
- OFEEoverall equipment efficiency
- the present inventionrelates to a system and method for identifying and quantifying constraints in an automated manufacturing or processing facility.
- the facilityhas a number of automated workstations.
- a data processing systemcontinuously receives basic event and state signals from automation equipment in the facility and evaluates and processes these signals to derive a throughput capability measure (a measure of constraint) of each given manufacturing workstation in the process.
- the automated collection of signalsmay be further augmented by manually entered information relating to a workstation's performance.
- the throughput capability measureis expressed as a ratio of an ideal cycle time to an accumulated time that includes any delays or overcycles at a workstation but excludes any speed-up at the workstation.
- a workstationexperiences a speed-up if it processes a workpiece in less than the ideal cycle time.
- the throughput capability measures of all workstationsare analyzed to identify the constraints in the facility.
- a constraintis identified as a workstation that has the lowest throughput.
- throughput capability measures for all workstationsare presented to users graphically. This gives users a clear indication of the constraints in the manufacturing flow and a representation of the material flow through the facility. Further drill-down can be provided for obtaining more detailed information about the constraint and capacity loss as well as entering information relevant to the constraint, such as a stoppage or slow-down.
- throughput capability measuresare presented to users through a throughput capability and balance map.
- Each workstationis represented by an icon on the map. Shown in each icon are computed throughput capability measure, and optionally the percentages of capacity loss due to each monitored categories, such as starved and blocked conditions.
- Each iconis color coded, with the constraints shown in a uniquely identifiable color.
- Each iconis rendered actuatable for requesting and providing further information. For example, clicking an icon using a computer pointing device may bring up additional details relating to performance of the represented workstation or allow for entering further information.
- a system for quantifying and identifying a constraint in an automated manufacturing facilitythe automated manufacturing facility having automated workstations for automatically processing workpieces.
- the systemcomprises a plurality of signal converters, each of the plurality of signal converters continuously receiving event and state signals collected at a respective automated workstation, and transforming the event and state signals to time and count data, the time and count data including an overcycle time spent by the respective automated workstation during each process cycle of processing a workpiece and a workpiece count; a data modeling engine communicating with the plurality of signal converters; the each signal converter including a computing unit, the computing unit calculating a throughput capability measure of the respective automated workstation upon completion of the each process cycle at the respective workstation, the throughput capability measure being calculated from an expected processing time and an accumulated overcycled processing time accumulated over an accumulation period; and the data modeling engine receiving from the plurality of signal converters the throughput capability measures and identifying the constraint as a workstation whose throughput capability measure meets a pre-
- the systemfurther includes historical data database and a queue manager, which arranges for the storing of the converted time and count data in the historical data database.
- systemfurther includes further a graphical user interface for displaying a graphical representation of the throughput capability measures of the workstations to a user, the graphical representation including workstation icons, each of the workstation icons corresponding to one of the workstations and showing a numerical value of the throughput capability measure.
- the graphical representationincludes one or more state icons positioned adjacent each workstation icon of the workstation icons, the one or more state icons each showing a time percentage the each workstation spending in a represented respective state.
- a system for quantifying and identifying a constraint in an automated manufacturing facilitythe automated manufacturing facility having sequentially linked, automated workstations for automatically processing workpieces.
- the systemcomprises a plurality of signal converters, each of the plurality of signal converters continuously receiving starved, blocked and EOC signals collected at a respective automated workstation, and transforming the starved, blocked and EOC signals to time and count data, the time and count data including a measured cycle time spent by the respective automated workstation processing a workpiece during each process cycle, an overcycle time spent by the respective automated workstation during the each process cycle and a workpiece count; data accumulators for accumulating the time and count data received from the each signal convertor, the accumulated time and count data including an accumulated overcycle time, an accumulated ideal processing time and a total workpiece count over an accumulation period; a historical data database for storing the time and count data and the accumulated time and count data; a data modeling engine communicating with the plurality of signal converters and the historical data database;
- a method of monitoring and managing performance of an automated processing facilityincludes the steps of: continuously receiving state and event signals automatically collected from workstations in the automated processing facility; converting the state and event signals to time and count data, the time and count data of each of the workstations including at least an overcycle time, the overcycle time being a non-negative quantity derived from a difference between a measured cycle time and an ideal cycle time; accumulating the time and count data over an accumulation period for the workstations, the accumulated time and count data including at least a total count of workpieces processed by the each workstation during the accumulation period and an accumulated overcycle time accumulated from the overcycle time; continuously computing a throughput capability measure for each workstation upon the each workstation completing processing a workpiece, the throughout capability measure being computed from the total count, the accumulated overcycle time and the ideal cycle time; and identifying a constraint in the automated manufacturing facility from the throughput capability measures of the workstations, the constraint being a workstation having the
- the time and count data of the each workstationincludes a first amount of time spent by the each workstation in starved state and a second amount of time spent by the each workstation in blocked state
- the methodfurther includes the step of displaying the throughput capability measure, information derived from the first amount of time and information derived from the second amount of time in icons associated with the each workstation.
- the methodincludes further the step of color coding icons associated with said each workstation in accordance with numerical values of said throughput capability measures.
- FIG. 1shows schematically an automated processing facility, interfaced with and monitored by a computer implemented performance management system according to an embodiment of the present invention
- FIG. 2is a block diagram showing a performance management system for identifying and quantifying constraints in the automated processing facility illustrated in FIG. 1 ;
- FIG. 3Aillustrates schematically a workstation cycle and generation of end-of-cycle, blocked and starved signals
- FIG. 3Billustrates along a time axis time markers associated with various state and event signals and conversion of these signals to basic time and count data
- FIG. 4illustrates schematically along a time axis categories of losses at a workstation
- FIG. 5is a flow chart illustrating steps of a process for identifying and quantifying constraints in an automated processing facility
- FIG. 5Bdepicts time markers associated with various state and event signals along time axis to illustrate conversion of these signals to time and count data and accumulation of converted time and count data;
- FIG. 6is a graphical representation for presenting graphically throughput capability measures of workstations in two sequential production lines
- FIG. 7shows a throughput capability and balance map for presenting graphically throughput capability measures and other performance indicators for a plurality of production lines linked in sequential and parallel fashions;
- FIG. 8is an exemplary screen display showing detailed information relating to losses in different categories
- FIG. 9is another exemplary screen display showing detailed information related to OEE.
- FIG. 10is an exemplary screen display for a user to enter information manually, providing information relating to causes of quality loss at a workstation;
- FIG. 11is an exemplary screen display that shows the statistics of quality losses over a given monitored period.
- the present inventionrelates to a system and method for identifying and quantifying constraints in an automated manufacturing or processing facility.
- the facilityhas a number of automated workstations.
- the systemutilizes automatically collected event and state signals from each workstation and processes these signals to derive a throughput capability measure for each workstation.
- the automated collection of signalsis further augmented by provision of input devices that allow users to manually enter information relating to a workstation's performance. Instead of collecting a large number of signals, the system collects a small number of core event and state signals (three in one embodiment), and correlates these signals with their time data to derive a throughput performance measure.
- a data modeling engineis provided for analyzing throughput capability measures of all workstations to identify the constraints in the facility.
- the throughput capability metriccomprising throughput capability measures of all monitored workstations in the facility, is presented graphically to users to provide clear indications of constraints. Results are also analyzed to provide statistics as to performance losses or causes to performance losses so that a user is provided with guidance as to where and what types of improvements should be made.
- FIG. 1shows schematically an automated processing facility 100 .
- the automated processing facilitymay be any manufacturing facility, processing facility, or testing facility, or any facility that includes a number of processing units that are or can be automated.
- the facilitymay be an automated production line of automobiles, an automated semiconductor fabrication facility, or a bottling facility that includes a number of automated bottling lines of beverages.
- the facility 100has a number of automated assets 102 in the nature of workstations, workcells or processing stations.
- An asset 102is a piece of equipment that is capable of functioning independently from other pieces of equipment.
- An asset 102may generally correspond to a machine, a group of machines or even a part of a machine.
- These automated assetsare generally grouped into sequential production or processing lines, such as production line A ( 104 ), production line B ( 106 ) and production C ( 108 ).
- Each sequential production or processing line 104 , 106 , 108has a line input point 110 and a line exit point 112 .
- Several automated assets 102are linked sequentially between a line's input point and the line's exit point to form the sequential production line.
- a workpiece 114enters a production line at its input point 110 .
- a workpieceis processed at each workstation and may be a partially assembled automobile in an automobile assembly line, an empty bottle in a bottling facility, or a semiconductor wafer in a semiconductor fabricating facility, among others.
- a workpiecemay be a finished product that is to be subject to a sequence of automated tests or a sample that is to be analyzed at each of the automated data collection and analysis workstations.
- the workpieceis processed sequentially at each one of the assets 102 of the production line until it reaches the exit point 112 of the production line.
- a buffer 114may be provided at a line's input point or exit point.
- sequential productiona workpiece processed by the production line has only one flow path to choose from, namely the path defined by the sequentially linked assets.
- the next workstation a workpiece must gois fixed.
- the timing of the workpiece moving from workstation to workstationis not fixed and is dependent on the individual process being completed at each workstation.
- a buffer 114 provided at each production line's input point or exit pointhelps maintaining a consistent level of workflow between production lines.
- buffersare also provided between workstations to help level workflow further so that continuous processing or production can be achieved. Buffer level often provides some indication as to whether a workstation has been operating at a designed production or processing rate.
- a production line's exit point 112may be linked to another line's input point 110 , to process further the partially processed workpieces.
- a line's exit pointmay also be linked back to its own input point to process the workpieces multiple times before they are handed over to the next production line for further processing.
- FIG. 1shows one exemplary configuration in which the exit points of line A ( 104 ) and line C ( 108 ) are linked to the input point of line B ( 106 ).
- the first workpiece 116 processed by line A and the second workpiece 118 processed by line Care further processed by line B to produce a combined product 120 at the exit point of line B.
- Each automated asset 102may have a programmable logic controller 122 (PLC) or similar control device installed thereon.
- PLCprogrammable logic controller
- a PLCis a piece of computer hardware responsible for operating the asset 102 in a predetermined manner. It generally includes sensors or has interface for receiving inputs from sensors for detecting state and triggering events or measuring monitored conditions.
- a PLCcontains one or more memory registers to collect data from its associated asset 102 . Internal logic of PLC 122 populates its memory registers with data regarding monitored conditions of asset 102 . Each memory register stores data associated with a separate monitored condition of asset 102 . For example, value in one memory register tracks starved condition of asset 102 while value in another memory register tracks blocked condition of the asset.
- a PLCcan be programmed with a number of logic conditions or “ladders” that allow it to respond to changing input and operate the asset accordingly. Some functions performed by a PLC include quality monitoring (e.g., to ensure parts are loaded correctly), process monitoring (e.g., to ensure that a given process is completed within acceptable specifications, such as rivet pressure, drill depth, etc.), and safety monitoring (such as monitoring of safety gates, light curtains, emergency stop buttons, etc.).
- quality monitoringe.g., to ensure parts are loaded correctly
- process monitoringe.g., to ensure that a given process is completed within acceptable specifications, such as rivet pressure, drill depth, etc.
- safety monitoringsuch as monitoring of safety gates, light curtains, emergency stop buttons, etc.
- Communication links 124such as wired or wireless data links, connect all PLCs together to form a monitoring network 126 .
- Signalsare continuously collected by PLCs and are further transmitted through the monitoring network to a computer 128 , or several computers, on which a data processing system in the nature of a software system 130 is executing. Any suitable data transmission protocol or protocols may be used for transmitting the collected signals.
- One or several display and input devices 132such as a computer monitor and a keyboard, or a touch screen, are provided and connected to the software system 130 , for users to display status of monitored assets 102 and to enter any information relating to the assets.
- the software system 130processes signal data collected by PLCs 122 and computes the throughput capability measure of each of the assets 102 in accordance with a methodology described herein.
- the throughput capability measuresare presented to a user graphically.
- the software system 130can also conveniently provide a user interface, for example, a graphical user interface displayed on a computer monitor 132 , for accepting user inputs relating to any one of assets 102 .
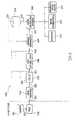
- FIG. 2is a block diagram showing a software system 130 , interfaced with PLCs, according to one embodiment of the present invention.
- the software system 130includes a plurality of signal converters 202 in the nature of RTLE 204 (real-time logic engine), data accumulators 206 , and a data modeling engine 208 .
- the data modeling engine 208includes or is interfaced with a historical data database 210 , which may be standalone or as part of the software system 130 , a report module 212 , a visual presentation module 214 , and a manual data entry tool 216 .
- an OLE for process control (OPC) server 218is provided between a PLC 122 and a signal converter 202 .
- a queue manager 220is preferably provided between data accumulators 206 and data modeling engine 208 .
- the software system 130continuously receives data inputs from a collection of PLCs 122 , each PLC being installed on a workstation 102 in a plant.
- the arrows 222indicate the flow of raw signal data from sensors at each workstation to PLCs 122 , pre-processed or formatted by OPC server 218 , processed by RTLEs 204 and data accumulators 206 , possibly buffered at the queue manager 220 and written by the queue manager 220 into a historical data database 210 , which are manipulated and analyzed by data modeling engine 208 .
- a PLC 122is interfaced with the workstation, for continuously collecting event and state signals from the workstation.
- the PLCsare programmed to collect a minimum set of three state and event signals: starved bit 302 , blocked bit 304 and EOC (“end of cycle”) bit 306 .
- Starved bit 302is used to indicate a “Starved” condition, i.e., when a workstation is idling and waiting for the next workpiece to arrive.
- EOC bit 306can be programmed to come on at the same point in each cycle. Typically it is used to indicate a “Cycle Complete” or “End of Cycle” condition. For example, the EOC bit 306 is turned on each time the workstation completes processing a workpiece. Conveniently, the EOC bit remains on for a short period (e.g., 3 seconds) to ensure its detection by RTLE or OPC server. Any other suitable periods, for example from 1 to 3 seconds, depending on polling rate or such other parameters, may be used as long as the EOC bit remains on sufficiently long to ensure its detection.
- Other signalssuch as faulted state, quality loss, product or manufacturing process related identifiers, etc. may also be collected. Collecting additional signals can increase the amount of information that the system can report on.
- the PLCmay collect a “Quality” signal by adding a quality bit to its memory registers (not shown). Quality bit comes on in conjunction with the “EOC” signal. If at the end of a cycle the “Quality” signal is “ON” then a rejected or scrap piece is counted.
- the PLCmay also collect one or several identifier signals. Such identifiers may include product code, product model, part types, process batch type, option content, etc., or any kind of desirable identifier. For example, a “Model ID” signal can be collected.
- Model IDindicates the current running model and is usually given as an alphanumeric value, for identifying production line configuration or workpieces being processed.
- the systemcan use the Model ID to adjust or retrieve model-based parameters.
- the value of an ideal cycle timevaries from model to model, which can be conveniently adjusted or retrieved from a database based on the value of Model ID.
- Reports and visual presentationscan also make use of the “Model ID” as a filter, allowing various metrics to be displayed and sorted by model.
- a workstation itselfmay have other status bits that the workstation uses to determine what stage of the cycle it is in.
- Some of the common conditions monitored by a PLCinclude: “Load Delay”, “Part Present”, “Part Complete” and “Unload Delay”.
- a workstationhas a built-in delay between the time when it discharges a finished workpiece and the time when it loads a new workpiece.
- “Load Delay”represents a given delay while a workpiece is being loaded.
- the “Load Delay” bit 308is turned on during loading, but since this is part of the normal cycle, the workstation is neither blocked nor starved.
- a workstationmay have a built-in delay when it unloads a finished workpiece.
- the “Unload Delay” bit 310comes on during unloading and a new cycle is ready to begin again when this bit is turned off.
- the “Part Present” bit 312is turned on after the load delay. A new workpiece is considered loaded and a new processing cycle begins.
- the “Part Complete” bit 314is turned on at the end of the process cycle.
- the EOC bit 306may be turned on at this point and kept on for a pre-determined period, such as 3 seconds, or any other period (for example, from 1 to 3 seconds) that is sufficiently long to ensure its detection by RTLE or OPC server.
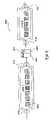
- FIG. 3Aillustrates schematically a typical machine cycle from “Load Delay” (step 320 ), through “Part Present” or start of processing cycle (step 330 ), “Part Complete” or EOC (step 340 ), “Unload Delay” (step 350 ) and back to “Load Delay” again.
- a solid or filled-in circle or small rectangleindicates a bit switched on and an unfilled circle or small rectangle indicates a bit switched off.
- the events shown in FIG. 3Aare also marked on a time axis 316 . Time T 0 indicates the start of the cycle, when the “Load Delay” bit 308 is first turned on.
- the “Load Delay” bit 308is turned off at time T 1 after the built-in delay.
- the “Part Present” bit 312is turned on. This is when the workstation starts processing the workpiece.
- the “Part Complete” bit 314is turned on.
- the time duration between T 1 and T 2is also generally referred to as “P2PSA” time, or part-to-part stand-alone time. As will be described in great detail later, if the P2PSA time is longer than an ideal cycle time, takt time, the workstation is considered overcycling and the difference between the P2PSA time and the takt time is collected as unit overcycle time.
- the EOC bit 306is turned on at T 2 , for 3 seconds, which provides the end-of-cycle signal 318 , or EOC signal.
- the “Unload Delay” bit 310is turned on at T 3 and kept on for the duration of a built-in unload delay until T 4 .
- the moment T 4also coincides with T 0 ′ of the next cycle.
- the time between the beginning of EOC in neighboring cyclesis generally referred to as “P2P” time, or part-to-part time.
- the workstationis now expecting another workpiece to enter.
- the “Load Delay” bitis turned on, in anticipation of the loading of a new workpiece.
- the workstationmay find itself without a new workpiece (step 360 ) and the “Part Present” bit 312 remains off (step 370 ).
- the stationreports its condition as “starved” and the Starved bit 302 is turned on.
- the workstationwill remain in this state, i.e., the starved bit 302 will be kept on, until a new workpiece enters the workstation.
- the EOC bit 306is turned on and held on for 3 seconds. If after a built-in unload delay, i.e., after the “Unload Delay” bit is cleared, the completed workpiece cannot exit (step 380 ) and is still present in the workstation, the station reports its condition as “Blocked” and the Blocked bit 304 is turned on (step 390 ). The blocked bit 304 will be held on until the workpiece exits the workstation, i.e., until the “Part Present” bit 312 is cleared.
- a PLCmay be programmed to use the time information and accumulate amount of time the workstation spent in starved or blocked state, amount of time the workstation spent between consecutive EOC signals, or may accumulate, i.e., increment a total unit count each time an BOC signal is received to track the total number of workpieces processed.
- a PLCmay also be programmed to perform more complicated calculations. However, although a PLC is programmable, modification of PLC logic to collect additional signals or perform additional calculations in an already operational PLC tends to be discouraged as such modification can be time consuming and may require extensive “proofing” to ensure regular operations are not impacted in any way. Preferably, any calculation and accumulation are left to signal converters 202 for improved performance and reduced implementation costs. Calculation and accumulation of time and count data will be further described in detail later.
- PLCsare described here as the device for collecting signals, it is only because typically PLCs are already installed in an automated facility for collecting signals at each workstation. In most installations, PLCs may already collect the minimally necessary signals required by the system. It is not required that PLCs must be used. Any sensors capable of collecting state and event signals used by the software system 130 can be used in addition to or in place of PLCs.
- OPC serversreceive data from PLCs.
- OPCis a standardized protocol for communicating data between systems in a controlled process and its functionalities.
- OPC server 218collects and formats data stored in memory registers of each PLC 122 connected thereto and provides the standardized data to signal converters 202 , or RTLEs 204 .
- OPC server 218collects such data by periodically reading memory registers, commonly at a rate of once per second.
- OPC server 218stores the read data in its internal memory in a standardized manner along with source information indicating the memory register and asset 102 from which the data was collected.
- Signal converter 202is provided the data and source information in the standardized manner, allowing it to properly interpret and process the data collected.
- OPC server 218therefore provides a standardized data access interface for data signal converter 202 to request and receive data from memory registers of PLC. Collection and format of data stored in internal memory of OPC server 218 are known to those skilled in the art.
- PLC 122 and/or OPC server 218can be configured so that the value of a particular memory register causes OPC server 218 to forward the standardized data to signal converters and data collectors.
- Such data collectionis referred to as triggered or unsolicited data collection.
- Data collected this waymay be further analyzed and formatted by RTLEs or data accumulations for storage in database 210 . This represents a data “push” model.
- a signal convertermay also “pull” data from OPC server 218 .
- Such requestsare typically forwarded to OPC server 218 which collects the appropriate data from its internal memory and returns the collected data to a signal converter 202 , again in the standardized format.
- Such data collection by signal convertersis referred to as non-triggered or solicited data collection.
- signal converters and data collectorsmay further analyze and format the data for storage in database 210 .
- Examples of OPC servers, signal converters and data collectors operating together to collect data from PLCs and storing the data in a databaseare provided in U.S. Pat. No. 6,862,486, which is incorporated herein by reference.
- Signal converters 202receive “raw” data items, such as event and state signals, from sensors or OPC servers and convert them to counter and time data.
- Each data itemincludes data retrieved from a memory register indicating a value of a monitored condition of a PLC 122 , information regarding the source of the data item (i.e. asset 102 ) and may also include time information about the data which is provided by OPC server 218 .
- Each of the collected data, or information derived therefrom,is stored as records in one or more tables in database 210 .
- the collected datamay be accumulator data such as a number of parts processed by an asset in a time interval (count), or total idle time of a machine during a time interval (time), or the collected data may be incident data, typically having a start time, an end time and a duration. Such data is typically generated when a monitored condition of an asset 102 switches from an “on” status to an “off” status or vice versa.
- Data collected at PLCs and further processed by signal convertersare in general explicitly or implicitly associated with a time marker.
- the time markerassociates each record for a data item with either a time interval or a time of recordal. Having independent records with an associated time marker provides flexibility when processing and manipulating the records. Further information, such as a percentage a machine spending in certain states, can also be derived, i.e., computed by the signal converter form basic time and counter data.
- RTLEs 204Signals collected at PLCs are forwarded to RTLEs 204 for processing.
- a RTLE 204is programmable and can be used to perform a variety of calculations and logic operations. Its memory, or registers, may also be programmed as timers or counters. RTLEs are generally easier to program than PLCs and are provided to off-load any required programming from a PLC or a group of PLCs connected thereto.
- a PLCcollects at least the starved bit 302 , the blocked bit 304 and the EOC bit 306 , which are all associated with their respective time information. By tracking the time a starved (or blocked) bit is switched on and off, i.e.
- the RTLE 204also allows the RTLE 204 to track the part-to-part cycle time and to generate a signal for accumulating part counts. Time spent between consecutive ends of cycle is measured or calculated to obtain a part-to-part cycle time. Total number of workpieces processed is also incremented each time the workstation is at the end of cycle. Other count data and timing signals such as buffer counts, time of a workpiece entering and exiting the workstation, may also be tracked and computed.
- the RTLE 204also tracks a measured cycle time to evaluate overcycle time for each workpiece immediately or shortly after the workstation completes processing the workpiece.
- the measured cycle timeis the time a workstation actually spent processing a workpiece. This is measured by computing, accumulating or tracking the duration between the time the workstation begins processing a workpiece and the time the workstation completes processing the workpiece. Load delays, unload delays and time spent during starved or blocked states are not included in a measured cycle time.
- the overcycle timenamely the difference between a measured cycle time and an ideal cycle time, is computed and accumulated.
- the overcycle timeis a measure of extra time spent by the workstation to process a workpiece and the measured cycle time represents an overcycled processing time.
- the ideal cycle timeis not a measured quantity. Rather, it is a design parameter, representing a designed production or processing rate or expected pace and is often known as “takt” time.
- Takt timerepresents a “beat”, or fixed pace, at which each workstation in a production line is expected to complete a processing cycle.
- takt timeactually represents the “beat” of the production line, not just individual workstations.
- Each workstationis expected to process a workpiece spending precisely its takt time, no more, nor less. If a workstation spends more time than the ideal cycle time to complete processing a workpiece, it is said to be overcycling.
- a workstationWhen a workstation overcycles, it slows down the sequential line. The line then can process workpieces at best at the rate of the overcycling workstation. When a workstation overcycles, it also can create starved condition for the immediate downstream workstation and blocked condition for the immediate upstream workstation, which may ripple through the entire line or facility.
- a workstationspends less time than the ideal cycle time to complete processing a workpiece, there is a speed-up of the workstation.
- a speed-updoes not necessarily contribute to the overall productivity of a facility, as other workstations are still operating at or below the expected rate, i.e., spending at least the takt time to complete a workpiece.
- a speed-up of a workstationactually may cause performance degradation as it may introduce blocked condition downstream into a sequential production line.
- takt timemay take into account the maximum processing capacity of a workstation, the tasks to be completed at a workstation, the part to be processed, and the overall production or processing rate of the line, among others.
- takt timeis a parameter varying from product to product, or model to model.
- Takt time data corresponding to different products, models, parts or tasksmay be conveniently stored in database 210 or other storage device for retrieval by RTLE 204 .
- the value of takt timecan be automatically adjusted or retrieved.
- Performance or throughput of a workstationcan be measured by comparing its cycle time against the ideal cycle time. There is a reduction of throughput when a workstation spends extra time to process a workpiece, i.e., when there is a non-zero overcycle time. What is not evident is that speed-up at any workstation generally does not contribute to a production line's throughput and that its inclusion in the computation of throughput may obscure the source of constraints. To exclude speed-up, overcycle time is set to zero, rather than some computed negative value.
- the throughput capability measurecan be computed from the following formula:
- T expectedT expected + T overcycle
- T expectedthe total overcycle time spent by a workstation processing individual workpieces over a given accumulation period.
- T expectedis the total amount of time expected for processing the total number of workpieces during the accumulation period.
- the sum, T expected +T overcyclerepresents an accumulated overcycled processing time.
- RTLEs 204are programmed to compute the throughput capacity for each of the workstations 102 .
- RTLEs 204also analyze time and count data and carry out further computations of other performance related parameters. For example, overall attainment of a workstation (or each production line or the entire facility), a performance indicator, can be computed from a total number of workpieces processed and the total time the workstation has been available (i.e., total lapsed time excluding accumulated downtime). Other quantities that can be computed from the data collected may include jobs per hour (JPH), mean time between failures (MTBF), or mean time to repair (MTTR).
- JPHjobs per hour
- MTBFmean time between failures
- MTTRmean time to repair
- data received from workstationscan be analyzed to obtain overall percentages of accumulated time a workstation spent in a loss state, such as blocked state, starved state, or downtime state, or to categorize overall percentage of losses by categories, such as uptime losses, downtime losses, or speed losses, or any other derived performance indicators.
- a loss statesuch as blocked state, starved state, or downtime state
- categoriessuch as uptime losses, downtime losses, or speed losses, or any other derived performance indicators.
- Data accumulators 206collect data from RTLEs 204 and passes the collected data to queue manager 220 for insertion into the database 210 .
- a data accumulatormay simply pass the collected data to the queue manager, in which case the data accumulator is essentially a transitory storage for holding and buffering the collected data. The buffering helps reducing data loss in case of any network slowdown or latency, when data cannot be written in the database immediately. Further computation or manipulation may also be performed by data accumulators 206 . For example, accumulation of time or count may be performed by data accumulators 206 . Computation of percentages and other more complicated calculations may also be carried out by data accumulators 206 in principle.
- a data accumulatormay receive data from several RTLEs, as indicated with dashed lines in FIG. 2 .
- each queue managermay collect data from several data accumulators.
- the number of RTLEs a data accumulator can serveis generally determined by loads. Load also Generally determines the number of data accumulators a queue manager can serve.
- Queue manager 220handles data queues and inserts data into the database. Queue manager formats data items collected from data accumulators 206 , creating transaction messages, queuing such messages and updating database 210 with the data contained in these messages. Each transaction, for example, an SQL transaction, either creates or updates a record in database 210 .
- Data modeling engine 208provides a platform for the modeling and manipulation of data collected by and received from signal converters 202 and data accumulators 206 . It also acts as the platform for web-based applications and as the server that retrieves data from the database 210 .
- Report module 212is primarily a reporting tool that is part of or connected to the data modeling engine 208 . Report module 212 carries out the necessary calculations using data stored in the database 210 and provides, for example, plant configured reports on constraints, metrics and performance indicators.
- Visual presentation module 214is primarily responsible for producing display screens for visualizing collected and calculated information. It may provide webportals (not shown) or other visual or graphical display tools for visual presentation of information and data.
- Manual data entry tool 216is a software module or software tool that allows for manual data collection from plant floor on constraining assets, though it may also provide a user interface for entering other information. Manual data entry tool can also be used to help troubleshoot constraint issues at individual pieces of equipment or processes.
- the performance monitoring and management software system 130 shown in FIG. 2includes OPC servers, RTLEs, data accumulators, a queue manager and a data modeling engine, among others, these components do not have to reside in a single object or executable computer file, nor do they have to execute on a single computer hardware.
- these componentsdo not have to reside in a single object or executable computer file, nor do they have to execute on a single computer hardware.
- Other hardware and software configurationsare also possible. How to select a suitable hardware and software configuration is mostly an engineering choice.
- signals relating to losses at a workstationsuch as “Quality” signal, can be collected at machine level for further processing and analysis.
- Lossescan be categorized in different ways. Conveniently, one way to categorize losses is to categorize them into one of uptime, downtime, speed and quality losses. Each of these four categories highlights potential losses of throughput or first time quality capability at a machine level. These losses can be estimated from other signals, such as starved bit, blocked bit, or can be measured or validated with machine level data, i.e., data collected by PLCs or sensors installed at each workstation, or can be collected manually at each work station. As will be described below, manual entry screens can be provided for accepting user inputs and capturing the relevant information. Conveniently, a graphical user interface presented to users through display and input devices 132 may be employed for this purpose.
- Uptime lossesgenerally refer to losses at an asset while the asset is operational, i.e., losses not due to downtime of an asset. Both starved and blocked conditions create losses while the workstation is operational and are therefore also “uptime losses”. Other examples include time spent on trial-run of a process (therefore no products produced), operator's lunchtime, change-over of product types, or idle time when there is no demand.
- cycling time 406Time spent by a workstation from the moment a workpiece enters the workstation to the end of the ideal cycle time is referred to as cycling time 406 .
- Spending time longer than takt time but still below a thresholdis considered a speed loss 408 , i.e., a loss caused by slow down at an asset.
- the thresholdsuch as 110% of takt time, is to a large degree arbitrary. This threshold is generally selected by a user and based on the user's experience and knowledge of past performance of the asset.
- An asset spent time longer than the threshold to complete processing a workpieceis considered to have experienced downtime. Losses attributed to downtime are referred to as “downtime losses”, losses caused by downtime of an asset.
- overcycle time 410i.e., time between 100% takt time and end of cycle. Time spent processing a workpiece that is later discarded or requires reprocessing due to quality failure is categorized as quality loss.
- the following chartshows examples of deriving loss data from signals collected at PLCs and augmenting the derived data with manual entry data. It will be understood that the threshold levels are for illustration only and can be fully adjustable by a user depending on each machine function and cycle time.
- Loss Loss Data Speedclassify all cycle times from 100% to 110% of ideal Loss cycle time as speed losses
- Downtimecreate a down time loss incident when cycle time is Loss longer than 110% of ideal cycle time (reset on EOC) use manual entry screen for reason code entry
- Uptimecreate a starved incident or blocked incident when the Loss starved bit or blocked bit is on use manual entry screen for reason code entry Quality automated collection of number of parts discarded Loss manual data entry quantity reason comment asset location on part
- FIG. 4shows along a time axis losses that may be measured using signals collected by a PLC.
- FIG. 4shows starved loss 402 as loss occurred prior to a workpiece entering a workstation.
- Blocked lossesoccur after a workpiece is processed but unable to exit from a workstation.
- Blocked loss 404is shown as loss occurred after a workpiece is processed, i.e., after end of cycle (EOC).
- EOCend of cycle
- a downtime lossis considered to have occurred if the workstation spends longer than 110% of takt time to process a workpiece.
- the region between 110% of takt time (the threshold in this case) and end of cycleis marked as downtime region.
- a speed-loss 408is when the workstation spends less than 110% of takt time but longer than takt time to process a workpiece.
- the software system 130receives three basic signal data from PLCs 122 , converts the basic signals to time and count data and computes a throughput capability measure for each of the workstations 102 in the facility 100 .
- the computationmay be carried out using the expression shown in Equation (1), or a variation thereof.
- the resultsare analyzed to identity the constraint. Other signals may also be collected, converted and accumulated, to facilitate analysis of causes of performance degradation.
- the results of computation and analysisare displayed graphically to a user for clear identification of constraints and further analysis.
- FIG. 5is a flow chart illustrating a process 500 for quantifying and identifying constraints in an automated manufacturing or processing facility by computing and monitoring a throughput capability measure for each of the workstations.
- the process 500involves the following steps:
- signals collected at step 502include state signals and event signals that a workstation is starved, blocked, or at the end of cycle. Also implicitly or explicitly collected are time information such as time and duration when these signals are turned on, kept on or turned off. Reason codes or brief description relating to degradation of performance of a workstation may be manually entered. The time an incident occurred may also be captured as a time stamp at the same time information is entered manually.
- Collected signalsare converted, i.e., transformed, to time and count data relating to performance of each workstation (step 504 ). For example, each time the workstation is at the end of cycle, which signals the completion of processing a workpiece, a total count of workpieces processed is incremented. Time spent between consecutive ends of cycle is calculated to obtain a part-to-part cycle time. A cycle time computed from the same workpiece's entrance time and exit time or accumulated using a timer can be used to compute a unit overcycle time. When amount of time in starved and blocked states is tracked, the unit overcycle time also excludes the amount of time in starved and blocked states. Similarly, when a workstation has built-in load delay or unload delay, such delays are also excluded from the unit overcycle time. A total overcycle time is accumulated from unit overcycle time of all workpieces processed over an accumulation period (step 506 ).
- a downtime event triggeris generated if a workstation takes longer than a threshold to process a workpiece.
- the thresholdmay be, for example, 110% of takt time, or any suitable percentage of takt time. Any time above the threshold is counted toward the workstation's downtime loss. Of course, some other threshold, such as a value between 110% and 200% (or outside this range if appropriate), may be selected.
- the total time attributable to a workstation's downtimeis accumulated over the accumulation period as well (step 506 ). By generating an event trigger and accumulating time loss in its specific category, the count and time data can be used to analyze losses in separate categories, which help isolating and identifying causes of low throughput. Other time and counts related to performance degradation, such as scrap loss, speed loss, quality loss, among others, are also accumulated at this step.
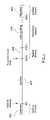
- FIG. 5Billustrates the processing of three consecutive workpieces by a workstation by plotting along a timeline 520 various time markers associated with monitored state and event signals. Derived state and event signals are also plotted against their own respective timelines.
- the segment of timeline 520which illustrates the cycles of a workstation.
- the segment of timeline 520 in FIG. 5Bshows only four EOC signals 522 .
- the duration of an EOC signalis arbitrary and is selectable by a user.
- the end of an EOC signal(or any fixed point of an EOC signal) can be conveniently used to mark the beginning of a cycle.
- the segment of timeline 520is divided by these four EOC signals into three sections, labeled as C 1 , C 2 and C 3 , representing, respectively, the first cycle, the second cycle and the third cycle.
- Athe end of each EOC signal, a workpiece count is generated so that the total number of workpieces processed by a workstation over a given time period can be accumulated.
- Also converted and accumulated in each cycleare the other two basic signals, namely blocked signal and starved signal, and other time and count signals such as P2PSA signal, downtime loss count etc.
- the cyclebegins at time T 0 .
- the workstationanticipates that a workpiece will be loaded and that the “Part Present” bit 312 will be turned on.
- the workpieceis not loaded until a time T S later.
- the time T Srepresents a starved period.
- the workpieceis loaded at time T 1 and processing of the workpiece begins.
- the processingis completed at time T 2 .
- the duration (T 2 ⁇ T 1 )is the part-to-part stand-alone time, or P2PSA time. In this cycle, the P2PSA time is longer than takt time, the ideal cycle time.
- the overcycle timeis (P2PSA ⁇ takt).
- the workstationAfter the processing of the workpiece is completed, the workstation expects the workpiece to be unloaded within a built-in unload delay and to exit the workstation. However, in this cycle, the workstation is unable to unload the completed workpiece within the unload delay, T UD , because the workstation is blocked. The workpiece is unloaded only after T B , the duration when the workstation is blocked. The “Blocked” bit 304 is cleared at the moment T 3 when the workpiece is unloaded. The EOC signal is also generated to signal the beginning of the next cycle, which begins at T 4 , or T 0 ′.
- FIG. 3Bdepicts workstations with built-in load and unload delays but does not show any blocked nor starved conditions.
- P2PSA time shown in this exampleis a measured cycle time.
- a P2PSA signal 526is plotted, corresponding to the duration between T 1 and T 2 .
- This signalcan be generated by accumulating the time using a timer from the moment T 1 to the moment T 2 when the signal is switched off or can be calculated by computing the difference between the recorded time values of T 1 and T 2 .
- a Blocked signal 530is plotted, corresponding to the duration T B , when the workstation is blocked.
- a blocked count signalcan also be generated each time a Blocked signal is switched on so that the total number of occurrences of blocked condition can be tracked and analyzed.
- a starved signal 534is plotted, corresponding to the duration T S , when the workstation is starved.
- a starved count signalcan be generated each time the Starved signal is switched on to track the total number of occurrences of starved conditions.
- an overcycle signal 538is plotted, corresponding to the time period between T 2 and takt time, when the workstation is overcycling.
- An overcycle count signalcan also be generated each time the overcycle signal is switched on.
- the losscan be categorized into two types: speed loss if the workstation takes longer than takt time but shorter than a threshold, or downtime loss if the workstation takes longer than the threshold to process the workpiece.
- a separate count signal indicating an occurrence of either a speed loss or a downtime losscan be conveniently generated, based on whether the P2PSA time is longer or shorter than the threshold, usually expressed as a percentage (e.g., 110%) of the takt time.
- the cycle C 2illustrates the next cycle, i.e., the processing of the next workpiece, in which the workstation is not starved nor blocked and the workstation spends less than takt time to complete processing the workpiece.
- a P2PSA signalis plotted, corresponding to the actual time the workstation spends to process the workpiece.
- the Starved signal timeline 532 and the Overcycle signal timeline 536only a spike 540 is plotted, indicating that the duration the workstation is blocked, starved and overcycling, respectively, is zero. It should be noted that because the workstation spends less than the takt time to complete processing the workpiece, there is a speed-up. However, this speed-up is excluded from the calculation and the overcycle time is set to zero.
- the cycle C 3illustrates a cycle in which the workstation is starved and blocked but spends exactly the takt time to complete processing the workpiece.
- Non-zero blocked time and non-zero starved timeare plotted on the Blocked signal timeline 528 and Starved signal timeline 532 , but on the Overcycle signal timeline 536 there is only a spike to indicate that there is no overcycle time during this cycle.
- the time and count dataare converted from raw signals received from a PLC
- the time and count dataare accumulated.
- the P2PSA timeis accumulated to obtain an accumulated P2PSA time over an accumulation period.
- the workpiece count datais accumulated to obtain a total count of workpieces processed during the accumulation period.
- the blocked time, starved time, overcycle time, total occurrences of speed loss, downtime loss etc.can all be accumulated.
- the accumulation of time and count datacan be carried out using special purpose counters or calculated from stored signal data along with their respective time information.
- the P2PSA timecan be accumulated by turning on a P2PSA timer each time the P2PSA signal comes on and switching off the P2PSA timer when the P2PSA signal subsequently is turned off.
- the value accumulated by the P2PSA timerwill be the accumulated P2PSA time.
- a P2PSA timealso can be computed for each cycle from the formula (T 2 ⁇ T 1 ) and an accumulated P2PSA time can be found by summing the P2PSA time from all cycles over the accumulation period.
- any variation, using any combinations of timer accumulation and calculation of time valuescan be used to obtain the accumulated P2PSA time.
- Other accumulated time values and accumulated count valuescan also be similarly obtained either by using timers or counters, or from calculations using the converted and recorded signal data, or using a combination of timers, counters and calculations.
- signal collection and data conversionare described here as two steps, they may be performed by a single piece of hardware or a combination of hardware and software.
- a PLCcan perform signal collection and part of data conversion, or a PLC or a set of sensors can be used for nothing but collecting signals and off-load all of data conversion to RTLE.
- a time and count signal convertermay be implemented as a RTLE, part of a PLC or a combination of a RTLE and a PLC, among others.
- the throughput capability measureis computed from the formula at step 508 , for example, using the formula shown in Equation (1).
- the throughput indicator, or the throughput capability measureis calculated and updated almost in real-time, as each workpiece is being processed by the workstation or shortly thereafter.
- the value of the indicator itselfreflects the behavior of a workstation over a long accumulation period, typically days, weeks or even months, over which each workstation's unit overcycling time is accumulated.
- the calculation of the throughput capability itselfis historical in nature.
- the resultscan be displayed graphically to clearly show the performance of each workstation.
- the resultscan also be analyzed to identify a constraint (step 510 ). Different criteria can be used for identifying a constraint using the computed throughput capability measures.
- a criteriais generally pre-selected by a user from a pool of suitable criteria or may be directly entered by a user. For example, a constraint can be identified as a workstation that has the lowest throughput capability measure among all workstations in the production line.
- FIG. 6shows a graphical representation 600 of two production lines (Line 1 and Line 2 ) linked sequentially together.
- Each production linehas a number of workstation icons 602 , representing sequentially linked workstations.
- a throughput capability measure corresponding to each workstationis displayed numerically inside the workstation's icon 602 .
- the iconsmay also be color coded to indicate if the workstation is operating at or near maximum capacity, at reduced capacity, or is considered a constraint. For example, the constraint, having the lowest throughput capability, may be colored red. The next group of workstations, having the next lowest throughput capability, are colored yellow. The remaining workstations may be represented by icons colored green.
- a buffer icon 604showing the percentage the buffer is full (right half 606 showing the present value; left half 608 showing the average value over the accumulation period).
- a starved icon 610a circle to the left of each production line, indicates the percentage of capacity loss due to starved conditions at the input point of a production line.
- a blocked icon 612the triangle to the right of each production line, indicates the percentage of capacity loss due to the blocked conditions at the exit point of the production line.
- FIG. 7is an exemplary throughput capability and balance map 700 . It shows a plurality of production lines linked in sequential and parallel fashions.
- the throughput capability and balance map 700 shown in FIG. 7provides a concise and clear view of performances of all automated assets 102 in a facility 100 .
- the map 700represents six production lines 702 , Lines A to E and Line I.
- the output of Line Ais supplied to Line B as input, in a sequential link.
- the output of Line Cis supplied to Line D as its input.
- the outputs of Lines B, D, Eare all provided to Line I, which are processed and combined by Line I, as products at the exist point of Line I.
- the map 700also displays numerically additional performance indicators, such as attainment 704 , FTQ 706 (first time quality) and OEE 708 (overall equipment efficiency).
- other performance indicators measuring the performance of the entire facilitysuch as JPH, MTBF, or MTTR, may also be displayed on the map 700 .
- the map 700may also provide actuatable regions (or “clickable areas”) allowing a user to drill down, i.e., to request and display more detailed information about a workstation. Any icons corresponding to a workstation, a buffer, an input point or an exit point, such as a workstation icon 602 , may be rendered “clickable”. A user may “click” an icon using a computer pointing device to bring up another screen which provides more detailed information than the simple numerical value displayed in the icon. Further drill-down may be provided so that each screen activated by clicking an icon may have on it additional actuatable regions for displaying even more detailed information, and so on.
- FIG. 8is an exemplary screen showing detailed information relating to different categories of losses.
- This screenmay be displayed by actuating one of the workstation icons 602 .
- the screenhas four separate loss information regions 802 , each for a type of loss.
- Each loss information region 802provides details related to that type of loss. For example, in the speed loss region 804 , displayed are details such as total overcycle time, total number of equivalent workpieces lost due to speed loss over the accumulation period, the total number of occurrences in which a workpiece experience overcycle, etc.
- Further drill-down, such as a breakdown of cycle time 806 , or cycle time details 808can be requested through actuatable regions, or clickable buttons, in the speed loss region 804 .
- the screen 800also provides tabs such as OEE tab 810 , Cycle Breakdown tab 812 , for accessing other types of detailed information. It will be appreciated that the content of the detailed information as well as the type of detailed information are not restricted to what are shown in FIG. 8 and may be any that are suitable or desirable according to a specific application or user requirements.
- FIG. 9is another exemplary screen display showing detailed information related to OEE.
- FIG. 10is one such exemplary screen display.
- the screenhas data entry region 1002 and a form window 1004 .
- an operatoronly needs to enter the quantity of workpieces that are discarded for quality defects and select a reason code from a pull-down menu 1006 .
- a brief commentmay also be entered in the “Comment” box 1008 .
- the input received from the operatorwill be recorded, together with a “record time” that can be automatically retrieved from the system and recorded.
- This new entrycan also be displayed in a form window 1004 below the data entry region 1002 for review and correction, if necessary. This allows the generation of statistics of reasons or reason codes corresponding to causes of losses or performance degradation.
- FIG. 11is an exemplary screen display that shows the statistics of quality losses over the monitored period.
- the screen displayhas a text region 1102 and a graph region 1104 . Numerical results as well as textural information are displayed in the text region 1102 . The information displayed may include the time the information was entered, the quantity of loss due to a particular reason or having a particular reason code, as well as a description of a reason code.
- the graph region 1104is used for displaying a suitable graph 1106 showing the results of the statistical analysis.
- the graph 1106may be a histogram graph, a line graph, a bar chart, among others. A histogram graph is shown in FIG. 11 , together with legends 1108 showing the reason codes and their brief description. As the chart and the graph show, one reason code corresponds to the majority one of the losses, this screen helps to identify one area that may significantly improve the throughput.
Landscapes
- Engineering & Computer Science (AREA)
- Business, Economics & Management (AREA)
- Human Resources & Organizations (AREA)
- Strategic Management (AREA)
- Economics (AREA)
- Entrepreneurship & Innovation (AREA)
- Educational Administration (AREA)
- Game Theory and Decision Science (AREA)
- Development Economics (AREA)
- Marketing (AREA)
- Operations Research (AREA)
- Quality & Reliability (AREA)
- Tourism & Hospitality (AREA)
- Physics & Mathematics (AREA)
- General Business, Economics & Management (AREA)
- General Physics & Mathematics (AREA)
- Theoretical Computer Science (AREA)
- General Factory Administration (AREA)
- Management, Administration, Business Operations System, And Electronic Commerce (AREA)
Abstract
Description
Here, the total overcycle time, Tovercycle, is the time accumulated from overcycle time spent by a workstation processing individual workpieces over a given accumulation period. Texpectedis the total amount of time expected for processing the total number of workpieces during the accumulation period. The sum, Texpected+Tovercycle, represents an accumulated overcycled processing time. In one embodiment, a simple formula can be used, which is Texpected=Nunits×(Takt Time), where Takt Time is the ideal cycle time and Nunitsis the total number of workpieces processed. Further variations of the simple formula (Eq. (1)) is also possible, wherein any non-zero Tovercyclereduces the value of the throughput capability measure. Conveniently,
| Loss | Loss Data |
| Speed | classify all cycle times from 100% to 110% of ideal |
| Loss | cycle time as speed losses |
| Downtime | create a down time loss incident when cycle time is |
| Loss | longer than 110% of ideal cycle time (reset on EOC) |
| use manual entry screen for reason code entry | |
| Uptime | create a starved incident or blocked incident when the |
| Loss | starved bit or blocked bit is on |
| use manual entry screen for reason code entry | |
| Quality | automated collection of number of parts discarded |
| Loss | manual data entry |
| quantity | |
| reason | |
| comment | |
| asset | |
| location on part | |
- automated collection of starved, blocked and EOC signals from workstations in an automated manufacturing and processing facility (step502)
- conversion of collected signals to overcycle time and part count data (step504)
- accumulation of overcycle time spent in processing each workpiece and accumulation of a total count of workpieces processed over a given period (step506);
- computation of a throughput capability measure using the accumulated overcycle time and the total number of workpieces processed (step508); and
- a identifying a constraint or constraints (step510).
Claims (25)
Priority Applications (5)
| Application Number | Priority Date | Filing Date | Title |
|---|---|---|---|
| US11/691,083US7379782B1 (en) | 2007-03-26 | 2007-03-26 | System and method of monitoring and quantifying performance of an automated manufacturing facility |
| EP07719492AEP2140430A4 (en) | 2007-03-26 | 2007-04-10 | System and method of monitoring and quantifying performance of an automated manufacturing facility |
| PCT/CA2007/000562WO2008116282A1 (en) | 2007-03-26 | 2007-04-10 | System and method of monitoring and quantifying performance of an automated manufacturing facility |
| CN2007800523958ACN101939766A (en) | 2007-03-26 | 2007-04-10 | System and method for monitoring and quantifying performance of automated production equipment |
| CA002680476ACA2680476A1 (en) | 2007-03-26 | 2007-04-10 | System and method of monitoring and quantifying performance of an automated manufacturing facility |
Applications Claiming Priority (1)
| Application Number | Priority Date | Filing Date | Title |
|---|---|---|---|
| US11/691,083US7379782B1 (en) | 2007-03-26 | 2007-03-26 | System and method of monitoring and quantifying performance of an automated manufacturing facility |
Publications (1)
| Publication Number | Publication Date |
|---|---|
| US7379782B1true US7379782B1 (en) | 2008-05-27 |
Family
ID=39426936
Family Applications (1)
| Application Number | Title | Priority Date | Filing Date |
|---|---|---|---|
| US11/691,083ActiveUS7379782B1 (en) | 2007-03-26 | 2007-03-26 | System and method of monitoring and quantifying performance of an automated manufacturing facility |
Country Status (5)
| Country | Link |
|---|---|
| US (1) | US7379782B1 (en) |
| EP (1) | EP2140430A4 (en) |
| CN (1) | CN101939766A (en) |
| CA (1) | CA2680476A1 (en) |
| WO (1) | WO2008116282A1 (en) |
Cited By (70)
| Publication number | Priority date | Publication date | Assignee | Title |
|---|---|---|---|---|
| US20090119669A1 (en)* | 2007-11-06 | 2009-05-07 | David Everton Norman | User-specified configuration of scheduling services |
| US20090119618A1 (en)* | 2007-11-06 | 2009-05-07 | David Everton Norman | User-specified configuration of prediction services |
| US20090234482A1 (en)* | 2008-03-13 | 2009-09-17 | Nec Electronics Corporation | System, program and method for calculating equipment load factor |
| US20100010879A1 (en)* | 2008-07-08 | 2010-01-14 | Ford Motor Company | Productivity operations system and methodology for improving manufacturing productivity |
| US7660680B1 (en)* | 2006-06-26 | 2010-02-09 | Rockwell Automation Technologies, Inc. | Systems and methods for totalizing parallel feeds |
| US20100063606A1 (en)* | 2008-09-11 | 2010-03-11 | Siemens Corporate Research, Inc. | Automated derivation of a logic-controller-behavior-model from a mechanical-machine-operation-model |
| US20100082396A1 (en)* | 2008-09-29 | 2010-04-01 | Fisher-Rosemount Systems, Inc. | Event Synchronized Reporting in Process Control Systems |
| US20100131522A1 (en)* | 2008-11-24 | 2010-05-27 | Hien Duy Dam | Methods and systems for automated data mapping and analysis |
| US20100268521A1 (en)* | 2009-04-17 | 2010-10-21 | Rainer Heller | Monitoring An Automation System |
| WO2010121097A1 (en)* | 2009-04-17 | 2010-10-21 | Siemens Aktiengesellschaft | Monitoring an automation system |
| US20100318200A1 (en)* | 2009-06-12 | 2010-12-16 | Honeywell International Inc. | Method and System for Providing an Integrated Building Summary Dashboard |
| US7882394B2 (en) | 2005-07-11 | 2011-02-01 | Brooks Automation, Inc. | Intelligent condition-monitoring and fault diagnostic system for predictive maintenance |
| US20110106577A1 (en)* | 2008-07-11 | 2011-05-05 | Fujitsu Limited | Business flow analysis method and apparatus |
| US20110137432A1 (en)* | 2009-12-09 | 2011-06-09 | Comau S.P.A. | Automation management system and method |
| US20110184563A1 (en)* | 2010-01-27 | 2011-07-28 | Honeywell International Inc. | Energy-related information presentation system |
| EP2458466A1 (en)* | 2010-11-30 | 2012-05-30 | Industrial Development of Automotivo Components, IDACO corp | Automatic supervision and control system |
| US8392135B2 (en) | 2010-08-12 | 2013-03-05 | Smurfit-Stone Container Enterprises, Inc. | Methods and systems for analyzing performance of a sorting system |
| US20130173748A1 (en)* | 2012-01-02 | 2013-07-04 | Lsis Co., Ltd. | Apparatus and method for processing project information for cross-platform |
| CN103353954A (en)* | 2013-06-04 | 2013-10-16 | 上海华力微电子有限公司 | Dynamic capacity allocation system and method |
| WO2014044311A1 (en)* | 2012-09-20 | 2014-03-27 | Abb Technology Ltd | Overall equipment effectiveness of a robot cell |
| US8947437B2 (en) | 2012-09-15 | 2015-02-03 | Honeywell International Inc. | Interactive navigation environment for building performance visualization |
| EP2831819A1 (en)* | 2012-03-26 | 2015-02-04 | GEA Food Solutions Germany GmbH | Method for checking the availability of the components of a production and/or packaging line |
| US8984461B1 (en)* | 2013-10-02 | 2015-03-17 | Jasper Design Automation, Inc. | Visualization constraints for circuit designs |
| US9104650B2 (en) | 2005-07-11 | 2015-08-11 | Brooks Automation, Inc. | Intelligent condition monitoring and fault diagnostic system for preventative maintenance |
| US20150277416A1 (en)* | 2014-03-31 | 2015-10-01 | Mitsubishi Electric Research Laboratories, Inc. | Method for Anomaly Detection in Discrete Manufacturing Processes |
| WO2017192680A1 (en)* | 2016-05-05 | 2017-11-09 | Georgia-Pacific Corrugated Llc | System and method for tracking a box and correlating a quality characteristic of the box to an overall equipment effectiveness of a packaging line that manipulates the box during a product packaging process |
| US9824318B1 (en)* | 2013-09-25 | 2017-11-21 | Amazon Technologies, Inc. | Generating labor requirements |
| EP3213301A4 (en)* | 2014-10-30 | 2018-05-30 | Gebo Cermex Canada Inc. | Method and device for tracking a product processing line |
| US20180174084A1 (en)* | 2016-12-16 | 2018-06-21 | Fujitsu Limited | Device for deciding number of persons to be assigned and method for deciding number of persons to be assigned |
| US10310472B2 (en) | 2014-10-23 | 2019-06-04 | Comau S.P.A. | System for monitoring and controlling an industrial plant |
| EP3540698A1 (en)* | 2018-03-15 | 2019-09-18 | HOMAG GmbH | Method for error detection and system for machining a workpiece |
| EP3540699A1 (en)* | 2018-03-15 | 2019-09-18 | HOMAG GmbH | Method for error detection and system for machining a workpiece |
| FR3081740A1 (en)* | 2018-06-05 | 2019-12-06 | Psa Automobiles Sa | METHOD FOR ASSEMBLING PARTS ON AN ASSEMBLY LINE |
| US10503158B2 (en)* | 2016-12-14 | 2019-12-10 | General Electric Company | System and method for reconstructing and augmenting high frequency data |
| US20200174444A1 (en)* | 2018-11-30 | 2020-06-04 | Lear Corporation | Assembly line tool test carrier and method of using |
| EP3696638A1 (en)* | 2019-02-13 | 2020-08-19 | Schleuniger Holding AG | Method for fabricating of a wire harness on a wire harness assembly line and wire harness assembly line for fabricating of a wire harness |
| US10877452B2 (en) | 2018-05-04 | 2020-12-29 | Comau S.P.A. | Method of monitoring the operating state of a processing station, corresponding monitoring system and computer program product |
| US10893016B2 (en) | 2010-09-13 | 2021-01-12 | Events.Com, Inc. | Systems and methods for electronic communication using unique identifiers associated with electronic addresses |
| WO2021050806A1 (en)* | 2019-09-13 | 2021-03-18 | Throughput, Inc. | Rapid operational analysis method and device for supply chain management |
| US10978199B2 (en) | 2019-01-11 | 2021-04-13 | Honeywell International Inc. | Methods and systems for improving infection control in a building |
| CN112823317A (en)* | 2018-10-08 | 2021-05-18 | 崔相守 | Computing system for analyzing plant and method for managing plant using the same |
| US11030558B2 (en)* | 2019-02-19 | 2021-06-08 | Kabushiki Kaisha Isowa | System and device for evaluating operation result of corrugated paperboard box making machine |
| US11164123B2 (en)* | 2019-02-19 | 2021-11-02 | Kabushiki Kaisha Isowa | System and device for evaluating operation result of corrugated paperboard box making machine |
| US11184739B1 (en) | 2020-06-19 | 2021-11-23 | Honeywel International Inc. | Using smart occupancy detection and control in buildings to reduce disease transmission |
| WO2021262888A1 (en)* | 2020-06-24 | 2021-12-30 | Applied Materials, Inc. | Scheduling substrate routing and processing |
| US11288945B2 (en) | 2018-09-05 | 2022-03-29 | Honeywell International Inc. | Methods and systems for improving infection control in a facility |
| JP2022083205A (en)* | 2020-11-24 | 2022-06-03 | シュナイダーエレクトリックホールディングス株式会社 | Programmable display |
| US11372383B1 (en) | 2021-02-26 | 2022-06-28 | Honeywell International Inc. | Healthy building dashboard facilitated by hierarchical model of building control assets |
| US11402113B2 (en) | 2020-08-04 | 2022-08-02 | Honeywell International Inc. | Methods and systems for evaluating energy conservation and guest satisfaction in hotels |
| US11474489B1 (en) | 2021-03-29 | 2022-10-18 | Honeywell International Inc. | Methods and systems for improving building performance |
| US11620594B2 (en) | 2020-06-12 | 2023-04-04 | Honeywell International Inc. | Space utilization patterns for building optimization |
| US11619414B2 (en) | 2020-07-07 | 2023-04-04 | Honeywell International Inc. | System to profile, measure, enable and monitor building air quality |
| US11662115B2 (en) | 2021-02-26 | 2023-05-30 | Honeywell International Inc. | Hierarchy model builder for building a hierarchical model of control assets |
| US20230195092A1 (en)* | 2021-12-22 | 2023-06-22 | Multivac Sepp Haggenmueller Se & Co. Kg | Production line for manufacturing packaged products with predictive determination of required operator interaction |
| WO2023158871A1 (en)* | 2022-02-21 | 2023-08-24 | Beet, Inc. | Method to identify and prioritize a bottleneck in a process |
| US11783658B2 (en) | 2020-06-15 | 2023-10-10 | Honeywell International Inc. | Methods and systems for maintaining a healthy building |
| US11783652B2 (en) | 2020-06-15 | 2023-10-10 | Honeywell International Inc. | Occupant health monitoring for buildings |
| US11823295B2 (en) | 2020-06-19 | 2023-11-21 | Honeywell International, Inc. | Systems and methods for reducing risk of pathogen exposure within a space |
| US11874647B2 (en)* | 2022-04-14 | 2024-01-16 | Chengdu Qinchuan Iot Technology Co., Ltd. | Industrial internet of things system for controlling production line parameter and control methods thereof |
| US11894145B2 (en) | 2020-09-30 | 2024-02-06 | Honeywell International Inc. | Dashboard for tracking healthy building performance |
| US11914336B2 (en) | 2020-06-15 | 2024-02-27 | Honeywell International Inc. | Platform agnostic systems and methods for building management systems |
| US12038187B2 (en) | 2021-09-28 | 2024-07-16 | Honeywell International Inc. | Multi-sensor platform for a building |
| US20240308781A1 (en)* | 2023-03-13 | 2024-09-19 | Gm Global Technology Oiperations Llc | Systems and methods for identifying and alerting of footprint over-cycle risks on multi-product general assembly lines |
| US12131828B2 (en) | 2020-06-22 | 2024-10-29 | Honeywell Internationa Inc. | Devices, systems, and methods for assessing facility compliance with infectious disease guidance |
| US12142382B2 (en) | 2021-03-01 | 2024-11-12 | Honeywell International Inc. | Airborne infection early warning system |
| US12142385B2 (en) | 2020-06-22 | 2024-11-12 | Honeywell International Inc. | Methods and systems for reducing a risk of spread of disease among people in a space |
| US12261448B2 (en) | 2022-06-07 | 2025-03-25 | Honeywell International Inc. | Low power sensor with energy harvesting |
| US12260140B2 (en) | 2017-03-31 | 2025-03-25 | Honeywell International Inc. | Providing a comfort dashboard |
| US12406218B2 (en) | 2020-06-15 | 2025-09-02 | Honeywell International Inc. | Dashboard for multi site management system |
| US12431621B2 (en) | 2023-01-26 | 2025-09-30 | Honeywell International Inc. | Compact dual band antenna |
Families Citing this family (18)
| Publication number | Priority date | Publication date | Assignee | Title |
|---|---|---|---|---|
| CN101727098B (en)* | 2008-10-21 | 2012-01-25 | 中芯国际集成电路制造(上海)有限公司 | Cycle time target measuring method and system |
| CN102645906B (en)* | 2012-04-10 | 2014-06-04 | 明玮机械(东莞)有限公司 | Equipment running monitoring method |
| CN103914026B (en)* | 2013-01-06 | 2016-09-28 | 上海西门子医疗器械有限公司 | Production status monitoring system and production status monitoring method |
| CN104217365A (en)* | 2013-06-03 | 2014-12-17 | 富泰华工业(深圳)有限公司 | Production arrangement-distribution system and method |
| CN106548260A (en)* | 2015-09-16 | 2017-03-29 | 北汽福田汽车股份有限公司 | A kind of method and device of customization vehicle production |
| BR112017001012A2 (en)* | 2016-12-12 | 2020-10-27 | Sicpa Holding Sa | system and method for tracking a product item on a production line |
| TWI643139B (en)* | 2017-05-08 | 2018-12-01 | 萬泰科技股份有限公司 | Production equipment management system |
| JP6933256B2 (en) | 2017-08-04 | 2021-09-08 | 東芝三菱電機産業システム株式会社 | Data playback equipment for industrial plants |
| TWI693564B (en)* | 2018-01-05 | 2020-05-11 | 竹陞科技股份有限公司 | Automatic equipment management system and method thereof |
| CN109445382B (en)* | 2018-09-30 | 2020-08-18 | 北京国双科技有限公司 | Processing capacity evaluation method and device, monitoring method and system for oil field combined station |
| JP7181554B2 (en)* | 2019-04-05 | 2022-12-01 | i Smart Technologies株式会社 | Production efficiency improvement support system |
| CN110489196A (en)* | 2019-08-20 | 2019-11-22 | 大湖科技(北京)有限公司 | Station management method, station managing device and computer readable storage medium |
| CN110618662B (en)* | 2019-08-28 | 2020-10-02 | 浙江树人学院(浙江树人大学) | Distributed cooperative control system for hybrid production line and control method thereof |
| CN110580579B (en)* | 2019-08-28 | 2023-05-30 | 上汽通用五菱汽车股份有限公司 | Internet-based automobile part provider capacity management method and system |
| US12282308B2 (en)* | 2019-09-16 | 2025-04-22 | Aveva Software, Llc | Intelligent process anomaly detection and trend projection system |
| CN110968057B (en)* | 2019-11-05 | 2022-01-28 | 天津大学 | Planning method for solving multi-objective optimization of intelligent manufacturing workshop |
| CN114428486B (en)* | 2021-12-31 | 2023-11-03 | 三一汽车制造有限公司 | Asphalt station production control method and device and asphalt station |
| CN119067618B (en)* | 2024-11-06 | 2025-02-25 | 微山县大维木制品有限公司 | Wood production and processing progress information management system based on cloud platform |
Citations (18)
| Publication number | Priority date | Publication date | Assignee | Title |
|---|---|---|---|---|
| US5446671A (en) | 1993-10-22 | 1995-08-29 | Micron Semiconductor, Inc. | Look-ahead method for maintaining optimum queued quantities of in-process parts at a manufacturing bottleneck |
| US5544350A (en) | 1994-07-05 | 1996-08-06 | Taiwan Semiconductor Manufacturing Co. | Ratio of running work in progress |
| US5946661A (en) | 1995-10-05 | 1999-08-31 | Maxager Technology, Inc. | Method and apparatus for identifying and obtaining bottleneck cost information |
| US6418351B1 (en) | 1999-03-30 | 2002-07-09 | International Business Machines Corporation | Determining the capacity components of tools/toolsets in a manufacturing line |
| US20020107602A1 (en) | 2000-04-07 | 2002-08-08 | Tadashi Nishida | Method for supporting maintenance of facility and system |
| US20020138169A1 (en) | 2001-03-22 | 2002-09-26 | Mitsuo Sakaguchi | Device for calculating overall plant efficiency |
| US6564113B1 (en)* | 2001-06-15 | 2003-05-13 | Advanced Micro Devices, Inc. | Lot start agent that calculates virtual WIP time in a multi-product and multi-bottleneck manufacturing environment |
| US6622055B2 (en) | 2001-01-16 | 2003-09-16 | United Microelectronics Corp. | Method of control management of production line |
| US6714830B2 (en) | 2000-02-28 | 2004-03-30 | Canon Kabushiki Kaisha | Push-type scheduling for semiconductor fabrication |
| US6725113B1 (en) | 2001-10-23 | 2004-04-20 | Advanced Micro Devices, Inc. | Lot start agent that determines virtual WIP time including an exponentially weighted moving average cycle time |
| US6740534B1 (en)* | 2002-09-18 | 2004-05-25 | Advanced Micro Devices, Inc. | Determination of a process flow based upon fault detection analysis |
| US20040243268A1 (en) | 2003-05-27 | 2004-12-02 | Chiung-Fang Hsieh | Process tool throughput monitoring system and method |
| US6856847B2 (en) | 2002-06-19 | 2005-02-15 | Taiwan Semiconductor Manufacturing Co., Ltd | Method of identifying bottlenecks and improving throughput in wafer processing equipment |
| US6862486B2 (en) | 2003-03-04 | 2005-03-01 | Activplant Corporation | System and method for processing data relating to conditions in a manufacturing process |
| WO2006044914A2 (en) | 2004-10-19 | 2006-04-27 | General Motors Corporation | Method, system and storage medium for managing automated system events |
| US20060100731A1 (en) | 2004-11-11 | 2006-05-11 | Omron Corporation | Information processing device, operation state management device, information processing method, program, and computer-readable storage medium storing program |
| US20070203606A1 (en)* | 2006-02-28 | 2007-08-30 | Thomas Quarg | Method and system for modeling a stream of products in a manufacturing environment by process and tool categorization |
| US20070282475A1 (en)* | 2006-05-31 | 2007-12-06 | Kilian Schmidt | Method and system for determining utilization of process tools in a manufacturing environment based on characteristics of an automated material handling system |
Family Cites Families (4)
| Publication number | Priority date | Publication date | Assignee | Title |
|---|---|---|---|---|
| FR2787411B1 (en)* | 1998-12-16 | 2001-02-09 | Renault | PROCESS FOR ORGANIZING THE PRODUCTION OF A MOUNTING LINE FOR VARIOUSLY EQUIPPED UNITS SUCH AS MOTOR VEHICLES |
| US6615092B2 (en)* | 2001-03-05 | 2003-09-02 | Dell Products L.P. | Method, system and facility for controlling resource allocation within a manufacturing environment |
| EP1365299A1 (en)* | 2002-05-16 | 2003-11-26 | Lucas Automotive Gmbh | Method of determining a potential capacity overload |
| JP2009025851A (en)* | 2007-07-17 | 2009-02-05 | Fujitsu Ltd | Work management apparatus and work management method |
- 2007
- 2007-03-26USUS11/691,083patent/US7379782B1/enactiveActive
- 2007-04-10CNCN2007800523958Apatent/CN101939766A/enactivePending
- 2007-04-10EPEP07719492Apatent/EP2140430A4/ennot_activeWithdrawn
- 2007-04-10WOPCT/CA2007/000562patent/WO2008116282A1/enactiveApplication Filing
- 2007-04-10CACA002680476Apatent/CA2680476A1/ennot_activeAbandoned
Patent Citations (18)
| Publication number | Priority date | Publication date | Assignee | Title |
|---|---|---|---|---|
| US5446671A (en) | 1993-10-22 | 1995-08-29 | Micron Semiconductor, Inc. | Look-ahead method for maintaining optimum queued quantities of in-process parts at a manufacturing bottleneck |
| US5544350A (en) | 1994-07-05 | 1996-08-06 | Taiwan Semiconductor Manufacturing Co. | Ratio of running work in progress |
| US5946661A (en) | 1995-10-05 | 1999-08-31 | Maxager Technology, Inc. | Method and apparatus for identifying and obtaining bottleneck cost information |
| US6418351B1 (en) | 1999-03-30 | 2002-07-09 | International Business Machines Corporation | Determining the capacity components of tools/toolsets in a manufacturing line |
| US6714830B2 (en) | 2000-02-28 | 2004-03-30 | Canon Kabushiki Kaisha | Push-type scheduling for semiconductor fabrication |
| US20020107602A1 (en) | 2000-04-07 | 2002-08-08 | Tadashi Nishida | Method for supporting maintenance of facility and system |
| US6622055B2 (en) | 2001-01-16 | 2003-09-16 | United Microelectronics Corp. | Method of control management of production line |
| US20020138169A1 (en) | 2001-03-22 | 2002-09-26 | Mitsuo Sakaguchi | Device for calculating overall plant efficiency |
| US6564113B1 (en)* | 2001-06-15 | 2003-05-13 | Advanced Micro Devices, Inc. | Lot start agent that calculates virtual WIP time in a multi-product and multi-bottleneck manufacturing environment |
| US6725113B1 (en) | 2001-10-23 | 2004-04-20 | Advanced Micro Devices, Inc. | Lot start agent that determines virtual WIP time including an exponentially weighted moving average cycle time |
| US6856847B2 (en) | 2002-06-19 | 2005-02-15 | Taiwan Semiconductor Manufacturing Co., Ltd | Method of identifying bottlenecks and improving throughput in wafer processing equipment |
| US6740534B1 (en)* | 2002-09-18 | 2004-05-25 | Advanced Micro Devices, Inc. | Determination of a process flow based upon fault detection analysis |
| US6862486B2 (en) | 2003-03-04 | 2005-03-01 | Activplant Corporation | System and method for processing data relating to conditions in a manufacturing process |
| US20040243268A1 (en) | 2003-05-27 | 2004-12-02 | Chiung-Fang Hsieh | Process tool throughput monitoring system and method |
| WO2006044914A2 (en) | 2004-10-19 | 2006-04-27 | General Motors Corporation | Method, system and storage medium for managing automated system events |
| US20060100731A1 (en) | 2004-11-11 | 2006-05-11 | Omron Corporation | Information processing device, operation state management device, information processing method, program, and computer-readable storage medium storing program |
| US20070203606A1 (en)* | 2006-02-28 | 2007-08-30 | Thomas Quarg | Method and system for modeling a stream of products in a manufacturing environment by process and tool categorization |
| US20070282475A1 (en)* | 2006-05-31 | 2007-12-06 | Kilian Schmidt | Method and system for determining utilization of process tools in a manufacturing environment based on characteristics of an automated material handling system |
Non-Patent Citations (3)
| Title |
|---|
| International Search Report from PCT/CA2007/000562 dated Dec. 20, 2007. |
| Kren et al.: "Using Cycle Time to Measure Performance and Control Costs in Foucused Factories"; http://web.archive.org/web/*/http://www.uwm.edu/~Ikren/cycle%20time.pdf; dated Jul. 30, 2003 by web.archive.org and accessed by ISA on Dec. 19, 2007. Avaliable at http://www.uwm.edu/~Ikren/cycle%20time.pdf. |
| Szabados, Barna; "Intelligent Monitoring System Used to Control Asynchronous Production Systems": IEEE International Workshop on Virtual and Intelligent Measurement Systems; May 19-20, 2001; pp. 35-40; Budapest, Hungry. |
Cited By (119)
| Publication number | Priority date | Publication date | Assignee | Title |
|---|---|---|---|---|
| US9104650B2 (en) | 2005-07-11 | 2015-08-11 | Brooks Automation, Inc. | Intelligent condition monitoring and fault diagnostic system for preventative maintenance |
| US11650581B2 (en) | 2005-07-11 | 2023-05-16 | Brooks Automation Us, Llc | Intelligent condition monitoring and fault diagnostic system for preventative maintenance |
| US7882394B2 (en) | 2005-07-11 | 2011-02-01 | Brooks Automation, Inc. | Intelligent condition-monitoring and fault diagnostic system for predictive maintenance |
| US10845793B2 (en) | 2005-07-11 | 2020-11-24 | Brooks Automation, Inc. | Intelligent condition monitoring and fault diagnostic system for preventative maintenance |
| US8356207B2 (en) | 2005-07-11 | 2013-01-15 | Brooks Automation, Inc. | Intelligent condition monitoring and fault diagnostic system for preventative maintenance |
| US10120374B2 (en) | 2005-07-11 | 2018-11-06 | Brooks Automation, Inc. | Intelligent condition monitoring and fault diagnostic system for preventative maintenance |
| US7660680B1 (en)* | 2006-06-26 | 2010-02-09 | Rockwell Automation Technologies, Inc. | Systems and methods for totalizing parallel feeds |
| US20090119669A1 (en)* | 2007-11-06 | 2009-05-07 | David Everton Norman | User-specified configuration of scheduling services |
| US20090119618A1 (en)* | 2007-11-06 | 2009-05-07 | David Everton Norman | User-specified configuration of prediction services |
| US20090234482A1 (en)* | 2008-03-13 | 2009-09-17 | Nec Electronics Corporation | System, program and method for calculating equipment load factor |
| US20100010879A1 (en)* | 2008-07-08 | 2010-01-14 | Ford Motor Company | Productivity operations system and methodology for improving manufacturing productivity |
| US20110106577A1 (en)* | 2008-07-11 | 2011-05-05 | Fujitsu Limited | Business flow analysis method and apparatus |
| US8244570B2 (en)* | 2008-07-11 | 2012-08-14 | Fujitsu Limited | Business flow analysis method and apparatus |
| US20100063606A1 (en)* | 2008-09-11 | 2010-03-11 | Siemens Corporate Research, Inc. | Automated derivation of a logic-controller-behavior-model from a mechanical-machine-operation-model |
| US20100082396A1 (en)* | 2008-09-29 | 2010-04-01 | Fisher-Rosemount Systems, Inc. | Event Synchronized Reporting in Process Control Systems |
| US8874461B2 (en) | 2008-09-29 | 2014-10-28 | Fisher-Rosemount Systems, Inc. | Event synchronized reporting in process control systems |
| US8326666B2 (en) | 2008-09-29 | 2012-12-04 | Fisher-Rosemount Systems, Inc. | Event synchronized reporting in process control systems |
| US20100131522A1 (en)* | 2008-11-24 | 2010-05-27 | Hien Duy Dam | Methods and systems for automated data mapping and analysis |
| US8117218B2 (en) | 2008-11-24 | 2012-02-14 | The Boeing Company | Methods and systems for automated data mapping and analysis |
| US20100268521A1 (en)* | 2009-04-17 | 2010-10-21 | Rainer Heller | Monitoring An Automation System |
| WO2010121097A1 (en)* | 2009-04-17 | 2010-10-21 | Siemens Aktiengesellschaft | Monitoring an automation system |
| US20100318200A1 (en)* | 2009-06-12 | 2010-12-16 | Honeywell International Inc. | Method and System for Providing an Integrated Building Summary Dashboard |
| US8843221B2 (en)* | 2009-12-09 | 2014-09-23 | Comau Spa | Automation management system and method |
| US20110137432A1 (en)* | 2009-12-09 | 2011-06-09 | Comau S.P.A. | Automation management system and method |
| US8577505B2 (en) | 2010-01-27 | 2013-11-05 | Honeywell International Inc. | Energy-related information presentation system |
| US20110184563A1 (en)* | 2010-01-27 | 2011-07-28 | Honeywell International Inc. | Energy-related information presentation system |
| US8392135B2 (en) | 2010-08-12 | 2013-03-05 | Smurfit-Stone Container Enterprises, Inc. | Methods and systems for analyzing performance of a sorting system |
| US10893016B2 (en) | 2010-09-13 | 2021-01-12 | Events.Com, Inc. | Systems and methods for electronic communication using unique identifiers associated with electronic addresses |
| EP2458466A1 (en)* | 2010-11-30 | 2012-05-30 | Industrial Development of Automotivo Components, IDACO corp | Automatic supervision and control system |
| US20130173748A1 (en)* | 2012-01-02 | 2013-07-04 | Lsis Co., Ltd. | Apparatus and method for processing project information for cross-platform |
| EP2831819A1 (en)* | 2012-03-26 | 2015-02-04 | GEA Food Solutions Germany GmbH | Method for checking the availability of the components of a production and/or packaging line |
| US20150088587A1 (en)* | 2012-03-26 | 2015-03-26 | Gea Food Solutions Germany Gmbh | Method for checking the availability of the components of production and/or packaging line |
| US10921834B2 (en) | 2012-09-15 | 2021-02-16 | Honeywell International Inc. | Interactive navigation environment for building performance visualization |
| US9760100B2 (en) | 2012-09-15 | 2017-09-12 | Honeywell International Inc. | Interactive navigation environment for building performance visualization |
| US10429862B2 (en) | 2012-09-15 | 2019-10-01 | Honeywell International Inc. | Interactive navigation environment for building performance visualization |
| US12210363B2 (en) | 2012-09-15 | 2025-01-28 | Honeywell International Inc. | Interactive navigation environment for building performance visualization |
| US8947437B2 (en) | 2012-09-15 | 2015-02-03 | Honeywell International Inc. | Interactive navigation environment for building performance visualization |
| US11592851B2 (en) | 2012-09-15 | 2023-02-28 | Honeywell International Inc. | Interactive navigation environment for building performance visualization |
| CN104603803B (en)* | 2012-09-20 | 2019-09-13 | Abb瑞士股份有限公司 | Overall Equipment Efficiency of Robotic Cells |
| US9785905B2 (en) | 2012-09-20 | 2017-10-10 | Abb Schweiz Ag | Overall equipment effectiveness of a robot cell |
| WO2014044311A1 (en)* | 2012-09-20 | 2014-03-27 | Abb Technology Ltd | Overall equipment effectiveness of a robot cell |
| CN104603803A (en)* | 2012-09-20 | 2015-05-06 | Abb技术有限公司 | Overall equipment effectiveness of a robot cell |
| CN103353954A (en)* | 2013-06-04 | 2013-10-16 | 上海华力微电子有限公司 | Dynamic capacity allocation system and method |
| US9824318B1 (en)* | 2013-09-25 | 2017-11-21 | Amazon Technologies, Inc. | Generating labor requirements |
| US8984461B1 (en)* | 2013-10-02 | 2015-03-17 | Jasper Design Automation, Inc. | Visualization constraints for circuit designs |
| US20150277416A1 (en)* | 2014-03-31 | 2015-10-01 | Mitsubishi Electric Research Laboratories, Inc. | Method for Anomaly Detection in Discrete Manufacturing Processes |
| US10310472B2 (en) | 2014-10-23 | 2019-06-04 | Comau S.P.A. | System for monitoring and controlling an industrial plant |
| EP3213301A4 (en)* | 2014-10-30 | 2018-05-30 | Gebo Cermex Canada Inc. | Method and device for tracking a product processing line |
| US10977749B2 (en)* | 2016-05-05 | 2021-04-13 | Georgia-Pacific Corrugated Llc | System and method for tracking a box and correlating a quality characteristic of the box to an overall equipment effectiveness of a packaging line that manipulates the box during a product packaging process |
| US20170323400A1 (en)* | 2016-05-05 | 2017-11-09 | Georgia-Pacific Corrugated Llc | System and method for tracking a box and correlating a quality characteristic of the box to an overall equipment effectiveness of a packaging line that manipulates the box during a product packaging process |
| WO2017192680A1 (en)* | 2016-05-05 | 2017-11-09 | Georgia-Pacific Corrugated Llc | System and method for tracking a box and correlating a quality characteristic of the box to an overall equipment effectiveness of a packaging line that manipulates the box during a product packaging process |
| US10503158B2 (en)* | 2016-12-14 | 2019-12-10 | General Electric Company | System and method for reconstructing and augmenting high frequency data |
| US20180174084A1 (en)* | 2016-12-16 | 2018-06-21 | Fujitsu Limited | Device for deciding number of persons to be assigned and method for deciding number of persons to be assigned |
| US12260140B2 (en) | 2017-03-31 | 2025-03-25 | Honeywell International Inc. | Providing a comfort dashboard |
| US12393385B2 (en) | 2017-03-31 | 2025-08-19 | Honeywell International Inc. | Providing a comfort dashboard |
| CN110271072A (en)* | 2018-03-15 | 2019-09-24 | 豪迈股份公司 | Method and device for machining workpieces for detection error |
| CN110274624A (en)* | 2018-03-15 | 2019-09-24 | 豪迈股份公司 | Error detection method and workpiece processing apparatus |
| DE102018203977A1 (en)* | 2018-03-15 | 2019-09-19 | Homag Gmbh | Method for error detection and system for machining a workpiece |
| EP3540699A1 (en)* | 2018-03-15 | 2019-09-18 | HOMAG GmbH | Method for error detection and system for machining a workpiece |
| EP3540698A1 (en)* | 2018-03-15 | 2019-09-18 | HOMAG GmbH | Method for error detection and system for machining a workpiece |
| US10877452B2 (en) | 2018-05-04 | 2020-12-29 | Comau S.P.A. | Method of monitoring the operating state of a processing station, corresponding monitoring system and computer program product |
| EP3579070A1 (en)* | 2018-06-05 | 2019-12-11 | PSA Automobiles SA | Method for assembling parts on an assembly line |
| FR3081740A1 (en)* | 2018-06-05 | 2019-12-06 | Psa Automobiles Sa | METHOD FOR ASSEMBLING PARTS ON AN ASSEMBLY LINE |
| US11626004B2 (en) | 2018-09-05 | 2023-04-11 | Honeywell International, Inc. | Methods and systems for improving infection control in a facility |
| US11288945B2 (en) | 2018-09-05 | 2022-03-29 | Honeywell International Inc. | Methods and systems for improving infection control in a facility |
| US11940783B2 (en)* | 2018-10-08 | 2024-03-26 | Sang Su CHOI | Computing system for analyzing factory and method of using the computing system to manage factory |
| CN112823317B (en)* | 2018-10-08 | 2024-10-18 | 崔相守 | Computing system for analysis plant and method for managing plant using the same |
| US20210389757A1 (en)* | 2018-10-08 | 2021-12-16 | Sang Su CHOI | Computing System for Analyzing Factory and Method of Using the Computing System to Manage Factory |
| CN112823317A (en)* | 2018-10-08 | 2021-05-18 | 崔相守 | Computing system for analyzing plant and method for managing plant using the same |
| JP2022508633A (en)* | 2018-10-08 | 2022-01-19 | ス チェ,サン | Computing systems that analyze factories and how to use them to manage factories |
| US20200174444A1 (en)* | 2018-11-30 | 2020-06-04 | Lear Corporation | Assembly line tool test carrier and method of using |
| US11887722B2 (en) | 2019-01-11 | 2024-01-30 | Honeywell International Inc. | Methods and systems for improving infection control in a building |
| US12183453B2 (en) | 2019-01-11 | 2024-12-31 | Honeywell International Inc. | Methods and systems for improving infection control in a building |
| US12131821B2 (en) | 2019-01-11 | 2024-10-29 | Honeywell International Inc. | Methods and systems for improving infection control in a building |
| US10978199B2 (en) | 2019-01-11 | 2021-04-13 | Honeywell International Inc. | Methods and systems for improving infection control in a building |
| EP3696638A1 (en)* | 2019-02-13 | 2020-08-19 | Schleuniger Holding AG | Method for fabricating of a wire harness on a wire harness assembly line and wire harness assembly line for fabricating of a wire harness |
| WO2020165801A1 (en)* | 2019-02-13 | 2020-08-20 | Schleuniger Holding Ag | Method for fabricating of a wire harness on a wire harness assembly line and wire harness assembly line for fabricating of a wire harness |
| US11030558B2 (en)* | 2019-02-19 | 2021-06-08 | Kabushiki Kaisha Isowa | System and device for evaluating operation result of corrugated paperboard box making machine |
| US11164123B2 (en)* | 2019-02-19 | 2021-11-02 | Kabushiki Kaisha Isowa | System and device for evaluating operation result of corrugated paperboard box making machine |
| WO2021050806A1 (en)* | 2019-09-13 | 2021-03-18 | Throughput, Inc. | Rapid operational analysis method and device for supply chain management |
| US12118491B2 (en)* | 2019-09-13 | 2024-10-15 | Throughput, Inc. | Rapid operational analysis application for supply chain management |
| US12210986B2 (en) | 2020-06-12 | 2025-01-28 | Honeywell International Inc. | Space utilization patterns for building optimization |
| US11620594B2 (en) | 2020-06-12 | 2023-04-04 | Honeywell International Inc. | Space utilization patterns for building optimization |
| US11783652B2 (en) | 2020-06-15 | 2023-10-10 | Honeywell International Inc. | Occupant health monitoring for buildings |
| US12406218B2 (en) | 2020-06-15 | 2025-09-02 | Honeywell International Inc. | Dashboard for multi site management system |
| US12437597B2 (en) | 2020-06-15 | 2025-10-07 | Honeywell International Inc. | Methods and systems for maintaining a healthy building |
| US11914336B2 (en) | 2020-06-15 | 2024-02-27 | Honeywell International Inc. | Platform agnostic systems and methods for building management systems |
| US11783658B2 (en) | 2020-06-15 | 2023-10-10 | Honeywell International Inc. | Methods and systems for maintaining a healthy building |
| US11823295B2 (en) | 2020-06-19 | 2023-11-21 | Honeywell International, Inc. | Systems and methods for reducing risk of pathogen exposure within a space |
| US12282975B2 (en) | 2020-06-19 | 2025-04-22 | Honeywell International Inc. | Systems and methods for reducing risk of pathogen exposure within a space |
| US11778423B2 (en) | 2020-06-19 | 2023-10-03 | Honeywell International Inc. | Using smart occupancy detection and control in buildings to reduce disease transmission |
| US11184739B1 (en) | 2020-06-19 | 2021-11-23 | Honeywel International Inc. | Using smart occupancy detection and control in buildings to reduce disease transmission |
| US12142385B2 (en) | 2020-06-22 | 2024-11-12 | Honeywell International Inc. | Methods and systems for reducing a risk of spread of disease among people in a space |
| US12131828B2 (en) | 2020-06-22 | 2024-10-29 | Honeywell Internationa Inc. | Devices, systems, and methods for assessing facility compliance with infectious disease guidance |
| US20220365516A1 (en)* | 2020-06-24 | 2022-11-17 | Applied Materials, Inc. | Scheduling substrate routing and processing |
| US12282315B2 (en)* | 2020-06-24 | 2025-04-22 | Applied Materials, Inc. | Scheduling substrate routing and processing |
| US11385628B2 (en) | 2020-06-24 | 2022-07-12 | Applied Materials, Inc. | Scheduling substrate routing and processing |
| WO2021262888A1 (en)* | 2020-06-24 | 2021-12-30 | Applied Materials, Inc. | Scheduling substrate routing and processing |
| US11619414B2 (en) | 2020-07-07 | 2023-04-04 | Honeywell International Inc. | System to profile, measure, enable and monitor building air quality |
| US11402113B2 (en) | 2020-08-04 | 2022-08-02 | Honeywell International Inc. | Methods and systems for evaluating energy conservation and guest satisfaction in hotels |
| US12135137B2 (en) | 2020-08-04 | 2024-11-05 | Honeywell International Inc. | Methods and systems for evaluating energy conservation and guest satisfaction in hotels |
| US11894145B2 (en) | 2020-09-30 | 2024-02-06 | Honeywell International Inc. | Dashboard for tracking healthy building performance |
| US12424329B2 (en) | 2020-09-30 | 2025-09-23 | Honeywell International Inc. | Dashboard for tracking healthy building performance |
| JP2022083205A (en)* | 2020-11-24 | 2022-06-03 | シュナイダーエレクトリックホールディングス株式会社 | Programmable display |
| JP7589028B2 (en) | 2020-11-24 | 2024-11-25 | シュナイダーエレクトリックホールディングス株式会社 | Programmable Display |
| US11662115B2 (en) | 2021-02-26 | 2023-05-30 | Honeywell International Inc. | Hierarchy model builder for building a hierarchical model of control assets |
| US11372383B1 (en) | 2021-02-26 | 2022-06-28 | Honeywell International Inc. | Healthy building dashboard facilitated by hierarchical model of building control assets |
| US11599075B2 (en) | 2021-02-26 | 2023-03-07 | Honeywell International Inc. | Healthy building dashboard facilitated by hierarchical model of building control assets |
| US11815865B2 (en) | 2021-02-26 | 2023-11-14 | Honeywell International, Inc. | Healthy building dashboard facilitated by hierarchical model of building control assets |
| US12111624B2 (en) | 2021-02-26 | 2024-10-08 | Honeywell International Inc. | Healthy building dashboard facilitated by hierarchical model of building control assets |
| US12142382B2 (en) | 2021-03-01 | 2024-11-12 | Honeywell International Inc. | Airborne infection early warning system |
| US11474489B1 (en) | 2021-03-29 | 2022-10-18 | Honeywell International Inc. | Methods and systems for improving building performance |
| US12038187B2 (en) | 2021-09-28 | 2024-07-16 | Honeywell International Inc. | Multi-sensor platform for a building |
| US20230195092A1 (en)* | 2021-12-22 | 2023-06-22 | Multivac Sepp Haggenmueller Se & Co. Kg | Production line for manufacturing packaged products with predictive determination of required operator interaction |
| WO2023158871A1 (en)* | 2022-02-21 | 2023-08-24 | Beet, Inc. | Method to identify and prioritize a bottleneck in a process |
| US11874647B2 (en)* | 2022-04-14 | 2024-01-16 | Chengdu Qinchuan Iot Technology Co., Ltd. | Industrial internet of things system for controlling production line parameter and control methods thereof |
| US12261448B2 (en) | 2022-06-07 | 2025-03-25 | Honeywell International Inc. | Low power sensor with energy harvesting |
| US12431621B2 (en) | 2023-01-26 | 2025-09-30 | Honeywell International Inc. | Compact dual band antenna |
| US20240308781A1 (en)* | 2023-03-13 | 2024-09-19 | Gm Global Technology Oiperations Llc | Systems and methods for identifying and alerting of footprint over-cycle risks on multi-product general assembly lines |
Also Published As
| Publication number | Publication date |
|---|---|
| EP2140430A4 (en) | 2011-06-29 |
| CA2680476A1 (en) | 2008-10-02 |
| WO2008116282A1 (en) | 2008-10-02 |
| CN101939766A (en) | 2011-01-05 |
| EP2140430A1 (en) | 2010-01-06 |
Similar Documents
| Publication | Publication Date | Title |
|---|---|---|
| US7379782B1 (en) | System and method of monitoring and quantifying performance of an automated manufacturing facility | |
| US7218974B2 (en) | Industrial process data acquisition and analysis | |
| KR101185796B1 (en) | Semiconductor fabrication facility visualization system and method for monitoring semiconductor fabrication facility operations | |
| US8732534B2 (en) | Predictive incident management | |
| US7493236B1 (en) | Method for reporting the status of a control application in an automated manufacturing environment | |
| Leachman | Closed-loop measurement of equipment efficiency and equipment capacity | |
| US20060224434A1 (en) | Human data acquisition and analysis for industrial processes | |
| CN113361139A (en) | Production line simulation rolling optimization system and method based on digital twin | |
| US7587804B2 (en) | System and method for optimization of product throughput | |
| US20080103715A1 (en) | Operating condition monitoring apparatus, method for monitoring operating condition and program | |
| CN119151297B (en) | A project execution risk assessment system and method based on data mining | |
| US7212876B2 (en) | Maintenance opportunity planning system and method | |
| CN116502830A (en) | A production scheduling plan generation method, system and product | |
| US20020143497A1 (en) | Method of determining level of effect of system entity on system performance, by use of active time of same entity | |
| US20090049394A1 (en) | Quantifying and analyzing back office and field service processes | |
| US10126728B2 (en) | Method and system for collecting via a MES system time-stamps of working-statuses | |
| KR20170123389A (en) | System and method for human error probability calculation of nuclear generating station | |
| RU98387U1 (en) | DECISION MAKING SUPPORT SYSTEM FOR OPERATING AND DISPATCHING AND OPERATING PERSONNEL OF AUTOMATED SORTING SLIDES (DSS KDK SU) | |
| US7353074B2 (en) | Production loss tracking system | |
| JP2005071136A (en) | Delivery time management support system, its program, recording medium recording its program and delivery time management method for product | |
| JPH0765068A (en) | Quality data analyzer | |
| RU65666U1 (en) | DECISION MAKING SUPPORT SYSTEM FOR OPERATING AND DISPATCHING AND OPERATING PERSONNEL OF AUTOMATED SORTING SLIDES (DSS SG) | |
| JP2002373011A (en) | Production management apparatus, production management method, and program for managing production | |
| US20220012154A1 (en) | Process optimization based on user behavior | |
| JP2005267183A (en) | Production scheduling apparatus |
Legal Events
| Date | Code | Title | Description |
|---|---|---|---|
| AS | Assignment | Owner name:ACTIVPLANT CORPORATION, CANADA Free format text:ASSIGNMENT OF ASSIGNORS INTEREST;ASSIGNOR:COCCO, DENNIS P.;REEL/FRAME:019218/0842 Effective date:20070404 | |
| STCF | Information on status: patent grant | Free format text:PATENTED CASE | |
| FPAY | Fee payment | Year of fee payment:4 | |
| AS | Assignment | Owner name:MORGAN STANLEY SENIOR FUNDING, INC., NEW YORK Free format text:SECOND LIEN PATENT SECURITY AGREEMENT;ASSIGNORS:APTEAN, INC.;ACTIVPLANT CORPORATION;REEL/FRAME:032366/0634 Effective date:20140226 Owner name:MORGAN STANLEY SENIOR FUNDING, INC., NEW YORK Free format text:FIRST LIEN PATENT SECURITY AGREEMENT;ASSIGNORS:APTEAN, INC.;ACTIVPLANT CORPORATION;REEL/FRAME:032366/0564 Effective date:20140226 | |
| AS | Assignment | Owner name:MORGAN STANLEY SENIOR FUNDING, INC.,, NEW YORK Free format text:SECURITY INTEREST;ASSIGNOR:ACTIVPLANT CORPORATION;REEL/FRAME:032752/0173 Effective date:20140411 | |
| AS | Assignment | Owner name:MORGAN STANLEY SENIOR FUNDING, INC., NEW YORK Free format text:SECOND LIEN PATENT SECURITY AGREEMENT;ASSIGNOR:ACTIVPLANT CORPORATION;REEL/FRAME:032762/0940 Effective date:20140411 | |
| AS | Assignment | Owner name:APTEAN, INC., GEORGIA Free format text:ASSIGNMENT OF ASSIGNORS INTEREST;ASSIGNOR:ACTIVPLANT CORPORATION;REEL/FRAME:033219/0507 Effective date:20140630 | |
| REMI | Maintenance fee reminder mailed | ||
| FPAY | Fee payment | Year of fee payment:8 | |
| SULP | Surcharge for late payment | Year of fee payment:7 | |
| AS | Assignment | Owner name:ADVANCED PUBLIC SAFETY, INC., GEORGIA Free format text:RELEASE OF FIRST LIEN SECURITY INTEREST;ASSIGNOR:MORGAN STANLEY SENIOR FUNDING, INC.;REEL/FRAME:041035/0395 Effective date:20161220 Owner name:APTEAN, INC., GEORGIA Free format text:RELEASE OF FIRST LIEN SECURITY INTEREST;ASSIGNOR:MORGAN STANLEY SENIOR FUNDING, INC.;REEL/FRAME:041035/0395 Effective date:20161220 Owner name:ACTIVPLANT CORPORATION, GEORGIA Free format text:RELEASE OF FIRST LIEN SECURITY INTEREST;ASSIGNOR:MORGAN STANLEY SENIOR FUNDING, INC.;REEL/FRAME:041035/0395 Effective date:20161220 Owner name:GQ LIFE SCIENCES, INC., GEORGIA Free format text:RELEASE OF FIRST LIEN SECURITY INTEREST;ASSIGNOR:MORGAN STANLEY SENIOR FUNDING, INC.;REEL/FRAME:041035/0395 Effective date:20161220 Owner name:APTEAN SYSTEMS, LLC, GEORGIA Free format text:RELEASE OF FIRST LIEN SECURITY INTEREST;ASSIGNOR:MORGAN STANLEY SENIOR FUNDING, INC.;REEL/FRAME:041035/0395 Effective date:20161220 Owner name:ACTIVPLANT CORPORATION, GEORGIA Free format text:RELEASE OF SECOND LIEN SECURITY INTEREST;ASSIGNOR:MORGAN STANLEY SENIOR FUNDING, INC.;REEL/FRAME:041035/0631 Effective date:20161220 Owner name:APTEAN SYSTEMS, LLC, GEORGIA Free format text:RELEASE OF SECOND LIEN SECURITY INTEREST;ASSIGNOR:MORGAN STANLEY SENIOR FUNDING, INC.;REEL/FRAME:041035/0631 Effective date:20161220 Owner name:APTEAN, INC., GEORGIA Free format text:RELEASE OF SECOND LIEN SECURITY INTEREST;ASSIGNOR:MORGAN STANLEY SENIOR FUNDING, INC.;REEL/FRAME:041035/0631 Effective date:20161220 Owner name:GQ LIFE SCIENCES, INC., GEORGIA Free format text:RELEASE OF SECOND LIEN SECURITY INTEREST;ASSIGNOR:MORGAN STANLEY SENIOR FUNDING, INC.;REEL/FRAME:041035/0631 Effective date:20161220 Owner name:ADVANCED PUBLIC SAFETY, INC., GEORGIA Free format text:RELEASE OF SECOND LIEN SECURITY INTEREST;ASSIGNOR:MORGAN STANLEY SENIOR FUNDING, INC.;REEL/FRAME:041035/0631 Effective date:20161220 | |
| AS | Assignment | Owner name:MORGAN STANLEY SENIOR FUNDING, INC., AS COLLATERAL Free format text:FIRST LIEN SECURITY AGREEMENT;ASSIGNORS:APTEAN, INC.;ACTIVPLANT CORPORATION;APTEAN SYSTEMS, LLC;AND OTHERS;REEL/FRAME:041085/0752 Effective date:20161220 | |
| AS | Assignment | Owner name:MORGAN STANLEY SENIOR FUNDING, INC., AS COLLATERAL Free format text:SECOND LIEN SECURITY AGREEMENT;ASSIGNORS:APTEAN, INC.;ACTIVPLANT CORPORATION;APTEAN SYSTEMS, LLC;AND OTHERS;REEL/FRAME:041175/0370 Effective date:20161220 | |
| AS | Assignment | Owner name:GQ LIFE SCIENCES, INC., GEORGIA Free format text:RELEASE OF 1ST LIEN SECURITY AGREEMENT;ASSIGNOR:MORGAN STANLEY SENIOR FUNDING, INC.;REEL/FRAME:049443/0922 Effective date:20190423 Owner name:APTEAN SYSTEMS, LLC, GEORGIA Free format text:RELEASE OF 1ST LIEN SECURITY AGREEMENT;ASSIGNOR:MORGAN STANLEY SENIOR FUNDING, INC.;REEL/FRAME:049443/0922 Effective date:20190423 Owner name:ACTIVPLANT CORPORATION, GEORGIA Free format text:RELEASE OF 2ND LIEN SECURITY AGREEMENT;ASSIGNOR:MORGAN STANLEY SENIOR FUNDING, INC.;REEL/FRAME:049443/0952 Effective date:20190423 Owner name:ACTIVPLANT CORPORATION, GEORGIA Free format text:RELEASE OF 1ST LIEN SECURITY AGREEMENT;ASSIGNOR:MORGAN STANLEY SENIOR FUNDING, INC.;REEL/FRAME:049443/0922 Effective date:20190423 Owner name:APTEAN, INC., GEORGIA Free format text:RELEASE OF 2ND LIEN SECURITY AGREEMENT;ASSIGNOR:MORGAN STANLEY SENIOR FUNDING, INC.;REEL/FRAME:049443/0952 Effective date:20190423 Owner name:APTEAN SYSTEMS, LLC, GEORGIA Free format text:RELEASE OF 2ND LIEN SECURITY AGREEMENT;ASSIGNOR:MORGAN STANLEY SENIOR FUNDING, INC.;REEL/FRAME:049443/0952 Effective date:20190423 Owner name:APTEAN, INC., GEORGIA Free format text:RELEASE OF 1ST LIEN SECURITY AGREEMENT;ASSIGNOR:MORGAN STANLEY SENIOR FUNDING, INC.;REEL/FRAME:049443/0922 Effective date:20190423 Owner name:GQ LIFE SCIENCES, INC., GEORGIA Free format text:RELEASE OF 2ND LIEN SECURITY AGREEMENT;ASSIGNOR:MORGAN STANLEY SENIOR FUNDING, INC.;REEL/FRAME:049443/0952 Effective date:20190423 | |
| AS | Assignment | Owner name:GOLUB CAPITAL MARKETS LLC, AS COLLATERAL AGENT, IL Free format text:SECURITY INTEREST;ASSIGNORS:APTEAN, INC.;APTEAN SYSTEMS, LLC;APPRISE SOFTWARE, INC.;AND OTHERS;REEL/FRAME:048999/0847 Effective date:20190423 Owner name:GOLUB CAPITAL MARKETS LLC, AS COLLATERAL AGENT, IL Free format text:SECURITY INTEREST;ASSIGNORS:APTEAN, INC.;APTEAN SYSTEMS, LLC;APPRISE SOFTWARE, INC.;AND OTHERS;REEL/FRAME:048999/0928 Effective date:20190423 | |
| MAFP | Maintenance fee payment | Free format text:PAYMENT OF MAINTENANCE FEE, 12TH YEAR, LARGE ENTITY (ORIGINAL EVENT CODE: M1553); ENTITY STATUS OF PATENT OWNER: LARGE ENTITY Year of fee payment:12 | |
| AS | Assignment | Owner name:GOLUB CAPITAL MARKETS LLC, AS COLLATERAL AGENT, NEW YORK Free format text:SECURITY AGREEMENT;ASSIGNORS:APTEAN, INC.;APPAREL BUSINESS SYSTEMS, INC.;APTEAN SYSTEMS, LLC;AND OTHERS;REEL/FRAME:066568/0408 Effective date:20240130 Owner name:GQ LIFE SCIENCES, INC., GEORGIA Free format text:RELEASE BY SECURED PARTY;ASSIGNOR:GOLUB CAPITAL MARKETS LLC, AS COLLATERAL AGENT;REEL/FRAME:066302/0271 Effective date:20240130 Owner name:ASSETPOINT LLC, GEORGIA Free format text:RELEASE BY SECURED PARTY;ASSIGNOR:GOLUB CAPITAL MARKETS LLC, AS COLLATERAL AGENT;REEL/FRAME:066302/0271 Effective date:20240130 Owner name:APPRISE SOFTWARE, INC., GEORGIA Free format text:RELEASE BY SECURED PARTY;ASSIGNOR:GOLUB CAPITAL MARKETS LLC, AS COLLATERAL AGENT;REEL/FRAME:066302/0271 Effective date:20240130 Owner name:APTEAN SYSTEMS, LLC, GEORGIA Free format text:RELEASE BY SECURED PARTY;ASSIGNOR:GOLUB CAPITAL MARKETS LLC, AS COLLATERAL AGENT;REEL/FRAME:066302/0271 Effective date:20240130 Owner name:APTEAN, INC., GEORGIA Free format text:RELEASE BY SECURED PARTY;ASSIGNOR:GOLUB CAPITAL MARKETS LLC, AS COLLATERAL AGENT;REEL/FRAME:066302/0271 Effective date:20240130 Owner name:GQ LIFE SCIENCES, INC., GEORGIA Free format text:RELEASE BY SECURED PARTY;ASSIGNOR:GOLUB CAPITAL MARKETS LLC, AS COLLATERAL AGENT;REEL/FRAME:066302/0254 Effective date:20240130 Owner name:ASSETPOINT LLC, GEORGIA Free format text:RELEASE BY SECURED PARTY;ASSIGNOR:GOLUB CAPITAL MARKETS LLC, AS COLLATERAL AGENT;REEL/FRAME:066302/0254 Effective date:20240130 Owner name:APPRISE SOFTWARE, INC., GEORGIA Free format text:RELEASE BY SECURED PARTY;ASSIGNOR:GOLUB CAPITAL MARKETS LLC, AS COLLATERAL AGENT;REEL/FRAME:066302/0254 Effective date:20240130 Owner name:APTEAN SYSTEMS, LLC, GEORGIA Free format text:RELEASE BY SECURED PARTY;ASSIGNOR:GOLUB CAPITAL MARKETS LLC, AS COLLATERAL AGENT;REEL/FRAME:066302/0254 Effective date:20240130 Owner name:APTEAN, INC., GEORGIA Free format text:RELEASE BY SECURED PARTY;ASSIGNOR:GOLUB CAPITAL MARKETS LLC, AS COLLATERAL AGENT;REEL/FRAME:066302/0254 Effective date:20240130 |