US7272252B2 - Automated system for combining bright field and fluorescent microscopy - Google Patents
Automated system for combining bright field and fluorescent microscopyDownload PDFInfo
- Publication number
- US7272252B2 US7272252B2US10/461,786US46178603AUS7272252B2US 7272252 B2US7272252 B2US 7272252B2US 46178603 AUS46178603 AUS 46178603AUS 7272252 B2US7272252 B2US 7272252B2
- Authority
- US
- United States
- Prior art keywords
- fluorescent
- interest
- antibody
- images
- image
- Prior art date
- Legal status (The legal status is an assumption and is not a legal conclusion. Google has not performed a legal analysis and makes no representation as to the accuracy of the status listed.)
- Expired - Fee Related, expires
Links
Images


Classifications
- G—PHYSICS
- G06—COMPUTING OR CALCULATING; COUNTING
- G06T—IMAGE DATA PROCESSING OR GENERATION, IN GENERAL
- G06T5/00—Image enhancement or restoration
- G06T5/50—Image enhancement or restoration using two or more images, e.g. averaging or subtraction
- G—PHYSICS
- G01—MEASURING; TESTING
- G01N—INVESTIGATING OR ANALYSING MATERIALS BY DETERMINING THEIR CHEMICAL OR PHYSICAL PROPERTIES
- G01N21/00—Investigating or analysing materials by the use of optical means, i.e. using sub-millimetre waves, infrared, visible or ultraviolet light
- G01N21/62—Systems in which the material investigated is excited whereby it emits light or causes a change in wavelength of the incident light
- G01N21/63—Systems in which the material investigated is excited whereby it emits light or causes a change in wavelength of the incident light optically excited
- G01N21/64—Fluorescence; Phosphorescence
- G01N21/6428—Measuring fluorescence of fluorescent products of reactions or of fluorochrome labelled reactive substances, e.g. measuring quenching effects, using measuring "optrodes"
- G—PHYSICS
- G01—MEASURING; TESTING
- G01N—INVESTIGATING OR ANALYSING MATERIALS BY DETERMINING THEIR CHEMICAL OR PHYSICAL PROPERTIES
- G01N21/00—Investigating or analysing materials by the use of optical means, i.e. using sub-millimetre waves, infrared, visible or ultraviolet light
- G01N21/62—Systems in which the material investigated is excited whereby it emits light or causes a change in wavelength of the incident light
- G01N21/63—Systems in which the material investigated is excited whereby it emits light or causes a change in wavelength of the incident light optically excited
- G01N21/64—Fluorescence; Phosphorescence
- G01N21/645—Specially adapted constructive features of fluorimeters
- G01N21/6456—Spatial resolved fluorescence measurements; Imaging
- G01N21/6458—Fluorescence microscopy
- G—PHYSICS
- G02—OPTICS
- G02B—OPTICAL ELEMENTS, SYSTEMS OR APPARATUS
- G02B21/00—Microscopes
- G02B21/16—Microscopes adapted for ultraviolet illumination ; Fluorescence microscopes
- G—PHYSICS
- G02—OPTICS
- G02B—OPTICAL ELEMENTS, SYSTEMS OR APPARATUS
- G02B21/00—Microscopes
- G02B21/36—Microscopes arranged for photographic purposes or projection purposes or digital imaging or video purposes including associated control and data processing arrangements
- G02B21/365—Control or image processing arrangements for digital or video microscopes
- G—PHYSICS
- G06—COMPUTING OR CALCULATING; COUNTING
- G06T—IMAGE DATA PROCESSING OR GENERATION, IN GENERAL
- G06T7/00—Image analysis
- G06T7/0002—Inspection of images, e.g. flaw detection
- G06T7/0012—Biomedical image inspection
- G—PHYSICS
- G06—COMPUTING OR CALCULATING; COUNTING
- G06T—IMAGE DATA PROCESSING OR GENERATION, IN GENERAL
- G06T2207/00—Indexing scheme for image analysis or image enhancement
- G06T2207/30—Subject of image; Context of image processing
- G06T2207/30004—Biomedical image processing
- G06T2207/30024—Cell structures in vitro; Tissue sections in vitro
Definitions
- the inventionrelates generally to light microscopy and fluorescent microscopy and, more particularly, to automated light and fluorescent microscopic methods and an apparatus for detection of objects in a sample.
- a biological samplesuch as bone marrow, lymph nodes, peripheral blood, cerebrospinal fluid, urine, effusions, fine needle aspirates, peripheral blood scrapings or other biological materials are prepared by staining a sample to identify cells of interest.
- FISHFluorescent In Situ Hybridization
- a fluorescently labeled oligonucleotide probeis added to a tissue sample on a microscope slide under conditions that allow for the probe to enter the cell and enter the nucleus. If the labeled sequence is complementary to a sequence in a cell on the slide a fluorescent spot will be seen in the nucleus when the cell is visualized on a fluorescent microscope.
- FISHhas the advantage that the individual cells containing the DNA sequences being tested can be visualized in the context of the tissue.
- FISH assayscan be visualized with the naked eye as well as with video cameras. Problems are associated with both methods. Manual visualization by technicians results in the potential for subjective determinations and lack of reproducibility between one or more technicians viewing the same slide. Automated imaging with a camera takes several seconds for each area of a slide to be imaged to detect a fluorescent signal. In contrast, a camera on a bright field microscope can collect a new image every 1/60 of a second. Accordingly, a system that images all parts of a slide in about 6 minutes in bright field, may take an hour or more to collect a set of fluorescent images of the same slide. Thus a faster, more efficient, and reproducible method of imaging slides containing fluorescent agents is needed.
- the inventionprovides a method, an apparatus, and a system for accurately and efficiently imaging a slide containing a fluorescent signal.
- a slide prepared with a biological sample and reagentmaybe loaded onto the system or may be placed in a slide carrier that holds any number of additional slides (e.g., 1-50 slides/carrier).
- the slide carriersare loaded into an input hopper of the automated system.
- An operatormay then enter data identifying the size, shape, and location of a scan area on each slide or the system can automatically locate a scan area for each slide during slide processing.
- the processing parameters of the slidemay be identified by a bar code present on the slide or slide carrier.
- a slide carrieris positioned on an X-Y stage, the entire slide is rapidly scanned at a low magnification, typically 10 ⁇ under transmitted light.
- a low magnification imageis acquired and processed to detect candidate objects of interest.
- color, size and shapeare used to identify objects of interest.
- the location of each candidate object of interestis stored.
- the optical systemis adjusted to a higher magnification such as 40 ⁇ or 60 ⁇ , and the X-Y stage is positioned to the stored locations of the candidate objects of interest on a slide.
- a higher magnification imageis acquired for each candidate object of interest and a series of image processing steps are performed to confirm the analysis that was performed at low magnification.
- a high magnification imageis stored for each confirmed object of interest.
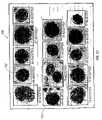
- a mosaic comprised of the candidate objects of interest for a slidemay be generated and stored.
- the pathologist or cytotechnologistmay view the mosaic or may also directly view the slide at the location of an object of interest in the mosaic for further evaluation.
- the mosaicmay be stored on magnetic or optical or other media for future reference or may be transmitted to a remote site for review and/or storage. The entire process involved in examining a single slide takes on the order of 2-15 minutes depending on scan area size and the number of detected candidate objects of interest.
- the inventionhas utility in the field of oncology for the early detection of minimal residual disease (“micrometastases”).
- Other useful applicationsinclude prenatal diagnosis of fetal cells in maternal blood and in the field of infectious diseases to identify pathogens and viral loads, alkaline phosphatase assessments, reticulocyte counting, and others.
- the processing of images acquired in the automated scanning of the inventionincludes, or a process of transforming the image to a different color space; filtering the transformed image with a low pass filter; dynamically thresholding the pixels of the filtered image to suppress background material; performing a morphological function to remove artifacts from the thresholded image; analyzing the thresholded image to determine the presence of one or more regions of connected pixels having the same or similar color; and categorizing every region having a size greater than a minimum (threshold) size as a candidate object of interest.
- the scan areais automatically determined by scanning the slide; acquiring an image at each slide position; analyzing texture information of each image to detect the edges of the specimen; and storing the locations corresponding to the detected edges to define the scan area.
- automated focusing of the optical systemis achieved by initially determining a focal plane from an array of points or locations in the scan area.
- the derived focal planeenables subsequent rapid automatic focusing in the low power scanning operation.
- the focal planeis determined by determining proper focal positions across an array of locations and performing an analysis such as a least squares fit of the array of focal positions to yield a focal plane across the array.
- a focal position at each locationis determined by incrementing the position of a Z stage for a fixed number of coarse and fine iterations.
- an imageis acquired and a pixel variance or other optical parameter about a pixel mean for the acquired image is calculated to form a set of variance data.
- a least squares fitis performed on the variance data according to a known function. The peak value of the least squares fit curve is selected as an estimate of the best focal position.
- another focal position method for high magnificationlocates a region of interest centered about a candidate object of interest within a slide that was located during an analysis of the low magnification images.
- the region of interestis preferably n columns wide, where n is a power of 2.
- the pixels of this regionare then processed using a Fast Fourier Transform to generate a spectra of component frequencies and corresponding complex magnitude for each frequency component. Magnitude of the frequency components that range from 25% to 75% of the maximum frequency component are squared and summed to obtain the total power for the region of interest. This process is repeated for other Z positions and the Z position corresponding to the maximum total power for the region of interest is selected as the best focal position.
- This processis used to select a Z position for regions of interest for slides containing, for example, neutrophils stained with Fast Red to identify alkaline phosphatase in cell cytoplasm and counterstained with hematoxylin to identify the nucleus of the neutrophil cell.
- This focal methodmay be used with other stains and types of biological samples, as well.
- a method and apparatus for the automatic analysis of fluorescent specimensare provided.
- a slidewhich may contain fluorescent specimens, is loaded onto the automated system.
- the slide, or portions thereof, containing the specimenis scanned in transmitted light.
- an illuminating (fluorescent excitation) lightis then applied to the candidate objects of interest, previously identified, to collect images of the relevant fluorescent portions for further analysis.
- the initial automatic scanning method useful for this methodis not limited to that disclosed above, any automatic scanning method for identifying candidate objects of interest is contemplated.
- the initial scancan be performed in transmitted light in bright field or dark field.
- the angle of the light being transmitted through the slide, and any specimens thereonis such that unless the light is blocked/absorbed by the specimen, it passes directly into the objective. Therefore, under bright light, the background will appear bright and the areas containing specimens will appear darker, the light having had to pass through the specimen, and therefore absorbed to a degree, before it reaches the objective.
- the angle of the light being transmitted through the slideis such that if the light is not scattered by specimens on the slide, it will not enter the objective. Accordingly, the background area will be dark, i.e., no specimen to scatter the light, and the areas containing the specimen will be brighter, as they scatter the light into the objective.
- the automated systemcan identify candidate objects of interest.
- the automated systemcan then locate the candidate object of interest and further process the specimen, such as storing the information, applying an illuminating (fluorescent excitation) light, enlarging the image under high magnification, capturing the image, or any combination thereof.
- illuminatingfluorescent excitation
- the transmitted light scan and the subsequent fluorescent illumination/excitationcan be performed on the same slide. Alternatively, they can be performed on slides of two adjacent serial sections. In the case of the latter, there should be a way to orient the sections to correspond with each other, for example, an outline of the tissues on each slide or at least two landmarks on serial sections can be used to orient the sections.
- a method and apparatus for automated slide handlingis provided.
- a slideis mounted onto a slide carrier with a number of other slides.
- the slide carrieris positioned in an input feeder with other slide carriers to facilitate automatic analysis of a batch of slides.
- the slide carrieris loaded onto the X-Y stage of the optical system for the analysis of the slides thereon. Subsequently, the first slide carrier is unloaded into an output feeder after automatic image analysis and the next carrier is automatically loaded.
- the apparatusincludes a computer having at least one system processor with image processing capability, a computer monitor, an input device, a power supply and a microscope subsystem.
- the microscope subsystemincludes an optical sensing array for acquiring images.
- a two-dimensional motion stagefor sample movement and for focus adjustment, and input and output mechanisms for multiple sample analysis and storage.
- the apparatusmay also include a transmitted light source as well as an illuminating/fluorescent excitation light source for fluorescing samples.
- FIG. 1is a perspective view of an exemplary apparatus for automated cell analysis embodying the invention.
- FIG. 2is a block diagram of the apparatus shown in FIG. 1 .
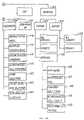
- FIG. 3is a block diagram of the system processor of FIG. 2 .
- FIG. 4is a plan view of the apparatus of FIG. 1 having the housing removed.
- FIG. 5is a side view of a microscope subsystem of the apparatus of FIG. 1 .
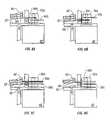
- FIG. 6 ais a top view of a slide carrier for use with the apparatus of FIG. 1 .
- FIG. 6 bis a bottom view of the slide carrier of FIG. 6 a.
- FIG. 7 ais a top view of an automated slide handling subsystem of the apparatus of FIG. 1 .
- FIG. 7 bis a partial cross-sectional view of the automated slide handling subsystem of FIG. 7 a taken on line A-A.
- FIG. 8is an end view of the input module of the automated slide handling subsystem.
- FIGS. 8 a - 8 dillustrate the input operation of the automatic slide handling subsystem.
- FIGS. 9 a - 9 dillustrate the output operation of the automated slide handling subsystem.
- FIG. 10is a flow diagram of the procedure for automatically determining a scan area.
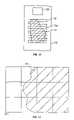
- FIG. 11shows the scan path on a prepared slide in the procedure of FIG. 10 .
- FIG. 12illustrates an image of a field acquired in the procedure of FIG. 10 .
- FIG. 13Ais a flow diagram of a preferred procedure for determining a focal position.
- FIG. 13Bis a flow diagram of a preferred procedure for determining a focal position for neutrophils stained with Fast Red and counterstained with hematoxylin.
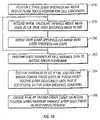
- FIG. 14is a flow diagram of a procedure for automatically determining initial focus.
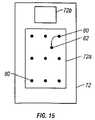
- FIG. 15shows an array of slide positions for use in the procedure of FIG. 14 .
- FIG. 16is a flow diagram of a procedure for automatic focusing at a high magnification.
- FIG. 17Ais a flow diagram of an overview of the preferred process to locate and identify objects of interest in a stained biological sample on a slide.
- FIG. 17Bis a flow diagram of a procedure for color space conversion.
- FIG. 18is a flow diagram of a procedure for background suppression via dynamic thresholding.
- FIG. 19is a flow diagram of a procedure for morphological processing.
- FIG. 20is a flow diagram of a procedure for blob analysis.
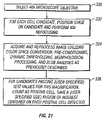
- FIG. 21is a flow diagram of a procedure for image processing at a high magnification.
- FIG. 22illustrates a mosaic of cell images produced by the apparatus.
- FIG. 23is a flow diagram of a procedure for estimating the number of nucleated cells in a field.
- FIGS. 24 a and 24 billustrate the apparatus functions available in a user interface of the apparatus.
- FIG. 25is a perspective view of another embodiment of the invention.
- the inventionprovides an automated analysis system that quickly and accurately scans large amounts of biological material on a slide.
- the systemautomates the analysis of fluorescent images on a slide quickly and accurately.
- the inventionprovides useful methods, apparatus, and systems for use in research and patient diagnostics to locate cell objects for analysis having either or both of a non-fluorescent stain and a fluorescent indicator.
- a biological sample and/or subsamplecomprises biological materials obtained from or derived from a living organism.
- a biological samplewill comprise proteins, polynucleotides, organic material, cells, tissue, and any combination of the foregoing.
- samplesinclude, but are not limited to, hair, skin, tissue, cultured cells, cultured cell media, and biological fluids.
- a tissueis a mass of connected cells and/or extracellular matrix material (e.g., CNS tissue, neural tissue, eye tissue, placental tissue, mammary gland tissue, gastrointestinal tissue, musculoskeletal tissue, genitourinary tissue, and the like) derived from, for example, a human or other mammal and includes the connecting material and the liquid material in association with the cells and/or tissues.
- a biological fluidis a liquid material derived from, for example, a human or other mammal.
- biological fluidsinclude, but are not limited to, blood, plasma, serum, serum derivatives, bile, phlegm, saliva, sweat, amniotic fluid, mammary fluid, and cerebrospinal fluid (CSF), such as lumbar or ventricular CSF.
- CSFcerebrospinal fluid
- a samplealso may be media containing cells or biological material.
- a biological samplemay be divided into two or more additional samples (e.g., subsamples).
- the biological sampleis a tissue, such as a tissue biopsy.
- an individual sample used to prepare a subsampleis embedded in embedding media such as paraffin or other waxes, gelatin, agar, polyethylene glycols, polyvinyl alcohol, celloidin, nitrocelluloses, methyl and butyl methacrylate resins or epoxy resins, which are polymerized after they infiltrate the specimen.
- embedding mediasuch as paraffin or other waxes, gelatin, agar, polyethylene glycols, polyvinyl alcohol, celloidin, nitrocelluloses, methyl and butyl methacrylate resins or epoxy resins, which are polymerized after they infiltrate the specimen.
- Water-soluble embedding mediasuch as polyvinyl alcohol, carbowax (polyethylene glycols), gelatin, and agar, may be used directly on specimens.
- Water-insoluble embedding mediasuch as paraffin and nitrocellulose require that specimens be dehydrated in several changes of solvent such as ethyl alcohol, acetone, or isopropyl alcohol and then be immersed in a solvent in which the embedding medium is soluble.
- suitable solvents for the paraffinare xylene, toluene, benzene, petroleum, ether, chloroform, carbon tetrachloride, carbon bisulfide, and cedar oil.
- Embedding mediumincludes, for examples, any synthetic or natural matrix suitable for embedding a sample in preparation for tissue sectioning.
- a tissue samplemay be a conventionally fixed tissue sample, tissue samples fixed in special fixatives, or may be an unfixed sample (e.g., freeze-dried tissue samples). If a tissue sample is freeze-dried, it should be snap-frozen. Fixation of a tissue sample can be accomplished by cutting the tissue specimens to a thickness that is easily penetrated by fixing fluid.
- fixing fluidsexamples include aldehyde fixatives such as formaldehyde, formalin or formol, glyoxal, glutaraldehyde, hydroxyadipaldehyde, crotonaldehyde, methacrolein, acetaldehyde, pyruic aldehyde, malonaldehyde, malialdehyde, and succinaldehyde; chloral hydrate; diethylpyrocarbonate; alcohols such as methanol and ethanol; acetone; lead fixatives such as basic lead acetates and lead citrate; mercuric salts such as mercuric chloride; formaldehyde sublimates; sublimate dichromate fluids; chromates and chromic acid; and picric acid.
- aldehyde fixativessuch as formaldehyde, formalin or formol, glyoxal, glutaraldehyde, hydroxyadipaldehyde, cro
- Heatmay also be used to fix tissue specimens by boiling the specimens in physiologic sodium chloride solution or distilled water for two to three minutes. Whichever fixation method is ultimately employed, the cellular structures of the tissue sample must be sufficiently hardened before they are embedded in a medium such as paraffin.
- tissue samplesmay be prepared and located on a single slide.
- tissue-microarraysare known in the art.
- Each tissue sample in the tissue-microarraymay be stained and/or treated the same of differently using both automated techniques and manual techniques (see, e.g., Kononen et al. Nature Medicine, 4(7), 1998; and U.S. Pat. No. 6,103,518, the disclosures of which are incorporated herein by reference).
- the inventionprovides a method whereby a single biological sample may be assayed or examined in many different ways. Under such conditions a sample may be stained or labeled with a first agent and examined by light microscopy with transmitted light and/or a combination of light microscopy and fluorescent microscopy. The sample is then stained or labeled with a second agent and examined by light microscopy (e.g., transmitted light) and/or a combination of light microscopy and fluorescent microscopy.
- light microscopye.g., transmitted light
- the inventionprovides methods of automated analysis of a biological sample.
- the biological sample and/or subsamplecan be contacted with a variety of agents useful in determining and analyzing cellular molecules and mechanisms.
- agentsinclude, for example, polynucleotides, polypeptides, small molecules, and/or antibodies useful in in situ screening assays for detecting molecules that specifically bind to a marker present in a sample.
- Such assayscan be used to detect, prognoses, diagnose, or monitor various conditions, diseases, and disorders, or monitor the treatment thereof.
- An agentcan be detectably labeled such that the agent is detectable when bound or hybridized to its target marker or ligand.
- Such means for detectably labeling any of the foregoing agentsinclude an enzymatic, fluorescent, or radionuclide label. Other reporter means and labels are well known in the art.
- a markercan be any cell component present in a sample that is identifiable by known microscopic, histologic, or molecular biology techniques. Markers can be used, for example, to distinguish neoplastic tissue from non-neoplastic tissue. Such markers can also be used to identify a molecular basis of a disease or disorder including a neoplastic disease or disorder. Such a marker can be, for example, a molecule present on a cell surface, an overexpressed target protein, a nucleic acid mutation or a morphological characteristic of a cell present in a sample.
- An agent useful in the methods of the inventioncan be an antibody.
- Antibodies useful in the methods of the inventioninclude intact polyclonal or monoclonal antibodies, as well as fragments thereof, such as Fab and F(ab′)2.
- monoclonal antibodiesare made from antigen containing fragments of a protein by methods well known to those skilled in the art (Kohler, et al., Nature, 256:495, 1975).
- Fluorescent moleculesmay be bound to an immunoglobulin either directly or indirectly by using an intermediate functional group.
- An agent useful in the methods of the inventioncan also be a nucleic acid molecule (e.g., an oligonucleotide or polynucleotide).
- a nucleic acid moleculee.g., an oligonucleotide or polynucleotide.
- in situ nucleic acid hybridization techniquesare well known in the art and can be used to identify an RNA or DNA marker present in a sample or subsample. Screening procedures that rely on nucleic acid hybridization make it possible to identify a marker from any sample, provided the appropriate oligonucleotide or polynucleotide agent is available.
- oligonucleotide agentswhich can correspond to a part of a sequence encoding a target polypeptide (e.g., a cancer marker comprising a polypeptide), can be synthesized chemically or designed through molecular biology techniques.
- the polynucleotide encoding the target polypeptidecan be deduced from the genetic code, however, the degeneracy of the code must be taken into account.
- hybridizationis typically performed under in situ conditions known to those skilled in the art.
- an apparatus for automated cell analysis of biological samplesis generally indicated by reference numeral 10 as shown in perspective view in FIG. 1 and in block diagram form in FIG. 2 .
- the apparatus 10comprises a microscope subsystem 32 housed in a housing 12 .
- the housing 12includes a slide carrier input hopper 16 and a slide carrier output hopper 18 .
- a door 14 in the housing 12secures the microscope subsystem from the external environment.
- a computer subsystemcomprises a computer 22 having at least one system processor 23 , and a communications modem 29 .
- the computer subsystemfurther includes a computer/image monitor 27 and other external peripherals including storage device 21 , a pointing device, such as a track ball or mouse device 30 , a user input device, such as a touch screen, keyboard, or voice recognition unit 28 and color printer 35 .
- An external power supply 24is also shown for power outage protection.
- the apparatus 10further includes an optical sensing array 42 , such as, for example, a CCD camera, for acquiring images. Microscope movements are under the control of system processor 23 through a number of microscope-subsystem functions described further in detail.
- An automatic slide feed mechanism in conjunction with X-Y stage 38provide automatic slide handling in the apparatus 10 .
- An illumination 48comprising a bright field transmitted light source projects light onto a sample on the X-Y stage 38 , which is subsequently imaged through the microscope subsystem 32 and acquired through optical sensing array 42 for processing by the system processor 23 .
- a Z stage or focus stage 46under control of the system processor 23 provides displacement of the microscope subsystem in the Z plane for focusing.
- the microscope subsystem 32further includes a motorized objective turret 44 for selection of objectives.
- the apparatus 10further includes a fluorescent excitation light source 45 and may further include a plurality of fluorescent filters on a turret or wheel 47 .
- a filter wheelmay have an electronically tunable filter.
- fluorescent excitation light from fluorescent excitation light source 45passes through fluorescent filter 47 and proceeds to contact a sample on the XY stage 38 .
- Fluorescent emission light emitted from a fluorescent agent contained on a samplepasses through objective 44 a to optical sensing array 42 .
- the fluorescent emission lightforms an image, which is digitized by an optical sensing array 42 , and the digitized image is sent to an image processor 25 for subsequent processing.
- the purpose of the apparatus 10is for the automatic scanning of prepared microscope slides for the detection of candidate objects of interest such as normal and abnormal cells, e.g., tumor cells.
- the apparatus 10is capable of detecting rare events, e.g., event in which there may be only one candidate object of interest per several hundred thousand objects, e.g., one to five candidate objects of interest per 2 square centimeter area of the slide.
- the apparatus 10automatically locates and can count candidate objects of interest noting the coordinates or location of the candidate object of interest on a slide based upon color, size and shape characteristics. A number of stains can be used to stain candidate objects of interest and other objects (e.g., normal cells) different colors so that such cells can be distinguished from each other (as described herein).
- a biological samplemay be prepared with a reagent to obtain a colored insoluble precipitate.
- an apparatus 10is used to detect this precipitate as a candidate object of interest.
- a pathologist or laboratory technicianmounts slides onto slide carriers.
- Each slidemay contain a single sample or a plurality of samples (e.g., a tissue microarray).
- a slide carrier 60is illustrated in FIG. 8 and will be described further below.
- Each slide carriercan be designed to hold a number of slides from about 1-50 or more (e.g., the holder depicted in FIG. 8 holds up to 4 slides).
- a number of slide carriersare then loaded into input hopper 16 (see FIG. 1 ).
- the operatorcan specify the size, shape and location of the area to be scanned or alternatively, the system can automatically locate an area.
- the operatorthen commands the system to begin automated scanning of the slides through a graphical user interface.
- Unattended scanningbegins with the automatic loading of the first carrier and slide onto the precision motorized X-Y stage 38 .
- a bar code label affixed to the slide or slide carrieris read by a bar code reader 33 during this loading operation.
- Each slideis then scanned a desired magnification, for example, 10 ⁇ , to identify candidate cells or objects of interest based on their color, size and shape characteristics.
- the term “coordinate” or “address”is used to mean a particular location on a slide or sample.
- the coordinate or addresscan be identified by any number of means including, for example, X-Y coordinates, r- ⁇ coordinates, polar, vector or other coordinate systems known in the art.
- a slideis scanned under a first parameter comprising a desired magnification and using a bright field light source from illumination 48 (see FIG. 2 ) to identify a candidate cell or object of interest.
- the methods, systems, and apparatus of the inventionmay obtain a low magnification image of a candidate cell or object of interest and then return to each candidate cell or object of interest based upon the previously stored coordinates to reimage and refocus at a higher magnification such as 40 ⁇ or to reimage under fluorescent conditions.
- the systemcan process low magnification images by reconstructing the image from individual fields of view and then determine objects of interest. In this manner, objects of interest that overlap more than one objective field of view may be identified.
- the apparatuscomprises a storage device 21 that can be used to store an image of a candidate cell or object of interest for later review by a pathologist or to store identified coordinates for later use in processing the sample or a subsample.
- the storage device 21can be a removable hard drive, DAT tape, local hard drive, optical disk, or may be an external storage system whereby the data is transmitted to a remote site for review or storage.
- stored imagesfrom both fluorescent and bright field light
- Apparatus 10is also used for fluorescent imaging (e.g., in FISH techniques) of prepared microscope slides for the detection of candidate objects of interest such as normal and abnormal cells, e.g., tumor cells.
- the apparatus 10automatically locates the coordinates of previously identified candidate cells or objects of interest based upon the techniques described above.
- the slidehas been contacted with a fluorescent agent labeled with a fluorescent indicator.
- the fluorescent agentis an antibody, polypeptide, oligonucleotide, or polynucleotide labeled with a fluorescent indicator.
- a number of fluorescent indicatorsare known in the art and include DAPI, Cy3, Cy3.5, Cy5, CyS.5, Cy7, umbelliferone, fluorescein, fluorescein isothiocyanate (FITC), rhodamine, dichlorotriazinylamine fluorescein, dansyl chloride or phycoerythrin.
- a luminescent materialmay be used.
- Useful luminescent materialsinclude luminol; examples of bioluminescent materials include luciferase, luciferin, and aequorin.
- a fluorescent indicatorshould have distinguishable excitation and emission spectra. Where two or more fluorescent indicators are used they should have differing excitation and emission spectra that differ, respectively, by some minimal value (typically about 15-30 nm). The degree of difference will typically be determined by the types of filters being used in the process. Typical excitation and emission spectra for DAPI, FITC, Cy3, Cy3.5, Cy5, CyS.5, and Cy7 are provided below:
- Fluorescent indicatorExcitation Peak Emission Peak DAPI 350 450 FITC 490 520 Cy3 550 570 Cy3.5 580 595 Cy5 650 670 Cy5.5 680 700 Cy7 755 780
- a biological sampleis prepared with a fluorescently labeled agent or luminescently labeled agent to identify molecules of interest within the biological sample.
- An apparatus of the inventionis used to detect the fluorescence or luminescence of the molecule when exposed to a wavelength that excites a fluorescent indicator attached to the fluorescent agent or exposed to conditions that allow for luminescence.
- the automated system of the inventionscans a biological sample contacted with a fluorescently agent under conditions such that a fluorescent indicator attached to the agent fluoresces, or scans a biological sample labeled with a luminescent agent under conditions that detects light emissions from a luminescent indicator. Examples of conditions include providing a fluorescent excitation light that contacts and excites the fluorescent indicator to fluoresce.
- the apparatus of the inventionincludes a fluorescent excitation light source and can also include a number of fluorescent excitation filters to provide different wavelengths of excitation light.
- a bar code label affixed to a slide or slide carrieris read by a bar code reader 33 during a loading operation.
- the bar codeprovides the system with information including, for example, information about the scanning parameters including the type of light source or the excitation light wavelength to use.
- Each slideis then scanned at a desired magnification, for example, 10 ⁇ , to identify candidate cells or objects of interest based on their color, size, and shape characteristics.
- the location, coordinate, or address of the candidate cells or objects of interestare used to focus the system at those specific locations and obtain fluorescent or bioluminescent images.
- the methods, system, and apparatus of the inventioncan obtain a first image using a transmitted light source at either a low magnification or high magnification of a candidate cell or object of interest and then return to the coordinates (or corrected coordinates) associated with each candidate cell or object of interest in the same sample or a related subsample to obtain a fluorescent image.
- Fluorescent images or luminescent imagescan be stored on a storage device 21 that can be used to store an image of a candidate cell or object of interest for later review by a pathologist.
- the storage device 21can be a removable hard drive, DAT tape, local hard drive, optical disk, or may be an external storage system whereby the data is transmitted to a remote site for review or storage.
- stored imagesfrom both fluorescent and bright field light
- transmitted light microscopy or fluorescent light microscopyare followed sequentially in either order the light sources for both processes must be managed.
- Such light source managementis performed using the system processor 23 through the Fluorescent controller 102 and illumination controller 106 (see, FIG. 3 ).
- the fluorescent excitation light sourceis off or blocked such that excitation light from the fluorescent light source does not contact the sample.
- the transmitted light sourceis off or blocked such that the transmitted light does not pass through the sample while the sample is contacted by fluorescent excitation light from fluorescent excitation light source 45 .
- the microscope controller 31includes a number of subsystems.
- the apparatus system processor 23controls these subsystems.
- the system processor 23controls a set of motor—control subsystems 114 through 124 , which control the input and output feeder, the motorized turret 44 , the X-Y stage 38 , and the Z stage 46 ( FIG. 2 ).
- the system processor 23further controls a transmitted light illumination controller 106 for control of substage illumination 48 bright field transmitted light source and controls a fluorescent excitation illumination controller 102 for control of fluorescent excitation light source 45 and/or filter turret 47 .
- the transmitted light illumination controller 106is used in conjunction with camera and image collection adjustments to compensate for the variations in light level in various samples.
- the light control softwaresamples the output from the camera at intervals (such as between loading of slide carriers), and commands the transmitted light illumination controller 106 to adjust the light or image collection functions to the desired levels. In this way, light control is automatic and transparent to the user and adds no additional time to system operation.
- fluorescent excitation illumination controller 102is used in conjunction with the camera and image collection adjustments to compensate for the variations in fluorescence in various samples.
- the light control softwaresamples the output from the camera at intervals (such as between loading of slide carriers and may include sampling during image collection), and commands the fluorescent excitation illumination controller 102 to adjust the fluorescent excitation light or image exposure time to a desired level.
- the fluorescent excitation illumination controller 102may control the filter wheel or wavelength 47 .
- the system processor 23is a high performance processor of at least 200 MHz, for example, the system processor may comprise dual parallel, Intel, 1 GHZ devices. Advances in processors are being routinely made in the computer industry. Accordingly, the invention should not be limited by the type of processor or speed of the processor disclosed herein.
- FIG. 4shows a plan view of the apparatus 10 with the housing 12 removed. Shown is slide carrier unloading assembly 34 and unloading platform 36 which in conjunction with slide carrier output hopper 18 function to receive slide carriers which have been analyzed.
- Vibration isolation mounts 40shown in further detail in FIG. 5 , are provided to isolate the microscope subsystem 32 from mechanical shock and vibration that can occur in a typical laboratory environment. In addition to external sources of vibration, the high-speed operation of the X-Y stage 38 can induce vibration into the microscope subsystem 32 . Such sources of vibration can be isolated from the electro-optical subsystems to avoid any undesirable effects on image quality.
- the isolation mounts 40comprise a spring 40 a and piston 40 b (see FIG. 5 ) submerged in a high viscosity silicon gel which is enclosed in an elastomer membrane bonded to a casing to achieve damping factors on the order of about 17 to 20%.
- Other dampening devicesare known in the art and may be substituted or combined with the dampening device provided herein.
- Occulars 20are shown in FIGS. 4 and 5 , however, their presence is an optional feature. The occulars 20 may be absent without departing from the advantages or functionality of the system.
- the automated slide handling subsystemoperates the movement and management of a slide carrier.
- a slide carrier 60is shown in FIGS. 6 a and 6 b , which provide a top view and a bottom view, respectively.
- the slide carrier 60can include a number of slides 70 (e.g., at least four slides but may number from 1-50 or more).
- the carrier 60includes ears 64 for hanging the carrier in the output hopper 18 .
- An undercut 66 and pitch rack 68are formed at the top edge of the slide carrier 60 for mechanical handling of the slide carrier.
- a keyway cutout 65is formed in one side of the carrier 60 to facilitate carrier alignment.
- a prepared slide 72 mounted on the slide carrier 60includes a sample area 72 a and a bar code label area 72 b.
- FIG. 7 aprovides a top view of the slide handling subsystem, which comprises a slide, input module 15 , a slide output module 17 and X-Y stage drive belt 50 .
- FIG. 7 bprovides a partial cross-sectional view taken along line A-A of FIG. 7 a .
- the slide input module 15comprises a slide carrier input hopper 16 , loading platform 52 and slide carrier loading subassembly 54 .
- the input hopper 16receives a series of slide carriers 60 ( FIGS. 6 a and 6 b ) in a stack on loading platform 52 .
- a guide key 57protrudes from a side of the input hopper 16 to which the keyway cutout 65 ( FIG.
- the input module 15further includes a revolving indexing cam 56 and a switch 90 ( FIG. 7 a ) mounted in the loading platform 52 , the operation of which is described further below.
- the carrier loading subassembly 54comprises an infeed drive belt 59 driven by a motor 86 .
- the infeed drive belt 59includes a pusher tab 58 for pushing the slide carrier horizontally toward the X-Y stage 38 when the belt is driven.
- a homing switch 95senses the pusher tab 58 during a revolution of the belt 59 .
- the X-Y stage 38is shown with x position and y position motors 96 and 97 , respectively, which are controlled by the system processor 23 ( FIG. 3 ) and are not considered part of the slide handling subsystem.
- the X-Y stage 38further includes an aperture 55 for allowing illumination to reach the slide carrier.
- a switch 91is mounted adjacent the aperture 55 for sensing contact with the carrier and thereupon activating a motor 87 to drive stage drive belt 50 ( FIG. 7 b ).
- the drive belt 50is a double-sided timing belt having teeth for engaging pitch rack 68 of the carrier 60 ( FIG. 6 b ).
- the slide output module 17includes slide carrier output hopper 18 , unloading platform 36 and slide carrier unloading subassembly 34 .
- the unloading subassembly 34comprises a motor 89 for rotating the unloading platform 36 about shaft 98 during an unloading operation described further below.
- An outfeed gear 93 driven by motor 88 ( FIG. 7 a )rotatably engages the pitch rack 68 of the carrier 60 ( FIG. 6 b ) to transport the carrier to a rest position against switch 92 ( FIG. 7 a ).
- a springloaded hold-down mechanism 94holds the carrier in place on the unloading platform 36 .
- FIG. 8a series of slide carriers 60 are shown stacked in input hopper 16 with the top edges 60 a aligned.
- the indexing cam 56 driven by motor 85advances one revolution to allow only one slide carrier to drop to the bottom of the hopper 16 and onto the loading platform 52 .
- FIGS. 8 a - 8 dshow the cam action in more detail.
- the cam 56includes a hub 56 a to which are mounted upper and lower leaves 56 b and 56 c , respectively.
- the leaves 56 b and 56 care semicircular projections oppositely positioned and spaced apart vertically.
- the upper leaf 56 bsupports the bottom carrier at the undercut portion 66 .
- the upper leaf 56 bno longer supports the carrier and instead the carrier has dropped slightly and is supported by the lower leaf 56 c .
- FIG. 8 cshows the position of the cam 56 rotated 270° wherein the upper leaf 56 b has rotated sufficiently to begin to engage the undercut 66 of the next slide carrier while the opposite facing lower leaf 56 c still supports the bottom carrier.
- the lower leaf 56 chas rotated opposite the carrier stack and no longer supports the bottom carrier which now rests on the loading platform 52 .
- the upper leaf 56 bsupports the next carrier for repeating the cycle.
- the X-Y stage 38moves to an unload position and motors 87 and 88 are activated to transport the carrier to the unloading platform 36 using stage drive belt 50 .
- motor 88drives outfeed gear 93 to engage the pitch rack 68 of the carrier 60 ( FIG. 6 b ) until switch 92 is contacted.
- Closing switch 92activates motor 89 to rotate the unloading platform 36 .
- FIGS. 9 a - 9 dThe unloading operation is shown in more detail in end views of the output module 17 ( FIGS. 9 a - 9 d ).
- FIG. 9 athe unloading platform 36 is shown in a horizontal position supporting a slide carrier 60 .
- the hold-down mechanism 94secures the carrier 60 at one end.
- FIG. 9 bshows the output module 17 after motor 89 has rotated the unloading platform 36 to a vertical position, at which point the spring loaded hold-down mechanism 94 releases the slide carrier 60 into the output hopper 18 .
- the carrier 60is supported in the output hopper 18 by means of ears 64 ( FIGS. 6 a and 6 b ).
- FIG. 9 cshows the unloading platform 36 being rotated back towards the 20 horizontal position.
- FIG. 9 dshows the unloading platform 36 at its original horizontal position after having output a series of slide carriers 60 to the output hopper 18 .
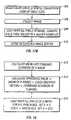
- FIG. 10is a flow diagram that describes the processing associated with the automatic location of a scan area.
- a basic methodis to pre-scan the entire slide area under transmitted light to determine texture features that indicate the presence of a smear or tissue and to discriminate these areas from dirt and other artifacts.
- one or more distinctive featuresmay be identified and the coordinates determined in order to make corrections to identify objects of interest in a serial subsample as described herein and using techniques known in the art.
- the systemdetermines whether a user defined microscope objective has been identified 200 .
- the systemsets the stage comprising the sample to be scanned at a predetermined position, such as the upper left hand corner of a raster search area 202 .
- a predetermined positionsuch as the upper left hand corner of a raster search area 202 .
- an imagesuch as in FIG. 12 is acquired 204 and analyzed for texture/border information 206 . Since it is desired to locate the edges of the smear or tissue sample within a given image, texture analyses are conducted over areas called windows 78 ( FIG. 12 ), which are smaller than the entire image as shown in FIG. 12 .
- the processiterates the scan across the slide at steps 208 , 210 , 212 , and 214 .
- the texture analysis processcan be performed at a lower magnification, such as at a 4 ⁇ objective, for a rapid analysis.
- a lower magnificationsuch as at a 4 ⁇ objective
- One reason to operate at low magnificationis to image the largest slide area at any one time. Since cells do not yet need to be resolved at this stage of the overall image analysis, the 4 ⁇ magnification works well.
- a higher magnification scancan be performed, which may take additional time due to the field of view being smaller and requiring additional images to be processed.
- a portion 72 b of the end of the slide 72is reserved for labeling with identification information. Excepting this label area, the entire slide is scanned in a raster scan fashion to yield a number of adjacent images. Texture values for each window include the pixel variance over a window, the difference between the largest and smallest pixel value within a window, and other indicators. The presence of a smear or tissue raises the texture values compared with a blank area.
- texture analysisprovides a texture value for each analyzed area.
- the texture valuetends to gradually rise as the scan proceeds across a smear tissue from a thin area to a thick area, reaches a peak, and then falls off again to a lower value as a thin area at the edge is reached.
- the problemis then to decide from the series of texture values the beginning and ending, or the edges, of the smear or tissue.
- the texture valuesare fit to a square wave waveform since the texture data does not have sharp beginnings and endings.
- step functionOn a line-by-line basis, to the texture values in step 216 (see FIG. 10 ). This function, which resembles a single square wave beginning at one edge and ending at the other edge and having an amplitude, provides the means for discrimination.
- the amplitude of the best-fit step functionis utilized to determine whether smear (tissue) or dirt is present since relatively high values indicate smear (tissue). If it is decided that smear (tissue) is present, the beginning and ending coordinates of this pattern are noted until all lines have been processed, and the smear (tissue) sample area defined at 218 .
- the first past scan abovecan be used to determine a particular orientation of a sample.
- digital imagesare comprised of a series of pixels arranged in a matrix, a grayscale value is can be attributed to each pixel to indicate the appearance thereof of the image.
- “Orientation matching” between two samplesis then performed by comparing these grayscale values relative to their positions in both the first sample image (i.e., the template) and the second sample image. A match is found when the same or similar pattern is found in the second image when compared to the first image.
- Such systemsare typically implemented in a computer for use in various manufacturing and robotic applications and are applicable to the methods and systems of the invention.
- such systemshave been utilized to automate tasks such as semiconductor wafer handling operations, fiducial recognition for pick-and-place printed circuit board (PCB) assembly, machine vision for quantification or system control to assist in location of objects on conveyor belts, pallets, and trays, and automated recognition of printed matter to be inspected, such as alignment marks.
- the matrix of pixels used to represent such digital imagesare typically arranged in a Cartesian coordinate system or other arrangement of non-rectangular pixels, such as hexagonal or diamond shaped pixels.
- Recognition methodsusually require scanning the search image scene pixel by pixel in comparison with the template, which is sought.
- known search techniquesallow for transformations such as rotation and scaling of the template image within the second sample image, therefore requiring the recognition method to accommodate for such transformations.
- Normalized grayscale correlationhas been used to match digital images reliably and accurately, as is disclosed in U.S. Pat. No. 5,602,937, entitled “Methods and Apparatus for Machine Vision High Accuracy Searching,” assigned to Cognex Corporation.
- NSCNormalized grayscale correlation
- Matrox Imaging Library version 7.5Matrox Electronic Systems Ltd., Canada.
- a bar code or computer readable label placed at 72 bcomprises instructions regarding the processing parameters of a particular slide as well as additional information such as a subject's name/initials or other identification.
- additional informationsuch as a subject's name/initials or other identification.
- a complete scan of the slide at low magnificationis made to identify and locate candidate objects of interest, followed by further image analysis of the candidate objects of interest at high magnification in order to confirm the candidate cells or objects of interest.
- An alternate method of operationis to perform high magnification image analysis of each candidate object of interest immediately after the object has been identified at low magnification. The low magnification scanning then resumes, searching for additional candidate objects of interest. Since it takes on the order of a few seconds to change objectives, this alternate method of operation would take longer to complete.
- the inventionprovides a method for histological reconstruction to analyze many fields of view on potentially many slides simultaneously.
- the methodcouples composite images in an automated manner for processing and analysis.
- a slide on which is mounted a cellular specimen stained to identify objects of interestis supported on a motorized stage.
- An image of the cellular specimenis generated, digitized, and stored in memory.
- a histological reconstructionis made.
- These stored images of the entire tissue sectionmay then be placed together in an order such that the H/E stained slide is paired with the immunohistochemistry slide, which in turn may be paired with a fluorescently labeled slide so that analysis of the images may be performed simultaneously.
- An overall detection process for a candidate cell or object of interestincludes a combination of decisions made at both a low (e.g., 4 ⁇ or 10 ⁇ ) and a high magnification (40 ⁇ ) level. Decision-making at the low magnification level is broader in scope, e.g., objects that loosely fit the relevant color, size, and shape characteristics are identified at a 10 ⁇ level.
- Analysis at the 40 ⁇ magnification levelthen proceeds to refine the decision-making and confirm objects as likely cells or candidate objects of interest. For example, at the 40 ⁇ level it is not uncommon to find that some objects that were identified at 10 ⁇ are artifacts, which the analysis process will then reject. In addition, closely packed objects of interest appearing at 10 ⁇ are separated at the 40 ⁇ level. In a situation where a cell straddles or overlaps adjacent image fields, image analysis of the individual adjacent image fields could result in the cell being rejected or undetected. To avoid missing such cells, the scanning operation compensates by overlapping adjacent image fields in both the x and y directions. An overlap amount greater than half the diameter of an average cell is desirable. In one embodiment, the overlap is specified as a percentage of the image field in the x and y directions. Alternatively, a reconstruction method as described above may be used to reconstruct the image from multiple fields of view. The reconstructed image is then analyzed and processed to find objects of interest.
- the time to complete an image analysiscan vary depending upon the size of the scan area and the number of candidate cells or objects of interest identified. For example, in one embodiment, a complete image analysis of a scan area of two square centimeters in which 50 objects of interest are confirmed can be performed in about 12 to 15 minutes. This example includes not only focusing, scanning and image analysis but also the saving of 40 ⁇ images as a mosaic on hard drive 21 ( FIG. 2 ).
- FIG. 13Aprovides a flow diagram describing the “focus point” procedure.
- the basic methodrelies on the fact that the pixel value variance (or standard deviation) taken about the pixel value mean is maximum at best focus.
- a “brute-force” methodcould simply step through focus, using the computer controlled Z, or focus stage, calculate the pixel variance at each step, and return to the focus position providing the maximum variance.
- Such a methodis time consuming.
- One methodincludes the determination of pixel variance at a relatively coarse number of focal positions, and then the fitting a curve to the data to provide a faster means of determining optimal focus. This basic process is applied in two steps, coarse and fine.
- the Z stageis stepped over a user-specified range of focus positions, with step sizes that are also user-specified. It has been found that for coarse focusing, these data are a close fit to a Gaussian function. Therefore, this initial set of variance versus focus position data are least-squares fit to a Gaussian function at 228 . The location of the peak of this Gaussian curve determines the initial or coarse estimate of focus position for input to step 232 .
- a second stepping operation 232 - 242is performed utilizing smaller steps over a smaller focus range centered on the coarse focus position.
- data taken over this smaller rangeare generally best fit by a second order polynomial. Once this least squares fit is performed at 240 , the peak of the second order curve provides the fine focus position at 244 .
- FIG. 14illustrates a procedure for how this focusing method is utilized to determine the orientation of a slide in its carrier.
- focus positionsare determined, as described above, for a 3 ⁇ 3 grid of points centered on the scan area at 264 . Should one or more of these points lie outside the scan area, the method senses this at 266 by virtue of low values of pixel variance. In this case, additional points are selected closer to the center of the scan area.
- FIG. 15shows the initial array of points 80 and new point 82 selected closer to the center.
- a least squares planeis fit to this data at 270 . Focus points lying too far above or below this best-fit plane are discarded at 272 (such as can occur from a dirty cover glass over the scan area), and the data is then refit. This plane at 274 then provides the desired Z position information for maintaining focus during scanning.
- the scan areais scanned in an X raster scan over the scan area as described earlier.
- the X stageis positioned to the starting point of the scan area
- the focus (Z) stageis positioned to the best fit focus plane
- an imageis acquired and processed as described later, and this process is repeated for all points over the scan area.
- focusis maintained automatically without the need for time-consuming refocusing at points during scanning.
- a refocusing operationis conducted since the use of this higher magnification requires more precise focus than the best-fit plane provides.
- FIG. 16provides the flow diagram for this process.
- this processis similar to the fine focus method described earlier in that the object is to maximize the image pixel variance. This is accomplished by stepping through a range of focus positions with the Z stage at 276 and 278 , calculating the image variance at each position at 278 , fitting a second order polynomial to these data at 282 , and calculating the peak of this curve to yield an estimate of the best focus position at 284 and 286 .
- This final focusing stepdiffers from previous ones in that the focus range and focus step sizes are smaller since this magnification requires focus settings to within 0.5 micron or better.
- improved focuscan be obtained by numerically selecting the focus position that provides the largest variance, as opposed to selecting the peak of the polynomial.
- the polynomialis used to provide an estimate of best focus, and a final step selects the actual Z position giving highest pixel variance.
- the systemautomatically reverts to a coarse focusing process as described above with reference to FIG. 13A . This ensures that variations in specimen thickness can be accommodated in an expeditious manner. For some biological samples and stains, the focusing methods discussed above do not provide optimal focused results.
- certain white blood cells known as neutrophilsmay be stained with Fast Red, a commonly known stain, to identify alkaline phosphatase in the cytoplasm of the cells.
- the specimenmay be counterstained with hematoxylin to identify the nucleus of the cells.
- the cytoplasm bearing alkaline phosphatasebecomes a shade of red proportionate to the amount of alkaline phosphatase in the cytoplasm and the nucleus becomes blue.
- the cytoplasm and nucleus overlapthe cell appears purple.
- the focus planemay be based upon the intensity of a fluorescent signal. For example, as the image scans through a Z-plane of the sample, the intensity of fluorescence will change as the focus plane passes closer to the fluorescence indicator.
- a focus methodsuch as the one shown in FIG. 13B , may be used. That method begins by selecting a pixel near the center of a candidate object of interest 248 and defining a region of interest centered about the selected pixel 250 .
- the width of the region of interestis a number of columns, which is a power of 2. This width determination arises from subsequent processing of the region of interest using a one dimensional Fast Fourier Transform (FFT) technique.
- FFTFast Fourier Transform
- processing columns of pixel values using the FFT techniqueis facilitated by making the number of columns to be processed a power of two. While the height of the region of interest is also a power of two, it need not be unless a two dimensional FFT technique is used to process the region of interest.
- the columns of pixel valuesare processed using a one dimensional FFT to determine a spectra of frequency components for the region of interest 252 .
- the frequency spectraranges from DC to some highest frequency component.
- a complex magnitudeis computed for each frequency component.
- the complex magnitudes for the frequency componentswhich range from approximately 25% of the highest component to approximately 75% of the highest component, are squared and summed to determine the total power for the region of interest 254 .
- the region of interestmay be processed with a smoothing window, such as a Hanning window, to reduce the spurious high frequency components generated by the FFT processing of the pixel values in the region of interest.
- Such preprocessing of the region of interestpermits complex magnitudes over the complete frequency range to be squared and summed.
- a new focal positionis selected, focus adjusted 258 and 260 , and the process repeated.
- the one having the greatest power factoris selected as the one best in focus 262 .
- the followingdescribes the image processing methods which are utilized to decide whether a candidate object of interest such as a stained tumor cell is present in a given image, or field, during the scanning process.
- Candidate objects of interestwhich are detected during scanning, are reimaged at higher (40 ⁇ or 60 ⁇ ) magnification, the decision confirmed, and an image of the object of interest as well as its coordinates saved for later review.
- objects of interestare first acquired and identified under transmitted light.
- the image processingincludes color space conversion, low pass filtering, background suppression, artifact suppression, morphological processing, and blob analysis. One or more of these steps can optionally be eliminated.
- the operatormay optionally configure the system to perform any or all of these steps and whether to perform certain steps more than once or several times in a row. It should also be noted that the sequence of steps may be varied and thereby optimized for specific reagents or reagent combinations; however, a typical sequence is described herein.
- FIG. 17AAn overview of the identification process is shown in FIG. 17A .
- the process for identifying and locating candidate objects of interest in a stained biological sample under transmitted light on a slidebegins with an acquisition of images obtained by scanning the slide at low magnification 288 . Each image is then converted from a first color space to a second color space 290 and the color converted image is low pass filtered 292 . The pixels of the low pass filtered image are then compared to a threshold 294 and those pixels having a value equal to or greater than the threshold are identified as candidate object of interest pixels and those less than the threshold are determined to be artifact or background pixels.
- the candidate object of interest pixelsare then morphologically processed to identify groups of candidate object of interest pixels as candidate objects of interest 296 .
- candidate objects of interestare then compared to blob analysis parameters 298 to further differentiate candidate objects of interest from objects, which do not conform to the blob analysis parameters and do not warrant further processing.
- the location of the candidate objects of interestmay be stored prior to confirmation at high magnification.
- the processcontinues by determining whether the candidate objects of interest have been confirmed 300 . If they have not been confirmed, the optical system is set to high magnification 302 and images of the slide at the locations corresponding to the candidate objects of interest identified in the low magnification images are acquired 288 .
- These imagesare then color converted 290 , low pass filtered 292 , compared to a threshold 294 , morphologically processed 296 , and compared to blob analysis parameters 298 to confirm which candidate objects of interest located from the low magnification images are objects of interest.
- the coordinates of the objects of interestare then stored for future reference.
- the candidate objects of interestare detected based on a combination of characteristics, including size, shape, and color.
- the chain of decision making based on these characteristicsbegins with a color space conversion process.
- the optical sensing array coupled to the microscope subsystemoutputs a color image comprising a matrix of pixels. Each pixel comprises red, green, and blue (RGB) signal values.
- Samplesare generally stained with one or more standard stains (e.g., DAB, New Fuchsin, AEC), which are “reddish” in color.
- DABDAB
- New Fuchsin, AECAEC
- Candidate objects of interestretain more of the stain and thus appear red while normal cells remain unstained.
- the specimensmay also be counterstained with hematoxylin so the nuclei of normal cells or cells not containing an object of interest appear blue.
- dirt and debriscan appear as black, gray, or can also be lightly stained red or blue depending on the staining procedures utilized.
- the residual plasma or other fluidsalso present on a smear (tissue) may also possess some color.
- a ratio of two of the RGB signal valuesis formed to provide a means for discriminating color information.
- nine different ratioscan be formed: R/R, R/G, R/B, G/G, G/B, G/R, B/B, B/G, B/R.
- the optimal ratio to selectdepends upon the range of color information expected in the slide sample. As noted above, typical stains used in light microscopy for detecting candidate objects of interest such as tumor cells are predominantly red, as opposed to predominantly green or blue. Thus, the pixels of an object of interest that has been stained would contain a red component, which is larger than either the green or blue components.
- a ratio of red divided by blueprovides a value which is greater than one for, e.g. tumor cells, but is approximately one for any clear or white areas on the slide. Since other components of the sample, for example, normal cells, typically are stained blue, the R/B ratio for pixels of these other components (e.g., normal cells) yields values of less than one. The R/B ratio is used for separating the color information typical in these applications.
- FIG. 17Billustrates the flow diagram by which this conversion is performed.
- a conversioncan be implemented with a look up table.
- the use of a look up table for color conversionaccomplishes three functions: 1) performing a division operation; 2) scaling the result for processing as an image having pixel values ranging from 0 to 255; and 3) defining objects which have low pixel values in each color band (R,G,B) as “black” to avoid infinite ratios (e.g., dividing by zero).
- These “black” objectsare typically staining artifacts or can be edges of bubbles caused by pasting a coverglass over the specimen.
- each pixel in the original RGB imageis converted at 308 to produce the output. Since it is of interest to separate the red stained tumor cells from blue stained normal ones, the ratio of color values is then scaled by a user specified factor. As an example, for a factor of 128 and the ratio of (red pixel value)/(blue pixel value), clear areas on the slide would have a ratio of 1 scaled by 128 for a final X value of 128. Pixels that lie in red stained tumor cells would have X value greater than 128, while blue stained nuclei of normal cells would have value less than 128. In this way, the desired objects of interest can be numerically discriminated.
- the resulting pixel matrixreferred to as the X-image, is a gray scale image having values ranging from 0 to 255.
- RGBred, green, and blue
- HSIhue, saturation, and intensity
- RGB signals to HSI signalsis equivalent to a transformation from the rectilinear RGB coordinate system used in color space to a cylindrical coordinate system in which hue is the polar coordinate, saturation is the radial coordinate, and intensity is the axial coordinate, whose axis lies on a line between black and white in coordinate space.
- hueis the polar coordinate
- saturationis the radial coordinate
- intensityis the axial coordinate, whose axis lies on a line between black and white in coordinate space.
- a number of algorithms to perform this conversionare known, and computer chips are available to perform the algorithms.
- Exemplary methodsinclude a process whereby a signal representative of a pixel color value is converted to a plurality of signals, each signal representative of a component color value including a hue value, a saturation value, and an intensity value. For each component color value, an associated range of values is set. The ranges together define a non-rectangular subvolume in HSI color space. A determination is made whether each of the component values falls within the associated range of values. The signal is then outputting, indicating whether the pixel color value falls within the color range in response to each of the component values falling within the associated range of values.
- the range of values associated with the hue valuecomprises a range of values between a high hue value and a low hue value
- the range of values associated with the saturation valuecomprises a range of values above a low saturation value
- the range of values associated with the intensity valuecomprises a range of values between a high intensity value and a low intensity value.
- Such methodscan be executed on an apparatus that may include a converter to convert a signal representative of a pixel color value to a plurality of signals representative of component color values including a hue value, a saturation value, and an intensity value.
- the hue comparatordetermines if the hue value falls within a first range of values.
- the apparatusmay further include a saturation comparator to determine if the saturation value falls within a second range of values, as well as an intensity comparator to determine if the intensity value falls within a third range of values.
- a color identifierconnected to each of the hue comparator, the saturation comparator, and the intensity comparator, is adapted to output a signal representative of a selected color range in response to the hue value falling within the first range of values, the saturation value falling within the second range of values, and the intensity value falling within the third range of values.
- the first range of values, the second range of values, and the third range of valuesdefine a non-rectangular subvolume in HSI color space, wherein the first range of values comprises a plurality of values between a low hue reference value and a high hue reference value, the second range of values comprises a plurality of values above a low saturation value, and the third range of values comprises a plurality of values between a low intensity value and a high intensity value.
- a blue channelin which objects that are red are relatively dark.
- Objects which are blue, or whiteare relatively light in the blue channel.
- illuminationis not uniform. Non-uniformity of illumination results in non-uniformity across the pixel values in any color channel, for example, tending to peak in the middle of the image and dropping off at the edges where the illumination falls off.
- the color conversion schemeis relatively insensitive to changes in color balance, e.g., the relative outputs of the red, green, and blue channels. However, some control is necessary to avoid camera saturation, or inadequate exposures in any one of the color bands.
- This color balancingis performed automatically by utilizing a calibration slide consisting of a clear area, and a “dark” area having a known optical transmission or density. The system obtains images from the clear and “dark” areas, calculates “white” and “black” adjustments for the image-frame grabber or image processor 25 , and thereby provides correct color balance.
- An objective of thresholdingis to obtain a pixel image matrix having only candidate cells or objects of interest, such as tumor cells above a threshold level and everything else below it.
- the noisecan take several forms, including white noise and artifacts.
- the microscope slidecan have small fragments of debris that pick up color in the staining process and these are known as artifacts. These artifacts are generally small and scattered areas, on the order of a few pixels, which are above the threshold.
- the purpose of low pass filteringis to essentially blur or smear the entire color converted image. The low pass filtering process will smear artifacts more than larger objects of interest, such as tumor cells and thereby eliminate or reduce the number of artifacts that pass the thresholding process. The result is a cleaner thresholded image downstream.
- a 3 ⁇ 3 matrix of coefficientsis applied to each pixel in the X-image.
- a preferred coefficient matrixis as follows:
- a 3 ⁇ 3 matrixcomprising the pixel of interest and its neighbors is multiplied by the coefficient matrix and summed to yield a single value for the pixel of interest.
- the output of this spatial convolution processis again a pixel matrix.
- the center pixel and only the center pixelhas a value of 255 and each of its other neighbors, top left, top, top right and so forth, have values of 0.
- This singular white pixel casecorresponds to a small object.
- the result of the matrix multiplication and addition using the coefficient matrixis a value of (1/9)*255 or 28.3 for the center pixel, a value which is below the nominal threshold of 128.
- large objectsretain their values while small objects are reduced in amplitude or eliminated.
- the low pass filtering processis performed on the X image twice in succession.
- a thresholding operationis performed designed to set pixels within candidate cells or objects of interest to a value of 255, and all other areas to 0. Thresholding ideally yields an image in which cells of interest are white and the remainder of the image is black.
- a problem one faces in thresholdingis where to set the threshold level. One cannot simply assume that cells of interest are indicated by any pixel value above the nominal threshold of 128.
- a typical imaging systemmay use an incandescent halogen light bulb as a light source. As the bulb ages, the relative amounts of red and blue output can change. The tendency as the bulb ages is for the blue to drop off more than the red and the green.
- a dynamic thresholding processis used whereby the threshold is adjusted dynamically for each acquired image.
- a single threshold valueis derived specific to that image.
- the basic methodis to calculate, for each field, the mean X value, and the standard deviation about this mean 312 .
- the thresholdis then set at 314 to the mean plus an amount defined by the product of a factor (e.g., a user specified factor) and the standard deviation of the color converted pixel values.
- the standard deviationcorrelates to the structure and number of objects in the image.
- a user specified factoris in the range of approximately 1.5 to 2.5.
- the factoris selected to be in the lower end of the range for slides in which the stain has primarily remained within cell boundaries and the factor is selected to be in the upper end of the range for slides in which the stain is pervasively present throughout the slide.
- the thresholdmay be raised or lowered to help reduce background objects.
- the thresholdchanges in step with the aging of the light source such that the effects of the aging are canceled out.
- the image matrix resulting at 316 from the thresholding stepis a binary image of black (0) and white (255) pixels.
- Morphological processingis similar to the low pass filter convolution process described earlier except that it is applied to a binary image. Similar to spatial convolution, the morphological process traverses an input image matrix, pixel by pixel, and places the processed pixels in an output matrix. Rather than calculating a weighted sum of the neighboring pixels as in the low pass convolution process, the morphological process uses set theory operations to combine neighboring pixels in a nonlinear fashion.
- Erosionis a process whereby a single pixel layer is taken away from the edge of an object. Dilation is the opposite process, which adds a single pixel layer to the edges of an object.
- the power of morphological processingis that it provides for further discrimination to eliminate small objects that have survived the thresholding process and yet are not likely objects of interest (e.g., tumor cells).
- the erosion and dilation processes that make up a morphological “open” operationmake small objects disappear yet allow large objects to remain. Morphological processing of binary images is described in detail in “Digital Image Processing”, pages 127-137, G. A. Baxes, John Wiley & Sons, (1994).
- FIG. 19illustrates the flow diagram for this process.
- a single morphological openconsists of a single morphological erosion 320 followed by a single morphological dilation 322 .
- Multiple “opens”consist of multiple erosions followed by multiple dilations.
- one or two morphological opensare found to be suitable.
- the processed imagecontains thresholded objects of interest, such as tumor cells (if any were present in the original image), and possibly some residual artifacts that were too large to be eliminated by the processes above.
- FIG. 20provides a flow diagram illustrating a blob analysis performed to determine the number, size, and location of objects in the thresholded image.
- a blobis defined as a region of connected pixels having the same “color”, in this case, a value of 255. Processing is performed over the entire image to determine the number of such regions at 324 and to determine the area and coordinates for each detected blob at 326 . Comparison of the size of each blob to a known minimum area at 328 for a tumor cell allows a refinement in decisions about which objects are objects of interest, such as tumor cells, and which are artifacts. The location of candidate cells or objects of interest identified in this process are saved for a higher magnification reimaging step described herein. Objects not passing the size test are disregarded as artifacts.
- the processing chain described hereinidentifies candidate cells or objects of interest at a scanning magnification.
- a scanning magnification objectivee.g., 40 ⁇
- each candidate cell or object of interestis reimaged to confirm the identification 332 .
- Each 40 ⁇ imageis reprocessed at 334 using the same steps as described above but with test parameters suitably modified for the higher magnification.
- a region of interest centered on each confirmed cellis saved to the hard drive for review by the pathologist.
- imaging in fluorescent lightmay be performed using a process described above.
- the systemswitches from transmitted light to fluorescent excitation light and obtains images at a desired magnification objective (e.g., 40 ⁇ ) at 330 , and each candidate cell or object of interest identified under transmitted light is reimaged under fluorescent light 332 .
- a desired magnification objectivee.g. 40 ⁇
- Each fluorescent imageis then processed at 334 but with test parameters suitably modified for the fluorescent imaging.
- fluorescent imagecomprising a fluorescently labeled object of interest is saved to storage device for review by a pathologist.
- a mosaic of saved imagesis made available for review by a pathologist. As shown in FIG. 22 , a series of images of cells that have been confirmed by the image analysis is presented in the mosaic 150 . The pathologist can then visually inspect the images to make a determination whether to accept ( 152 ) or reject ( 153 ) each cell image. Such a determination can be noted and saved with the mosaic of images for generating a printed report.
- the coordinatesare saved should the pathologist wish to directly view the cell through the oculars or on the image monitor.
- the pathologistreloads the slide carrier, selects the slide and cell for review from a mosaic of cell images, and the system automatically positions the cell under the microscope for viewing.
- an imageis acquired 340 , and a single color band (e.g., the red channel provides the best contrast for blue stained nucleated cells) is processed by calculating the average pixel value for each field at 342 , thereby establishing two threshold values (high and low) as indicated at 344 , 346 , and counting the number of pixels between these two values at 348 . In the absence of dirt, or other opaque debris, this provides a count of the number of predominantly blue pixels. By dividing this value by the average area for a nucleated cell at 350 , and looping over all fields at 352 , an approximate cell count is obtained. This process yields an accuracy of +/ ⁇ 15%. It should be noted that for some slide preparation techniques, the size of nucleated cells can be significantly larger than the typical size. The operator can select the appropriate nucleated cell size to compensate for these characteristics.
- MTFmodulation transfer function
- FIG. 24the functions available in a user interface of the apparatus 10 are shown. From the user interface, which is presented graphically on computer monitor 26 , an operator can select among apparatus functions that include acquisition 402 , analysis 404 , and configuration 406 . At the acquisition level 402 , the operator can select between manual 408 and automatic 410 modes of operation. In the manual mode, the operator is presented with manual operations 409 . Patient information 414 regarding an assay can be entered at 412 . In the analysis level 404 , preview 416 and report 418 functions are made available. At the preview level 416 , the operator can select a montage function 420 .
- a pathologistcan perform diagnostic review functions including visiting an image 422 , accept/reject a cell 424 , nucleated cell counting 426 , accept/reject cell counts 428 , and saving of pages 430 .
- the report level 418allows an operator to generate patient reports 432 .
- the operatorcan select to configure preferences 434 , input operator information 436 including Name, affiliation and phone number 437 , create a system log 438 , and toggle a menu panel 440 .
- the configuration preferencesinclude scan area selection functions 442 and 452 ; montage specifications 444 , bar code handling 446 , default cell counting 448 , stain selection 450 , and scan objective selection 454 .
- FIG. 25An exemplary microscope subsystem 32 for processing fluorescently labeled samples is shown in FIG. 25 .
- a carrier 60 having four slides thereonis shown. The number of slide in different embodiments can be greater than or less than four.
- a turret 44 with microscope objective lenses 44 a mounted on z axis stageis shown.
- the slide carrier output hopper 18is a receptacle for those slides that have already been scanned.
- Bright field (transmission) light source 48 and fluorescent excitation light source 45are also shown.
- Filter wheels 47 for fluorescent light pathare shown, as well as a fold mirror 47 a in the fluorescent light path.
- a bar code/OCR reader 33is shown.
- a computer controlled wheel 44 bcarrying fluorescent beam splitters (one position is empty for bright field mode) and a camera 42 capable of collecting both bright field (video rate) images and fluorescent (integrated) images.
- the infeed hopper 16advances a carrier 60 onto the stage 38 .
- the barcode/OCR reader 33reads the mark and the required test is looked up in a database.
- Image analysis routinesare used to determine which regions of the slide should be recorded in fluorescent images (the methods used to make this determination are described herein, the exact parameters will depend on the test being performed on the slide).
- the turret 44is switched to high power and further bright field transmission analysis and images are obtained. Alternatively, the turret 44 is switched to a higher power and the bright field transmission light source turned off and the fluorescent excitation light source is turned on.
- a pathologistcould review the images at a review station (a computer and monitor attached to the database but without a microscope).
- the usercould manually count fluorescent signals in the cells of interest or invoke image analysis software to score the fluorescent images by indicating regions of interest with a pointing device such as a mouse. If multiple focus planes have been collected the user could simulate focusing up and down in a live image by sweeping through a range of images at different focus levels.
- a diagnostic reportcan be generated.
- the image analysiscould be performed on the entirety of all regions for which fluorescent images were collected. In this case, the analysis could be performed off line between the time the image was collected and the time the user reviewed the image. When reviewing the images, the user could indicate regions whose scores should be included or excluded in creating the final report.
- the automated detection of fluorescent specimensmay be performed using a single slide or multiple slides.
- the initial scanunder lower power and transmitted light, can be performed on the same slide as the one from which the fluorescent images will be found. In this case, the coordinates of any identified candidate objects of interest do not need to be corrected.
- the initial scancan be performed on a slide, and the data collected therefrom, and the fluorescent images can be collected from another slide having an adjacent serial section to the one that was initially scanned. In this case, the coordinates of any identified candidate objects of interest need to be corrected based upon the coordinates of any distinctive features in the serial samples. Fluorescent images may also be collected from multiple serial sections.
- the IHC stain for the gene productcan be used in testing for Her2 gene amplification. This will mark any region of the tissue overexpressing the gene product (the protein Her2) a brown color.
- the image processing functions of densitometry or color thresholdingcan be used to convert the image to a map of the concentration of the protein. Once a map of relevant regions is available, the system could collect high magnification fluorescent images of either all regions that meet a criteria or a random sample of the relevant regions.
- Another examplewould be the use of the blue stain H&E to find regions of containing tumor cells. In this case, color thresholding for regions of darker blue will tend to find regions of containing tumor cells.
- the systemcould then collect fluorescent images of samples of each zone. When the user reviews the bright field image of the entire tissue and selected regions in which to examine the fluorescent high magnification images, the system could offer an image of another region in the same zone with similar characteristics.
- texture analysis algorithmsthat will partition an image into a number of zones each with similar texture.
- the systemcould be programmed to write the location of the region the user wanted back into the database so that, if the slide is reloaded into the microscope, the system can collect a fluorescent high magnification image at the exact location desired.
- This mode of operationcould either be a fallback for the methods of selecting regions described above or a separate mode of operation in tests in which only the observer's judgment is suitable for deciding which regions are important to examine as fluorescent images.
- the HER2/neu markermay be detected though the use of an anti-HER2/neu staining system, such as a commercially available kit, like that provided by DAKO (Carpinteria, Calif.).
- a typical immunohistochemistry protocolincludes: (1) prepare wash buffer solution; (2) deparaffinize and rehydrate sample or subsample; (3) perform epitope retrieval. Incubate 40 min in a 95° C. water bath. Cool slides for 20 min at room temperature; (4) apply peroxidase blocking reagent. Incubate 5 min; (5) apply primary antibody or negative control reagent. Incubate 30 min +/ ⁇ 1 min at room temperature. Rinse in wash solution. Place in wash solution bath; (6) apply peroxidase labeled polymer.
- mount coverslipsIncubate 30 min +/ ⁇ 1 min at room temperature. Rinse in wash solution. Place in wash solution bath; (7) prepare DAB substrate chromagen solution; (8) apply substrate chromogen solution (DAB). Incubate 5-10 min. Rinse with distilled water; (9) counterstain; (10) mount coverslips.
- the slideincludes a cover-slip medium to protect the sample and to introduce optical correction consistent with microscope objective requirements.
- a coversliptypically covers the entire prepared specimen. Mounting the coverslip does not introduce air bubbles obscuring the stained specimen. This coverslip could potentially be a mounted 1-1 ⁇ 2 thickness coverslip with DAKO Ultramount medium; (11) a set of staining control slides are run with every worklist. The set includes a positive and negative control.
- the positive controlis stained with the anti-HER2 antibody and the negative is stained with another antibody.
- Both slidesare identified with a unique barcode.
- the instrumentUpon reading the barcode, the instrument recognizes the slide as part of a control set, and runs the appropriate application. There may be one or two applications for the stain controls; (12) a set of instrument calibration slides includes the slides used for focus and color balance calibration; (13) a dedicated carrier is used for one-touch calibration. Upon successful completion of this calibration procedure, the instrument reports itself to be calibrated. Upon successful completion of running the standard slides, the user is able to determine whether the instrument is within standards and whether the inter-instrument and intra-instrument repeatability of test results.
- a hematoxylin/eosin (H/E) slideis prepared with a standard H/E protocol.
- Standard solutionsinclude the following: (1) Gills hematoxylin (hematoxylin 6.0 g; aluminum sulphate 4.2 g; citric acid 1.4 g; sodium iodate 0.6 g; ethylene glycol 269 ml; distilled water 680 ml); (2) eosin (eosin yellowish 1.0 g; distilled water 100 ml); (3) lithium carbonate 1% (lithium carbonate 1 g; distilled water 100 g); (4) acid alcohol 1% 70% (alcohol 99 ml conc.; hydrochloric acid 1 ml); and (5) Scott's tap water.
- the staining procedureis as follows: (1) bring the sections to water; (2) place sections in hematoxylin for 5 min; (3) wash in tap water; (4) ‘blue’ the sections in lithium carbonate or Scott's tap water; (5) wash in tap water; (6) place sections in 1% acid alcohol for a few seconds; (7) wash in tap water; (8) place sections in eosin for 5 min; (9) wash in tap water; and (10) dehydrate, clear. Mount sections.
- the results of the H/E stainingprovide cells with nuclei stained blue-black, cytoplasm stained varying shades of pink; muscle fibers stained deep pinky red; fibrin stained deep pink; and red blood cells stained orange-red.
- the inventionprovides automated methods for analysis of estrogen receptor and progesterone receptor.
- the estrogen and progesterone receptorslike other steroid hormone receptors, play a role in developmental processes and maintenance of hormone responsiveness in cells.
- Estrogen and progesterone receptor interaction with target genesis of importance in maintenance of normal cell function and is also involved in regulation of mammary tumor cell function.
- the expression of progesterone receptor and estrogen receptor in breast tumorsis a useful indicator for subsequent hormone therapy.
- An anti-estrogen receptor antibodylabels epithelial cells of breast carcinomas which express estrogen receptor.
- An immunohistochemical assay of the estrogen receptoris performed using an anti-estrogen receptor antibody, for example the well-characterized 1D5 clone, and the methods of Pertchuk, et al.
- the inventionprovides a method whereby tumor cells are identified using a first agent and normal light microscopy and then further characterized using antibodies to a progesterone and/or estrogen receptor, wherein the antibodies are tagged with a fluorescent agent.
- progesterone receptorFor example, the labeling of progesterone receptor has been demonstrated in the nuclei of cells from various histologic subtypes.
- An anti-progesterone receptor antibodylabels epithelial cells of breast carcinomas which express progesterone receptor.
- An immunohistochemical assay of the progesterone receptoris performed using an anti-estrogen receptor antibody, for example the well-characterized 1A6 clone and methods similar to those of Pertchuk, et al. (Cancer 77: 2514-2519, 1996).
- Micrometastases/metastatic recurring diseaseis the biological process whereby a cancer spreads to a distant part of the body from its original site.
- a micrometastasesis the presence of a small number of tumor cells, particularly in the lymph nodes and bone marrow.
- a metastatic recurring diseaseis similar to micrometastasis, but is detected after cancer therapy rather than before therapy.
- An immunohistochemical assay for MM/MRDis performed using a monoclonal antibody that reacts with an antigen (a metastatic-specific mucin) found in bladder, prostate and breast cancers.
- An MM/MRDcan be identified by first staining cells to identify nucleic and cellular organelles or alternatively by staining cells to differentiate between bladder and other prostate cells.
- Subsamples corresponding to the original first subsamplecan then be stained with and antibody to a mucin protein, wherein the antibody is detectably labeled with a fluorescent molecule.
- a first subsampleis prescreened to identify objects of interest including a particular cell type and then screened with a specific antibody to a molecule of interest associated with the object of interest.
- the first screening stepallows for an automated system to identify the coordinates in a first subsample having the object of interest whereby the coordinates are then used to focus and obtaining fluorescent images in a second subsample at the same coordinates.
- MIB-1is an antibody that detects the antigen Ki-67.
- the clinical stage at first presentationis related to the proliferative index measured with Ki-67.
- High index values of Ki-67are positively correlated with metastasis, death from neoplasia, low disease-free survival rates, and low overall survival rates.
- a first agente.g., a staining agent
- a diagnosis or prognosis of a subjectmay then be performed by further analyzing any object of interest for the presence of Ki-67 using an antibody that is detectably labeled with a fluorescent agent.
- any such object of intereste.g., a suspected cancer cell
- the coordinates of any such object of interestare then used to focus and obtain a fluorescent image of a sample or subsample contacted with a fluorescently labeled MIB-1.
- the presence of a fluorescent signal at such coordinatesis indicative of a correlation of the cancer cell with metastasis and/or survival rates.
- microvessel density analysiscan be performed and a determination of any cytokines, angiogenic agents, and the like, which are suspected of playing a role in the angiogenic activity identified.
- Angiogenesisis a characteristic of growing tumors.
- a therapeutic regimencan be identified that targets and modulates (e.g., increases or decreases) the angiogenic molecule or combination of molecules.
- endothelial cell proliferation and migrationare characteristic of angiogenesis and vasculogenesis.
- Endothelial cellscan be identified by markers on the surface of such endothelial cells using a first agent that labels endothelial cells.
- An automated microscope system(such as that produced by ChromaVision Medical Systems, Inc., California) scans the sample for objects of interest (e.g., endothelial cells) stained with the first agent.
- the automated systemdetermines the coordinates of an object of interest and uses these coordinates to focus in on the sample or a subsample that has been contacted with a second fluorescently labeled agent.
- a second agente.g., an antibody, polypeptide, and/or oligonucleotide
- a fluorescent indicatoris then used to detect the specific expression or presence of any number of angiogenic agents.
- p53 oncogeneOverexpression of the p53 oncogene has been implicated as the most common genetic alteration in the development of human malignancies. Investigations of a variety of malignancies, including neoplasms of breast, colon, ovary, lung, liver, mesenchyme, bladder and myeloid, have suggested a contributing role of p53 mutation in the development of malignancy. The highest frequency of expression has been demonstrated in tumors of the breast, colon, and ovary. A wide variety of normal cells do express a wildtype form of p53 but generally in restricted amounts. Overexpression and mutation of p53 have not been recognized in benign tumors or in normal tissue. In addition, p53 has also be implicated as a cocontributor to tumors.
- BRCA-1has been used as marker for ovarian cancer
- p53has also been implicated as playing a role in BRCA-1 ovarian cancers (Rose and Buller, Minerva Ginecol. 54(3):201-9, 2002).
- a sampleis stained for BRCA-1 with a first agent and objects of interest are identified using light microscopy.
- the same sample or a subsample, having substantially identical coordinates with respect to an object of interestis then contacted with a second agent comprising a fluorescent label that interacts with a p53 nucleic acid or polypeptide.
- sample or subsampleis then analyzed via fluorescent microscopy to identify any fluorescent signals at the coordinates associated with the object of interest to determine the presence or absence of p53 nucleic acids or polypeptides.
- An anti-p53 antibody useful in this embodimentincludes, for example, the well-characterized DO-7 clone.
- An example of an object of interestincludes nucleoli, an organelle in a cell nucleus.
- Uses of nucleoli as objects of interestare apparent when determining cervical dysplasia.
- cervical dysplasianormal or metaplastic epithelium is replaced with atypical epithelial cells that have cytologic features that are pre-malignant (nuclear hyperchromatism, nuclear enlargement and irregular outlines, increased nuclear-to-cytoplasmic ratio, increased prominence of nucleoli) and chromosomal abnormalities.
- the changes seen in dysplastic cellsare of the same kind but of a lesser degree than those of deeply malignant cells.
- there are degrees of dysplasiamimild, moderate, severe).
- object of interestmay be the p24 antigen of.
- Anti-p24 antibodiesare used to detect the p24 antigen to determine the presence of the HIV virus. Further assays can then be performed using FISH to determine the genetic composition of the HIV virus using fluorescently labeled oligonucleotide probes and the like.
- One method of sample preparationis to react a sample or subsample with an agent the specifically interacts with a molecule in the sample.
- agentsinclude a monoclonal antibody, a polyclonal antiserum, or an oligonucleotide or polynucleotide.
- Interaction of the agent with its cognate or binding partnercan be detected using an enzymatic reaction, such as alkaline phosphatase or glucose oxidase or peroxidase to convert a soluble colorless substrate linked to the agent to a colored insoluble precipitate, or by directly conjugating a dye or a fluorescent molecule to the probe.
- a first agentis labeled with a non-fluorescent label (e.g., a substrate that gives rise to a precipitate) and a second agent is labeled with a fluorescent label.
- a non-fluorescent labele.g., a substrate that gives rise to a precipitate
- a second agentis labeled with a fluorescent label.
- the non-fluorescent labelpreferably does not interfere with the fluorescent emissions from the fluorescent label.
- non-fluorescent labelsinclude enzymes that convert a soluble colorless substrate to a colored insoluble precipitate (e.g., alkaline phosphatase, glucose oxidase, or peroxidase).
- Other non-fluorescent agentinclude small molecule reagents that change color upon interaction with a particular chemical structure.
- a fluorescently labeled oligonucleotidee.g., a DNA, a RNA, and a DNA-RNA molecule
- the fluorescently labeled oligonucleotideis contacted with a sample (e.g., a tissue sample) on a microscope slide. If the labeled oligonucleotide is complementary to a target nucleotide sequence in the sample on the slide, a bright spot will be seen when visualized on a microscope system comprising a fluorescent excitation light source.
- the intensity of the fluorescencewill depend on a number of factors, such as the type of label, reaction conditions, amount of target in the sample, amount of oligonucleotide agent, and amount of label on the oligonucleotide agent.
- FISHhas an advantage that individual cells containing a target nucleotide sequences of interest can be visualized in the context of the sample or tissue sample. As mentioned above, this can be important in testing for types of diseases and disorders including cancer in which a cancer cell might penetrate normal tissues.
- a given fluorescent moleculeis characterized by an excitation spectrum (sometimes referred to as an absorption spectrum) and an emission spectrum.
- an excitation spectrumsometimes referred to as an absorption spectrum
- an emission spectrumWhen a fluorescent molecule is irradiated with light at a wavelength within the excitation spectrum, the molecule fluoresces, emitting light at wavelengths in the emission spectrum for that particular molecule.
- the sample containing the fluorescent moleculefluoresces.
- the light emanating from the sample and surrounding areamay be filtered to reject light outside a given fluorescent agent's emission spectrum.
- an image acquired from a sample contacted with an agent comprising a fluorescent labelshows only objects of interest in the sample that bind or interact with the fluorescently labeled agent.
Landscapes
- Physics & Mathematics (AREA)
- Engineering & Computer Science (AREA)
- Health & Medical Sciences (AREA)
- General Physics & Mathematics (AREA)
- Chemical & Material Sciences (AREA)
- Analytical Chemistry (AREA)
- General Health & Medical Sciences (AREA)
- Optics & Photonics (AREA)
- Nuclear Medicine, Radiotherapy & Molecular Imaging (AREA)
- Immunology (AREA)
- Multimedia (AREA)
- Biochemistry (AREA)
- Pathology (AREA)
- Theoretical Computer Science (AREA)
- Computer Vision & Pattern Recognition (AREA)
- Life Sciences & Earth Sciences (AREA)
- Chemical Kinetics & Catalysis (AREA)
- Medical Informatics (AREA)
- Radiology & Medical Imaging (AREA)
- Quality & Reliability (AREA)
- Investigating Or Analysing Biological Materials (AREA)
Abstract
Description
| Fluorescent indicator | Excitation Peak | |||
| DAPI | ||||
| 350 | 450 | |||
| FITC | 490 | 520 | ||
| Cy3 | 550 | 570 | ||
| Cy3.5 | 580 | 595 | ||
| Cy5 | 650 | 670 | ||
| Cy5.5 | 680 | 700 | ||
| Cy7 | 755 | 780 | ||
| 1/9 | 1/9 | 1/9 | ||
| 1/9 | 1/9 | 1/9 | ||
| 1/9 | 1/9 | 1/9 | ||
At each pixel location, a 3×3 matrix comprising the pixel of interest and its neighbors is multiplied by the coefficient matrix and summed to yield a single value for the pixel of interest. The output of this spatial convolution process is again a pixel matrix. As an example, consider a case where the center pixel and only the center pixel, has a value of 255 and each of its other neighbors, top left, top, top right and so forth, have values of 0.
Claims (54)
Priority Applications (2)
| Application Number | Priority Date | Filing Date | Title |
|---|---|---|---|
| US10/461,786US7272252B2 (en) | 2002-06-12 | 2003-06-12 | Automated system for combining bright field and fluorescent microscopy |
| US10/894,776US20050037406A1 (en) | 2002-06-12 | 2004-07-19 | Methods and apparatus for analysis of a biological specimen |
Applications Claiming Priority (3)
| Application Number | Priority Date | Filing Date | Title |
|---|---|---|---|
| US38852202P | 2002-06-12 | 2002-06-12 | |
| US45082403P | 2003-02-27 | 2003-02-27 | |
| US10/461,786US7272252B2 (en) | 2002-06-12 | 2003-06-12 | Automated system for combining bright field and fluorescent microscopy |
Related Child Applications (1)
| Application Number | Title | Priority Date | Filing Date |
|---|---|---|---|
| US10/894,776Continuation-In-PartUS20050037406A1 (en) | 2002-06-12 | 2004-07-19 | Methods and apparatus for analysis of a biological specimen |
Publications (2)
| Publication Number | Publication Date |
|---|---|
| US20030231791A1 US20030231791A1 (en) | 2003-12-18 |
| US7272252B2true US7272252B2 (en) | 2007-09-18 |
Family
ID=29740840
Family Applications (1)
| Application Number | Title | Priority Date | Filing Date |
|---|---|---|---|
| US10/461,786Expired - Fee RelatedUS7272252B2 (en) | 2002-06-12 | 2003-06-12 | Automated system for combining bright field and fluorescent microscopy |
Country Status (1)
| Country | Link |
|---|---|
| US (1) | US7272252B2 (en) |
Cited By (121)
| Publication number | Priority date | Publication date | Assignee | Title |
|---|---|---|---|---|
| US20040186369A1 (en)* | 2003-03-21 | 2004-09-23 | Scimed Life Systems, Inc. | Scan conversion of medical imaging data |
| US20050250155A1 (en)* | 1998-10-29 | 2005-11-10 | Cell Works Diagnostics, Inc. | Multiple marker characterization of single cells |
| US20060067887A1 (en)* | 2002-12-23 | 2006-03-30 | Qinetiq Limited | Scoring estrogen and progesterone receptors expression based on image analysis |
| US20070280533A1 (en)* | 2006-06-06 | 2007-12-06 | Chun-Chia Huang | Monochromic image processing system and method for background removal according to dynamic data |
| US20080097222A1 (en)* | 2006-10-24 | 2008-04-24 | The Research Foundation Of State University Of New York | Composition, method, system, and kit for optical electrophysiology |
| US20080097225A1 (en)* | 2006-10-19 | 2008-04-24 | The General Hospital Corporation | Apparatus and method for obtaining and providing imaging information associated with at least one portion of a sample, and effecting such portion(s) |
| US20090003789A1 (en)* | 2004-07-02 | 2009-01-01 | The General Hospital Corporation | Imaging system and related techniques |
| US20090161928A1 (en)* | 2007-12-06 | 2009-06-25 | Siemens Corporate Research, Inc. | System and method for unsupervised detection and gleason grading of prostate cancer whole mounts using nir fluorscence |
| US20090166570A1 (en)* | 2007-12-26 | 2009-07-02 | Olympus Corporation | Biological-specimen observation apparatus |
| US20090196526A1 (en)* | 2004-08-18 | 2009-08-06 | Tripath Imaging, Inc. | Microscopy system having automatic and interactive modes for forming a magnified mosaic image and associated method |
| US20100034437A1 (en)* | 1998-06-01 | 2010-02-11 | Zeineh Jack A | System and method for reconstructing a diagnostic trajectory |
| US20100073472A1 (en)* | 1998-06-01 | 2010-03-25 | Carl Zeiss Microlmaging Ais, Inc. | Intergrated virtual slide and live microscope system |
| US7761139B2 (en) | 2003-01-24 | 2010-07-20 | The General Hospital Corporation | System and method for identifying tissue using low-coherence interferometry |
| US20100189338A1 (en)* | 2008-04-09 | 2010-07-29 | Nexcelom Bioscience | Systems and methods for counting cells and biomolecules |
| US20100214437A1 (en)* | 2009-02-25 | 2010-08-26 | Samsung Digital Imaging Co., Ltd. | Digital image processing apparatus, method of controlling the apparatus, and recording medium having recorded thereon a program for executing the method |
| US7796270B2 (en) | 2006-01-10 | 2010-09-14 | The General Hospital Corporation | Systems and methods for generating data based on one or more spectrally-encoded endoscopy techniques |
| US7797119B2 (en) | 2002-01-24 | 2010-09-14 | The General Hospital Corporation | Apparatus and method for rangings and noise reduction of low coherence interferometry LCI and optical coherence tomography OCT signals by parallel detection of spectral bands |
| US7864822B2 (en) | 2003-06-06 | 2011-01-04 | The General Hospital Corporation | Process and apparatus for a wavelength tuning source |
| US7889348B2 (en) | 2005-10-14 | 2011-02-15 | The General Hospital Corporation | Arrangements and methods for facilitating photoluminescence imaging |
| US7898656B2 (en) | 2008-04-30 | 2011-03-01 | The General Hospital Corporation | Apparatus and method for cross axis parallel spectroscopy |
| US20110052038A1 (en)* | 2009-08-31 | 2011-03-03 | Sony Corporation | Tissue-slice image acquirement and display apparatus, tissue-slice image acquirement and display method, and tissue-slice image acquirement and display program |
| US7907271B2 (en) | 2007-06-15 | 2011-03-15 | Historx, Inc. | Method and system for standardizing microscope instruments |
| US7920271B2 (en) | 2006-08-25 | 2011-04-05 | The General Hospital Corporation | Apparatus and methods for enhancing optical coherence tomography imaging using volumetric filtering techniques |
| US7933021B2 (en) | 2007-10-30 | 2011-04-26 | The General Hospital Corporation | System and method for cladding mode detection |
| US7949019B2 (en) | 2007-01-19 | 2011-05-24 | The General Hospital | Wavelength tuning source based on a rotatable reflector |
| US7969578B2 (en) | 2003-10-27 | 2011-06-28 | The General Hospital Corporation | Method and apparatus for performing optical imaging using frequency-domain interferometry |
| US7978258B2 (en) | 2007-08-31 | 2011-07-12 | Historx, Inc. | Automatic exposure time selection for imaging tissue |
| US7982879B2 (en) | 2006-02-24 | 2011-07-19 | The General Hospital Corporation | Methods and systems for performing angle-resolved fourier-domain optical coherence tomography |
| US7995210B2 (en) | 2004-11-24 | 2011-08-09 | The General Hospital Corporation | Devices and arrangements for performing coherence range imaging using a common path interferometer |
| US20110200240A1 (en)* | 2008-10-23 | 2011-08-18 | Koninklijke Philips Electronics N.V. | Colour management for biological samples |
| US8018598B2 (en) | 2004-05-29 | 2011-09-13 | The General Hospital Corporation | Process, system and software arrangement for a chromatic dispersion compensation using reflective layers in optical coherence tomography (OCT) imaging |
| US8045177B2 (en) | 2007-04-17 | 2011-10-25 | The General Hospital Corporation | Apparatus and methods for measuring vibrations using spectrally-encoded endoscopy |
| US8050747B2 (en) | 2001-05-01 | 2011-11-01 | The General Hospital Corporation | Method and apparatus for determination of atherosclerotic plaque type by measurement of tissue optical properties |
| US8054468B2 (en) | 2003-01-24 | 2011-11-08 | The General Hospital Corporation | Apparatus and method for ranging and noise reduction of low coherence interferometry LCI and optical coherence tomography OCT signals by parallel detection of spectral bands |
| US8081316B2 (en) | 2004-08-06 | 2011-12-20 | The General Hospital Corporation | Process, system and software arrangement for determining at least one location in a sample using an optical coherence tomography |
| US8097864B2 (en) | 2009-01-26 | 2012-01-17 | The General Hospital Corporation | System, method and computer-accessible medium for providing wide-field superresolution microscopy |
| US8121365B2 (en) | 2007-08-07 | 2012-02-21 | Historx, Inc. | Method and system for determining an optimal dilution of a reagent |
| US8137912B2 (en) | 2006-06-14 | 2012-03-20 | The General Hospital Corporation | Methods for the diagnosis of fetal abnormalities |
| US8145018B2 (en) | 2006-01-19 | 2012-03-27 | The General Hospital Corporation | Apparatus for obtaining information for a structure using spectrally-encoded endoscopy techniques and methods for producing one or more optical arrangements |
| US8149418B2 (en) | 2005-09-29 | 2012-04-03 | The General Hospital Corporation | Method and apparatus for optical imaging via spectral encoding |
| US8160348B2 (en) | 2007-08-06 | 2012-04-17 | Historx, Inc. | Methods and system for validating sample images for quantitative immunoassays |
| US8168389B2 (en) | 2006-06-14 | 2012-05-01 | The General Hospital Corporation | Fetal cell analysis using sample splitting |
| US8175685B2 (en) | 2006-05-10 | 2012-05-08 | The General Hospital Corporation | Process, arrangements and systems for providing frequency domain imaging of a sample |
| US8174702B2 (en) | 2003-01-24 | 2012-05-08 | The General Hospital Corporation | Speckle reduction in optical coherence tomography by path length encoded angular compounding |
| US8195415B2 (en) | 2008-09-20 | 2012-06-05 | The Board Of Trustees Of The Leland Stanford Junior University | Noninvasive diagnosis of fetal aneuploidy by sequencing |
| US20120140055A1 (en)* | 2010-12-06 | 2012-06-07 | Sony Corporation | Microscope, region determining method, and program |
| US8208995B2 (en) | 2004-08-24 | 2012-06-26 | The General Hospital Corporation | Method and apparatus for imaging of vessel segments |
| US20120257811A1 (en)* | 2011-04-08 | 2012-10-11 | Gregory Metzger | Computerized methods for tissue analysis using n-gene profiling |
| US20120300053A1 (en)* | 2011-05-27 | 2012-11-29 | Olympus Corporation | Image acquisition device |
| US8335360B2 (en) | 2007-05-14 | 2012-12-18 | Historx, Inc. | Compartment segregation by pixel characterization using image data clustering |
| US8351665B2 (en)* | 2005-04-28 | 2013-01-08 | The General Hospital Corporation | Systems, processes and software arrangements for evaluating information associated with an anatomical structure by an optical coherence ranging technique |
| US20130051644A1 (en)* | 2011-08-29 | 2013-02-28 | General Electric Company | Method and apparatus for performing motion artifact reduction |
| USRE44042E1 (en) | 2004-09-10 | 2013-03-05 | The General Hospital Corporation | System and method for optical coherence imaging |
| US8435738B2 (en) | 2011-09-25 | 2013-05-07 | Theranos, Inc. | Systems and methods for multi-analysis |
| US20130129181A1 (en)* | 2010-05-21 | 2013-05-23 | Chemometec A/S | Compact dark field light source and dark field image analysis at low magnification |
| US8475739B2 (en) | 2011-09-25 | 2013-07-02 | Theranos, Inc. | Systems and methods for fluid handling |
| US20130243277A1 (en)* | 2012-03-17 | 2013-09-19 | Sony Corporation | Flourescent dot counting in digital pathology images |
| US8593619B2 (en) | 2008-05-07 | 2013-11-26 | The General Hospital Corporation | System, method and computer-accessible medium for tracking vessel motion during three-dimensional coronary artery microscopy |
| US8697377B2 (en) | 2007-10-02 | 2014-04-15 | Theranos, Inc. | Modular point-of-care devices, systems, and uses thereof |
| US8759790B2 (en) | 2009-08-31 | 2014-06-24 | Sony Corporation | Fluorescence image producing method, fluorescence image producing apparatus, and fluorescence image producing program |
| US8804126B2 (en) | 2010-03-05 | 2014-08-12 | The General Hospital Corporation | Systems, methods and computer-accessible medium which provide microscopic images of at least one anatomical structure at a particular resolution |
| US8840838B2 (en) | 2011-09-25 | 2014-09-23 | Theranos, Inc. | Centrifuge configurations |
| US8861910B2 (en) | 2008-06-20 | 2014-10-14 | The General Hospital Corporation | Fused fiber optic coupler arrangement and method for use thereof |
| US8922781B2 (en) | 2004-11-29 | 2014-12-30 | The General Hospital Corporation | Arrangements, devices, endoscopes, catheters and methods for performing optical imaging by simultaneously illuminating and detecting multiple points on a sample |
| US8921102B2 (en) | 2005-07-29 | 2014-12-30 | Gpb Scientific, Llc | Devices and methods for enrichment and alteration of circulating tumor cells and other particles |
| US8937724B2 (en) | 2008-12-10 | 2015-01-20 | The General Hospital Corporation | Systems and methods for extending imaging depth range of optical coherence tomography through optical sub-sampling |
| US8965487B2 (en) | 2004-08-24 | 2015-02-24 | The General Hospital Corporation | Process, system and software arrangement for measuring a mechanical strain and elastic properties of a sample |
| USRE45512E1 (en) | 2004-09-29 | 2015-05-12 | The General Hospital Corporation | System and method for optical coherence imaging |
| US9060689B2 (en) | 2005-06-01 | 2015-06-23 | The General Hospital Corporation | Apparatus, method and system for performing phase-resolved optical frequency domain imaging |
| US9069130B2 (en) | 2010-05-03 | 2015-06-30 | The General Hospital Corporation | Apparatus, method and system for generating optical radiation from biological gain media |
| US9087368B2 (en) | 2006-01-19 | 2015-07-21 | The General Hospital Corporation | Methods and systems for optical imaging or epithelial luminal organs by beam scanning thereof |
| US9176319B2 (en) | 2007-03-23 | 2015-11-03 | The General Hospital Corporation | Methods, arrangements and apparatus for utilizing a wavelength-swept laser using angular scanning and dispersion procedures |
| US9178330B2 (en) | 2009-02-04 | 2015-11-03 | The General Hospital Corporation | Apparatus and method for utilization of a high-speed optical wavelength tuning source |
| US9186067B2 (en) | 2006-02-01 | 2015-11-17 | The General Hospital Corporation | Apparatus for applying a plurality of electro-magnetic radiations to a sample |
| US9240043B2 (en) | 2008-09-16 | 2016-01-19 | Novartis Ag | Reproducible quantification of biomarker expression |
| US9250229B2 (en) | 2011-09-25 | 2016-02-02 | Theranos, Inc. | Systems and methods for multi-analysis |
| US9268915B2 (en) | 2011-09-25 | 2016-02-23 | Theranos, Inc. | Systems and methods for diagnosis or treatment |
| US9282931B2 (en) | 2000-10-30 | 2016-03-15 | The General Hospital Corporation | Methods for tissue analysis |
| US9295391B1 (en) | 2000-11-10 | 2016-03-29 | The General Hospital Corporation | Spectrally encoded miniature endoscopic imaging probe |
| US9330092B2 (en) | 2011-07-19 | 2016-05-03 | The General Hospital Corporation | Systems, methods, apparatus and computer-accessible-medium for providing polarization-mode dispersion compensation in optical coherence tomography |
| US9341783B2 (en) | 2011-10-18 | 2016-05-17 | The General Hospital Corporation | Apparatus and methods for producing and/or providing recirculating optical delay(s) |
| US9375158B2 (en) | 2007-07-31 | 2016-06-28 | The General Hospital Corporation | Systems and methods for providing beam scan patterns for high speed doppler optical frequency domain imaging |
| US9415550B2 (en) | 2012-08-22 | 2016-08-16 | The General Hospital Corporation | System, method, and computer-accessible medium for fabrication miniature endoscope using soft lithography |
| US9441948B2 (en) | 2005-08-09 | 2016-09-13 | The General Hospital Corporation | Apparatus, methods and storage medium for performing polarization-based quadrature demodulation in optical coherence tomography |
| US9464981B2 (en) | 2011-01-21 | 2016-10-11 | Theranos, Inc. | Systems and methods for sample use maximization |
| US9510758B2 (en) | 2010-10-27 | 2016-12-06 | The General Hospital Corporation | Apparatus, systems and methods for measuring blood pressure within at least one vessel |
| US9557154B2 (en) | 2010-05-25 | 2017-01-31 | The General Hospital Corporation | Systems, devices, methods, apparatus and computer-accessible media for providing optical imaging of structures and compositions |
| US9619627B2 (en) | 2011-09-25 | 2017-04-11 | Theranos, Inc. | Systems and methods for collecting and transmitting assay results |
| US9615748B2 (en) | 2009-01-20 | 2017-04-11 | The General Hospital Corporation | Endoscopic biopsy apparatus, system and method |
| US9629528B2 (en) | 2012-03-30 | 2017-04-25 | The General Hospital Corporation | Imaging system, method and distal attachment for multidirectional field of view endoscopy |
| US9632102B2 (en) | 2011-09-25 | 2017-04-25 | Theranos, Inc. | Systems and methods for multi-purpose analysis |
| US9645143B2 (en) | 2011-09-25 | 2017-05-09 | Theranos, Inc. | Systems and methods for multi-analysis |
| US9664702B2 (en) | 2011-09-25 | 2017-05-30 | Theranos, Inc. | Fluid handling apparatus and configurations |
| US9733460B2 (en) | 2014-01-08 | 2017-08-15 | The General Hospital Corporation | Method and apparatus for microscopic imaging |
| US9777053B2 (en) | 2006-02-08 | 2017-10-03 | The General Hospital Corporation | Methods, arrangements and systems for obtaining information associated with an anatomical sample using optical microscopy |
| US9784681B2 (en) | 2013-05-13 | 2017-10-10 | The General Hospital Corporation | System and method for efficient detection of the phase and amplitude of a periodic modulation associated with self-interfering fluorescence |
| US9795301B2 (en) | 2010-05-25 | 2017-10-24 | The General Hospital Corporation | Apparatus, systems, methods and computer-accessible medium for spectral analysis of optical coherence tomography images |
| US9968261B2 (en) | 2013-01-28 | 2018-05-15 | The General Hospital Corporation | Apparatus and method for providing diffuse spectroscopy co-registered with optical frequency domain imaging |
| US10012664B2 (en) | 2011-09-25 | 2018-07-03 | Theranos Ip Company, Llc | Systems and methods for fluid and component handling |
| US10058250B2 (en) | 2013-07-26 | 2018-08-28 | The General Hospital Corporation | System, apparatus and method for utilizing optical dispersion for fourier-domain optical coherence tomography |
| US10117576B2 (en) | 2013-07-19 | 2018-11-06 | The General Hospital Corporation | System, method and computer accessible medium for determining eye motion by imaging retina and providing feedback for acquisition of signals from the retina |
| WO2019032723A1 (en)* | 2017-08-09 | 2019-02-14 | Allen Institute | Systems, devices, and methods for image processing to generate an image having predictive tagging |
| US10228556B2 (en) | 2014-04-04 | 2019-03-12 | The General Hospital Corporation | Apparatus and method for controlling propagation and/or transmission of electromagnetic radiation in flexible waveguide(s) |
| US10241028B2 (en) | 2011-08-25 | 2019-03-26 | The General Hospital Corporation | Methods, systems, arrangements and computer-accessible medium for providing micro-optical coherence tomography procedures |
| US10285568B2 (en) | 2010-06-03 | 2019-05-14 | The General Hospital Corporation | Apparatus and method for devices for imaging structures in or at one or more luminal organs |
| US10324041B2 (en) | 2016-12-21 | 2019-06-18 | Abbott Japan Co., Ltd. | Optical imaging system using lateral illumination for digital assays |
| US10426548B2 (en) | 2006-02-01 | 2019-10-01 | The General Hosppital Corporation | Methods and systems for providing electromagnetic radiation to at least one portion of a sample using conformal laser therapy procedures |
| US10478072B2 (en) | 2013-03-15 | 2019-11-19 | The General Hospital Corporation | Methods and system for characterizing an object |
| US10534129B2 (en) | 2007-03-30 | 2020-01-14 | The General Hospital Corporation | System and method providing intracoronary laser speckle imaging for the detection of vulnerable plaque |
| US10591391B2 (en) | 2006-06-14 | 2020-03-17 | Verinata Health, Inc. | Diagnosis of fetal abnormalities using polymorphisms including short tandem repeats |
| US10704090B2 (en) | 2006-06-14 | 2020-07-07 | Verinata Health, Inc. | Fetal aneuploidy detection by sequencing |
| US10736494B2 (en) | 2014-01-31 | 2020-08-11 | The General Hospital Corporation | System and method for facilitating manual and/or automatic volumetric imaging with real-time tension or force feedback using a tethered imaging device |
| US10835110B2 (en) | 2008-07-14 | 2020-11-17 | The General Hospital Corporation | Apparatus and method for facilitating at least partial overlap of dispersed ration on at least one sample |
| US10893806B2 (en) | 2013-01-29 | 2021-01-19 | The General Hospital Corporation | Apparatus, systems and methods for providing information regarding the aortic valve |
| US10912462B2 (en) | 2014-07-25 | 2021-02-09 | The General Hospital Corporation | Apparatus, devices and methods for in vivo imaging and diagnosis |
| US11047854B2 (en) | 2017-02-06 | 2021-06-29 | Abbott Japan Llc | Methods for reducing noise in signal-generating digital assays |
| US11162936B2 (en) | 2011-09-13 | 2021-11-02 | Labrador Diagnostics Llc | Systems and methods for multi-analysis |
| US11179028B2 (en) | 2013-02-01 | 2021-11-23 | The General Hospital Corporation | Objective lens arrangement for confocal endomicroscopy |
| US11452433B2 (en) | 2013-07-19 | 2022-09-27 | The General Hospital Corporation | Imaging apparatus and method which utilizes multidirectional field of view endoscopy |
| US11490797B2 (en) | 2012-05-21 | 2022-11-08 | The General Hospital Corporation | Apparatus, device and method for capsule microscopy |
| US11490826B2 (en) | 2009-07-14 | 2022-11-08 | The General Hospital Corporation | Apparatus, systems and methods for measuring flow and pressure within a vessel |
Families Citing this family (97)
| Publication number | Priority date | Publication date | Assignee | Title |
|---|---|---|---|---|
| US20090111101A1 (en)* | 1998-05-09 | 2009-04-30 | Ikonisys, Inc. | Automated Cancer Diagnostic Methods Using FISH |
| US20030165263A1 (en)* | 2002-02-19 | 2003-09-04 | Hamer Michael J. | Histological assessment |
| GB2394543A (en)* | 2002-10-25 | 2004-04-28 | Univ Bristol | Positional measurement of a feature within an image |
| US20050089208A1 (en)* | 2003-07-22 | 2005-04-28 | Rui-Tao Dong | System and method for generating digital images of a microscope slide |
| US8068988B2 (en) | 2003-09-08 | 2011-11-29 | Ventana Medical Systems, Inc. | Method for automated processing of digital images of tissue micro-arrays (TMA) |
| US20050136509A1 (en)* | 2003-09-10 | 2005-06-23 | Bioimagene, Inc. | Method and system for quantitatively analyzing biological samples |
| US7991242B2 (en) | 2005-05-11 | 2011-08-02 | Optosecurity Inc. | Apparatus, method and system for screening receptacles and persons, having image distortion correction functionality |
| EP1886257A1 (en) | 2005-05-11 | 2008-02-13 | Optosecurity Inc. | Method and system for screening luggage items, cargo containers or persons |
| JP4917330B2 (en)* | 2006-03-01 | 2012-04-18 | 浜松ホトニクス株式会社 | Image acquisition apparatus, image acquisition method, and image acquisition program |
| JP4917329B2 (en)* | 2006-03-01 | 2012-04-18 | 浜松ホトニクス株式会社 | Image acquisition apparatus, image acquisition method, and image acquisition program |
| US7899232B2 (en) | 2006-05-11 | 2011-03-01 | Optosecurity Inc. | Method and apparatus for providing threat image projection (TIP) in a luggage screening system, and luggage screening system implementing same |
| JP4890096B2 (en)* | 2006-05-19 | 2012-03-07 | 浜松ホトニクス株式会社 | Image acquisition apparatus, image acquisition method, and image acquisition program |
| HUP0600435A2 (en)* | 2006-05-26 | 2007-11-28 | 3Dhistech Kft | Method and system for digitizing a specimen having fluorescent target points |
| EP2034349B2 (en) | 2006-06-08 | 2023-07-19 | Nikon Corporation | Observing apparatus and observing method |
| WO2007147018A1 (en)* | 2006-06-14 | 2007-12-21 | Cellpoint Diagnostics, Inc. | Analysis of rare cell-enriched samples |
| US8494210B2 (en) | 2007-03-30 | 2013-07-23 | Optosecurity Inc. | User interface for use in security screening providing image enhancement capabilities and apparatus for implementing same |
| US20080166036A1 (en)* | 2007-01-05 | 2008-07-10 | Carl Zeiss Microimaging Ais, Inc. | System and method for analyzing tissue slides for observable pathologies |
| JP4969273B2 (en)* | 2007-03-09 | 2012-07-04 | オリンパス株式会社 | Fluorescence observation equipment |
| JP2008224312A (en)* | 2007-03-09 | 2008-09-25 | Olympus Corp | Fluorescence observation device |
| WO2008137912A1 (en)* | 2007-05-07 | 2008-11-13 | Ge Healthcare Bio-Sciences Corp. | System and method for the automated analysis of cellular assays and tissues |
| US7936913B2 (en)* | 2007-08-07 | 2011-05-03 | Nextslide Imaging Llc | Network image review in clinical hematology |
| US8326014B2 (en)* | 2007-09-28 | 2012-12-04 | Cytyc Corporation | Methods and systems for processing biological specimens utilizing multiple wavelengths |
| US8369600B2 (en)* | 2008-03-25 | 2013-02-05 | General Electric Company | Method and apparatus for detecting irregularities in tissue microarrays |
| US8883491B2 (en)* | 2008-04-09 | 2014-11-11 | Nexcelom Bioscience Llc | Systems and methods for counting cells and biomolecules |
| US20090278852A1 (en)* | 2008-05-09 | 2009-11-12 | Production Resource Group L.L.C | Control of 3D objects in a light displaying device |
| US8781219B2 (en)* | 2008-10-12 | 2014-07-15 | Fei Company | High accuracy beam placement for local area navigation |
| JP5643210B2 (en)* | 2008-10-24 | 2014-12-17 | アペリオ・テクノロジーズ・インコーポレイテッドAperio Technologies, Inc. | Whole slide fluorescent scanner |
| DK200801722A (en)* | 2008-12-05 | 2010-06-06 | Unisensor As | Optical sectioning of a sample and detection of particles in a sample |
| HUP0900142A2 (en)* | 2009-03-06 | 2010-10-28 | 3Dhistech Kft | Method and arrangement for dark-field and bright-field digitalization of sample with or without visible dyestuft in transmitted light |
| DE102009013353B3 (en)* | 2009-03-16 | 2010-10-07 | Siemens Aktiengesellschaft | Method for determining armor for constant tables of placement machines |
| JP5387328B2 (en)* | 2009-08-31 | 2014-01-15 | ソニー株式会社 | Fluorescence image acquisition apparatus, fluorescence image acquisition method, and fluorescence image acquisition program |
| US20110103663A1 (en)* | 2009-11-03 | 2011-05-05 | Mckesson Financial Holdings Limited | Apparatus, method and computer-readable storage mediums for detecting a region of interest in a medical image |
| US20110257990A1 (en)* | 2009-12-09 | 2011-10-20 | Bryan Dangott | Internet based interface for automatic differential counting and medical reporting |
| EP2524221B1 (en)* | 2010-01-12 | 2022-03-30 | Nexcelom Bioscience LLC | Systems for counting cells and biomolecules |
| US20110312503A1 (en) | 2010-01-23 | 2011-12-22 | Artemis Health, Inc. | Methods of fetal abnormality detection |
| EP2360506B1 (en)* | 2010-02-15 | 2017-05-10 | Carl Zeiss Microscopy GmbH | Device which can be embedded in an optical system and method |
| WO2012149480A2 (en)* | 2011-04-29 | 2012-11-01 | University Of Southern California | Systems and methods for in vitro and in vivo imaging of cells on a substrate |
| US8808687B2 (en) | 2010-07-12 | 2014-08-19 | Mark Humayun | Biocompatible substrate for facilitating interconnections between stem cells and target tissues and methods for implanting same |
| JP5734588B2 (en)* | 2010-07-15 | 2015-06-17 | オリンパス株式会社 | Cell observation apparatus and observation method |
| WO2012037058A1 (en)* | 2010-09-14 | 2012-03-22 | Albert Einstein College Of Medicine Of Yeshiva University | Methods and apparatus for imaging molecules in living systems |
| US9075790B2 (en)* | 2010-10-21 | 2015-07-07 | Nexcelom Bioscience Llc | Internal focus reference beads for imaging cytometry |
| US20120157160A1 (en)* | 2010-12-21 | 2012-06-21 | The Regents Of The University Of California | Compact wide-field fluorescent imaging on a mobile device |
| US9522396B2 (en) | 2010-12-29 | 2016-12-20 | S.D. Sight Diagnostics Ltd. | Apparatus and method for automatic detection of pathogens |
| WO2012149468A2 (en) | 2011-04-29 | 2012-11-01 | University Of Southern California | Instruments and methods for the implantation of cell-seeded substrates |
| US8877489B2 (en) | 2011-12-05 | 2014-11-04 | California Institute Of Technology | Ultrathin parylene-C semipermeable membranes for biomedical applications |
| JP2013011856A (en)* | 2011-06-01 | 2013-01-17 | Canon Inc | Imaging system and control method thereof |
| KR101973221B1 (en) | 2011-09-07 | 2019-04-26 | 라피스캔 시스템스, 인코포레이티드 | X-ray inspection system that integrates manifest data with imaging/detection processing |
| EP2761585B1 (en)* | 2011-09-30 | 2019-08-07 | Life Technologies Corporation | Method for streamlining optical calibration |
| US9248013B2 (en) | 2011-12-05 | 2016-02-02 | California Institute Of Technology | 3-Dimensional parylene scaffold cage |
| FR2984531B1 (en)* | 2011-12-20 | 2013-12-27 | Ecole Polytech | QUANTITATIVE NON-LINEAR OPTICAL MICROSCOPY USING SHAPED BEAM |
| BR112014016072B1 (en) | 2011-12-29 | 2021-01-12 | Sight Diagnostics Ltd. | method and system for detecting a plasmodium infection in a blood sample |
| SG193046A1 (en)* | 2012-02-23 | 2013-09-30 | Histoindex Pte Ltd | A digital imaging system for biopsy inspection |
| US9970847B2 (en)* | 2012-03-30 | 2018-05-15 | Konica Minolta, Inc. | Method for staining tissue |
| WO2013146841A1 (en)* | 2012-03-30 | 2013-10-03 | コニカミノルタ株式会社 | Medical image processor and program |
| JP5804194B2 (en)* | 2012-03-30 | 2015-11-04 | コニカミノルタ株式会社 | Medical image processing apparatus and program |
| EP2857884B1 (en)* | 2012-05-28 | 2021-05-05 | Sony Corporation | Information processing device, information processing method, program and microscope system |
| GB201210403D0 (en)* | 2012-06-13 | 2012-07-25 | Ffei Ltd | Mircoscope colour chart |
| DE102012216336B4 (en)* | 2012-09-13 | 2018-12-13 | Leica Biosystems Nussloch Gmbh | Method of staining a histological sample and stainer |
| JP5900644B2 (en)* | 2012-11-15 | 2016-04-06 | 株式会社島津製作所 | Analysis area setting device |
| US9396532B2 (en)* | 2012-11-15 | 2016-07-19 | Siemens Healthcare Diagnostics, Inc. | Cell feature-based automatic circulating tumor cell detection |
| EP2972227B1 (en)* | 2013-03-12 | 2020-05-06 | Ventana Medical Systems, Inc. | Digitally enhanced microscopy for multiplexed histology |
| EP2999988A4 (en) | 2013-05-23 | 2017-01-11 | S.D. Sight Diagnostics Ltd. | Method and system for imaging a cell sample |
| IL227276A0 (en) | 2013-07-01 | 2014-03-06 | Parasight Ltd | A method and system for preparing a monolayer of cells, particularly suitable for diagnosis |
| US10831013B2 (en) | 2013-08-26 | 2020-11-10 | S.D. Sight Diagnostics Ltd. | Digital microscopy systems, methods and computer program products |
| AU2014333927A1 (en)* | 2013-10-07 | 2016-03-03 | Ventana Medical Systems, Inc. | Systems and methods for comprehensive multi-assay tissue analysis |
| EP3124956B1 (en)* | 2014-03-27 | 2018-12-26 | Konica Minolta, Inc. | Image processing device and image processing program |
| EP3186778B1 (en) | 2014-08-27 | 2023-01-11 | S.D. Sight Diagnostics Ltd. | System and method for calculating focus variation for a digital microscope |
| JP6480713B2 (en)* | 2014-11-18 | 2019-03-13 | オリンパス株式会社 | Microscope system |
| JP6759550B2 (en)* | 2015-03-04 | 2020-09-23 | ソニー株式会社 | Information processing equipment, programs, information processing methods and observation systems |
| JP6437103B2 (en)* | 2015-04-23 | 2018-12-12 | 株式会社日立ハイテクノロジーズ | Sensitivity measuring device and inspection device |
| JP6547424B2 (en)* | 2015-06-01 | 2019-07-24 | コニカミノルタ株式会社 | Fluorescent image focusing system, focusing method and focusing program |
| CN108140104B (en)* | 2015-09-16 | 2022-11-01 | 徕卡生物系统公司 | Automated stain finding in pathology brightfield images |
| EP3350644B1 (en) | 2015-09-17 | 2021-04-28 | S.D. Sight Diagnostics Ltd. | Methods and apparatus for detecting an entity in a bodily sample |
| CN106897965B (en)* | 2015-12-14 | 2020-04-28 | 国基电子(上海)有限公司 | Color image processing system and color image processing method |
| EP3407063A1 (en)* | 2016-01-19 | 2018-11-28 | Konica Minolta, Inc. | Image processing device and program |
| CN108738339B (en)* | 2016-01-28 | 2022-02-01 | 西门子医疗保健诊断公司 | Method and apparatus for classifying artifacts in a sample |
| JP2017142118A (en)* | 2016-02-09 | 2017-08-17 | 株式会社イシダ | Optical inspection device |
| CN116309260A (en) | 2016-02-22 | 2023-06-23 | 拉皮斯坎系统股份有限公司 | Method for evaluating average pallet size and density of goods |
| CA3018536A1 (en) | 2016-03-30 | 2017-10-05 | S.D. Sight Diagnostics Ltd | Distinguishing between blood sample components |
| JP6942148B2 (en) | 2016-05-11 | 2021-09-29 | エス.ディー.サイト ダイアグノスティクス リミテッド | Performing optical measurements on the sample |
| EP4177593A1 (en) | 2016-05-11 | 2023-05-10 | S.D. Sight Diagnostics Ltd. | Sample carrier for optical measurements |
| EP3252512A1 (en)* | 2016-06-03 | 2017-12-06 | Leica Instruments (Singapore) Pte. Ltd. | Interchangeable optical module and microscopic apparatus |
| WO2018099918A1 (en)* | 2016-11-29 | 2018-06-07 | Koninklijke Philips N.V. | Slide holding in digital pathology |
| TWI659227B (en) | 2017-06-20 | 2019-05-11 | Academia Sinica | Microscope system and method for image guided microscopic illumination |
| AU2018369859B2 (en) | 2017-11-14 | 2024-01-25 | S.D. Sight Diagnostics Ltd | Sample carrier for optical measurements |
| CN108896363A (en)* | 2018-05-28 | 2018-11-27 | 杭州智微信息科技有限公司 | A kind of digitized flow and method of bone marrow smear |
| WO2019243897A2 (en)* | 2018-06-19 | 2019-12-26 | Metasystems Hard And Software Gmbh | System and method for detection and classification of objects of interest in microscope images by supervised machine learning |
| CN111812834A (en)* | 2019-07-23 | 2020-10-23 | 南京九川科学技术有限公司 | Microscopic imaging device and microscopic imaging method for liquid-based cell sample |
| CN111175298B (en)* | 2019-11-22 | 2022-05-31 | 浙江农林大学 | A kind of sweet solution detection device and method |
| WO2021116959A1 (en) | 2019-12-12 | 2021-06-17 | S.D. Sight Diagnostics Ltd | Analyzing an analyte disposed within a medium |
| EP4073566B1 (en) | 2019-12-12 | 2025-04-23 | S.D. Sight Diagnostics Ltd. | Artificial generation of color blood smear image |
| JP2021126153A (en)* | 2020-02-10 | 2021-09-02 | ソニー・オリンパスメディカルソリューションズ株式会社 | Medical image processing device and medical observation system |
| CN111429761B (en)* | 2020-02-28 | 2022-10-21 | 中国人民解放军陆军军医大学第二附属医院 | A kind of artificial intelligence simulation teaching system and method of bone marrow cell morphology |
| CN111696625A (en)* | 2020-04-21 | 2020-09-22 | 天津金域医学检验实验室有限公司 | FISH room fluorescence counting system |
| JPWO2022059312A1 (en)* | 2020-09-17 | 2022-03-24 | ||
| WO2022149342A1 (en)* | 2021-01-06 | 2022-07-14 | パナソニックホールディングス株式会社 | Excrement determination method, excrement determination device, and excrement determination program |
| JP7503019B2 (en)* | 2021-03-31 | 2024-06-19 | Hoya株式会社 | Processor for electronic endoscope and electronic endoscope system |
Citations (135)
| Publication number | Priority date | Publication date | Assignee | Title |
|---|---|---|---|---|
| US3824393A (en) | 1971-08-25 | 1974-07-16 | American Express Invest | System for differential particle counting |
| US3851972A (en) | 1973-10-18 | 1974-12-03 | Coulter Electronics | Automatic method and system for analysis and review of a plurality of stored slides |
| US4011004A (en) | 1975-02-06 | 1977-03-08 | Geometric Data Corporation | Pivotable stage for microscope system |
| US4125828A (en) | 1972-08-04 | 1978-11-14 | Med-El Inc. | Method and apparatus for automated classification and analysis of cells |
| US4196265A (en) | 1977-06-15 | 1980-04-01 | The Wistar Institute | Method of producing antibodies |
| US4210419A (en) | 1978-02-17 | 1980-07-01 | California Institute Of Technology | Automated quantitative muscle biopsy analysis system |
| US4249825A (en) | 1979-05-14 | 1981-02-10 | The Trustees Of Boston University | Method and apparatus suitable for ocular blood flow analysis |
| US4338024A (en) | 1980-05-02 | 1982-07-06 | International Remote Imaging Systems, Inc. | Flow analyzer and system for analysis of fluids with particles |
| US4393466A (en) | 1980-09-12 | 1983-07-12 | International Remote Imaging Systems | Method of analyzing particles in a dilute fluid sample |
| US4513438A (en) | 1982-04-15 | 1985-04-23 | Coulter Electronics, Inc. | Automated microscopy system and method for locating and re-locating objects in an image |
| DE3340647A1 (en) | 1983-11-10 | 1985-05-23 | Will Wetzlar Gmbh, 6330 Wetzlar | Method for focusing a microscope and microscope for carrying out the method |
| US4612614A (en) | 1980-09-12 | 1986-09-16 | International Remote Imaging Systems, Inc. | Method of analyzing particles in a fluid sample |
| EP0213666A1 (en) | 1985-08-21 | 1987-03-11 | North American Philips Corporation | Method and apparatus for displaying a single parameter image |
| US4656594A (en) | 1985-05-06 | 1987-04-07 | National Biomedical Research Foundation | Operator-interactive automated chromosome analysis system producing a karyotype |
| US4673973A (en) | 1985-02-04 | 1987-06-16 | National Biomedical Research Foundation | Split-image, multi-power microscopic image display system and method |
| US4700298A (en) | 1984-09-14 | 1987-10-13 | Branko Palcic | Dynamic microscope image processing scanner |
| US4741043A (en) | 1985-11-04 | 1988-04-26 | Cell Analysis Systems, Inc. | Method of and an apparatus for image analyses of biological specimens |
| DE3735091A1 (en) | 1986-10-16 | 1988-04-28 | Olympus Optical Co | AUTOMATIC FOCUSING PROCESS |
| US4945220A (en) | 1988-11-16 | 1990-07-31 | Prometrix Corporation | Autofocusing system for microscope having contrast detection means |
| US4965725A (en) | 1988-04-08 | 1990-10-23 | Nueromedical Systems, Inc. | Neural network based automated cytological specimen classification system and method |
| US4991223A (en) | 1988-06-30 | 1991-02-05 | American Innovision, Inc. | Apparatus and method for recognizing image features using color elements |
| US5003165A (en) | 1989-05-25 | 1991-03-26 | International Remote Imaging Systems, Inc. | Method and an apparatus for selecting the best focal position from a plurality of focal positions |
| US5008185A (en) | 1985-11-04 | 1991-04-16 | Cell Analysis Systems, Inc. | Methods and apparatus for the quantitation of nuclear proteins |
| US5016173A (en) | 1989-04-13 | 1991-05-14 | Vanguard Imaging Ltd. | Apparatus and method for monitoring visually accessible surfaces of the body |
| US5068909A (en) | 1989-05-18 | 1991-11-26 | Applied Imaging Corporation | Method and apparatus for generating quantifiable video displays |
| US5085325A (en) | 1988-03-08 | 1992-02-04 | Simco/Ramic Corporation | Color sorting system and method |
| US5087965A (en) | 1989-06-28 | 1992-02-11 | American Innovision, Inc. | Recognition of image colors using arbitrary shapes in color space |
| US5123055A (en) | 1989-08-10 | 1992-06-16 | International Remote Imaging Systems, Inc. | Method and an apparatus for differentiating a sample of biological cells |
| WO1992017848A1 (en) | 1991-04-01 | 1992-10-15 | THE UNITED STATES GOVERNMENT, as represented by THE SECRETARY, DEPARTMENT OF HEALTH AND HUMAN SERVICES | Automated method and apparatus for determining characteristics of nerve fibers |
| US5162990A (en)* | 1990-06-15 | 1992-11-10 | The United States Of America As Represented By The United States Navy | System and method for quantifying macrophage phagocytosis by computer image analysis |
| US5202931A (en) | 1987-10-06 | 1993-04-13 | Cell Analysis Systems, Inc. | Methods and apparatus for the quantitation of nuclear protein |
| US5233684A (en) | 1990-06-26 | 1993-08-03 | Digital Equipment Corporation | Method and apparatus for mapping a digital color image from a first color space to a second color space |
| EP0557871A2 (en) | 1992-02-18 | 1993-09-01 | Cell Analysis Systems, Inc. | Method and apparatus for automated assay of biological specimens |
| US5254845A (en) | 1992-08-18 | 1993-10-19 | Applied Imaging International Limited | Automatic focusing system using focal length-changing element |
| US5257182A (en) | 1991-01-29 | 1993-10-26 | Neuromedical Systems, Inc. | Morphological classification system and method |
| US5268966A (en) | 1989-08-10 | 1993-12-07 | International Remote Imaging Systems, Inc. | Method of differentiating particles based upon a dynamically changing threshold |
| US5317140A (en) | 1992-11-24 | 1994-05-31 | Dunthorn David I | Diffusion-assisted position location particularly for visual pen detection |
| US5321545A (en) | 1988-10-21 | 1994-06-14 | Biocom S.A. | Microscope stage for rapid and indexed analysis of filters and other media carrying multiple samples, and a method of analyzing such samples using said stage |
| US5333207A (en) | 1990-11-07 | 1994-07-26 | Neuromedical Systems, Inc. | Inspection apparatus and method with inspection auditing for images presented on a display |
| US5338924A (en) | 1992-08-11 | 1994-08-16 | Lasa Industries, Inc. | Apparatus and method for automatic focusing of light using a fringe plate |
| US5352613A (en) | 1993-10-07 | 1994-10-04 | Tafas Triantafillos P | Cytological screening method |
| US5375177A (en) | 1991-09-27 | 1994-12-20 | E. I. Du Pont De Nemours And Company | Method of identifying and characterizing a valid object by color |
| US5409007A (en) | 1993-11-26 | 1995-04-25 | General Electric Company | Filter to reduce speckle artifact in ultrasound imaging |
| US5432871A (en) | 1993-08-04 | 1995-07-11 | Universal Systems & Technology, Inc. | Systems and methods for interactive image data acquisition and compression |
| US5449622A (en) | 1993-02-16 | 1995-09-12 | Yabe; Ryohei | Method and apparatus for analyzing stained particles |
| US5459384A (en) | 1992-04-30 | 1995-10-17 | Becton Dickinson And Company | Method and apparatus for controlling coordinate displacements of a platform |
| US5463470A (en) | 1991-10-09 | 1995-10-31 | Fuji Photo Film Co., Ltd. | Methods of collecting photometric image data and determining light exposure by extracting feature image data from an original image |
| US5469353A (en) | 1993-11-26 | 1995-11-21 | Access Radiology Corp. | Radiological image interpretation apparatus and method |
| US5473706A (en) | 1991-09-23 | 1995-12-05 | Becton Dickinson And Company | Method and apparatus for automated assay of biological specimens |
| US5481401A (en) | 1991-05-16 | 1996-01-02 | Olympus Optical Co., Ltd. | Ultraviolet microscope |
| US5499097A (en) | 1994-09-19 | 1996-03-12 | Neopath, Inc. | Method and apparatus for checking automated optical system performance repeatability |
| US5515172A (en) | 1993-07-19 | 1996-05-07 | Xerox Corporation | Apparatus and method for enhanced color to color conversion |
| EP0713086A1 (en) | 1994-11-17 | 1996-05-22 | Chemunex | Apparatus and process for the detection and counting of rarely occurring mammalian cells |
| US5526258A (en) | 1990-10-10 | 1996-06-11 | Cell Analysis System, Inc. | Method and apparatus for automated analysis of biological specimens |
| US5533628A (en) | 1992-03-06 | 1996-07-09 | Agri Tech Incorporated | Method and apparatus for sorting objects by color including stable color transformation |
| US5583666A (en) | 1993-02-12 | 1996-12-10 | Eastman Kodak Company | Method for cross-device color calibration and enhancement using explicit constraints |
| US5586160A (en) | 1995-03-20 | 1996-12-17 | The Regents Of The University Of California | Automated analysis for microcalcifications in high resolution digital mammograms |
| US5585469A (en) | 1993-10-08 | 1996-12-17 | Hitachi, Ltd. | Dyeing agent having at least two dyes for staining a biological sample and staining method employing the dyeing agent |
| US5602941A (en) | 1993-05-21 | 1997-02-11 | Digital Equipment Corporation | Input modification system for multilevel dithering |
| US5602937A (en) | 1994-06-01 | 1997-02-11 | Cognex Corporation | Methods and apparatus for machine vision high accuracy searching |
| US5619032A (en) | 1995-01-18 | 1997-04-08 | International Remote Imaging Systems, Inc. | Method and apparatus for automatically selecting the best focal position from a plurality of focal positions for a focusing apparatus |
| US5625709A (en) | 1994-12-23 | 1997-04-29 | International Remote Imaging Systems, Inc. | Method and apparatus for identifying characteristics of an object in a field of view |
| US5625705A (en) | 1994-06-03 | 1997-04-29 | Neuromedical Systems, Inc. | Intensity texture based classification system and method |
| US5635402A (en) | 1992-03-05 | 1997-06-03 | Alfano; Robert R. | Technique for determining whether a cell is malignant as opposed to non-malignant using extrinsic fluorescence spectroscopy |
| WO1997020198A2 (en) | 1995-11-30 | 1997-06-05 | Chromavision Medical Systems, Inc. | Method and apparatus for automated image analysis of biological specimens |
| US5647025A (en) | 1994-09-20 | 1997-07-08 | Neopath, Inc. | Automatic focusing of biomedical specimens apparatus |
| US5646677A (en) | 1995-02-23 | 1997-07-08 | Motorola, Inc. | Method and apparatus for interactively viewing wide-angle images from terrestrial, space, and underwater viewpoints |
| US5671288A (en) | 1995-05-31 | 1997-09-23 | Neopath, Inc. | Method and apparatus for assessing slide and specimen preparation quality |
| US5691779A (en) | 1994-04-14 | 1997-11-25 | Matsushita Electric Industrial Co., Ltd. | Color conversion apparatus that restricts the color reproduction range of primary color signals |
| US5690892A (en) | 1995-09-15 | 1997-11-25 | Accumed, Inc. | Cassette for use with automated specimen handling system |
| US5701172A (en) | 1995-06-07 | 1997-12-23 | Gas Research Institute | Optical flowmeter |
| US5706093A (en) | 1995-12-05 | 1998-01-06 | Olympus Optical Co., Ltd. | Color classification apparatus |
| US5726009A (en) | 1989-03-20 | 1998-03-10 | Anticancer, Inc. | Native-state method and system for determining viability and proliferative capacity of tissues in vitro |
| US5732150A (en) | 1995-09-19 | 1998-03-24 | Ihc Health Services, Inc. | Method and system for multiple wavelength microscopy image analysis |
| US5735387A (en) | 1995-07-14 | 1998-04-07 | Chiron Diagnostics Corporation | Specimen rack handling system |
| US5740270A (en) | 1988-04-08 | 1998-04-14 | Neuromedical Systems, Inc. | Automated cytological specimen classification system and method |
| US5740267A (en) | 1992-05-29 | 1998-04-14 | Echerer; Scott J. | Radiographic image enhancement comparison and storage requirement reduction system |
| US5773459A (en) | 1995-06-07 | 1998-06-30 | Sugen, Inc. | Urea- and thiourea-type compounds |
| US5783814A (en) | 1994-01-18 | 1998-07-21 | Ultrapointe Corporation | Method and apparatus for automatically focusing a microscope |
| US5795723A (en) | 1994-05-06 | 1998-08-18 | Fred Hutchinson Cancer Research Center | Expression of neurogenic bHLH genes in primitive neuroectodermal tumors |
| US5846749A (en) | 1994-10-12 | 1998-12-08 | The Regents Of The University Of California | Quantitative measurement of tissue protein identified by immunohistochemistry and standardized protein determination |
| US5854851A (en) | 1993-08-13 | 1998-12-29 | Sophis View Technologies Ltd. | System and method for diagnosis of living tissue diseases using digital image processing |
| US5867598A (en) | 1996-09-26 | 1999-02-02 | Xerox Corporation | Method and apparatus for processing of a JPEG compressed image |
| US5877161A (en) | 1993-08-05 | 1999-03-02 | University Technologies International Inc. | Cyclin D1 negative regulatory activity |
| US5880473A (en) | 1997-07-28 | 1999-03-09 | Applied Imaging, Inc. | Multifluor-fluorescence in-situ hybridization (M-FISH) imaging techniques using multiple multiband filters with image registration |
| US5888742A (en) | 1997-10-28 | 1999-03-30 | Incyte Pharmaceuticals, Inc. | Human phospholipid binding proteins |
| US5889881A (en) | 1992-10-14 | 1999-03-30 | Oncometrics Imaging Corp. | Method and apparatus for automatically detecting malignancy-associated changes |
| US5911003A (en) | 1996-04-26 | 1999-06-08 | Pressco Technology Inc. | Color pattern evaluation system for randomly oriented articles |
| US5911327A (en) | 1996-10-02 | 1999-06-15 | Nippon Steel Corporation | Method of automatically discriminating and separating scraps containing copper from iron scraps |
| US5966465A (en) | 1994-09-21 | 1999-10-12 | Ricoh Corporation | Compression/decompression using reversible embedded wavelets |
| US5966309A (en) | 1995-02-16 | 1999-10-12 | Smithkline Beecham Corporation | Clinically testing biological samples |
| US5989835A (en) | 1997-02-27 | 1999-11-23 | Cellomics, Inc. | System for cell-based screening |
| US6006191A (en) | 1996-05-13 | 1999-12-21 | Dirienzo; Andrew L. | Remote access medical image exchange system and methods of operation therefor |
| US6007996A (en) | 1995-12-12 | 1999-12-28 | Applied Spectral Imaging Ltd. | In situ method of analyzing cells |
| US6011595A (en) | 1997-09-19 | 2000-01-04 | Eastman Kodak Company | Method for segmenting a digital image into a foreground region and a key color region |
| US6031929A (en) | 1996-07-18 | 2000-02-29 | University Of Pittsburgh | Image facsimile with real time image segmentation |
| US6040139A (en) | 1995-09-19 | 2000-03-21 | Bova; G. Steven | Laser cell purification system |
| US6058322A (en) | 1997-07-25 | 2000-05-02 | Arch Development Corporation | Methods for improving the accuracy in differential diagnosis on radiologic examinations |
| US6072570A (en) | 1997-07-24 | 2000-06-06 | Innotech | Image quality mapper for progressive eyeglasses |
| US6097838A (en) | 1996-12-19 | 2000-08-01 | Xerox Corporation | Color correction of a compressed image |
| US6101265A (en) | 1996-08-23 | 2000-08-08 | Bacus Research Laboratories, Inc. | Method and apparatus for acquiring and reconstructing magnified specimen images from a computer-controlled microscope |
| US6103518A (en) | 1999-03-05 | 2000-08-15 | Beecher Instruments | Instrument for constructing tissue arrays |
| WO2000049391A1 (en) | 1999-02-18 | 2000-08-24 | Bio-View Ltd. | System and method for identifying and analyzing rare cell types in a mixed population of cells |
| US6117985A (en) | 1995-06-16 | 2000-09-12 | Stemcell Technologies Inc. | Antibody compositions for preparing enriched cell preparations |
| US6122400A (en) | 1997-09-26 | 2000-09-19 | Sarnoff Corporation | Compression encoder bit allocation utilizing colormetric-adaptive weighting as in flesh-tone weighting |
| US6125194A (en) | 1996-02-06 | 2000-09-26 | Caelum Research Corporation | Method and system for re-screening nodules in radiological images using multi-resolution processing, neural network, and image processing |
| US6141602A (en) | 1997-09-25 | 2000-10-31 | Hitachi, Ltd. | Specimen processing system |
| US6151535A (en) | 1998-05-04 | 2000-11-21 | Olympus Diagnostica Gmbh | Laboratory primary sample distributor with archiving mode |
| US6169816B1 (en) | 1997-05-14 | 2001-01-02 | Applied Imaging, Inc. | Identification of objects of interest using multiple illumination schemes and finding overlap of features in corresponding multiple images |
| US6215894B1 (en) | 1999-02-26 | 2001-04-10 | General Scanning, Incorporated | Automatic imaging and analysis of microarray biochips |
| US6225636B1 (en) | 1996-10-25 | 2001-05-01 | Applied Imaging, Inc. | Multifluor-fluorescence in-situ hybridization (M-FISH) imaging techniques using multiple multiband filters with image registration |
| US6236031B1 (en) | 1998-09-04 | 2001-05-22 | Sony Corporation | Optical head, recording and/or reproducing apparatus, and optical disc drive with an auxiliary focus servo system |
| WO2001037206A1 (en) | 1999-11-19 | 2001-05-25 | Applied Imaging Corporation | Identification of objects of interest using a combination of multiple illumination schemes |
| US6238892B1 (en) | 1991-10-25 | 2001-05-29 | N.V. Innogenetics S.A. | Monoclonal antibodies directed against the microtubule-associated protein tau |
| US6272247B1 (en) | 1998-05-18 | 2001-08-07 | Datacube, Inc. | Rotation and scale invariant image finder |
| US6281874B1 (en) | 1998-08-27 | 2001-08-28 | International Business Machines Corporation | Method and system for downloading graphic images on the internet |
| US6290907B1 (en) | 1997-09-11 | 2001-09-18 | Hitachi, Ltd. | Sample handling system |
| US6313452B1 (en) | 1998-06-10 | 2001-11-06 | Sarnoff Corporation | Microscopy system utilizing a plurality of images for enhanced image processing capabilities |
| US6374989B1 (en) | 1997-11-14 | 2002-04-23 | Bayer Corporation | Conveyor system for clinical test apparatus |
| US20020067409A1 (en) | 2000-12-06 | 2002-06-06 | Bio-View Ltd. | Data acquisition and display system and method |
| US6404916B1 (en) | 1999-08-04 | 2002-06-11 | Chromavision Medical Systems, Inc. | Method and apparatus for applying color thresholds in light microscopy |
| US6406840B1 (en) | 1999-12-17 | 2002-06-18 | Biomosaic Systems, Inc. | Cell arrays and the uses thereof |
| US6418236B1 (en) | 1999-06-24 | 2002-07-09 | Chromavision Medical Systems, Inc. | Histological reconstruction and automated image analysis |
| US6466690B2 (en) | 2000-12-19 | 2002-10-15 | Bacus Research Laboratories, Inc. | Method and apparatus for processing an image of a tissue sample microarray |
| US20020164810A1 (en) | 2000-12-05 | 2002-11-07 | Vysis | Method and system for diagnosing pathology in biological samples by detection of infrared spectral markers |
| US6518554B1 (en) | 2000-05-24 | 2003-02-11 | Chromavision Medical Systems, Inc. | Reverse focusing methods and systems |
| WO2003014795A1 (en) | 2001-08-06 | 2003-02-20 | Bioview Ltd. | Image focusing in fluorescent imaging |
| US6573043B1 (en) | 1998-10-07 | 2003-06-03 | Genentech, Inc. | Tissue analysis and kits therefor |
| US20030124589A1 (en) | 2001-10-12 | 2003-07-03 | Vysis, Inc. | Imaging microarrays |
| US20030170703A1 (en) | 2002-01-15 | 2003-09-11 | Vysis, Inc., A Corporation Of The State Of Delaware | Method and/or system for analyzing biological samples using a computer system |
| US6631203B2 (en) | 1999-04-13 | 2003-10-07 | Chromavision Medical Systems, Inc. | Histological reconstruction and automated image analysis |
| US6671393B2 (en) | 1995-11-30 | 2003-12-30 | Chromavision Medical Systems, Inc. | Automated method for image analysis of residual protein |
| US6674896B1 (en) | 1999-07-13 | 2004-01-06 | Chromavision Medical Systems, Inc. | Device for applying accurate color thresholds in real time |
| US6697509B2 (en) | 2001-10-04 | 2004-02-24 | Chromavision Medical Systems, Inc. | Method and apparatus for scoring the uptake of markers in cells |
| US6718053B1 (en) | 1996-11-27 | 2004-04-06 | Chromavision Medical Systems, Inc. | Method and apparatus for automated image analysis of biological specimens |
- 2003
- 2003-06-12USUS10/461,786patent/US7272252B2/ennot_activeExpired - Fee Related
Patent Citations (149)
| Publication number | Priority date | Publication date | Assignee | Title |
|---|---|---|---|---|
| US3824393A (en) | 1971-08-25 | 1974-07-16 | American Express Invest | System for differential particle counting |
| US4125828A (en) | 1972-08-04 | 1978-11-14 | Med-El Inc. | Method and apparatus for automated classification and analysis of cells |
| US3851972A (en) | 1973-10-18 | 1974-12-03 | Coulter Electronics | Automatic method and system for analysis and review of a plurality of stored slides |
| US4011004A (en) | 1975-02-06 | 1977-03-08 | Geometric Data Corporation | Pivotable stage for microscope system |
| US4196265A (en) | 1977-06-15 | 1980-04-01 | The Wistar Institute | Method of producing antibodies |
| US4210419A (en) | 1978-02-17 | 1980-07-01 | California Institute Of Technology | Automated quantitative muscle biopsy analysis system |
| US4249825A (en) | 1979-05-14 | 1981-02-10 | The Trustees Of Boston University | Method and apparatus suitable for ocular blood flow analysis |
| US4338024A (en) | 1980-05-02 | 1982-07-06 | International Remote Imaging Systems, Inc. | Flow analyzer and system for analysis of fluids with particles |
| US4393466A (en) | 1980-09-12 | 1983-07-12 | International Remote Imaging Systems | Method of analyzing particles in a dilute fluid sample |
| US4612614A (en) | 1980-09-12 | 1986-09-16 | International Remote Imaging Systems, Inc. | Method of analyzing particles in a fluid sample |
| US4513438A (en) | 1982-04-15 | 1985-04-23 | Coulter Electronics, Inc. | Automated microscopy system and method for locating and re-locating objects in an image |
| DE3340647A1 (en) | 1983-11-10 | 1985-05-23 | Will Wetzlar Gmbh, 6330 Wetzlar | Method for focusing a microscope and microscope for carrying out the method |
| US4700298A (en) | 1984-09-14 | 1987-10-13 | Branko Palcic | Dynamic microscope image processing scanner |
| US4673973A (en) | 1985-02-04 | 1987-06-16 | National Biomedical Research Foundation | Split-image, multi-power microscopic image display system and method |
| US4656594A (en) | 1985-05-06 | 1987-04-07 | National Biomedical Research Foundation | Operator-interactive automated chromosome analysis system producing a karyotype |
| EP0213666A1 (en) | 1985-08-21 | 1987-03-11 | North American Philips Corporation | Method and apparatus for displaying a single parameter image |
| US4741043B1 (en) | 1985-11-04 | 1994-08-09 | Cell Analysis Systems Inc | Method of and apparatus for image analyses of biological specimens |
| US4741043A (en) | 1985-11-04 | 1988-04-26 | Cell Analysis Systems, Inc. | Method of and an apparatus for image analyses of biological specimens |
| US5018209A (en) | 1985-11-04 | 1991-05-21 | Cell Analysis Systems, Inc. | Analysis method and apparatus for biological specimens |
| US5008185A (en) | 1985-11-04 | 1991-04-16 | Cell Analysis Systems, Inc. | Methods and apparatus for the quantitation of nuclear proteins |
| DE3735091A1 (en) | 1986-10-16 | 1988-04-28 | Olympus Optical Co | AUTOMATIC FOCUSING PROCESS |
| US5202931A (en) | 1987-10-06 | 1993-04-13 | Cell Analysis Systems, Inc. | Methods and apparatus for the quantitation of nuclear protein |
| US5085325A (en) | 1988-03-08 | 1992-02-04 | Simco/Ramic Corporation | Color sorting system and method |
| US5287272A (en) | 1988-04-08 | 1994-02-15 | Neuromedical Systems, Inc. | Automated cytological specimen classification system and method |
| US4965725A (en) | 1988-04-08 | 1990-10-23 | Nueromedical Systems, Inc. | Neural network based automated cytological specimen classification system and method |
| US5287272B1 (en) | 1988-04-08 | 1996-08-27 | Neuromedical Systems Inc | Automated cytological specimen classification system and method |
| US4965725B1 (en) | 1988-04-08 | 1996-05-07 | Neuromedical Systems Inc | Neural network based automated cytological specimen classification system and method |
| US5740270A (en) | 1988-04-08 | 1998-04-14 | Neuromedical Systems, Inc. | Automated cytological specimen classification system and method |
| US4991223A (en) | 1988-06-30 | 1991-02-05 | American Innovision, Inc. | Apparatus and method for recognizing image features using color elements |
| US5321545A (en) | 1988-10-21 | 1994-06-14 | Biocom S.A. | Microscope stage for rapid and indexed analysis of filters and other media carrying multiple samples, and a method of analyzing such samples using said stage |
| US4945220A (en) | 1988-11-16 | 1990-07-31 | Prometrix Corporation | Autofocusing system for microscope having contrast detection means |
| US5726009A (en) | 1989-03-20 | 1998-03-10 | Anticancer, Inc. | Native-state method and system for determining viability and proliferative capacity of tissues in vitro |
| US5016173A (en) | 1989-04-13 | 1991-05-14 | Vanguard Imaging Ltd. | Apparatus and method for monitoring visually accessible surfaces of the body |
| US5068909A (en) | 1989-05-18 | 1991-11-26 | Applied Imaging Corporation | Method and apparatus for generating quantifiable video displays |
| US5003165A (en) | 1989-05-25 | 1991-03-26 | International Remote Imaging Systems, Inc. | Method and an apparatus for selecting the best focal position from a plurality of focal positions |
| US5087965A (en) | 1989-06-28 | 1992-02-11 | American Innovision, Inc. | Recognition of image colors using arbitrary shapes in color space |
| US5123055A (en) | 1989-08-10 | 1992-06-16 | International Remote Imaging Systems, Inc. | Method and an apparatus for differentiating a sample of biological cells |
| US5268966A (en) | 1989-08-10 | 1993-12-07 | International Remote Imaging Systems, Inc. | Method of differentiating particles based upon a dynamically changing threshold |
| US5162990A (en)* | 1990-06-15 | 1992-11-10 | The United States Of America As Represented By The United States Navy | System and method for quantifying macrophage phagocytosis by computer image analysis |
| US5233684A (en) | 1990-06-26 | 1993-08-03 | Digital Equipment Corporation | Method and apparatus for mapping a digital color image from a first color space to a second color space |
| US5526258A (en) | 1990-10-10 | 1996-06-11 | Cell Analysis System, Inc. | Method and apparatus for automated analysis of biological specimens |
| US5333207A (en) | 1990-11-07 | 1994-07-26 | Neuromedical Systems, Inc. | Inspection apparatus and method with inspection auditing for images presented on a display |
| US5257182A (en) | 1991-01-29 | 1993-10-26 | Neuromedical Systems, Inc. | Morphological classification system and method |
| US5257182B1 (en) | 1991-01-29 | 1996-05-07 | Neuromedical Systems Inc | Morphological classification system and method |
| WO1992017848A1 (en) | 1991-04-01 | 1992-10-15 | THE UNITED STATES GOVERNMENT, as represented by THE SECRETARY, DEPARTMENT OF HEALTH AND HUMAN SERVICES | Automated method and apparatus for determining characteristics of nerve fibers |
| US5231580A (en) | 1991-04-01 | 1993-07-27 | The United States Of America As Represented By The Secretary Of The Department Of Health And Human Services | Automated method and apparatus for determining characteristics of nerve fibers |
| US5481401A (en) | 1991-05-16 | 1996-01-02 | Olympus Optical Co., Ltd. | Ultraviolet microscope |
| US5428690A (en) | 1991-09-23 | 1995-06-27 | Becton Dickinson And Company | Method and apparatus for automated assay of biological specimens |
| US5473706A (en) | 1991-09-23 | 1995-12-05 | Becton Dickinson And Company | Method and apparatus for automated assay of biological specimens |
| US5375177A (en) | 1991-09-27 | 1994-12-20 | E. I. Du Pont De Nemours And Company | Method of identifying and characterizing a valid object by color |
| US5463470A (en) | 1991-10-09 | 1995-10-31 | Fuji Photo Film Co., Ltd. | Methods of collecting photometric image data and determining light exposure by extracting feature image data from an original image |
| US6238892B1 (en) | 1991-10-25 | 2001-05-29 | N.V. Innogenetics S.A. | Monoclonal antibodies directed against the microtubule-associated protein tau |
| EP0557871A2 (en) | 1992-02-18 | 1993-09-01 | Cell Analysis Systems, Inc. | Method and apparatus for automated assay of biological specimens |
| US5635402A (en) | 1992-03-05 | 1997-06-03 | Alfano; Robert R. | Technique for determining whether a cell is malignant as opposed to non-malignant using extrinsic fluorescence spectroscopy |
| US5799105A (en) | 1992-03-06 | 1998-08-25 | Agri-Tech, Inc. | Method for calibrating a color sorting apparatus |
| US5533628A (en) | 1992-03-06 | 1996-07-09 | Agri Tech Incorporated | Method and apparatus for sorting objects by color including stable color transformation |
| US5459384A (en) | 1992-04-30 | 1995-10-17 | Becton Dickinson And Company | Method and apparatus for controlling coordinate displacements of a platform |
| US5740267A (en) | 1992-05-29 | 1998-04-14 | Echerer; Scott J. | Radiographic image enhancement comparison and storage requirement reduction system |
| US5338924A (en) | 1992-08-11 | 1994-08-16 | Lasa Industries, Inc. | Apparatus and method for automatic focusing of light using a fringe plate |
| US5254845A (en) | 1992-08-18 | 1993-10-19 | Applied Imaging International Limited | Automatic focusing system using focal length-changing element |
| US5889881A (en) | 1992-10-14 | 1999-03-30 | Oncometrics Imaging Corp. | Method and apparatus for automatically detecting malignancy-associated changes |
| US5317140A (en) | 1992-11-24 | 1994-05-31 | Dunthorn David I | Diffusion-assisted position location particularly for visual pen detection |
| US5583666A (en) | 1993-02-12 | 1996-12-10 | Eastman Kodak Company | Method for cross-device color calibration and enhancement using explicit constraints |
| US5449622A (en) | 1993-02-16 | 1995-09-12 | Yabe; Ryohei | Method and apparatus for analyzing stained particles |
| US5602941A (en) | 1993-05-21 | 1997-02-11 | Digital Equipment Corporation | Input modification system for multilevel dithering |
| US5515172A (en) | 1993-07-19 | 1996-05-07 | Xerox Corporation | Apparatus and method for enhanced color to color conversion |
| US5432871A (en) | 1993-08-04 | 1995-07-11 | Universal Systems & Technology, Inc. | Systems and methods for interactive image data acquisition and compression |
| US5877161A (en) | 1993-08-05 | 1999-03-02 | University Technologies International Inc. | Cyclin D1 negative regulatory activity |
| US5854851A (en) | 1993-08-13 | 1998-12-29 | Sophis View Technologies Ltd. | System and method for diagnosis of living tissue diseases using digital image processing |
| US5352613A (en) | 1993-10-07 | 1994-10-04 | Tafas Triantafillos P | Cytological screening method |
| US5585469A (en) | 1993-10-08 | 1996-12-17 | Hitachi, Ltd. | Dyeing agent having at least two dyes for staining a biological sample and staining method employing the dyeing agent |
| US5409007A (en) | 1993-11-26 | 1995-04-25 | General Electric Company | Filter to reduce speckle artifact in ultrasound imaging |
| US5469353A (en) | 1993-11-26 | 1995-11-21 | Access Radiology Corp. | Radiological image interpretation apparatus and method |
| US5783814A (en) | 1994-01-18 | 1998-07-21 | Ultrapointe Corporation | Method and apparatus for automatically focusing a microscope |
| US5691779A (en) | 1994-04-14 | 1997-11-25 | Matsushita Electric Industrial Co., Ltd. | Color conversion apparatus that restricts the color reproduction range of primary color signals |
| US5795723A (en) | 1994-05-06 | 1998-08-18 | Fred Hutchinson Cancer Research Center | Expression of neurogenic bHLH genes in primitive neuroectodermal tumors |
| US5602937A (en) | 1994-06-01 | 1997-02-11 | Cognex Corporation | Methods and apparatus for machine vision high accuracy searching |
| US5625705A (en) | 1994-06-03 | 1997-04-29 | Neuromedical Systems, Inc. | Intensity texture based classification system and method |
| US5499097A (en) | 1994-09-19 | 1996-03-12 | Neopath, Inc. | Method and apparatus for checking automated optical system performance repeatability |
| US5647025A (en) | 1994-09-20 | 1997-07-08 | Neopath, Inc. | Automatic focusing of biomedical specimens apparatus |
| US5966465A (en) | 1994-09-21 | 1999-10-12 | Ricoh Corporation | Compression/decompression using reversible embedded wavelets |
| US5846749A (en) | 1994-10-12 | 1998-12-08 | The Regents Of The University Of California | Quantitative measurement of tissue protein identified by immunohistochemistry and standardized protein determination |
| EP0713086A1 (en) | 1994-11-17 | 1996-05-22 | Chemunex | Apparatus and process for the detection and counting of rarely occurring mammalian cells |
| US5625709A (en) | 1994-12-23 | 1997-04-29 | International Remote Imaging Systems, Inc. | Method and apparatus for identifying characteristics of an object in a field of view |
| US5619032A (en) | 1995-01-18 | 1997-04-08 | International Remote Imaging Systems, Inc. | Method and apparatus for automatically selecting the best focal position from a plurality of focal positions for a focusing apparatus |
| US5966309A (en) | 1995-02-16 | 1999-10-12 | Smithkline Beecham Corporation | Clinically testing biological samples |
| US5646677A (en) | 1995-02-23 | 1997-07-08 | Motorola, Inc. | Method and apparatus for interactively viewing wide-angle images from terrestrial, space, and underwater viewpoints |
| US5586160A (en) | 1995-03-20 | 1996-12-17 | The Regents Of The University Of California | Automated analysis for microcalcifications in high resolution digital mammograms |
| US5671288A (en) | 1995-05-31 | 1997-09-23 | Neopath, Inc. | Method and apparatus for assessing slide and specimen preparation quality |
| US5773459A (en) | 1995-06-07 | 1998-06-30 | Sugen, Inc. | Urea- and thiourea-type compounds |
| US5701172A (en) | 1995-06-07 | 1997-12-23 | Gas Research Institute | Optical flowmeter |
| US6117985A (en) | 1995-06-16 | 2000-09-12 | Stemcell Technologies Inc. | Antibody compositions for preparing enriched cell preparations |
| US5735387A (en) | 1995-07-14 | 1998-04-07 | Chiron Diagnostics Corporation | Specimen rack handling system |
| US5690892A (en) | 1995-09-15 | 1997-11-25 | Accumed, Inc. | Cassette for use with automated specimen handling system |
| US5732150A (en) | 1995-09-19 | 1998-03-24 | Ihc Health Services, Inc. | Method and system for multiple wavelength microscopy image analysis |
| US6040139A (en) | 1995-09-19 | 2000-03-21 | Bova; G. Steven | Laser cell purification system |
| US6215892B1 (en) | 1995-11-30 | 2001-04-10 | Chromavision Medical Systems, Inc. | Method and apparatus for automated image analysis of biological specimens |
| US6553135B1 (en) | 1995-11-30 | 2003-04-22 | Chromavision Medical Systems, Inc. | Method and apparatus for automated image analysis of biological specimens |
| WO1997020198A2 (en) | 1995-11-30 | 1997-06-05 | Chromavision Medical Systems, Inc. | Method and apparatus for automated image analysis of biological specimens |
| US6671393B2 (en) | 1995-11-30 | 2003-12-30 | Chromavision Medical Systems, Inc. | Automated method for image analysis of residual protein |
| US5706093A (en) | 1995-12-05 | 1998-01-06 | Olympus Optical Co., Ltd. | Color classification apparatus |
| US6007996A (en) | 1995-12-12 | 1999-12-28 | Applied Spectral Imaging Ltd. | In situ method of analyzing cells |
| US6125194A (en) | 1996-02-06 | 2000-09-26 | Caelum Research Corporation | Method and system for re-screening nodules in radiological images using multi-resolution processing, neural network, and image processing |
| US5911003A (en) | 1996-04-26 | 1999-06-08 | Pressco Technology Inc. | Color pattern evaluation system for randomly oriented articles |
| US6006191A (en) | 1996-05-13 | 1999-12-21 | Dirienzo; Andrew L. | Remote access medical image exchange system and methods of operation therefor |
| US6031929A (en) | 1996-07-18 | 2000-02-29 | University Of Pittsburgh | Image facsimile with real time image segmentation |
| US6101265A (en) | 1996-08-23 | 2000-08-08 | Bacus Research Laboratories, Inc. | Method and apparatus for acquiring and reconstructing magnified specimen images from a computer-controlled microscope |
| US6226392B1 (en) | 1996-08-23 | 2001-05-01 | Bacus Research Laboratories, Inc. | Method and apparatus for acquiring and reconstructing magnified specimen images from a computer-controlled microscope |
| US5867598A (en) | 1996-09-26 | 1999-02-02 | Xerox Corporation | Method and apparatus for processing of a JPEG compressed image |
| US5911327A (en) | 1996-10-02 | 1999-06-15 | Nippon Steel Corporation | Method of automatically discriminating and separating scraps containing copper from iron scraps |
| US6225636B1 (en) | 1996-10-25 | 2001-05-01 | Applied Imaging, Inc. | Multifluor-fluorescence in-situ hybridization (M-FISH) imaging techniques using multiple multiband filters with image registration |
| US6718053B1 (en) | 1996-11-27 | 2004-04-06 | Chromavision Medical Systems, Inc. | Method and apparatus for automated image analysis of biological specimens |
| US6097838A (en) | 1996-12-19 | 2000-08-01 | Xerox Corporation | Color correction of a compressed image |
| US5989835A (en) | 1997-02-27 | 1999-11-23 | Cellomics, Inc. | System for cell-based screening |
| US6259807B1 (en) | 1997-05-14 | 2001-07-10 | Applied Imaging Corp. | Identification of objects of interest using multiple illumination schemes and finding overlap of features in corresponding multiple images |
| US6169816B1 (en) | 1997-05-14 | 2001-01-02 | Applied Imaging, Inc. | Identification of objects of interest using multiple illumination schemes and finding overlap of features in corresponding multiple images |
| US6072570A (en) | 1997-07-24 | 2000-06-06 | Innotech | Image quality mapper for progressive eyeglasses |
| US6058322A (en) | 1997-07-25 | 2000-05-02 | Arch Development Corporation | Methods for improving the accuracy in differential diagnosis on radiologic examinations |
| US5880473A (en) | 1997-07-28 | 1999-03-09 | Applied Imaging, Inc. | Multifluor-fluorescence in-situ hybridization (M-FISH) imaging techniques using multiple multiband filters with image registration |
| US6290907B1 (en) | 1997-09-11 | 2001-09-18 | Hitachi, Ltd. | Sample handling system |
| US6011595A (en) | 1997-09-19 | 2000-01-04 | Eastman Kodak Company | Method for segmenting a digital image into a foreground region and a key color region |
| US6141602A (en) | 1997-09-25 | 2000-10-31 | Hitachi, Ltd. | Specimen processing system |
| US6122400A (en) | 1997-09-26 | 2000-09-19 | Sarnoff Corporation | Compression encoder bit allocation utilizing colormetric-adaptive weighting as in flesh-tone weighting |
| US5888742A (en) | 1997-10-28 | 1999-03-30 | Incyte Pharmaceuticals, Inc. | Human phospholipid binding proteins |
| US6374989B1 (en) | 1997-11-14 | 2002-04-23 | Bayer Corporation | Conveyor system for clinical test apparatus |
| US6151535A (en) | 1998-05-04 | 2000-11-21 | Olympus Diagnostica Gmbh | Laboratory primary sample distributor with archiving mode |
| US6272247B1 (en) | 1998-05-18 | 2001-08-07 | Datacube, Inc. | Rotation and scale invariant image finder |
| US6313452B1 (en) | 1998-06-10 | 2001-11-06 | Sarnoff Corporation | Microscopy system utilizing a plurality of images for enhanced image processing capabilities |
| US6281874B1 (en) | 1998-08-27 | 2001-08-28 | International Business Machines Corporation | Method and system for downloading graphic images on the internet |
| US6236031B1 (en) | 1998-09-04 | 2001-05-22 | Sony Corporation | Optical head, recording and/or reproducing apparatus, and optical disc drive with an auxiliary focus servo system |
| US6573043B1 (en) | 1998-10-07 | 2003-06-03 | Genentech, Inc. | Tissue analysis and kits therefor |
| WO2000049391A1 (en) | 1999-02-18 | 2000-08-24 | Bio-View Ltd. | System and method for identifying and analyzing rare cell types in a mixed population of cells |
| US6215894B1 (en) | 1999-02-26 | 2001-04-10 | General Scanning, Incorporated | Automatic imaging and analysis of microarray biochips |
| US6103518A (en) | 1999-03-05 | 2000-08-15 | Beecher Instruments | Instrument for constructing tissue arrays |
| US6631203B2 (en) | 1999-04-13 | 2003-10-07 | Chromavision Medical Systems, Inc. | Histological reconstruction and automated image analysis |
| US6418236B1 (en) | 1999-06-24 | 2002-07-09 | Chromavision Medical Systems, Inc. | Histological reconstruction and automated image analysis |
| US6674896B1 (en) | 1999-07-13 | 2004-01-06 | Chromavision Medical Systems, Inc. | Device for applying accurate color thresholds in real time |
| US6404916B1 (en) | 1999-08-04 | 2002-06-11 | Chromavision Medical Systems, Inc. | Method and apparatus for applying color thresholds in light microscopy |
| WO2001037206A1 (en) | 1999-11-19 | 2001-05-25 | Applied Imaging Corporation | Identification of objects of interest using a combination of multiple illumination schemes |
| US6406840B1 (en) | 1999-12-17 | 2002-06-18 | Biomosaic Systems, Inc. | Cell arrays and the uses thereof |
| US6518554B1 (en) | 2000-05-24 | 2003-02-11 | Chromavision Medical Systems, Inc. | Reverse focusing methods and systems |
| US20020164810A1 (en) | 2000-12-05 | 2002-11-07 | Vysis | Method and system for diagnosing pathology in biological samples by detection of infrared spectral markers |
| US20020067409A1 (en) | 2000-12-06 | 2002-06-06 | Bio-View Ltd. | Data acquisition and display system and method |
| US6466690B2 (en) | 2000-12-19 | 2002-10-15 | Bacus Research Laboratories, Inc. | Method and apparatus for processing an image of a tissue sample microarray |
| US6466690C1 (en) | 2000-12-19 | 2008-11-18 | Bacus Res Lab Inc | Method and apparatus for processing an image of a tissue sample microarray |
| WO2003014795A1 (en) | 2001-08-06 | 2003-02-20 | Bioview Ltd. | Image focusing in fluorescent imaging |
| US6697509B2 (en) | 2001-10-04 | 2004-02-24 | Chromavision Medical Systems, Inc. | Method and apparatus for scoring the uptake of markers in cells |
| US20030124589A1 (en) | 2001-10-12 | 2003-07-03 | Vysis, Inc. | Imaging microarrays |
| US20030170703A1 (en) | 2002-01-15 | 2003-09-11 | Vysis, Inc., A Corporation Of The State Of Delaware | Method and/or system for analyzing biological samples using a computer system |
Non-Patent Citations (34)
Cited By (241)
| Publication number | Priority date | Publication date | Assignee | Title |
|---|---|---|---|---|
| US20100073472A1 (en)* | 1998-06-01 | 2010-03-25 | Carl Zeiss Microlmaging Ais, Inc. | Intergrated virtual slide and live microscope system |
| US20100067759A1 (en)* | 1998-06-01 | 2010-03-18 | Zeineh Jack A | System and Method for Remote Navigation of a Specimen |
| US20100034437A1 (en)* | 1998-06-01 | 2010-02-11 | Zeineh Jack A | System and method for reconstructing a diagnostic trajectory |
| US7916916B2 (en) | 1998-06-01 | 2011-03-29 | Carl Zeiss Microimaging Gmbh | System and method for remote navigation of a specimen |
| US8036868B2 (en) | 1998-06-01 | 2011-10-11 | Carl Zeiss Microimaging Gmbh | Intergrated systems and methods of virtual or live microscope slide presentation |
| US7916913B2 (en) | 1998-06-01 | 2011-03-29 | Carl Zeiss Microimaging Gmbh | System and method for reconstructing a diagnostic trajectory |
| US20050250155A1 (en)* | 1998-10-29 | 2005-11-10 | Cell Works Diagnostics, Inc. | Multiple marker characterization of single cells |
| US9282931B2 (en) | 2000-10-30 | 2016-03-15 | The General Hospital Corporation | Methods for tissue analysis |
| US9295391B1 (en) | 2000-11-10 | 2016-03-29 | The General Hospital Corporation | Spectrally encoded miniature endoscopic imaging probe |
| US8150496B2 (en) | 2001-05-01 | 2012-04-03 | The General Hospital Corporation | Method and apparatus for determination of atherosclerotic plaque type by measurement of tissue optical properties |
| US8050747B2 (en) | 2001-05-01 | 2011-11-01 | The General Hospital Corporation | Method and apparatus for determination of atherosclerotic plaque type by measurement of tissue optical properties |
| US7903257B2 (en) | 2002-01-24 | 2011-03-08 | The General Hospital Corporation | Apparatus and method for ranging and noise reduction of low coherence interferometry (LCI) and optical coherence tomography (OCT) signals by parallel detection of spectral bands |
| US7797119B2 (en) | 2002-01-24 | 2010-09-14 | The General Hospital Corporation | Apparatus and method for rangings and noise reduction of low coherence interferometry LCI and optical coherence tomography OCT signals by parallel detection of spectral bands |
| US7646905B2 (en)* | 2002-12-23 | 2010-01-12 | Qinetiq Limited | Scoring estrogen and progesterone receptors expression based on image analysis |
| US20060067887A1 (en)* | 2002-12-23 | 2006-03-30 | Qinetiq Limited | Scoring estrogen and progesterone receptors expression based on image analysis |
| US8054468B2 (en) | 2003-01-24 | 2011-11-08 | The General Hospital Corporation | Apparatus and method for ranging and noise reduction of low coherence interferometry LCI and optical coherence tomography OCT signals by parallel detection of spectral bands |
| US7761139B2 (en) | 2003-01-24 | 2010-07-20 | The General Hospital Corporation | System and method for identifying tissue using low-coherence interferometry |
| US8559012B2 (en) | 2003-01-24 | 2013-10-15 | The General Hospital Corporation | Speckle reduction in optical coherence tomography by path length encoded angular compounding |
| US9226665B2 (en) | 2003-01-24 | 2016-01-05 | The General Hospital Corporation | Speckle reduction in optical coherence tomography by path length encoded angular compounding |
| US8174702B2 (en) | 2003-01-24 | 2012-05-08 | The General Hospital Corporation | Speckle reduction in optical coherence tomography by path length encoded angular compounding |
| US20040186369A1 (en)* | 2003-03-21 | 2004-09-23 | Scimed Life Systems, Inc. | Scan conversion of medical imaging data |
| US7620220B2 (en)* | 2003-03-21 | 2009-11-17 | Boston Scientific Scimed, Inc. | Scan conversion of medical imaging data from polar format to cartesian format |
| US7995627B2 (en) | 2003-06-06 | 2011-08-09 | The General Hospital Corporation | Process and apparatus for a wavelength tuning source |
| US8416818B2 (en) | 2003-06-06 | 2013-04-09 | The General Hospital Corporation | Process and apparatus for a wavelength tuning source |
| USRE47675E1 (en) | 2003-06-06 | 2019-10-29 | The General Hospital Corporation | Process and apparatus for a wavelength tuning source |
| US7864822B2 (en) | 2003-06-06 | 2011-01-04 | The General Hospital Corporation | Process and apparatus for a wavelength tuning source |
| US9377290B2 (en) | 2003-10-27 | 2016-06-28 | The General Hospital Corporation | Method and apparatus for performing optical imaging using frequency-domain interferometry |
| US7969578B2 (en) | 2003-10-27 | 2011-06-28 | The General Hospital Corporation | Method and apparatus for performing optical imaging using frequency-domain interferometry |
| US8705046B2 (en) | 2003-10-27 | 2014-04-22 | The General Hospital Corporation | Method and apparatus for performing optical imaging using frequency-domain interferometry |
| US8018598B2 (en) | 2004-05-29 | 2011-09-13 | The General Hospital Corporation | Process, system and software arrangement for a chromatic dispersion compensation using reflective layers in optical coherence tomography (OCT) imaging |
| US7809225B2 (en) | 2004-07-02 | 2010-10-05 | The General Hospital Corporation | Imaging system and related techniques |
| US7925133B2 (en) | 2004-07-02 | 2011-04-12 | The General Hospital Corporation | Imaging system and related techniques |
| US8676013B2 (en) | 2004-07-02 | 2014-03-18 | The General Hospital Corporation | Imaging system using and related techniques |
| US8369669B2 (en) | 2004-07-02 | 2013-02-05 | The General Hospital Corporation | Imaging system and related techniques |
| US7809226B2 (en) | 2004-07-02 | 2010-10-05 | The General Hospital Corporation | Imaging system and related techniques |
| US9664615B2 (en) | 2004-07-02 | 2017-05-30 | The General Hospital Corporation | Imaging system and related techniques |
| US20090003789A1 (en)* | 2004-07-02 | 2009-01-01 | The General Hospital Corporation | Imaging system and related techniques |
| US8081316B2 (en) | 2004-08-06 | 2011-12-20 | The General Hospital Corporation | Process, system and software arrangement for determining at least one location in a sample using an optical coherence tomography |
| US9226660B2 (en) | 2004-08-06 | 2016-01-05 | The General Hospital Corporation | Process, system and software arrangement for determining at least one location in a sample using an optical coherence tomography |
| US20090196526A1 (en)* | 2004-08-18 | 2009-08-06 | Tripath Imaging, Inc. | Microscopy system having automatic and interactive modes for forming a magnified mosaic image and associated method |
| US8965487B2 (en) | 2004-08-24 | 2015-02-24 | The General Hospital Corporation | Process, system and software arrangement for measuring a mechanical strain and elastic properties of a sample |
| US9763623B2 (en) | 2004-08-24 | 2017-09-19 | The General Hospital Corporation | Method and apparatus for imaging of vessel segments |
| US9254102B2 (en) | 2004-08-24 | 2016-02-09 | The General Hospital Corporation | Method and apparatus for imaging of vessel segments |
| US8208995B2 (en) | 2004-08-24 | 2012-06-26 | The General Hospital Corporation | Method and apparatus for imaging of vessel segments |
| USRE44042E1 (en) | 2004-09-10 | 2013-03-05 | The General Hospital Corporation | System and method for optical coherence imaging |
| USRE45512E1 (en) | 2004-09-29 | 2015-05-12 | The General Hospital Corporation | System and method for optical coherence imaging |
| US7995210B2 (en) | 2004-11-24 | 2011-08-09 | The General Hospital Corporation | Devices and arrangements for performing coherence range imaging using a common path interferometer |
| US8922781B2 (en) | 2004-11-29 | 2014-12-30 | The General Hospital Corporation | Arrangements, devices, endoscopes, catheters and methods for performing optical imaging by simultaneously illuminating and detecting multiple points on a sample |
| US8351665B2 (en)* | 2005-04-28 | 2013-01-08 | The General Hospital Corporation | Systems, processes and software arrangements for evaluating information associated with an anatomical structure by an optical coherence ranging technique |
| US9326682B2 (en) | 2005-04-28 | 2016-05-03 | The General Hospital Corporation | Systems, processes and software arrangements for evaluating information associated with an anatomical structure by an optical coherence ranging technique |
| US9060689B2 (en) | 2005-06-01 | 2015-06-23 | The General Hospital Corporation | Apparatus, method and system for performing phase-resolved optical frequency domain imaging |
| US8921102B2 (en) | 2005-07-29 | 2014-12-30 | Gpb Scientific, Llc | Devices and methods for enrichment and alteration of circulating tumor cells and other particles |
| US9441948B2 (en) | 2005-08-09 | 2016-09-13 | The General Hospital Corporation | Apparatus, methods and storage medium for performing polarization-based quadrature demodulation in optical coherence tomography |
| US8149418B2 (en) | 2005-09-29 | 2012-04-03 | The General Hospital Corporation | Method and apparatus for optical imaging via spectral encoding |
| US8928889B2 (en) | 2005-09-29 | 2015-01-06 | The General Hospital Corporation | Arrangements and methods for providing multimodality microscopic imaging of one or more biological structures |
| US8289522B2 (en) | 2005-09-29 | 2012-10-16 | The General Hospital Corporation | Arrangements and methods for providing multimodality microscopic imaging of one or more biological structures |
| US8760663B2 (en) | 2005-09-29 | 2014-06-24 | The General Hospital Corporation | Method and apparatus for optical imaging via spectral encoding |
| US9304121B2 (en) | 2005-09-29 | 2016-04-05 | The General Hospital Corporation | Method and apparatus for optical imaging via spectral encoding |
| US9513276B2 (en) | 2005-09-29 | 2016-12-06 | The General Hospital Corporation | Method and apparatus for optical imaging via spectral encoding |
| US7889348B2 (en) | 2005-10-14 | 2011-02-15 | The General Hospital Corporation | Arrangements and methods for facilitating photoluminescence imaging |
| US7796270B2 (en) | 2006-01-10 | 2010-09-14 | The General Hospital Corporation | Systems and methods for generating data based on one or more spectrally-encoded endoscopy techniques |
| US9516997B2 (en) | 2006-01-19 | 2016-12-13 | The General Hospital Corporation | Spectrally-encoded endoscopy techniques, apparatus and methods |
| US8145018B2 (en) | 2006-01-19 | 2012-03-27 | The General Hospital Corporation | Apparatus for obtaining information for a structure using spectrally-encoded endoscopy techniques and methods for producing one or more optical arrangements |
| US9646377B2 (en) | 2006-01-19 | 2017-05-09 | The General Hospital Corporation | Methods and systems for optical imaging or epithelial luminal organs by beam scanning thereof |
| US9087368B2 (en) | 2006-01-19 | 2015-07-21 | The General Hospital Corporation | Methods and systems for optical imaging or epithelial luminal organs by beam scanning thereof |
| US9791317B2 (en) | 2006-01-19 | 2017-10-17 | The General Hospital Corporation | Spectrally-encoded endoscopy techniques and methods |
| US10987000B2 (en) | 2006-01-19 | 2021-04-27 | The General Hospital Corporation | Methods and systems for optical imaging or epithelial luminal organs by beam scanning thereof |
| US9186066B2 (en) | 2006-02-01 | 2015-11-17 | The General Hospital Corporation | Apparatus for applying a plurality of electro-magnetic radiations to a sample |
| US9186067B2 (en) | 2006-02-01 | 2015-11-17 | The General Hospital Corporation | Apparatus for applying a plurality of electro-magnetic radiations to a sample |
| US10426548B2 (en) | 2006-02-01 | 2019-10-01 | The General Hosppital Corporation | Methods and systems for providing electromagnetic radiation to at least one portion of a sample using conformal laser therapy procedures |
| US9777053B2 (en) | 2006-02-08 | 2017-10-03 | The General Hospital Corporation | Methods, arrangements and systems for obtaining information associated with an anatomical sample using optical microscopy |
| US7982879B2 (en) | 2006-02-24 | 2011-07-19 | The General Hospital Corporation | Methods and systems for performing angle-resolved fourier-domain optical coherence tomography |
| USRE46412E1 (en) | 2006-02-24 | 2017-05-23 | The General Hospital Corporation | Methods and systems for performing angle-resolved Fourier-domain optical coherence tomography |
| US8175685B2 (en) | 2006-05-10 | 2012-05-08 | The General Hospital Corporation | Process, arrangements and systems for providing frequency domain imaging of a sample |
| US9364143B2 (en) | 2006-05-10 | 2016-06-14 | The General Hospital Corporation | Process, arrangements and systems for providing frequency domain imaging of a sample |
| US10413175B2 (en) | 2006-05-10 | 2019-09-17 | The General Hospital Corporation | Process, arrangements and systems for providing frequency domain imaging of a sample |
| US7733524B2 (en)* | 2006-06-06 | 2010-06-08 | Primax Electronics Ltd. | Monochromic image processing system and method for background removal according to dynamic data |
| US20070280533A1 (en)* | 2006-06-06 | 2007-12-06 | Chun-Chia Huang | Monochromic image processing system and method for background removal according to dynamic data |
| US10155984B2 (en) | 2006-06-14 | 2018-12-18 | The General Hospital Corporation | Rare cell analysis using sample splitting and DNA tags |
| US9017942B2 (en) | 2006-06-14 | 2015-04-28 | The General Hospital Corporation | Rare cell analysis using sample splitting and DNA tags |
| US8168389B2 (en) | 2006-06-14 | 2012-05-01 | The General Hospital Corporation | Fetal cell analysis using sample splitting |
| US11781187B2 (en) | 2006-06-14 | 2023-10-10 | The General Hospital Corporation | Rare cell analysis using sample splitting and DNA tags |
| US9347100B2 (en) | 2006-06-14 | 2016-05-24 | Gpb Scientific, Llc | Rare cell analysis using sample splitting and DNA tags |
| US9273355B2 (en) | 2006-06-14 | 2016-03-01 | The General Hospital Corporation | Rare cell analysis using sample splitting and DNA tags |
| US10591391B2 (en) | 2006-06-14 | 2020-03-17 | Verinata Health, Inc. | Diagnosis of fetal abnormalities using polymorphisms including short tandem repeats |
| US10704090B2 (en) | 2006-06-14 | 2020-07-07 | Verinata Health, Inc. | Fetal aneuploidy detection by sequencing |
| US11674176B2 (en) | 2006-06-14 | 2023-06-13 | Verinata Health, Inc | Fetal aneuploidy detection by sequencing |
| US8137912B2 (en) | 2006-06-14 | 2012-03-20 | The General Hospital Corporation | Methods for the diagnosis of fetal abnormalities |
| US8372584B2 (en) | 2006-06-14 | 2013-02-12 | The General Hospital Corporation | Rare cell analysis using sample splitting and DNA tags |
| US7920271B2 (en) | 2006-08-25 | 2011-04-05 | The General Hospital Corporation | Apparatus and methods for enhancing optical coherence tomography imaging using volumetric filtering techniques |
| US20080097225A1 (en)* | 2006-10-19 | 2008-04-24 | The General Hospital Corporation | Apparatus and method for obtaining and providing imaging information associated with at least one portion of a sample, and effecting such portion(s) |
| US9968245B2 (en) | 2006-10-19 | 2018-05-15 | The General Hospital Corporation | Apparatus and method for obtaining and providing imaging information associated with at least one portion of a sample, and effecting such portion(s) |
| US8838213B2 (en) | 2006-10-19 | 2014-09-16 | The General Hospital Corporation | Apparatus and method for obtaining and providing imaging information associated with at least one portion of a sample, and effecting such portion(s) |
| US20080097222A1 (en)* | 2006-10-24 | 2008-04-24 | The Research Foundation Of State University Of New York | Composition, method, system, and kit for optical electrophysiology |
| US8155730B2 (en)* | 2006-10-24 | 2012-04-10 | The Research Foundation Of State University Of New York | Composition, method, system, and kit for optical electrophysiology |
| US9636424B2 (en) | 2006-10-24 | 2017-05-02 | The Research Foundation Of State University Of New York | Composition, method, system and kit for optical electrophysiology |
| US7949019B2 (en) | 2007-01-19 | 2011-05-24 | The General Hospital | Wavelength tuning source based on a rotatable reflector |
| US9176319B2 (en) | 2007-03-23 | 2015-11-03 | The General Hospital Corporation | Methods, arrangements and apparatus for utilizing a wavelength-swept laser using angular scanning and dispersion procedures |
| US10534129B2 (en) | 2007-03-30 | 2020-01-14 | The General Hospital Corporation | System and method providing intracoronary laser speckle imaging for the detection of vulnerable plaque |
| US8045177B2 (en) | 2007-04-17 | 2011-10-25 | The General Hospital Corporation | Apparatus and methods for measuring vibrations using spectrally-encoded endoscopy |
| US8655037B2 (en) | 2007-05-14 | 2014-02-18 | Historx, Inc. | Compartment segregation by pixel characterization using image data clustering |
| US8335360B2 (en) | 2007-05-14 | 2012-12-18 | Historx, Inc. | Compartment segregation by pixel characterization using image data clustering |
| US8120768B2 (en) | 2007-06-15 | 2012-02-21 | Historx, Inc. | Method and system for standardizing microscope instruments |
| US7907271B2 (en) | 2007-06-15 | 2011-03-15 | Historx, Inc. | Method and system for standardizing microscope instruments |
| US8027030B2 (en) | 2007-06-15 | 2011-09-27 | Historx, Inc. | Method and system for standardizing microscope instruments |
| US9375158B2 (en) | 2007-07-31 | 2016-06-28 | The General Hospital Corporation | Systems and methods for providing beam scan patterns for high speed doppler optical frequency domain imaging |
| US8160348B2 (en) | 2007-08-06 | 2012-04-17 | Historx, Inc. | Methods and system for validating sample images for quantitative immunoassays |
| US8417015B2 (en) | 2007-08-06 | 2013-04-09 | Historx, Inc. | Methods and system for validating sample images for quantitative immunoassays |
| US8121365B2 (en) | 2007-08-07 | 2012-02-21 | Historx, Inc. | Method and system for determining an optimal dilution of a reagent |
| US7978258B2 (en) | 2007-08-31 | 2011-07-12 | Historx, Inc. | Automatic exposure time selection for imaging tissue |
| US11199538B2 (en) | 2007-10-02 | 2021-12-14 | Labrador Diagnostics Llc | Modular point-of-care devices, systems, and uses thereof |
| US9581588B2 (en) | 2007-10-02 | 2017-02-28 | Theranos, Inc. | Modular point-of-care devices, systems, and uses thereof |
| US9012163B2 (en) | 2007-10-02 | 2015-04-21 | Theranos, Inc. | Modular point-of-care devices, systems, and uses thereof |
| US9121851B2 (en) | 2007-10-02 | 2015-09-01 | Theranos, Inc. | Modular point-of-care devices, systems, and uses thereof |
| US11137391B2 (en) | 2007-10-02 | 2021-10-05 | Labrador Diagnostics Llc | Modular point-of-care devices, systems, and uses thereof |
| US10670588B2 (en) | 2007-10-02 | 2020-06-02 | Theranos Ip Company, Llc | Modular point-of-care devices, systems, and uses thereof |
| US8697377B2 (en) | 2007-10-02 | 2014-04-15 | Theranos, Inc. | Modular point-of-care devices, systems, and uses thereof |
| US9588109B2 (en) | 2007-10-02 | 2017-03-07 | Theranos, Inc. | Modular point-of-care devices, systems, and uses thereof |
| US10634667B2 (en) | 2007-10-02 | 2020-04-28 | Theranos Ip Company, Llc | Modular point-of-care devices, systems, and uses thereof |
| US9285366B2 (en) | 2007-10-02 | 2016-03-15 | Theranos, Inc. | Modular point-of-care devices, systems, and uses thereof |
| US10900958B2 (en) | 2007-10-02 | 2021-01-26 | Labrador Diagnostics Llc | Modular point-of-care devices, systems, and uses thereof |
| US9435793B2 (en) | 2007-10-02 | 2016-09-06 | Theranos, Inc. | Modular point-of-care devices, systems, and uses thereof |
| US11899010B2 (en) | 2007-10-02 | 2024-02-13 | Labrador Diagnostics Llc | Modular point-of-care devices, systems, and uses thereof |
| US11143647B2 (en) | 2007-10-02 | 2021-10-12 | Labrador Diagnostics, LLC | Modular point-of-care devices, systems, and uses thereof |
| US11092593B2 (en) | 2007-10-02 | 2021-08-17 | Labrador Diagnostics Llc | Modular point-of-care devices, systems, and uses thereof |
| US11366106B2 (en) | 2007-10-02 | 2022-06-21 | Labrador Diagnostics Llc | Modular point-of-care devices, systems, and uses thereof |
| US11061022B2 (en) | 2007-10-02 | 2021-07-13 | Labrador Diagnostics Llc | Modular point-of-care devices, systems, and uses thereof |
| US8822167B2 (en) | 2007-10-02 | 2014-09-02 | Theranos, Inc. | Modular point-of-care devices, systems, and uses thereof |
| US7933021B2 (en) | 2007-10-30 | 2011-04-26 | The General Hospital Corporation | System and method for cladding mode detection |
| US20090161928A1 (en)* | 2007-12-06 | 2009-06-25 | Siemens Corporate Research, Inc. | System and method for unsupervised detection and gleason grading of prostate cancer whole mounts using nir fluorscence |
| US8139831B2 (en)* | 2007-12-06 | 2012-03-20 | Siemens Aktiengesellschaft | System and method for unsupervised detection and gleason grading of prostate cancer whole mounts using NIR fluorscence |
| US8791427B2 (en)* | 2007-12-26 | 2014-07-29 | Olympus Corporation | Biological-specimen observation apparatus |
| US20090166570A1 (en)* | 2007-12-26 | 2009-07-02 | Olympus Corporation | Biological-specimen observation apparatus |
| US20100189338A1 (en)* | 2008-04-09 | 2010-07-29 | Nexcelom Bioscience | Systems and methods for counting cells and biomolecules |
| US7898656B2 (en) | 2008-04-30 | 2011-03-01 | The General Hospital Corporation | Apparatus and method for cross axis parallel spectroscopy |
| US8593619B2 (en) | 2008-05-07 | 2013-11-26 | The General Hospital Corporation | System, method and computer-accessible medium for tracking vessel motion during three-dimensional coronary artery microscopy |
| US9173572B2 (en) | 2008-05-07 | 2015-11-03 | The General Hospital Corporation | System, method and computer-accessible medium for tracking vessel motion during three-dimensional coronary artery microscopy |
| US8861910B2 (en) | 2008-06-20 | 2014-10-14 | The General Hospital Corporation | Fused fiber optic coupler arrangement and method for use thereof |
| US10835110B2 (en) | 2008-07-14 | 2020-11-17 | The General Hospital Corporation | Apparatus and method for facilitating at least partial overlap of dispersed ration on at least one sample |
| US9240043B2 (en) | 2008-09-16 | 2016-01-19 | Novartis Ag | Reproducible quantification of biomarker expression |
| US8682594B2 (en) | 2008-09-20 | 2014-03-25 | The Board Of Trustees Of The Leland Stanford Junior University | Noninvasive diagnosis of fetal aneuploidy by sequencing |
| US9404157B2 (en) | 2008-09-20 | 2016-08-02 | The Board Of Trustees Of The Leland Stanford Junior University | Noninvasive diagnosis of fetal aneuploidy by sequencing |
| US8296076B2 (en) | 2008-09-20 | 2012-10-23 | The Board Of Trustees Of The Leland Stanford Junior University | Noninvasive diagnosis of fetal aneuoploidy by sequencing |
| US9353414B2 (en) | 2008-09-20 | 2016-05-31 | The Board Of Trustees Of The Leland Stanford Junior University | Noninvasive diagnosis of fetal aneuploidy by sequencing |
| US10669585B2 (en) | 2008-09-20 | 2020-06-02 | The Board Of Trustees Of The Leland Stanford Junior University | Noninvasive diagnosis of fetal aneuploidy by sequencing |
| US12054777B2 (en) | 2008-09-20 | 2024-08-06 | The Board Of Trustees Of The Leland Standford Junior University | Noninvasive diagnosis of fetal aneuploidy by sequencing |
| US8195415B2 (en) | 2008-09-20 | 2012-06-05 | The Board Of Trustees Of The Leland Stanford Junior University | Noninvasive diagnosis of fetal aneuploidy by sequencing |
| US20110200240A1 (en)* | 2008-10-23 | 2011-08-18 | Koninklijke Philips Electronics N.V. | Colour management for biological samples |
| US8649581B2 (en)* | 2008-10-23 | 2014-02-11 | Koninklijke Philips N.V. | Colour management for biological samples |
| US8937724B2 (en) | 2008-12-10 | 2015-01-20 | The General Hospital Corporation | Systems and methods for extending imaging depth range of optical coherence tomography through optical sub-sampling |
| US9615748B2 (en) | 2009-01-20 | 2017-04-11 | The General Hospital Corporation | Endoscopic biopsy apparatus, system and method |
| US8097864B2 (en) | 2009-01-26 | 2012-01-17 | The General Hospital Corporation | System, method and computer-accessible medium for providing wide-field superresolution microscopy |
| US9178330B2 (en) | 2009-02-04 | 2015-11-03 | The General Hospital Corporation | Apparatus and method for utilization of a high-speed optical wavelength tuning source |
| US8477208B2 (en)* | 2009-02-25 | 2013-07-02 | Samsung Electronics Co., Ltd. | Digital image processing apparatus to simulate auto-focus, method of controlling the apparatus, and recording medium having recorded thereon a program for executing the method |
| US20100214437A1 (en)* | 2009-02-25 | 2010-08-26 | Samsung Digital Imaging Co., Ltd. | Digital image processing apparatus, method of controlling the apparatus, and recording medium having recorded thereon a program for executing the method |
| US11490826B2 (en) | 2009-07-14 | 2022-11-08 | The General Hospital Corporation | Apparatus, systems and methods for measuring flow and pressure within a vessel |
| US20110052038A1 (en)* | 2009-08-31 | 2011-03-03 | Sony Corporation | Tissue-slice image acquirement and display apparatus, tissue-slice image acquirement and display method, and tissue-slice image acquirement and display program |
| US9110306B2 (en)* | 2009-08-31 | 2015-08-18 | Sony Corporation | Tissue-slice image acquirement and display apparatus, tissue-slice image acquirement and display method, and tissue-slice image acquirement and display program |
| US8759790B2 (en) | 2009-08-31 | 2014-06-24 | Sony Corporation | Fluorescence image producing method, fluorescence image producing apparatus, and fluorescence image producing program |
| US9408539B2 (en) | 2010-03-05 | 2016-08-09 | The General Hospital Corporation | Systems, methods and computer-accessible medium which provide microscopic images of at least one anatomical structure at a particular resolution |
| US9642531B2 (en) | 2010-03-05 | 2017-05-09 | The General Hospital Corporation | Systems, methods and computer-accessible medium which provide microscopic images of at least one anatomical structure at a particular resolution |
| US8804126B2 (en) | 2010-03-05 | 2014-08-12 | The General Hospital Corporation | Systems, methods and computer-accessible medium which provide microscopic images of at least one anatomical structure at a particular resolution |
| US10463254B2 (en) | 2010-03-05 | 2019-11-05 | The General Hospital Corporation | Light tunnel and lens which provide extended focal depth of at least one anatomical structure at a particular resolution |
| US9069130B2 (en) | 2010-05-03 | 2015-06-30 | The General Hospital Corporation | Apparatus, method and system for generating optical radiation from biological gain media |
| US9951269B2 (en) | 2010-05-03 | 2018-04-24 | The General Hospital Corporation | Apparatus, method and system for generating optical radiation from biological gain media |
| US9224031B2 (en)* | 2010-05-21 | 2015-12-29 | Chemometec A/S | Compact dark field light source and dark field image analysis at low magnification |
| US20130129181A1 (en)* | 2010-05-21 | 2013-05-23 | Chemometec A/S | Compact dark field light source and dark field image analysis at low magnification |
| US9557154B2 (en) | 2010-05-25 | 2017-01-31 | The General Hospital Corporation | Systems, devices, methods, apparatus and computer-accessible media for providing optical imaging of structures and compositions |
| US10939825B2 (en) | 2010-05-25 | 2021-03-09 | The General Hospital Corporation | Systems, devices, methods, apparatus and computer-accessible media for providing optical imaging of structures and compositions |
| US9795301B2 (en) | 2010-05-25 | 2017-10-24 | The General Hospital Corporation | Apparatus, systems, methods and computer-accessible medium for spectral analysis of optical coherence tomography images |
| US10285568B2 (en) | 2010-06-03 | 2019-05-14 | The General Hospital Corporation | Apparatus and method for devices for imaging structures in or at one or more luminal organs |
| US9510758B2 (en) | 2010-10-27 | 2016-12-06 | The General Hospital Corporation | Apparatus, systems and methods for measuring blood pressure within at least one vessel |
| US20120140055A1 (en)* | 2010-12-06 | 2012-06-07 | Sony Corporation | Microscope, region determining method, and program |
| CN102540445A (en)* | 2010-12-06 | 2012-07-04 | 索尼公司 | Microscope, region determining method, and program |
| US11199489B2 (en) | 2011-01-20 | 2021-12-14 | Labrador Diagnostics Llc | Systems and methods for sample use maximization |
| US10557786B2 (en) | 2011-01-21 | 2020-02-11 | Theranos Ip Company, Llc | Systems and methods for sample use maximization |
| US9677993B2 (en) | 2011-01-21 | 2017-06-13 | Theranos, Inc. | Systems and methods for sample use maximization |
| US11644410B2 (en) | 2011-01-21 | 2023-05-09 | Labrador Diagnostics Llc | Systems and methods for sample use maximization |
| US10876956B2 (en) | 2011-01-21 | 2020-12-29 | Labrador Diagnostics Llc | Systems and methods for sample use maximization |
| US9464981B2 (en) | 2011-01-21 | 2016-10-11 | Theranos, Inc. | Systems and methods for sample use maximization |
| US8718350B2 (en)* | 2011-04-08 | 2014-05-06 | Regents Of The University Of Minnesota | Computerized methods for tissue analysis |
| US20120257811A1 (en)* | 2011-04-08 | 2012-10-11 | Gregory Metzger | Computerized methods for tissue analysis using n-gene profiling |
| US20120300053A1 (en)* | 2011-05-27 | 2012-11-29 | Olympus Corporation | Image acquisition device |
| US9036020B2 (en)* | 2011-05-27 | 2015-05-19 | Olympus Corporation | Image acquisition device |
| US9330092B2 (en) | 2011-07-19 | 2016-05-03 | The General Hospital Corporation | Systems, methods, apparatus and computer-accessible-medium for providing polarization-mode dispersion compensation in optical coherence tomography |
| US10241028B2 (en) | 2011-08-25 | 2019-03-26 | The General Hospital Corporation | Methods, systems, arrangements and computer-accessible medium for providing micro-optical coherence tomography procedures |
| US20130051644A1 (en)* | 2011-08-29 | 2013-02-28 | General Electric Company | Method and apparatus for performing motion artifact reduction |
| US11162936B2 (en) | 2011-09-13 | 2021-11-02 | Labrador Diagnostics Llc | Systems and methods for multi-analysis |
| US8840838B2 (en) | 2011-09-25 | 2014-09-23 | Theranos, Inc. | Centrifuge configurations |
| US9268915B2 (en) | 2011-09-25 | 2016-02-23 | Theranos, Inc. | Systems and methods for diagnosis or treatment |
| US9719990B2 (en) | 2011-09-25 | 2017-08-01 | Theranos, Inc. | Systems and methods for multi-analysis |
| US12146891B2 (en) | 2011-09-25 | 2024-11-19 | Labrador Diagnostics Llc | United states systems and methods for fluid and component handling |
| US12085583B2 (en) | 2011-09-25 | 2024-09-10 | Labrador Diagnostics Llc | Systems and methods for multi-analysis |
| US10518265B2 (en) | 2011-09-25 | 2019-12-31 | Theranos Ip Company, Llc | Systems and methods for fluid handling |
| US9664702B2 (en) | 2011-09-25 | 2017-05-30 | Theranos, Inc. | Fluid handling apparatus and configurations |
| US10534009B2 (en) | 2011-09-25 | 2020-01-14 | Theranos Ip Company, Llc | Systems and methods for multi-analysis |
| US10371710B2 (en) | 2011-09-25 | 2019-08-06 | Theranos Ip Company, Llc | Systems and methods for fluid and component handling |
| US10557863B2 (en) | 2011-09-25 | 2020-02-11 | Theranos Ip Company, Llc | Systems and methods for multi-analysis |
| US9645143B2 (en) | 2011-09-25 | 2017-05-09 | Theranos, Inc. | Systems and methods for multi-analysis |
| US10627418B2 (en) | 2011-09-25 | 2020-04-21 | Theranos Ip Company, Llc | Systems and methods for multi-analysis |
| US9632102B2 (en) | 2011-09-25 | 2017-04-25 | Theranos, Inc. | Systems and methods for multi-purpose analysis |
| US8435738B2 (en) | 2011-09-25 | 2013-05-07 | Theranos, Inc. | Systems and methods for multi-analysis |
| US9619627B2 (en) | 2011-09-25 | 2017-04-11 | Theranos, Inc. | Systems and methods for collecting and transmitting assay results |
| US9592508B2 (en) | 2011-09-25 | 2017-03-14 | Theranos, Inc. | Systems and methods for fluid handling |
| US8475739B2 (en) | 2011-09-25 | 2013-07-02 | Theranos, Inc. | Systems and methods for fluid handling |
| US10012664B2 (en) | 2011-09-25 | 2018-07-03 | Theranos Ip Company, Llc | Systems and methods for fluid and component handling |
| US10018643B2 (en) | 2011-09-25 | 2018-07-10 | Theranos Ip Company, Llc | Systems and methods for multi-analysis |
| US11524299B2 (en) | 2011-09-25 | 2022-12-13 | Labrador Diagnostics Llc | Systems and methods for fluid handling |
| US9952240B2 (en) | 2011-09-25 | 2018-04-24 | Theranos Ip Company, Llc | Systems and methods for multi-analysis |
| US9128015B2 (en) | 2011-09-25 | 2015-09-08 | Theranos, Inc. | Centrifuge configurations |
| US9250229B2 (en) | 2011-09-25 | 2016-02-02 | Theranos, Inc. | Systems and methods for multi-analysis |
| US10976330B2 (en) | 2011-09-25 | 2021-04-13 | Labrador Diagnostics Llc | Fluid handling apparatus and configurations |
| US11054432B2 (en) | 2011-09-25 | 2021-07-06 | Labrador Diagnostics Llc | Systems and methods for multi-purpose analysis |
| US11009516B2 (en) | 2011-09-25 | 2021-05-18 | Labrador Diagnostics Llc | Systems and methods for multi-analysis |
| US9341783B2 (en) | 2011-10-18 | 2016-05-17 | The General Hospital Corporation | Apparatus and methods for producing and/or providing recirculating optical delay(s) |
| US20130243277A1 (en)* | 2012-03-17 | 2013-09-19 | Sony Corporation | Flourescent dot counting in digital pathology images |
| US8755580B2 (en)* | 2012-03-17 | 2014-06-17 | Sony Corporation | Flourescent dot counting in digital pathology images |
| US9629528B2 (en) | 2012-03-30 | 2017-04-25 | The General Hospital Corporation | Imaging system, method and distal attachment for multidirectional field of view endoscopy |
| US11490797B2 (en) | 2012-05-21 | 2022-11-08 | The General Hospital Corporation | Apparatus, device and method for capsule microscopy |
| US9415550B2 (en) | 2012-08-22 | 2016-08-16 | The General Hospital Corporation | System, method, and computer-accessible medium for fabrication miniature endoscope using soft lithography |
| US9968261B2 (en) | 2013-01-28 | 2018-05-15 | The General Hospital Corporation | Apparatus and method for providing diffuse spectroscopy co-registered with optical frequency domain imaging |
| US10893806B2 (en) | 2013-01-29 | 2021-01-19 | The General Hospital Corporation | Apparatus, systems and methods for providing information regarding the aortic valve |
| US11179028B2 (en) | 2013-02-01 | 2021-11-23 | The General Hospital Corporation | Objective lens arrangement for confocal endomicroscopy |
| US9810704B2 (en) | 2013-02-18 | 2017-11-07 | Theranos, Inc. | Systems and methods for multi-analysis |
| US10478072B2 (en) | 2013-03-15 | 2019-11-19 | The General Hospital Corporation | Methods and system for characterizing an object |
| US9784681B2 (en) | 2013-05-13 | 2017-10-10 | The General Hospital Corporation | System and method for efficient detection of the phase and amplitude of a periodic modulation associated with self-interfering fluorescence |
| US10117576B2 (en) | 2013-07-19 | 2018-11-06 | The General Hospital Corporation | System, method and computer accessible medium for determining eye motion by imaging retina and providing feedback for acquisition of signals from the retina |
| US11452433B2 (en) | 2013-07-19 | 2022-09-27 | The General Hospital Corporation | Imaging apparatus and method which utilizes multidirectional field of view endoscopy |
| US10058250B2 (en) | 2013-07-26 | 2018-08-28 | The General Hospital Corporation | System, apparatus and method for utilizing optical dispersion for fourier-domain optical coherence tomography |
| US9733460B2 (en) | 2014-01-08 | 2017-08-15 | The General Hospital Corporation | Method and apparatus for microscopic imaging |
| US10736494B2 (en) | 2014-01-31 | 2020-08-11 | The General Hospital Corporation | System and method for facilitating manual and/or automatic volumetric imaging with real-time tension or force feedback using a tethered imaging device |
| US10228556B2 (en) | 2014-04-04 | 2019-03-12 | The General Hospital Corporation | Apparatus and method for controlling propagation and/or transmission of electromagnetic radiation in flexible waveguide(s) |
| US10912462B2 (en) | 2014-07-25 | 2021-02-09 | The General Hospital Corporation | Apparatus, devices and methods for in vivo imaging and diagnosis |
| US10324041B2 (en) | 2016-12-21 | 2019-06-18 | Abbott Japan Co., Ltd. | Optical imaging system using lateral illumination for digital assays |
| US11635387B2 (en) | 2016-12-21 | 2023-04-25 | Abbott Japan Co., Ltd | Optical imaging system using lateral illumination for digital assays |
| US11073481B2 (en) | 2016-12-21 | 2021-07-27 | Abbott Japan Llc | Optical imaging system using lateral illumination for digital assays |
| US11047854B2 (en) | 2017-02-06 | 2021-06-29 | Abbott Japan Llc | Methods for reducing noise in signal-generating digital assays |
| US12422429B2 (en) | 2017-02-06 | 2025-09-23 | Abbott Japan Llc | Methods for reducing noise in signal-generating digital assays |
| AU2018313841B2 (en)* | 2017-08-09 | 2023-10-26 | Allen Institute | Systems, devices, and methods for image processing to generate an image having predictive tagging |
| US12008764B2 (en) | 2017-08-09 | 2024-06-11 | Allen Institute | Systems, devices, and methods for image processing to generate an image having predictive tagging |
| WO2019032723A1 (en)* | 2017-08-09 | 2019-02-14 | Allen Institute | Systems, devices, and methods for image processing to generate an image having predictive tagging |
Also Published As
| Publication number | Publication date |
|---|---|
| US20030231791A1 (en) | 2003-12-18 |
Similar Documents
| Publication | Publication Date | Title |
|---|---|---|
| US7272252B2 (en) | Automated system for combining bright field and fluorescent microscopy | |
| US6800249B2 (en) | Automated slide staining apparatus | |
| US20050037406A1 (en) | Methods and apparatus for analysis of a biological specimen | |
| US8712118B2 (en) | Automated measurement of concentration and/or amount in a biological sample | |
| US6631203B2 (en) | Histological reconstruction and automated image analysis | |
| US6418236B1 (en) | Histological reconstruction and automated image analysis | |
| US6546123B1 (en) | Automated detection of objects in a biological sample | |
| US7190818B2 (en) | Method and apparatus for automated image analysis of biological specimens | |
| US20060041385A1 (en) | Method of quantitating proteins and genes in cells using a combination of immunohistochemistry and in situ hybridization | |
| WO2001004828A1 (en) | Automated detection of objects in a biological sample | |
| US20060178833A1 (en) | System for and method of providing diagnostic information through microscopic imaging | |
| HK1051251A (en) | Histological reconstruction and automated image analysis |
Legal Events
| Date | Code | Title | Description |
|---|---|---|---|
| AS | Assignment | Owner name:CHROMAVISION MEDICAL SYSTEMS, INC., CALIFORNIA Free format text:ASSIGNMENT OF ASSIGNORS INTEREST;ASSIGNORS:TORRE-BUENO, JOSE DE LA;MCBRIDE, JAMES;REEL/FRAME:014183/0039 Effective date:20030611 | |
| AS | Assignment | Owner name:CLARIENT INC., CALIFORNIA Free format text:MERGER;ASSIGNOR:CHROMAVISION MEDICAL SYSTEMS, INC.;REEL/FRAME:017240/0641 Effective date:20050315 | |
| AS | Assignment | Owner name:CARL ZEISS MICROIMAGING AIS, INC., NEW YORK Free format text:ASSIGNMENT OF ASSIGNORS INTEREST;ASSIGNOR:CLARIENT, INC.;REEL/FRAME:020072/0662 Effective date:20071016 | |
| FPAY | Fee payment | Year of fee payment:4 | |
| CC | Certificate of correction | ||
| REMI | Maintenance fee reminder mailed | ||
| LAPS | Lapse for failure to pay maintenance fees | ||
| AS | Assignment | Owner name:CARL ZEISS MICROIMAGING GMBH, GERMANY Free format text:ASSIGNMENT OF ASSIGNORS INTEREST;ASSIGNOR:CARL ZEISS MICROIMAGING AIS, INC.;REEL/FRAME:036758/0811 Effective date:20080925 | |
| AS | Assignment | Owner name:CARL ZEISS MICROSCOPY GMBH, GERMANY Free format text:CHANGE OF NAME;ASSIGNOR:CARL ZEISS MICROIMAGING GMBH;REEL/FRAME:036876/0797 Effective date:20120403 | |
| STCH | Information on status: patent discontinuation | Free format text:PATENT EXPIRED DUE TO NONPAYMENT OF MAINTENANCE FEES UNDER 37 CFR 1.362 | |
| FP | Lapsed due to failure to pay maintenance fee | Effective date:20150918 |