US7219034B2 - System and methods for display of time-series data distribution - Google Patents
System and methods for display of time-series data distributionDownload PDFInfo
- Publication number
- US7219034B2 US7219034B2US10/243,534US24353402AUS7219034B2US 7219034 B2US7219034 B2US 7219034B2US 24353402 AUS24353402 AUS 24353402AUS 7219034 B2US7219034 B2US 7219034B2
- Authority
- US
- United States
- Prior art keywords
- quantile
- condensed
- data
- histogram
- function
- Prior art date
- Legal status (The legal status is an assumption and is not a legal conclusion. Google has not performed a legal analysis and makes no representation as to the accuracy of the status listed.)
- Expired - Lifetime, expires
Links
Images


Classifications
- G—PHYSICS
- G06—COMPUTING OR CALCULATING; COUNTING
- G06F—ELECTRIC DIGITAL DATA PROCESSING
- G06F17/00—Digital computing or data processing equipment or methods, specially adapted for specific functions
- G06F17/10—Complex mathematical operations
- G06F17/18—Complex mathematical operations for evaluating statistical data, e.g. average values, frequency distributions, probability functions, regression analysis
- G—PHYSICS
- G06—COMPUTING OR CALCULATING; COUNTING
- G06F—ELECTRIC DIGITAL DATA PROCESSING
- G06F11/00—Error detection; Error correction; Monitoring
- G06F11/30—Monitoring
- G06F11/32—Monitoring with visual or acoustical indication of the functioning of the machine
- G06F11/323—Visualisation of programs or trace data
- G—PHYSICS
- G06—COMPUTING OR CALCULATING; COUNTING
- G06F—ELECTRIC DIGITAL DATA PROCESSING
- G06F11/00—Error detection; Error correction; Monitoring
- G06F11/30—Monitoring
- G06F11/34—Recording or statistical evaluation of computer activity, e.g. of down time, of input/output operation ; Recording or statistical evaluation of user activity, e.g. usability assessment
- G06F11/3452—Performance evaluation by statistical analysis
- Y—GENERAL TAGGING OF NEW TECHNOLOGICAL DEVELOPMENTS; GENERAL TAGGING OF CROSS-SECTIONAL TECHNOLOGIES SPANNING OVER SEVERAL SECTIONS OF THE IPC; TECHNICAL SUBJECTS COVERED BY FORMER USPC CROSS-REFERENCE ART COLLECTIONS [XRACs] AND DIGESTS
- Y10—TECHNICAL SUBJECTS COVERED BY FORMER USPC
- Y10S—TECHNICAL SUBJECTS COVERED BY FORMER USPC CROSS-REFERENCE ART COLLECTIONS [XRACs] AND DIGESTS
- Y10S707/00—Data processing: database and file management or data structures
- Y10S707/99931—Database or file accessing
- Y10S707/99933—Query processing, i.e. searching
- Y10S707/99936—Pattern matching access
- Y—GENERAL TAGGING OF NEW TECHNOLOGICAL DEVELOPMENTS; GENERAL TAGGING OF CROSS-SECTIONAL TECHNOLOGIES SPANNING OVER SEVERAL SECTIONS OF THE IPC; TECHNICAL SUBJECTS COVERED BY FORMER USPC CROSS-REFERENCE ART COLLECTIONS [XRACs] AND DIGESTS
- Y10—TECHNICAL SUBJECTS COVERED BY FORMER USPC
- Y10S—TECHNICAL SUBJECTS COVERED BY FORMER USPC CROSS-REFERENCE ART COLLECTIONS [XRACs] AND DIGESTS
- Y10S707/00—Data processing: database and file management or data structures
- Y10S707/99931—Database or file accessing
- Y10S707/99937—Sorting
- Y—GENERAL TAGGING OF NEW TECHNOLOGICAL DEVELOPMENTS; GENERAL TAGGING OF CROSS-SECTIONAL TECHNOLOGIES SPANNING OVER SEVERAL SECTIONS OF THE IPC; TECHNICAL SUBJECTS COVERED BY FORMER USPC CROSS-REFERENCE ART COLLECTIONS [XRACs] AND DIGESTS
- Y10—TECHNICAL SUBJECTS COVERED BY FORMER USPC
- Y10S—TECHNICAL SUBJECTS COVERED BY FORMER USPC CROSS-REFERENCE ART COLLECTIONS [XRACs] AND DIGESTS
- Y10S707/00—Data processing: database and file management or data structures
- Y10S707/99941—Database schema or data structure
- Y10S707/99942—Manipulating data structure, e.g. compression, compaction, compilation
Definitions
- the inventionrelates to a system and methods for monitoring a set of metrics. More particularly, the invention provides a system and methods for computing and displaying data distribution information for metrics.
- Such data distribution informationgenerally may be viewed as a histogram, and many systems that perform statistical analysis are able to display histograms.
- histogramsare not always useful for discovering trends in data over time, since it may be difficult to see long-term trends in data by viewing a set of standard histograms side-by-side or stacked vertically. Some systems attempt to solve this problem by making the histograms small, and turning them on their side. Unfortunately, even when these steps are taken, it may be difficult to display more than five or six histograms on a single display. It would be impractical in such systems to display fifty or a hundred such histograms in a single display.
- Another difficulty with using histograms to view data distribution information over a long period of timeis the storage of histogram data.
- a large number of individual data samplesare needed to construct a histogram.
- To display histograms for data over a long time periodthere are two options available.
- a systemcan pre-compute the histogram for each required time interval, and save the histogram data.
- This approachrequires many computations and storage of data that may never be used.
- a systemcan save all the individual data points over a long time period, so that histograms can be computed as they are needed.
- This approachrequires a large amount of storage, and may require a large memory footprint and a large amount of computation when the histograms are generated. As a result, this approach may not be practical for long periods of time and large numbers of metrics.
- histogramsare somewhat inflexible. For example, they cannot be effectively averaged or merged to condense the display of several time intervals into a single interval. Similarly, they cannot be effectively averaged or merged from multiple copies of the same metric collected from distinct but similar systems. Such data distribution information may be useful for viewing the health and status of an entire system using only a few displays or screens.
- the present inventionprovides a method for generating an approximate histogram of a data set. This is done by applying a quantile function on the data set to create a computational result, selecting a subset of the data set in response to the computational result, determining a condensed quantile function from the subset of the data set, and rendering the approximate histogram in response to the condensed quantile function.
- the subset of the data setincludes at least one of a minimum value of the data set, a median value of the data set, and a maximum value of the data set.
- determining the condensed quantile functioninvolves interpolating between values in the data set.
- the interpolationincludes at least one of linear interpolation and polynomial interpolation.
- rendering the approximate histograminvolves calculating an expected sample count based at least in part on an inverse of the condensed quantile function.
- the approximate histogramincludes a plurality of bins.
- the rendering stepincludes reducing the plurality of bins in the approximate histogram into a plurality of adjacent cells, and applying an indicium to each cell in response to the percentage of the data set within each cell.
- the indiciumis visually discernable (e.g., a shade, texture, or color of the cell).
- the inventionprovides a method of merging a plurality of data sets with reduced data storage requirements. This is accomplished by calculating a condensed quantile function for each data set, with each condensed quantile function supplying quantile values. Next, the quantile values are interleaved, and an inverse of each condensed quantile function is calculated at each interleaved quantile value. The average of the inverse of the condensed quantile functions at each interleaved quantile value are calculated, and a merged quantile function is defined as an inverse of the average of the inverse of the condensed quantile functions at each interleaved quantile value.
- the plurality of data setsinclude data associated with a single variable from adjacent time intervals. In other embodiments, the plurality of data sets include data associated with a plurality of instances of a single variable from a single time interval.
- Some embodimentsfurther include a step of rendering a merged histogram in response to the merged quantile function.
- rendering the merged histograminvolves calculating an expected sample count based at least in part on an inverse of the merged quantile function.
- the step of rendering the merged histogramincludes reducing a plurality of bins in the merged histogram into a plurality of adjacent cells, and applying an indicium to each cell in response to a percentage of the data set within each cell. In some such embodiments, the indicium is visually discernable.
- the inventionprovides a method of optimizing performance in a distributed transaction system. This is accomplished by collecting data associated with at least one system performance metric, and applying a quantile function on the data to create a computational result. Next, a subset of the data is selected in response to the computational result, and a condensed quantile function is determined from the subset of the data. The method also includes rendering at least one approximate histogram in response to the condensed quantile function, identifying at least one trend in the approximate histogram, and adjusting, on an as-needed basis, operation of the distributed transaction system to modify the trend.
- the methods of the inventioncan be implemented in software, or in logic or other hardware.
- the softwaremay be made available to developers and end users online and through download vehicles. It may also be embodied in an article of manufacture that includes a program storage medium such as a computer disk or diskette, a CD, DVD, or computer memory device.
- FIG. 1shows an example of a system that may be monitored using the system and methods of the invention
- FIG. 2is a block diagram showing a high-level overview of an embodiment of the system and methods of the invention
- FIGS. 3A–3Bshow example plots of data points to be analyzed according to an embodiment of the invention
- FIG. 4shows an example histogram of the data points of FIG. 3B ;
- FIG. 5shows an example estimated probability density function for the data shown in FIG. 3B ;
- FIG. 6shows an example of a normalized estimated probability density function
- FIG. 7shows an example of an estimated cumulative distribution function
- FIG. 8shows an example quantile function estimated from the example data shown in FIG. 3B ;
- FIG. 9shows an example of a condensed estimated quantile function
- FIG. 10shows an example of an approximate histogram that has been reconstructed from the condensed estimated quantile function of FIG. 9 according to an embodiment of the invention
- FIG. 11shows an example histogram of a full set of data points, for comparison with the estimated histogram of FIG. 10 ;
- FIG. 12is a block diagram of a method for generating an approximate histogram in accordance with an embodiment of the invention.
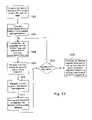
- FIG. 13is a flowchart of an adaptive fit algorithm that may be used according to an embodiment of the invention to choose the points for a condensed quantile tables;
- FIG. 14illustrates the rendering of the data of an approximate histogram as a stack-bar histogram, in accordance with an embodiment of the invention
- FIG. 15shows numerous stack-bar histograms arranged in a single display, in accordance with an embodiment of the invention.
- FIG. 16shows a time-series of stack-bar histograms with the data from which the stack-bar histograms were generated overlaid, to verify the accuracy of stack-bar histograms;
- FIG. 17shows a display of an example embodiment of a monitoring system that uses stack-bar histograms, according to an embodiment of the present invention
- FIG. 18is an example showing a merged sample quantile function, as well as quantile functions of two original data sets, and of the joined data from the two original data sets according to an embodiment of the invention
- FIG. 19shows an example in which stack bar histograms are merged to form a new stack-bar histogram according to an embodiment of the invention
- FIG. 20shows a merged stack-bar histogram chart with data points overlaid, to verify the accuracy of the merged stack-bar histogram chart
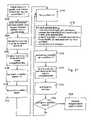
- FIG. 21is a flowchart of an algorithm for merging quantile functions according to an embodiment of the invention.
- the inventionmay be embodied in a system that collects, analyzes, and reports performance metrics for systems such as, for example, complex transaction-based structures typified by (but not limited to) e-commerce systems.
- the inventionrelates to the monitoring of a set of system performance metrics, such as transaction response time, throughput, availability, etc.
- the systemreceives metric data and generates and displays a set of “approximate histograms” from the quantile function of a time series segment.
- An approximate histogramis an estimation of the histogram of an original (i.e., complete) data set.
- an embodiment of the inventionIn addition to generating “approximate histograms,” an embodiment of the invention also displays a set of histograms for successive time intervals using a set of offset stacked bar charts.
- the resulting displayprovides a useful visual tool for tracking changes in the central values of a metric and for detecting subtle changes in its frequency distribution over long time scales. Due to the use of approximate histograms, this is accomplished without the need to store a large number of individual samples over long periods of time.
- an end userBased on the data monitored and displayed, an end user is able to identify trends and other indicia (e.g., threshold alarm notification) of system performance.
- the information displayede.g., response time, throughput, and availability
- system and methods of the present inventionare described herein as applying to software for use by a system manager, such as an e-business system manager, to assist, for example, in the achievement and maintenance of Service Level Agreements in terms of system performance. It will be understood that the system and methods of the present invention are not limited to this application, and can be applied to the storage and display of histogram data in most any system whose operation can be described through use of a set of system metrics.
- FIG. 1shows an example of a system 100 that may be monitored using the system and methods of the present invention.
- Various system metricsare collected on one or more of monitored systems 102 , 104 , and 106 . These metrics are then sent via a network or other communications means to analysis system 108 . On analysis system 108 , the metrics are analyzed and displayed in accordance with the system and methods of the invention.
- Data collection module 202collects metric data from numerous sources, and makes the metric data available to approximate histogram generation module 204 . It will be understood that data collection module 202 may be a part of a larger metric collection and analysis system, and that generally, the system and methods of the invention may be built in to such a collection and analysis system. Alternatively, the system and methods of the invention may be implemented in software that interoperates with a metric data collection and analysis system, without being integrated into the metric data collection and analysis system.
- Approximate histogram generation module 204uses the methods detailed below to generate approximate histograms for the data. Using these techniques, it is possible to store histogram data over a long period of time without requiring large amounts of storage space. As will be described in detail below, this is done by generating and storing condensed quantile tables, from which approximate histograms for the data may be generated. Approximate histogram generation module 204 is able to aggregate histogram data by merging the condensed quantile tables.
- Histogram display module 206displays histogram data as “stack-bar” histograms, which will be described in detail below. Use of these stack-bar histograms permits multiple histograms to be displayed at once without requiring a large amount of screen space. Additionally scaled stack-bar histograms can be displayed for multiple time intervals, permitting an operator to view trends in the histogram data associated with a metric.
- data collection module 202collects N Data points for a metric over each time interval T.
- FIG. 3Bshows an expanded view of the 180 data points in time interval 302 , which is highlighted in FIG. 3A .
- the data shown in FIGS. 3A and 3Bwill be used throughout the following examples.
- This sectionpresents a method for generating an approximate histogram from the quantile function of a condensed data set. This is useful as a data compression technique because a small number of data points from the quantile function can retain much information about the distribution of a data set. As will be described, a histogram can be re-constructed from the condensed quantile points. Such a re-constructed histogram is referred to as an approximate histogram.
- the histogramIn general, four basic functions are involved in generating the approximate histogram: the histogram, the probability density function, the cumulative distribution function and the quantile function. The relationship between these functions provides a basis for the method, as described below.
- FIG. 4shows a histogram 400 of the data points shown in FIG. 3B .
- a histogramis a plot of the frequency distribution of values within a given range.
- the histogram 400is divided into bins of equal width.
- the height of each binrepresents the number of point values that fall between the minimum and maximum limits for that bin. Generating such a histogram is typically accomplished by determining the number of bins, determining the minimum and maximum limits for each bin, and determining which bin each data point would be in, based on the minimum and maximum limits.
- PDF 500for the data of FIG. 3B is shown, superimposed on the histogram 400 .
- the PDF 500can be estimated by constructing a smooth curve that passes through the top of the histogram bins. The distribution of the data in this example does not follow either a Gaussian distribution or any other simple mathematical form.
- FIG. 6shows the normalized estimated PDF 600 , scaled so that the total area under the curve equals 1.0.
- FIG. 7shows the estimated cumulative distribution function (CDF) 700 of the example data.
- the CDF 700F(v) gives the probability that a sample random variable v i will be less than the given value v.
- F(v)can be viewed as the portion of a large sample set of the random variable x that will be less than v.
- the CDF 700is computed as the integral of the PDF:
- an estimated histogram of the underlying datacan be generated from the CDF.
- N jN* ( F ( vh j ) ⁇ F ( vl j )) (Eq. 3)
- FIG. 8shows the quantile function 800 estimated from the example data of FIG. 3B .
- a quantile functionsuch as that shown in FIG. 8 can model any arbitrary distribution.
- the quantile functionmaps a probability p, to a value v, such that p is the probability that a value v k taken from a similar data set will be less than v.
- Q ( p )F ⁇ 1 ( p ) (Eq. 4)
- a condensed quantile functionmay be generated by selecting a subset of the data points from the quantile function. For example, 13 points may be selected from the complete data set, including the minimum, median and maximum values.
- the quantile function 800 of FIG. 8the values might be:
- FIG. 9shows a condensed estimated quantile function 900 plotted from the 13 quantile points shown above.
- the shape of the condensed quantile function shown in FIG. 9is close to the shape of the quantile function shown in FIG. 8 , which was based on the full 180 data points.
- an estimated histogrammay be generated from a CDF, which is the inverse of the quantile function.
- an approximate histogrammay be generated based on the inverse of the condensed estimated quantile function.
- FIG. 10shows a histogram 1000 that has been reconstructed from the condensed estimated quantile function of FIG. 9 .
- the histogram bin limitsare equally spaced between the 5% and 95% quantile points.
- FIG. 11shows a similar histogram 1100 (with bins equally spaced between the 5% and 95% quantile points) for the full set of data points.
- the shape of the reconstructed histogram 1000 of FIG. 10is similar to the shape of the histogram 1100 based on the original data, shown in FIG. 11 .
- the histogram 1100 in FIG. 11has a different appearance than the histogram 400 in FIG. 4 , even though they are based on the same data. This is because the 16 bin limits in FIG. 4 are evenly spaced between the minimum and maximum values whereas the 8 bin limits in FIG. 11 are evenly spaced between the 5% and 95% quantile points for comparison with the reconstructed approximate histogram 1000 shown in FIG. 10 .
- a high-level block diagram of a method 1200 for generating an approximate histogramis shown.
- an estimated quantile function for the datais generated from the individual samples in a time interval.
- a condensed quantile tableis produced from the estimated quantile function by choosing a relatively small number of points from the estimated quantile function.
- the condensed quantile tablemay be stored in the quantile table store 1250 , which may be a file, a database, or any other form of storage.
- a condensed quantile tablewhich optionally may be read from quantile table store 1250 , is used to generate an approximate histogram.
- the systemgenerates an estimated quantile function from the samples of a time interval.
- the estimated quantile functionassociates a value (v), with the portion (p) of all values that are less than v.
- the portion (p)is an estimate of the probability that a randomly chosen value (v k ) will be less than the value (v).
- the quantile functiontakes the probability or portion (p) as input and returns the value (v).
- the estimated quantile functionmay be constructed, for example, by sorting the set of values (v i ) into ascending order. This may be done incrementally as the data is collected using, for example, an insertion sort. If the data is already available it may be sorted efficiently with any number of standard techniques including Quicksort or with a merge sort, depending on the sorting performance and stability sought.
- This processwill produce a set of N (p i , v i ) pairs, where the p i values are evenly spaced. These (p i , v i ) pairs form an estimated quantile function for the data.
- step 1204to reduce storage requirements, in accordance with and embodiment of the invention, only some of the sample quantile function points are stored as a condensed quantile table. To maintain the maximum amount of information, these points, or sub-samples could be more closely spaced where the quantile function has high curvature, and farther apart where there is less curvature. An algorithm to select such sub-samples will be described in detail below, with reference to FIG. 13 .
- a strategy for selecting sub-samples that will work for many applicationsis to evenly space the sub-samples. This also eliminates the need to store the probabilities, since they are implicit (i.e., they are evenly spaced).
- ps kmay be chosen.
- indices of the sub-samplesmay be chosen as follows:
- dp⁇ 1 / ( M - 1 )
- ps 0⁇ dp / 2
- the value of the middle quantile pointmay be set to Q(0.5).
- the middle indexis (M ⁇ 1)/2.
- the sub-sample probabilities (ps k )will not correspond to the original sample probabilities (p i ). For example if ps equals 0.5 and there are an even number of samples N, then Q(0.5) will be the average of sample v N/2 ⁇ 1 and v N/2 . So Q(ps) must be calculated by interpolation for any (ps) that falls between two points in the estimated quantile function table.
- the value of the quantile function Q(ps)can be calculated from the estimated quantile table (i.e., the (p i , v i ) pairs) by interpolation.
- Q(ps)is then computed using known linear interpolation techniques to interpolate a result between v i0 and v i1 . If required, polynomial interpolation could be used for higher precision.
- the condensed quantile tablecan be constructed with little loss of accuracy by choosing samples of v i corresponding to the required probabilities p i .
- p i( i+ 0.5)/ N
- the corresponding quantile value error introducedis less than or equal to one-half of the maximum difference between two successive values, v i , v i+1 .
- the estimated quantile functioncondensed or not condensed, represents a set of samples that are an estimate of the inverse of the Cumulative Probability Distribution Function F(v) of the underlying data set.
- the approximate histogramis computed. This is done by finding the inverse of the condensed estimated quantile function, which is represented by the condensed quantile table, and using the inverse (which is an approximate CDF) to produce the approximate histogram.
- the inverse of the quantile functionis used, evaluated at both bin limits.
- the inverse of the quantile functionis the probability that a randomly chosen value V k will be less than V.
- NjN *( Q ⁇ 1 ( vh j ) ⁇ Q ⁇ 1 ( vl j ))
- the histogramcan be formed as the set of Nj computed using this formula.
- the set bin limits (vl, vh)are established at equal intervals over a reasonable range of values. For example, these could be from the lowest quantile point to the highest, or a certain number of inter-quantile ranges (IQR's) around the median.
- IQR'sinter-quantile ranges
- the inverse of the quantile functioncan be computed efficiently with a binary search method. This is because the quantile function is monotonic. Given a table of quantile function values (ps j , vs j ), and a value (v) it is possible to find Q ⁇ 1 (v) using the following procedure (provided as pseudocode):
- FIG. 13shows a flowchart for an adaptive fit algorithm 1300 , which may be used in step 1204 , to choose the points for a condensed quantile table.
- the adaptive fit algorithmchooses subsamples from the estimated quantile table such that the subsamples are closely spaced where the quantile function has high curvature, and are spaced farther apart where there is less curvature.
- the adaptive fit algorithm 1300takes an estimated quantile table (Q), which includes a set of pairs (pi, vi), where i is from 1 to N.
- Qestimated quantile table
- a goalis to generate a condensed quantile table, including a set of K pairs (ps j , vs j ), where j is from 1 to K, and K is much less than N.
- the condensed quantile functionwill closely approximate Q, so that the condensed quantile table retains most of the information in the larger estimated quantile table.
- step 1302a line is created between the first point in the quantile table and the last point, using the p and v values as x and y coordinates, respectively.
- step 1304the system computes the perpendicular distance between each quantile point and the line that was created in step 1302 (i.e., the distance between the line and the point along a linear path that runs perpendicular to the line).
- the line and the point that has the maximum perpendicular distance from the lineare recorded in a segment list. Additionally, the “current” segment is set to this line.
- step 1306the system creates two line segments from the “current” segment.
- the first of these line segmentsextends from the first point of the “current” segment to P, the point along the “current” segment having the maximum perpendicular distance from the “current” segment.
- the second segmentextends from P to the last point of the “current” segment.
- step 1308for each of the two line segments created in step 1306 , the system computes the perpendicular distance between each point on that segment and the line between the first point of the segment and the last point of the segment. The system records the location of the point that has the maximum distance from the line segment.
- step 1310the system removes the “current” segment from the segment list, and inserts in its place the two new segments, each of which consists of a line, and a most distant point.
- step 1312the system finds the segment in the segment list that has the largest maximum point distance, and makes this segment the “current” segment. The system then repeats steps 1306 – 1312 until the segment list has K ⁇ 1 segments (step 1314 ).
- the systemgenerates a K point condensed quantile table by taking from the segment list the first point of the first segment, followed by the last points of the K ⁇ 1 segments in the segment list, in order.
- this condensed quantile tablecan be used to generate an approximate histogram.
- the approximate histograms that are generated by the above-described methodsmay be used for many of the same purposes for which a normal histogram may be used.
- the amount of information needed to generate an approximate histogramis considerably less than what is needed to generate a regular histogram, and approximate histograms may be quickly generated from condensed quantile tables, use of approximate histograms may be used in instances where use of a regular histogram would be impractical.
- approximate histogramsmay be used to create stack-bar histograms, which permit numerous histograms to be displayed on a single screen.
- the ability to display numerous histograms on a single screenpermits a viewer to see trends in the data that would not have been readily ascertainable without such a display.
- FIG. 14illustrates the conversion of an approximate histogram into a stack bar histogram.
- the first and last bins of histogram 1402are removed to create histogram 1404 .
- the height of each bin in histogram 1404determines a shade, texture, color, or other visual indicium that is applied to represent that bin.
- light shades or texturesgenerally represent a bin with fewer entries, while dark shades or textures represent a bin with many entries.
- the shades, textures, or colors that represent the binsare then arranged as a set of vertical cells to form stack bar histogram 1406 .
- Stack bar histogram 1406represents a data distribution using shades, textures, or colors, rather than using the height of bars to show the number of items in each bin.
- stack bar histogramsare more compact than a regular representation of a histogram, numerous such stack bar histograms may be arranged in a single display.
- FIG. 15shows numerous stack-bar histograms arranged in a single display.
- stack-bar histogram 1406from FIG. 14 , is the seventh stack-bar histogram of sixteen that are shown in display 1502 .
- the relative vertical positions and heights of the stack-bar histograms shown in display 1502reflect the upper and lower limits of the data represented by the individual histograms.
- each of the stack-bar histograms in display 1502includes a boundary, such as dark line 1504 in stack-bar histogram 1406 , which indicates the median of the data that is represented by the stack-bar histogram.
- Displaying numerous stack-bar histograms side-by-side, as shown in display 1502makes it easy to track shifts in the mean, and in the shape of the distribution. For example, in display 1502 , it is easy to see that the mean of the metric tended upward at first, and then leveled off. It can also be seen that the distribution varied from one where most of the values were evenly distributed about the median to others where most of the values concentrated near the lower or higher end of the range.
- FIG. 16shows a time series of stack-bar histograms, such as is shown in FIG. 15 , with the data from which the histograms were generated overlaid on the stack-bar histograms.
- Display 1602shows that the stack-bar histograms are accurate representations of where the data is concentrated, and that they reasonably show the spread in each time interval, reflecting the shape and trend of the original data.
- the darker shaded or textured areas of the stack-bar histograms in display 1602correctly indicate the heavy concentrations of data points, and the lighter shaded or textured areas correctly indicate the light concentrations of data points. Because the stack-bar histograms show the 5%–95% values of the data, the actual minimum and maximum limits of the data can be seen, and can be read from the vertical scale of display 1602 .
- FIG. 17shows a display 1702 of an exemplary embodiment of a monitoring system that uses stack-bar histograms, in accordance with the principles of the invention.
- the main area 1704 of display 1702shows 48 stack-bar histograms, representing twelve hours of data, at fifteen minute intervals.
- Options for main area 1704are controlled by option select buttons 1706 , which include options for showing stack-bar histograms, for showing extreme values (min and max), for showing limits, which may be dynamically computed, for showing the median, and for showing certain key metric event indicators, and root cause indicators. Other options may also be included in option select buttons 1706 .
- Display 1702also includes statistics area 1708 , in which the minimum, maximum, median, and 5 th and 95 th percentiles for a currently selected interval are shown.
- Limits area 1710upper and lower dynamic limits, such as those described in commonly owned, co-pending U.S. patent application Ser. No. 10/198,689, filed on Jul. 18, 2002, are shown.
- Histogram area 1712displays a regular histogram for the currently selected area, and permits a user to view information including the range and count in each bin of the histogram by placing the cursor over the bars that represent the bins of the histogram.
- display 1702is an example of one display screen that uses stack-bar histograms, and that many variations are possible.
- stack-bar histogramsmay be used in any system in which it is desirable to simultaneously display data distribution information over numerous related sets of data.
- a single merged quantile functionmay be produced.
- the resulting quantile functionis approximately the same as that which would have been created if the two original data sets were merged and the quantile function of the resulting data set was computed.
- the total range and distribution of the two data setsis preserved.
- FIG. 18shows an example of merged sample quantile function 1802 , sample quantile function of the joined data 1804 , and sample quantile functions 1806 and 1808 of the two original data sets. This merging technique is easily extended to the merging of multiple quantile functions.
- FIG. 19shows an example in which stack-bar histograms 1902 , which are the same as the stack-bar histograms shown in FIG. 15 , are merged using the above-described method to form stack-bar histograms 1904 .
- Stack-bar histograms 1904are formed by merging every two quantile tables of stack-bar histograms 1902 .
- FIG. 20shows the new condensed stack-bar chart with a data point overlay, demonstrating the accuracy of this method of graphic generation from merged quantile function tables.
- the merged stack-bar histogramsare based on the estimated histograms of the merged data sets. As can be seen, these merged estimated histograms preserve the distribution information of the combined data.
- FIG. 21shows a flowchart of a fast algorithm 2100 for merging quantile functions.
- the inverse of the quantile functionis evaluated for each quantile table at values spread over the total range of all the quantile tables.
- a performance improvementmay be obtained by noting that the inverses can be evaluated on a sorted set of values, where each value is greater than the previous.
- the current valuecan be found by searching ahead from the point at which the last value was found. This may be on the current interval between two table entries, or on the next interval between two table entries.
- the algorithmoperates on a set of K quantile tables, and produces a merged quantile table.
- indexArrayan array of K quantile table indices (indexArray) are created, and each index is set to 1.
- step 2104the smallest minimum (setMin) and the largest maximum (setMax) are found over all the quantile tables that are being merged.
- the maximum number of points for the merged quantile tableis set to a “reasonable” value, M.
- Mmay be the sum of the number of points in each quantile table, the average number of points in each quantile table, or a value between these two.
- the systemcreates an empty array of M values to hold the result of merging the quantile tables (mergedQuantile).
- step 2110the system sets a variable (deltaV) representing the change in value for each step to the difference between setMax and setMin, divided by the number of merged quantile points, M.
- step 2112the system sets the current value (currValue) to setMin plus delta V.
- step 2114the system sets the value of a variable, probSum, to zero, to begin accumulation for an average.
- step 2116for each quantile table (i) in the set of quantile tables being merged, the system increments indexArray[j] until currValue is between the indexArray[j] and indexArray[j]+1 entries in the quantile table. The system then linearly interpolates on this interval to estimate the probability (p) associated with the value currValue, given the interval endpoints. The result, p, is an estimate of the inverse quantile function Q ⁇ 1 (currValue). The probability, p, is then accumulated into probSum.
- step 2118the average cumulative probability, cp, is computed as probSum divided by K.
- step 2120the system saves the pair ⁇ cp, currValue ⁇ as the next point in the merged quantile table, mergedQuantile.
- step 2122deltaV is added to currValue, and steps 2114 through 2122 are repeated until currValue reaches setMax ⁇ deltaV (step 2124 ).
- step 2126the table mergedQuantile holds the resulting merged quantile table.
- FIGS. 1 , 2 , 12 , 13 , and 21are block diagrams, the enumerated items are shown as individual elements. In actual implementations of the invention, however, they may be inseparable components of other electronic devices such as a digital computer. Thus, actions described above may be implemented in software that may be embodied in an article of manufacture that includes a program storage medium.
Landscapes
- Engineering & Computer Science (AREA)
- Physics & Mathematics (AREA)
- Data Mining & Analysis (AREA)
- Theoretical Computer Science (AREA)
- General Physics & Mathematics (AREA)
- Mathematical Optimization (AREA)
- Pure & Applied Mathematics (AREA)
- General Engineering & Computer Science (AREA)
- Mathematical Physics (AREA)
- Mathematical Analysis (AREA)
- Computational Mathematics (AREA)
- Bioinformatics & Cheminformatics (AREA)
- Probability & Statistics with Applications (AREA)
- Operations Research (AREA)
- Algebra (AREA)
- Bioinformatics & Computational Biology (AREA)
- Databases & Information Systems (AREA)
- Software Systems (AREA)
- Evolutionary Biology (AREA)
- Life Sciences & Earth Sciences (AREA)
- Quality & Reliability (AREA)
- Image Generation (AREA)
- Complex Calculations (AREA)
Abstract
Description
f(v)=0.000058556v9−0.00353074v8+0.14075v7−3.89408v6+76.2797v5−1057.71v4+10172.4v3−64611.8v2+243906.0v−414515
- A possible resulting polynomial for the
CDF 700 is:
F(v)=5.8556×10⁻⁶v10−0.000392304v9+0.0175938v8−0.556297v7+12.7133v6−211.542v5+2543.09v4−21537.3v3+121953v2−414515v
- A possible resulting polynomial for the
P(vl<v≦vh)=F(vh)−F(vl) (Eq. 2)
- Where:
- F(v) is the CDF;
- vh is the upper bin limit; and
- vl is the lower bin limit.
- Where:
Nj=N*(F(vhj)−F(vlj)) (Eq. 3)
- Where:
- Njis the expected number of samples in the jthbin;
- N is the total number of data points;
- F(v) is the CDF;
- vhjis the upper bin limit for the jthbin; and
- vljis the lower bin limit for the jthbin.
- Where:
v=Q(p)vsuch thatP(vk≦v)=p.
Q(p)=F−1(p) (Eq. 4)
| P | V | |
| Min | 12.9587 | |
| 0.05 | 13.6785 | |
| 0.15 | 14.2774 | |
| 0.25 | 14.5957 | |
| 0.35 | 15.0723 | |
| 0.45 | 15.4357 | |
| 0.50 | 15.6944 | Median |
| 0.55 | 15.9530 | |
| 0.65 | 17.2503 | |
| 0.75 | 23.4571 | |
| 0.85 | 24.4150 | |
| 0.95 | 25.8885 | |
| Max | 28.5020 | |
- Where P is an estimate of the probability that a randomly chosen value (vk) will be less than the value V.
v=Q(P)vsuch thatP(vk≦v)=p.
pi=(i+0.5)/N (Eq. 5)
- Where:
- i=the index (0 to N−1) of the sample in the sorted list; and
- N=the total number of values
- Where:
- Where:
- dp=the change in the sub-sample probability for each of the (evenly spaced) psj;
- ps0=the first sub-sample probability;
- psj=the sub-sample probabilities, where j=0 to M−1; and
- vsj=the sub-sample quantile values, where j=0 to M−1.
- Where:
| ps0= | 0.05 | vs0= | Q(0.05) | |||
| ps1= | 0.15 | vs1= | Q(0.15) | |||
| ps2= | 0.25 | vs2= | Q(0.25) | |||
| ps3= | 0.35 | vs3= | Q(0.35) | |||
| ps4= | 0.45 | vs4= | Q(0.45) | |||
| ps5= | 0.50 | vs5= | Q(0.50) | Median | ||
| ps6= | 0.55 | vs6= | Q(0.55) | |||
| ps7= | 0.65 | vs7= | Q(0.65) | |||
| ps8= | 0.75 | vs8= | Q(0.75) | |||
| ps9= | 0.85 | vs9= | Q(0.85) | |||
| ps10= | 0.95 | vs10= | Q(0.95) | |||
pi=(i+0.5)/N
The indices (i0,i1) that correspond to the interval containing (ps) can be found as follows:
i0=IntegerPart(ps*N−0.5) (Eq. 6)
i1=i0+1 (Eq. 7)
pi=(i+0.5)/N
the index of the value closest to Q(ps) is:
i=Round(ps*N−0.5)
- Where the Round function rounds its input up if the fractional part of the input is 0.5 or larger, or down if the fractional part of the input is less than 0.5.
ep<=0.5/N.
| ps0= | 0.05 | vs0= | Q(0.05) | = (v44+ v45)/2 | |
| ps1= | 0.15 | vs1= | Q(0.15) | = (v134+ v135)/2 | |
| ps2= | 0.25 | vs2= | Q(0.25) | = (v224+ v225)/2 | |
| ps3= | 0.35 | vs3= | Q(0.35) | = (v314+ v315)/2 | |
| ps4= | 0.45 | vs4= | Q(0.45) | = (v404+ v405)/2 | |
| ps5= | 0.50 | vs5= | Q(0.50) | = (v449+ v450)/2 | Median |
| ps6= | 0.55 | vs6= | Q(0.55) | = (v494+ v495)/2 | |
| ps7= | 0.65 | vs7= | Q(0.65) | = (v584+ v585)/2 | |
| ps8= | 0.75 | vs8= | Q(0.75) | = (v674+ v675)/2 | |
| ps9= | 0.85 | vs9= | Q(0.85) | = (v764+ v765)/2 | |
| ps10= | 0.95 | vs10= | Q(0.95) | = (v854+ v855)/2 | |
F(v)=Q−1(v)=P(vk≦v).
P(vl<v≦vh)=Q−1(vh)−Q−1(vl)
Nj=N*(Q−1(vhj)−Q−1(vlj))
| Repeat until pmidconverges on Q31 1(v): | ||
| While Δp > Δmin: |
| pmid= (pmin+ pmax)/2 | |
| Δp = pmax− pmin | |
| v′ = Q(pmid) | |
| // note - if v′ < then Q−1(v) > Pmid, else Q−1(v) < pmid | |
| If (v′ < v) |
| pmin= pmid |
| Else |
| pmax= pmid |
| End-if |
| End-while |
| Return pmid | ||
| Where: | ||
| v is the input value − the code computes Q−1(v); | ||
| Δmin is a constant representing the required precision (e.g., 0.00001); | ||
| pminis the minimum probability to check (typically initialized to 0.0); | ||
| pmaxis the maximum probability to check (typically initialized to 1.0); | ||
| pmidis the current estimated probability; | ||
| Δp is the change in probability (typically initialized to 1.0); and | ||
| v′ is the quantile value corresponding to pmid. | ||
| Note | ||
| When this procedure is complete, pmidcontains an estimate of Q−1(v) to within Δmin. | ||
Qm−1(vi)=(Qa−1(vi)+Qb−1(vi))/2
Claims (17)
Priority Applications (2)
| Application Number | Priority Date | Filing Date | Title |
|---|---|---|---|
| US10/243,534US7219034B2 (en) | 2001-09-13 | 2002-09-13 | System and methods for display of time-series data distribution |
| US11/832,319US7444263B2 (en) | 2002-07-01 | 2007-08-01 | Performance metric collection and automated analysis |
Applications Claiming Priority (2)
| Application Number | Priority Date | Filing Date | Title |
|---|---|---|---|
| US32202101P | 2001-09-13 | 2001-09-13 | |
| US10/243,534US7219034B2 (en) | 2001-09-13 | 2002-09-13 | System and methods for display of time-series data distribution |
Related Parent Applications (1)
| Application Number | Title | Priority Date | Filing Date |
|---|---|---|---|
| US10/198,689Continuation-In-PartUS7076695B2 (en) | 2001-07-20 | 2002-07-18 | System and methods for adaptive threshold determination for performance metrics |
Related Child Applications (1)
| Application Number | Title | Priority Date | Filing Date |
|---|---|---|---|
| US11/832,319Continuation-In-PartUS7444263B2 (en) | 2002-07-01 | 2007-08-01 | Performance metric collection and automated analysis |
Publications (2)
| Publication Number | Publication Date |
|---|---|
| US20030088542A1 US20030088542A1 (en) | 2003-05-08 |
| US7219034B2true US7219034B2 (en) | 2007-05-15 |
Family
ID=26935927
Family Applications (1)
| Application Number | Title | Priority Date | Filing Date |
|---|---|---|---|
| US10/243,534Expired - LifetimeUS7219034B2 (en) | 2001-09-13 | 2002-09-13 | System and methods for display of time-series data distribution |
Country Status (1)
| Country | Link |
|---|---|
| US (1) | US7219034B2 (en) |
Cited By (35)
| Publication number | Priority date | Publication date | Assignee | Title |
|---|---|---|---|---|
| US20040246512A1 (en)* | 2002-02-18 | 2004-12-09 | Ryosuke Miyamoto | Image processing apparatus, information processing apparatus, and information output method |
| US20050002565A1 (en)* | 2003-07-04 | 2005-01-06 | Ed-Tech Co., Ltd. | Apparatus and method for controlling brightness of moving image signals in real time |
| US20050289232A1 (en)* | 2004-06-07 | 2005-12-29 | Rudiger Ebert | Method, apparatus, and system for monitoring performance remotely from a user |
| US20070156479A1 (en)* | 2005-11-02 | 2007-07-05 | Long Erik T | Multivariate statistical forecasting system, method and software |
| US20080016412A1 (en)* | 2002-07-01 | 2008-01-17 | Opnet Technologies, Inc. | Performance metric collection and automated analysis |
| US20090138238A1 (en)* | 2007-11-28 | 2009-05-28 | Yury Bakshi | Sequential fixed-point quantile estimation |
| US20100030517A1 (en)* | 2006-11-28 | 2010-02-04 | Rohde & Schwarz Gmbh & Co. Kg | Method and device for the determination of a statistical measurement value |
| US20100053313A1 (en)* | 2003-10-02 | 2010-03-04 | Eli Horn | System and method for presentation of data streams |
| US20100174540A1 (en)* | 2007-07-13 | 2010-07-08 | Dolby Laboratories Licensing Corporation | Time-Varying Audio-Signal Level Using a Time-Varying Estimated Probability Density of the Level |
| US20100292995A1 (en)* | 2009-05-18 | 2010-11-18 | Tian Bu | Method and apparatus for incremental quantile estimation |
| US20100332494A1 (en)* | 2009-06-25 | 2010-12-30 | Goetz Graefe | Histogram processing by trend and pattern removal |
| US20110010337A1 (en)* | 2009-07-10 | 2011-01-13 | Tian Bu | Method and apparatus for incremental quantile tracking of multiple record types |
| US20110153603A1 (en)* | 2009-12-17 | 2011-06-23 | Yahoo! Inc. | Time series storage for large-scale monitoring system |
| US20110154340A1 (en)* | 2009-12-18 | 2011-06-23 | Fujitsu Limited | Recording medium storing operation management program, operation management apparatus and method |
| US7979406B2 (en) | 2008-06-16 | 2011-07-12 | International Business Machines Corporation | Compress transaction data using serial micro-trends |
| US20110179360A1 (en)* | 2010-01-19 | 2011-07-21 | Livevol Inc. | System and method for presenting option data using animated 3-dimensional graphical display |
| US20110218978A1 (en)* | 2010-02-22 | 2011-09-08 | Vertica Systems, Inc. | Operating on time sequences of data |
| US8290962B1 (en)* | 2005-09-28 | 2012-10-16 | Google Inc. | Determining the relationship between source code bases |
| US20130019197A1 (en)* | 2011-07-11 | 2013-01-17 | International Business Machines Corporation | Displaying computer dashboard information |
| US8600915B2 (en) | 2011-12-19 | 2013-12-03 | Go Daddy Operating Company, LLC | Systems for monitoring computer resources |
| US20130325825A1 (en)* | 2012-05-29 | 2013-12-05 | Scott Pope | Systems And Methods For Quantile Estimation In A Distributed Data System |
| US8719196B2 (en) | 2011-12-19 | 2014-05-06 | Go Daddy Operating Company, LLC | Methods for monitoring computer resources using a first and second matrix, and a feature relationship tree |
| US8873816B1 (en) | 2011-04-06 | 2014-10-28 | Given Imaging Ltd. | Method and system for identification of red colored pathologies in vivo |
| US20160078654A1 (en)* | 2014-09-17 | 2016-03-17 | Circonus, Inc. | Efficient time-series histograms |
| US9324145B1 (en) | 2013-08-08 | 2016-04-26 | Given Imaging Ltd. | System and method for detection of transitions in an image stream of the gastrointestinal tract |
| US20160203188A1 (en)* | 2013-09-04 | 2016-07-14 | Allinea Software Limited | Analysis of Parallel Processing Systems |
| US9507833B2 (en) | 2012-05-29 | 2016-11-29 | Sas Institute Inc. | Systems and methods for quantile determination in a distributed data system |
| US9538937B2 (en) | 2008-06-18 | 2017-01-10 | Covidien Lp | System and method of evaluating a subject with an ingestible capsule |
| US9545192B2 (en) | 2012-05-04 | 2017-01-17 | Given Imaging Ltd. | System and method for automatic navigation of a capsule based on image stream captured in-vivo |
| US9703852B2 (en) | 2012-05-29 | 2017-07-11 | Sas Institute Inc. | Systems and methods for quantile determination in a distributed data system using sampling |
| US9747642B1 (en)* | 2013-08-12 | 2017-08-29 | Financial Realizer, LLC | Automated method of identifying stock indexes which are historically high or low relative to a plurality of macroeconomic indicators |
| US10127192B1 (en) | 2017-09-26 | 2018-11-13 | Sas Institute Inc. | Analytic system for fast quantile computation |
| US10405734B2 (en) | 2012-06-29 | 2019-09-10 | Given Imaging Ltd. | System and method for displaying an image stream |
| US10839042B1 (en)* | 2016-06-22 | 2020-11-17 | EMC IP Holding Company LLC | Summarizing and querying data generated from multiple scenarios of a data-intensive simulation |
| US11176109B2 (en) | 2019-07-15 | 2021-11-16 | Microsoft Technology Licensing, Llc | Time-series data condensation and graphical signature analysis |
Families Citing this family (33)
| Publication number | Priority date | Publication date | Assignee | Title |
|---|---|---|---|---|
| US6643613B2 (en)* | 2001-07-03 | 2003-11-04 | Altaworks Corporation | System and method for monitoring performance metrics |
| US6975963B2 (en)* | 2002-09-30 | 2005-12-13 | Mcdata Corporation | Method and system for storing and reporting network performance metrics using histograms |
| US20040128379A1 (en)* | 2002-12-30 | 2004-07-01 | Jerry Mizell | Collecting standard interval metrics using a randomized collection period |
| US7505415B2 (en)* | 2004-01-30 | 2009-03-17 | Nortel Networks Limited | Performance monitoring in a communications network |
| US20050283337A1 (en)* | 2004-06-22 | 2005-12-22 | Mehmet Sayal | System and method for correlation of time-series data |
| US7299248B2 (en)* | 2004-06-29 | 2007-11-20 | International Business Machines Corporation | Method, system, program for determining frequency of updating database histograms |
| JP4700969B2 (en)* | 2005-01-06 | 2011-06-15 | 富士通株式会社 | Monitoring information providing apparatus, monitoring information providing method, and monitoring information providing program |
| US20060167825A1 (en)* | 2005-01-24 | 2006-07-27 | Mehmet Sayal | System and method for discovering correlations among data |
| US7743136B1 (en)* | 2005-01-25 | 2010-06-22 | Avaya, Inc. | Frequency-table-based storage for network performance data |
| EP1910997B1 (en)* | 2005-08-01 | 2019-11-20 | Bioptigen, Inc. | Methods, systems and computer program for 3d-registration of three dimensional data sets obtained by preferably optical coherence tomography based on the alignment of projection images or fundus images, respectively |
| US20070067369A1 (en)* | 2005-09-22 | 2007-03-22 | Minshall Robbie J | Method and system for quantifying and comparing workload on an application server |
| US20090150825A1 (en)* | 2006-03-13 | 2009-06-11 | Fujitsu Limited | Screen generation program, screen generation apparatus, and screen generation method |
| US8023732B2 (en)* | 2006-07-26 | 2011-09-20 | Siemens Aktiengesellschaft | Accelerated image registration by means of parallel processors |
| US20080222296A1 (en)* | 2007-03-07 | 2008-09-11 | Lisa Ellen Lippincott | Distributed server architecture |
| US8161149B2 (en) | 2007-03-07 | 2012-04-17 | International Business Machines Corporation | Pseudo-agent |
| US8495157B2 (en)* | 2007-03-07 | 2013-07-23 | International Business Machines Corporation | Method and apparatus for distributed policy-based management and computed relevance messaging with remote attributes |
| US8392406B1 (en)* | 2008-05-30 | 2013-03-05 | Oracle International Corporation | Determining a height-balanced histogram incrementally |
| US8966110B2 (en)* | 2009-09-14 | 2015-02-24 | International Business Machines Corporation | Dynamic bandwidth throttling |
| US8744159B2 (en)* | 2010-03-05 | 2014-06-03 | Bioptigen, Inc. | Methods, systems and computer program products for collapsing volume data to lower dimensional representations thereof using histogram projection |
| US9412067B2 (en) | 2012-09-05 | 2016-08-09 | Numenta, Inc. | Anomaly detection in spatial and temporal memory system |
| US9633061B2 (en)* | 2012-09-26 | 2017-04-25 | Oracle International Corporation | Methods for determining event counts based on time-sampled data |
| US9787341B2 (en) | 2012-11-21 | 2017-10-10 | Alarm.Com Incorporated | Density function centric signal processing |
| US20170116158A9 (en)* | 2013-05-06 | 2017-04-27 | Sas Institute Inc. | Techniques to perform interpolation for statistical tests |
| US20150127595A1 (en)* | 2013-11-01 | 2015-05-07 | Numenta, Inc. | Modeling and detection of anomaly based on prediction |
| US9377291B2 (en) | 2013-12-05 | 2016-06-28 | Bioptigen, Inc. | Image registration, averaging, and compounding for high speed extended depth optical coherence tomography |
| CN105900092B (en)* | 2014-03-26 | 2019-05-14 | 株式会社日立制作所 | Time series data management method and time series data management system |
| US20180113782A1 (en)* | 2014-06-11 | 2018-04-26 | Arizona Board Of Regents On Behalf Of The University Of Arizona | Adaptive web analytic response environment |
| US20170153962A1 (en)* | 2015-11-30 | 2017-06-01 | International Business Machines Corporation | Monitoring the performance of threaded applications |
| US10482084B2 (en)* | 2016-08-16 | 2019-11-19 | Netscout Systems Texas, Llc | Optimized merge-sorting of data retrieved from parallel storage units |
| JP6549174B2 (en)* | 2017-03-22 | 2019-07-24 | 株式会社東芝 | Information presentation apparatus, information presentation method and program |
| US11687439B2 (en)* | 2020-07-23 | 2023-06-27 | Pdf Solutions, Inc. | Automatic window generation for process trace |
| US12118558B2 (en)* | 2021-04-28 | 2024-10-15 | Actimize Ltd. | Estimating quantile values for reduced memory and/or storage utilization and faster processing time in fraud detection systems |
| CN117120995B (en)* | 2022-03-24 | 2024-08-30 | 维萨国际服务协会 | System, method and computer program product for efficiently linking time series data tables |
Citations (147)
| Publication number | Priority date | Publication date | Assignee | Title |
|---|---|---|---|---|
| US4821220A (en) | 1986-07-25 | 1989-04-11 | Tektronix, Inc. | System for animating program operation and displaying time-based relationships |
| US5062055A (en) | 1986-09-02 | 1991-10-29 | Digital Equipment Corporation | Data processor performance advisor |
| US5101348A (en) | 1988-06-23 | 1992-03-31 | International Business Machines Corporation | Method of reducing the amount of information included in topology database update messages in a data communications network |
| EP0508386A2 (en) | 1991-04-08 | 1992-10-14 | Praxair Technology, Inc. | Statistical process control for air separation process |
| US5161116A (en) | 1989-02-27 | 1992-11-03 | Dynix | System for evaluating the performance of a large scale programmable machine capable of having a plurality of terminals attached thereto |
| US5307499A (en) | 1990-11-30 | 1994-04-26 | Singapore Computer Systems Limited | Interpretive object-oriented facility which can access pre-compiled classes |
| US5343538A (en)* | 1992-10-02 | 1994-08-30 | International Remote Imaging Systems, Inc. | Method and an apparatus for identifying an object using quantile partitions |
| US5367473A (en) | 1990-06-18 | 1994-11-22 | Bell Communications Research, Inc. | Expert system for computer system resource management |
| US5375070A (en) | 1993-03-01 | 1994-12-20 | International Business Machines Corporation | Information collection architecture and method for a data communications network |
| US5432932A (en) | 1992-10-23 | 1995-07-11 | International Business Machines Corporation | System and method for dynamically controlling remote processes from a performance monitor |
| US5450406A (en) | 1993-04-20 | 1995-09-12 | Kabushiki Kaisha Toshiba | ATM communication system with high speed connection-less service function |
| US5459868A (en) | 1990-11-30 | 1995-10-17 | St Computer Systems & Services | Interpretive object-oriented facility which can access pre-compiled classes |
| US5459837A (en) | 1993-04-21 | 1995-10-17 | Digital Equipment Corporation | System to facilitate efficient utilization of network resources in a computer network |
| US5475625A (en) | 1991-01-16 | 1995-12-12 | Siemens Nixdorf Informationssysteme Aktiengesellschaft | Method and arrangement for monitoring computer manipulations |
| US5475843A (en) | 1992-11-02 | 1995-12-12 | Borland International, Inc. | System and methods for improved program testing |
| US5483468A (en) | 1992-10-23 | 1996-01-09 | International Business Machines Corporation | System and method for concurrent recording and displaying of system performance data |
| US5491791A (en) | 1995-01-13 | 1996-02-13 | International Business Machines Corporation | System and method for remote workstation monitoring within a distributed computing environment |
| US5504921A (en) | 1990-09-17 | 1996-04-02 | Cabletron Systems, Inc. | Network management system using model-based intelligence |
| US5506955A (en) | 1992-10-23 | 1996-04-09 | International Business Machines Corporation | System and method for monitoring and optimizing performance in a data processing system |
| WO1996012224A1 (en) | 1994-10-18 | 1996-04-25 | Marcam Corporation | Method and apparatus for testing object-oriented programming constructs |
| US5513126A (en) | 1993-10-04 | 1996-04-30 | Xerox Corporation | Network having selectively accessible recipient prioritized communication channel profiles |
| US5553235A (en) | 1992-10-23 | 1996-09-03 | International Business Machines Corporation | System and method for maintaining performance data in a data processing system |
| US5555191A (en) | 1994-10-12 | 1996-09-10 | Trustees Of Columbia University In The City Of New York | Automated statistical tracker |
| US5572672A (en) | 1991-06-10 | 1996-11-05 | International Business Machines Corporation | Method and apparatus for monitoring data processing system resources in real-time |
| US5581482A (en) | 1994-04-26 | 1996-12-03 | Unisys Corporation | Performance monitor for digital computer system |
| US5581696A (en) | 1995-05-09 | 1996-12-03 | Parasoft Corporation | Method using a computer for automatically instrumenting a computer program for dynamic debugging |
| US5586254A (en) | 1992-02-13 | 1996-12-17 | Hitachi Software Engineering Co., Ltd. | System for managing and operating a network by physically imaging the network |
| US5598429A (en) | 1994-07-15 | 1997-01-28 | Marshall; Kenneth E. | Multi-level correlation system for synchronization detection in high noise and multi-path environments |
| US5615135A (en) | 1995-06-01 | 1997-03-25 | International Business Machines Corporation | Event driven interface having a dynamically reconfigurable counter for monitoring a high speed data network according to changing traffic events |
| US5615323A (en) | 1994-11-04 | 1997-03-25 | Concord Communications, Inc. | Displaying resource performance and utilization information |
| US5616904A (en) | 1991-02-14 | 1997-04-01 | Xtec, Incorporated | Data verification method and magnetic media therefor |
| US5619656A (en) | 1994-05-05 | 1997-04-08 | Openservice, Inc. | System for uninterruptively displaying only relevant and non-redundant alert message of the highest severity for specific condition associated with group of computers being managed |
| US5621663A (en) | 1991-06-20 | 1997-04-15 | Icl Systems Ab | Method and system for monitoring a computer system |
| US5634009A (en) | 1993-10-01 | 1997-05-27 | 3Com Corporation | Network data collection method and apparatus |
| US5636344A (en) | 1990-08-31 | 1997-06-03 | Hewlett-Packard Company | Network fault analysis system |
| US5655081A (en) | 1995-03-08 | 1997-08-05 | Bmc Software, Inc. | System for monitoring and managing computer resources and applications across a distributed computing environment using an intelligent autonomous agent architecture |
| US5661668A (en) | 1994-05-25 | 1997-08-26 | System Management Arts, Inc. | Apparatus and method for analyzing and correlating events in a system using a causality matrix |
| US5668944A (en) | 1994-09-06 | 1997-09-16 | International Business Machines Corporation | Method and system for providing performance diagnosis of a computer system |
| US5675510A (en) | 1995-06-07 | 1997-10-07 | Pc Meter L.P. | Computer use meter and analyzer |
| US5696486A (en) | 1995-03-29 | 1997-12-09 | Cabletron Systems, Inc. | Method and apparatus for policy-based alarm notification in a distributed network management environment |
| US5696701A (en) | 1996-07-12 | 1997-12-09 | Electronic Data Systems Corporation | Method and system for monitoring the performance of computers in computer networks using modular extensions |
| US5699403A (en) | 1995-04-12 | 1997-12-16 | Lucent Technologies Inc. | Network vulnerability management apparatus and method |
| US5732273A (en) | 1995-08-11 | 1998-03-24 | Digital Equipment Corporation | System for monitoring compute system performance |
| US5740441A (en) | 1994-12-20 | 1998-04-14 | Sun Microsystems, Inc. | Bytecode program interpreter apparatus and method with pre-verification of data type restrictions and object initialization |
| US5748098A (en) | 1993-02-23 | 1998-05-05 | British Telecommunications Public Limited Company | Event correlation |
| US5752062A (en) | 1995-10-02 | 1998-05-12 | International Business Machines Corporation | Method and system for performance monitoring through monitoring an order of processor events during execution in a processing system |
| US5758071A (en) | 1996-07-12 | 1998-05-26 | Electronic Data Systems Corporation | Method and system for tracking the configuration of a computer coupled to a computer network |
| US5778230A (en) | 1995-11-13 | 1998-07-07 | Object Technology Licensing Corp. | Goal directed object-oriented debugging system |
| US5796663A (en) | 1995-12-12 | 1998-08-18 | Lg Semicon Co., Ltd. | Address signal storage circuit of data repair controller |
| US5799154A (en) | 1996-06-27 | 1998-08-25 | Mci Communications Corporation | System and method for the remote monitoring of wireless packet data networks |
| US5802256A (en) | 1994-05-09 | 1998-09-01 | Microsoft Corporation | Generating improved belief networks |
| US5815718A (en) | 1996-05-30 | 1998-09-29 | Sun Microsystems, Inc. | Method and system for loading classes in read-only memory |
| US5819028A (en) | 1992-06-10 | 1998-10-06 | Bay Networks, Inc. | Method and apparatus for determining the health of a network |
| US5845125A (en) | 1993-06-21 | 1998-12-01 | Kabushiki Kaisha Toshiba | Debugger using class information and dynamic instance inter-relationships |
| US5850388A (en) | 1996-08-02 | 1998-12-15 | Wandel & Goltermann Technologies, Inc. | Protocol analyzer for monitoring digital transmission networks |
| US5870540A (en) | 1995-11-20 | 1999-02-09 | Ncr Corporation | Low overhead method for detecting communication failures on a network |
| US5896536A (en) | 1996-05-01 | 1999-04-20 | International Business Machines Corp. | Data triggered trace support for debugging object oriented programs |
| US5901315A (en) | 1997-06-13 | 1999-05-04 | International Business Machines Corporation | Method for debugging a Java application having native method dynamic load libraries |
| US5923834A (en) | 1996-06-17 | 1999-07-13 | Xerox Corporation | Machine dedicated monitor, predictor, and diagnostic server |
| US5948113A (en) | 1997-04-18 | 1999-09-07 | Microsoft Corporation | System and method for centrally handling runtime errors |
| US5956662A (en) | 1995-03-27 | 1999-09-21 | Siemens Nixdorf Informationssystem Aktiengesellschaft | Method for load measurement |
| US5974237A (en) | 1996-12-18 | 1999-10-26 | Northern Telecom Limited | Communications network monitoring |
| US5974457A (en) | 1993-12-23 | 1999-10-26 | International Business Machines Corporation | Intelligent realtime monitoring of data traffic |
| US5978594A (en) | 1994-09-30 | 1999-11-02 | Bmc Software, Inc. | System for managing computer resources across a distributed computing environment by first reading discovery information about how to determine system resources presence |
| US5987249A (en) | 1996-08-27 | 1999-11-16 | Numega Technologies | IR code instrumentation |
| US5991881A (en) | 1996-11-08 | 1999-11-23 | Harris Corporation | Network surveillance system |
| US6021437A (en) | 1996-07-17 | 2000-02-01 | Bull S.A. | Process and system for real-time monitoring of a data processing system for its administration and maintenance support in the operating phase |
| US6026237A (en) | 1997-11-03 | 2000-02-15 | International Business Machines Corporation | System and method for dynamic modification of class files |
| US6026234A (en) | 1997-03-19 | 2000-02-15 | International Business Machines Corporation | Method and apparatus for profiling indirect procedure calls in a computer program |
| US6028842A (en) | 1996-12-23 | 2000-02-22 | Nortel Networks Corporation | Dynamic traffic conditioning |
| US6044335A (en) | 1997-12-23 | 2000-03-28 | At&T Corp. | Productivity metrics for application software systems |
| US6042614A (en) | 1995-03-03 | 2000-03-28 | Sun Microsystems, Inc. | System and method for a distributed debugger for debugging distributed application programs |
| US6058102A (en) | 1997-11-07 | 2000-05-02 | Visual Networks Technologies, Inc. | Method and apparatus for performing service level analysis of communications network performance metrics |
| US6058393A (en) | 1996-02-23 | 2000-05-02 | International Business Machines Corporation | Dynamic connection to a remote tool in a distributed processing system environment used for debugging |
| US6061518A (en) | 1997-11-25 | 2000-05-09 | International Business Machines Corporation | Data processing system and method for debugging a JavaScript program |
| US6067412A (en) | 1995-08-17 | 2000-05-23 | Microsoft Corporation | Automatic bottleneck detection by means of workload reconstruction from performance measurements |
| US6072777A (en) | 1996-06-28 | 2000-06-06 | Mci Communications Corporation | System and method for unreported root cause analysis |
| US6073089A (en) | 1997-10-22 | 2000-06-06 | Baker; Michelle | Systems and methods for adaptive profiling, fault detection, and alert generation in a changing environment which is measurable by at least two different measures of state |
| US6076083A (en) | 1995-08-20 | 2000-06-13 | Baker; Michelle | Diagnostic system utilizing a Bayesian network model having link weights updated experimentally |
| US6081797A (en) | 1997-07-09 | 2000-06-27 | American Heuristics Corporation | Adaptive temporal correlation network |
| US6108658A (en)* | 1998-03-30 | 2000-08-22 | International Business Machines Corporation | Single pass space efficent system and method for generating approximate quantiles satisfying an apriori user-defined approximation error |
| US6106572A (en) | 1998-03-25 | 2000-08-22 | Origins Software Company | Forward and reverse hierarchical page level debugger |
| US6108800A (en) | 1998-02-10 | 2000-08-22 | Hewlett-Packard Company | Method and apparatus for analyzing the performance of an information system |
| US6115393A (en) | 1991-04-12 | 2000-09-05 | Concord Communications, Inc. | Network monitoring |
| US6118936A (en) | 1996-04-18 | 2000-09-12 | Mci Communications Corporation | Signaling network management system for converting network events into standard form and then correlating the standard form events with topology and maintenance information |
| US6118940A (en) | 1997-11-25 | 2000-09-12 | International Business Machines Corp. | Method and apparatus for benchmarking byte code sequences |
| US6119247A (en) | 1998-06-22 | 2000-09-12 | International Business Machines Corporation | Remote debugging of internet applications |
| US6119074A (en) | 1998-05-20 | 2000-09-12 | Caterpillar Inc. | Method and apparatus of predicting a fault condition |
| US6138122A (en) | 1998-03-02 | 2000-10-24 | Agilent Technologies | Modeling of internet services |
| US6139198A (en) | 1994-10-04 | 2000-10-31 | International Business Machines Corporation | System and method for enabling tracing of program execution in an object-oriented system |
| US6145121A (en) | 1997-04-17 | 2000-11-07 | University Of Washington | Trace based method for the analysis, benchmarking and tuning of object oriented databases and applications |
| US6149318A (en) | 1997-04-15 | 2000-11-21 | Samuel C. Kendall | Link-time and run-time error detection, and program instrumentation |
| US6151701A (en) | 1997-09-30 | 2000-11-21 | Ahpah Software, Inc. | Method for reconstructing debugging information for a decompiled executable file |
| US6154736A (en) | 1997-07-30 | 2000-11-28 | Microsoft Corporation | Belief networks with decision graphs |
| US6161200A (en) | 1995-09-11 | 2000-12-12 | Applied Microsystems, Inc. | Method and apparatus for analyzing software executed in embedded systems |
| US6167398A (en) | 1997-01-30 | 2000-12-26 | British Telecommunications Public Limited Company | Information retrieval system and method that generates weighted comparison results to analyze the degree of dissimilarity between a reference corpus and a candidate document |
| US6182022B1 (en) | 1998-01-26 | 2001-01-30 | Hewlett-Packard Company | Automated adaptive baselining and thresholding method and system |
| US6182157B1 (en) | 1996-09-19 | 2001-01-30 | Compaq Computer Corporation | Flexible SNMP trap mechanism |
| US6216119B1 (en) | 1997-11-19 | 2001-04-10 | Netuitive, Inc. | Multi-kernel neural network concurrent learning, monitoring, and forecasting system |
| US6222652B1 (en) | 1997-06-20 | 2001-04-24 | Nortel Networks Limited | Method of and apparatus for detecting transients in an optical transmission system |
| US6263298B1 (en) | 1998-08-13 | 2001-07-17 | Precise Software Solutions Ltd. | Method for analyzing system performance |
| US6269401B1 (en) | 1998-08-28 | 2001-07-31 | 3Com Corporation | Integrated computer system and network performance monitoring |
| US6327550B1 (en) | 1998-05-26 | 2001-12-04 | Computer Associates Think, Inc. | Method and apparatus for system state monitoring using pattern recognition and neural networks |
| US6327677B1 (en) | 1998-04-27 | 2001-12-04 | Proactive Networks | Method and apparatus for monitoring a network environment |
| US6343288B1 (en)* | 1999-03-12 | 2002-01-29 | International Business Machines Corporation | Single pass space efficient system and method for generating an approximate quantile in a data set having an unknown size |
| US20020012011A1 (en) | 1998-12-04 | 2002-01-31 | Michael Roytman | Alarm manager system for distributed network management system |
| US20020019870A1 (en) | 2000-06-29 | 2002-02-14 | International Business Machines Corporation | Proactive on-line diagnostics in a manageable network |
| US6359976B1 (en) | 1998-06-08 | 2002-03-19 | Inet Technologies, Inc. | System and method for monitoring service quality in a communications network |
| US6377907B1 (en) | 1999-11-17 | 2002-04-23 | Mci Worldcom, Inc. | System and method for collating UNIX performance metrics |
| US20020049838A1 (en) | 2000-06-21 | 2002-04-25 | Sylor Mark W. | Liveexception system |
| US6381306B1 (en) | 1998-06-08 | 2002-04-30 | Inet Technologies, Inc. | System and method for monitoring service quality in a communications network |
| US20020054169A1 (en) | 1998-05-29 | 2002-05-09 | Richardson David E. | Method and apparatus for dynamically drilling-down through a health monitoring map to determine the health status and cause of health problems associated with network objects of a managed network environment |
| US6405250B1 (en) | 1999-01-25 | 2002-06-11 | Lucent Technologies Inc. | Network management system based on passive monitoring and proactive management for formulation behavior state transition models |
| US20020090134A1 (en) | 2001-01-10 | 2002-07-11 | Koninklijke Philips Electronics N.V. | System and method for providing a scalable objective metric for automatic video quality evaluation employing interdependent objective metrics |
| US20020095661A1 (en) | 1996-08-27 | 2002-07-18 | Angel David J. | Byte code instrumentation |
| US20020111755A1 (en) | 2000-10-19 | 2002-08-15 | Tti-Team Telecom International Ltd. | Topology-based reasoning apparatus for root-cause analysis of network faults |
| US6446058B1 (en) | 1999-04-26 | 2002-09-03 | At&T Corp. | Computer platform alarm and control system |
| US20020123865A1 (en) | 2001-01-02 | 2002-09-05 | Whitney Paul D. | Method for generating analyses of categorical data |
| US6453346B1 (en) | 1998-07-17 | 2002-09-17 | Proactivenet, Inc. | Method and apparatus for intelligent storage and reduction of network information |
| US20020133757A1 (en) | 1999-02-23 | 2002-09-19 | Randal Lee Bertram | System and method for predicting computer system performance and for making recommendations for improving its performance |
| US6466929B1 (en) | 1998-11-13 | 2002-10-15 | University Of Delaware | System for discovering implicit relationships in data and a method of using the same |
| US20020152304A1 (en) | 2000-10-26 | 2002-10-17 | Metilinx | Aggregate system resource analysis including correlation matrix and metric-based analysis |
| US20020152185A1 (en) | 2001-01-03 | 2002-10-17 | Sasken Communication Technologies Limited | Method of network modeling and predictive event-correlation in a communication system by the use of contextual fuzzy cognitive maps |
| US20020152305A1 (en) | 2000-03-03 | 2002-10-17 | Jackson Gregory J. | Systems and methods for resource utilization analysis in information management environments |
| US20020158918A1 (en) | 2001-03-28 | 2002-10-31 | Sarnoff Corporation | Method and apparatus for visualizing correlations among and between objects and events |
| US20020159386A1 (en) | 2001-04-30 | 2002-10-31 | Gilbert Grosdidier | Method for dynamical identification of network congestion characteristics |
| US20020165892A1 (en) | 2001-05-03 | 2002-11-07 | Doug Grumann | Method and apparatus to extract the health of a service from a host machine |
| US20020169870A1 (en) | 2001-05-10 | 2002-11-14 | Frank Vosseler | Method, system and computer program product for monitoring objects in an it network |
| US6484129B2 (en) | 1997-07-23 | 2002-11-19 | Candle Distributed Solutions, Inc. | End-to-end response time measurement for computer programs |
| US20020173997A1 (en) | 2001-03-30 | 2002-11-21 | Cody Menard | System and method for business systems transactions and infrastructure management |
| US20020174174A1 (en) | 2001-04-13 | 2002-11-21 | Anupriya Ramraj | System and method for monitoring execution time of a transaction |
| US20020184615A1 (en) | 2001-04-25 | 2002-12-05 | Sumner William Earl | System and method for selectively and automatically modifying the source code of a computer program |
| US20020183972A1 (en) | 2001-06-01 | 2002-12-05 | Enck Brent A. | Adaptive performance data measurement and collections |
| US20020198879A1 (en) | 2001-05-11 | 2002-12-26 | Schwarcz Lawrence R. | Method of formatting values in a fixed number of spaces using the java programming language |
| US20020198985A1 (en) | 2001-05-09 | 2002-12-26 | Noam Fraenkel | Post-deployment monitoring and analysis of server performance |
| US20030005362A1 (en) | 2001-06-29 | 2003-01-02 | Miller Jennifer J. | System and method of automatic information collection and problem solution generation for computer storage devices |
| US6505246B1 (en) | 1998-12-30 | 2003-01-07 | Candle Distributed Solutions, Inc. | User interface for system management applications |
| US20030009507A1 (en) | 2001-06-29 | 2003-01-09 | Annie Shum | System and method for application performance management |
| US20030014692A1 (en) | 2001-03-08 | 2003-01-16 | California Institute Of Technology | Exception analysis for multimissions |
| US20030018494A1 (en) | 2001-06-14 | 2003-01-23 | Alexandre Bronstein | Assessing health of a subsystem or service within a networked system |
| US20030018241A1 (en) | 2001-07-19 | 2003-01-23 | Nellcor Puritan Bennett Inc. | Nuisance alarm reductions in a physiological monitor |
| US6513065B1 (en) | 1999-03-04 | 2003-01-28 | Bmc Software, Inc. | Enterprise management system and method which includes summarization having a plurality of levels of varying granularity |
| US20030023712A1 (en) | 2001-03-30 | 2003-01-30 | Zhao Ling Z. | Site monitor |
| US20030028631A1 (en) | 2001-07-31 | 2003-02-06 | Rhodes N. Lee | Network usage analysis system and method for updating statistical models |
| US20030033404A1 (en) | 2001-08-09 | 2003-02-13 | Richardson David E. | Method for automatically monitoring a network |
| US6553366B1 (en)* | 1998-10-02 | 2003-04-22 | Ncr Corporation | Analytic logical data model |
| US6865295B2 (en)* | 2001-05-11 | 2005-03-08 | Koninklijke Philips Electronics N.V. | Palette-based histogram matching with recursive histogram vector generation |
- 2002
- 2002-09-13USUS10/243,534patent/US7219034B2/ennot_activeExpired - Lifetime
Patent Citations (154)
| Publication number | Priority date | Publication date | Assignee | Title |
|---|---|---|---|---|
| US4821220A (en) | 1986-07-25 | 1989-04-11 | Tektronix, Inc. | System for animating program operation and displaying time-based relationships |
| US5062055A (en) | 1986-09-02 | 1991-10-29 | Digital Equipment Corporation | Data processor performance advisor |
| US5101348A (en) | 1988-06-23 | 1992-03-31 | International Business Machines Corporation | Method of reducing the amount of information included in topology database update messages in a data communications network |
| US5161116A (en) | 1989-02-27 | 1992-11-03 | Dynix | System for evaluating the performance of a large scale programmable machine capable of having a plurality of terminals attached thereto |
| US5367473A (en) | 1990-06-18 | 1994-11-22 | Bell Communications Research, Inc. | Expert system for computer system resource management |
| US5636344A (en) | 1990-08-31 | 1997-06-03 | Hewlett-Packard Company | Network fault analysis system |
| US5504921A (en) | 1990-09-17 | 1996-04-02 | Cabletron Systems, Inc. | Network management system using model-based intelligence |
| US5307499A (en) | 1990-11-30 | 1994-04-26 | Singapore Computer Systems Limited | Interpretive object-oriented facility which can access pre-compiled classes |
| US5459868A (en) | 1990-11-30 | 1995-10-17 | St Computer Systems & Services | Interpretive object-oriented facility which can access pre-compiled classes |
| US5475625A (en) | 1991-01-16 | 1995-12-12 | Siemens Nixdorf Informationssysteme Aktiengesellschaft | Method and arrangement for monitoring computer manipulations |
| US5616904A (en) | 1991-02-14 | 1997-04-01 | Xtec, Incorporated | Data verification method and magnetic media therefor |
| EP0508386A2 (en) | 1991-04-08 | 1992-10-14 | Praxair Technology, Inc. | Statistical process control for air separation process |
| US6115393A (en) | 1991-04-12 | 2000-09-05 | Concord Communications, Inc. | Network monitoring |
| US5572672A (en) | 1991-06-10 | 1996-11-05 | International Business Machines Corporation | Method and apparatus for monitoring data processing system resources in real-time |
| US5621663A (en) | 1991-06-20 | 1997-04-15 | Icl Systems Ab | Method and system for monitoring a computer system |
| US5586254A (en) | 1992-02-13 | 1996-12-17 | Hitachi Software Engineering Co., Ltd. | System for managing and operating a network by physically imaging the network |
| US5819028A (en) | 1992-06-10 | 1998-10-06 | Bay Networks, Inc. | Method and apparatus for determining the health of a network |
| US5343538A (en)* | 1992-10-02 | 1994-08-30 | International Remote Imaging Systems, Inc. | Method and an apparatus for identifying an object using quantile partitions |
| US5553235A (en) | 1992-10-23 | 1996-09-03 | International Business Machines Corporation | System and method for maintaining performance data in a data processing system |
| US5506955A (en) | 1992-10-23 | 1996-04-09 | International Business Machines Corporation | System and method for monitoring and optimizing performance in a data processing system |
| US5483468A (en) | 1992-10-23 | 1996-01-09 | International Business Machines Corporation | System and method for concurrent recording and displaying of system performance data |
| US5684945A (en) | 1992-10-23 | 1997-11-04 | International Business Machines Corporation | System and method for maintaining performance data in a data processing system |
| US5432932A (en) | 1992-10-23 | 1995-07-11 | International Business Machines Corporation | System and method for dynamically controlling remote processes from a performance monitor |
| US5475843A (en) | 1992-11-02 | 1995-12-12 | Borland International, Inc. | System and methods for improved program testing |
| US5748098A (en) | 1993-02-23 | 1998-05-05 | British Telecommunications Public Limited Company | Event correlation |
| US5375070A (en) | 1993-03-01 | 1994-12-20 | International Business Machines Corporation | Information collection architecture and method for a data communications network |
| US5450406A (en) | 1993-04-20 | 1995-09-12 | Kabushiki Kaisha Toshiba | ATM communication system with high speed connection-less service function |
| US5459837A (en) | 1993-04-21 | 1995-10-17 | Digital Equipment Corporation | System to facilitate efficient utilization of network resources in a computer network |
| US5845125A (en) | 1993-06-21 | 1998-12-01 | Kabushiki Kaisha Toshiba | Debugger using class information and dynamic instance inter-relationships |
| US5634009A (en) | 1993-10-01 | 1997-05-27 | 3Com Corporation | Network data collection method and apparatus |
| US5513126A (en) | 1993-10-04 | 1996-04-30 | Xerox Corporation | Network having selectively accessible recipient prioritized communication channel profiles |
| US5974457A (en) | 1993-12-23 | 1999-10-26 | International Business Machines Corporation | Intelligent realtime monitoring of data traffic |
| US5581482A (en) | 1994-04-26 | 1996-12-03 | Unisys Corporation | Performance monitor for digital computer system |
| US5619656A (en) | 1994-05-05 | 1997-04-08 | Openservice, Inc. | System for uninterruptively displaying only relevant and non-redundant alert message of the highest severity for specific condition associated with group of computers being managed |
| US5802256A (en) | 1994-05-09 | 1998-09-01 | Microsoft Corporation | Generating improved belief networks |
| US5661668A (en) | 1994-05-25 | 1997-08-26 | System Management Arts, Inc. | Apparatus and method for analyzing and correlating events in a system using a causality matrix |
| US6249755B1 (en) | 1994-05-25 | 2001-06-19 | System Management Arts, Inc. | Apparatus and method for event correlation and problem reporting |
| US5598429A (en) | 1994-07-15 | 1997-01-28 | Marshall; Kenneth E. | Multi-level correlation system for synchronization detection in high noise and multi-path environments |
| US5668944A (en) | 1994-09-06 | 1997-09-16 | International Business Machines Corporation | Method and system for providing performance diagnosis of a computer system |
| US5978594A (en) | 1994-09-30 | 1999-11-02 | Bmc Software, Inc. | System for managing computer resources across a distributed computing environment by first reading discovery information about how to determine system resources presence |
| US6139198A (en) | 1994-10-04 | 2000-10-31 | International Business Machines Corporation | System and method for enabling tracing of program execution in an object-oriented system |
| US5555191A (en) | 1994-10-12 | 1996-09-10 | Trustees Of Columbia University In The City Of New York | Automated statistical tracker |
| WO1996012224A1 (en) | 1994-10-18 | 1996-04-25 | Marcam Corporation | Method and apparatus for testing object-oriented programming constructs |
| US6320585B1 (en) | 1994-11-04 | 2001-11-20 | Concord Communications Inc. | Displaying resource performance and utilization information |
| US5615323A (en) | 1994-11-04 | 1997-03-25 | Concord Communications, Inc. | Displaying resource performance and utilization information |
| US5740441A (en) | 1994-12-20 | 1998-04-14 | Sun Microsystems, Inc. | Bytecode program interpreter apparatus and method with pre-verification of data type restrictions and object initialization |
| US5491791A (en) | 1995-01-13 | 1996-02-13 | International Business Machines Corporation | System and method for remote workstation monitoring within a distributed computing environment |
| US6042614A (en) | 1995-03-03 | 2000-03-28 | Sun Microsystems, Inc. | System and method for a distributed debugger for debugging distributed application programs |
| US5655081A (en) | 1995-03-08 | 1997-08-05 | Bmc Software, Inc. | System for monitoring and managing computer resources and applications across a distributed computing environment using an intelligent autonomous agent architecture |
| US5956662A (en) | 1995-03-27 | 1999-09-21 | Siemens Nixdorf Informationssystem Aktiengesellschaft | Method for load measurement |
| US5696486A (en) | 1995-03-29 | 1997-12-09 | Cabletron Systems, Inc. | Method and apparatus for policy-based alarm notification in a distributed network management environment |
| US5699403A (en) | 1995-04-12 | 1997-12-16 | Lucent Technologies Inc. | Network vulnerability management apparatus and method |
| US5581696A (en) | 1995-05-09 | 1996-12-03 | Parasoft Corporation | Method using a computer for automatically instrumenting a computer program for dynamic debugging |
| US6085029A (en) | 1995-05-09 | 2000-07-04 | Parasoft Corporation | Method using a computer for automatically instrumenting a computer program for dynamic debugging |
| US5615135A (en) | 1995-06-01 | 1997-03-25 | International Business Machines Corporation | Event driven interface having a dynamically reconfigurable counter for monitoring a high speed data network according to changing traffic events |
| US5675510A (en) | 1995-06-07 | 1997-10-07 | Pc Meter L.P. | Computer use meter and analyzer |
| US5732273A (en) | 1995-08-11 | 1998-03-24 | Digital Equipment Corporation | System for monitoring compute system performance |
| US6067412A (en) | 1995-08-17 | 2000-05-23 | Microsoft Corporation | Automatic bottleneck detection by means of workload reconstruction from performance measurements |
| US6076083A (en) | 1995-08-20 | 2000-06-13 | Baker; Michelle | Diagnostic system utilizing a Bayesian network model having link weights updated experimentally |
| US6161200A (en) | 1995-09-11 | 2000-12-12 | Applied Microsystems, Inc. | Method and apparatus for analyzing software executed in embedded systems |
| US5752062A (en) | 1995-10-02 | 1998-05-12 | International Business Machines Corporation | Method and system for performance monitoring through monitoring an order of processor events during execution in a processing system |
| US5778230A (en) | 1995-11-13 | 1998-07-07 | Object Technology Licensing Corp. | Goal directed object-oriented debugging system |
| US5870540A (en) | 1995-11-20 | 1999-02-09 | Ncr Corporation | Low overhead method for detecting communication failures on a network |
| US5796663A (en) | 1995-12-12 | 1998-08-18 | Lg Semicon Co., Ltd. | Address signal storage circuit of data repair controller |
| US6058393A (en) | 1996-02-23 | 2000-05-02 | International Business Machines Corporation | Dynamic connection to a remote tool in a distributed processing system environment used for debugging |
| US6118936A (en) | 1996-04-18 | 2000-09-12 | Mci Communications Corporation | Signaling network management system for converting network events into standard form and then correlating the standard form events with topology and maintenance information |
| US5896536A (en) | 1996-05-01 | 1999-04-20 | International Business Machines Corp. | Data triggered trace support for debugging object oriented programs |
| US5815718A (en) | 1996-05-30 | 1998-09-29 | Sun Microsystems, Inc. | Method and system for loading classes in read-only memory |
| US5923834A (en) | 1996-06-17 | 1999-07-13 | Xerox Corporation | Machine dedicated monitor, predictor, and diagnostic server |
| US5799154A (en) | 1996-06-27 | 1998-08-25 | Mci Communications Corporation | System and method for the remote monitoring of wireless packet data networks |
| US6072777A (en) | 1996-06-28 | 2000-06-06 | Mci Communications Corporation | System and method for unreported root cause analysis |
| US5696701A (en) | 1996-07-12 | 1997-12-09 | Electronic Data Systems Corporation | Method and system for monitoring the performance of computers in computer networks using modular extensions |
| US5758071A (en) | 1996-07-12 | 1998-05-26 | Electronic Data Systems Corporation | Method and system for tracking the configuration of a computer coupled to a computer network |
| US6021437A (en) | 1996-07-17 | 2000-02-01 | Bull S.A. | Process and system for real-time monitoring of a data processing system for its administration and maintenance support in the operating phase |
| US5850388A (en) | 1996-08-02 | 1998-12-15 | Wandel & Goltermann Technologies, Inc. | Protocol analyzer for monitoring digital transmission networks |
| US5987249A (en) | 1996-08-27 | 1999-11-16 | Numega Technologies | IR code instrumentation |
| US20020095661A1 (en) | 1996-08-27 | 2002-07-18 | Angel David J. | Byte code instrumentation |
| US6182157B1 (en) | 1996-09-19 | 2001-01-30 | Compaq Computer Corporation | Flexible SNMP trap mechanism |
| US5991881A (en) | 1996-11-08 | 1999-11-23 | Harris Corporation | Network surveillance system |
| US5974237A (en) | 1996-12-18 | 1999-10-26 | Northern Telecom Limited | Communications network monitoring |
| US6028842A (en) | 1996-12-23 | 2000-02-22 | Nortel Networks Corporation | Dynamic traffic conditioning |
| US6167398A (en) | 1997-01-30 | 2000-12-26 | British Telecommunications Public Limited Company | Information retrieval system and method that generates weighted comparison results to analyze the degree of dissimilarity between a reference corpus and a candidate document |
| US6026234A (en) | 1997-03-19 | 2000-02-15 | International Business Machines Corporation | Method and apparatus for profiling indirect procedure calls in a computer program |
| US6149318A (en) | 1997-04-15 | 2000-11-21 | Samuel C. Kendall | Link-time and run-time error detection, and program instrumentation |
| US6145121A (en) | 1997-04-17 | 2000-11-07 | University Of Washington | Trace based method for the analysis, benchmarking and tuning of object oriented databases and applications |
| US5948113A (en) | 1997-04-18 | 1999-09-07 | Microsoft Corporation | System and method for centrally handling runtime errors |
| US5901315A (en) | 1997-06-13 | 1999-05-04 | International Business Machines Corporation | Method for debugging a Java application having native method dynamic load libraries |
| US6222652B1 (en) | 1997-06-20 | 2001-04-24 | Nortel Networks Limited | Method of and apparatus for detecting transients in an optical transmission system |
| US6081797A (en) | 1997-07-09 | 2000-06-27 | American Heuristics Corporation | Adaptive temporal correlation network |
| US6484129B2 (en) | 1997-07-23 | 2002-11-19 | Candle Distributed Solutions, Inc. | End-to-end response time measurement for computer programs |
| US6154736A (en) | 1997-07-30 | 2000-11-28 | Microsoft Corporation | Belief networks with decision graphs |
| US6151701A (en) | 1997-09-30 | 2000-11-21 | Ahpah Software, Inc. | Method for reconstructing debugging information for a decompiled executable file |
| US6073089A (en) | 1997-10-22 | 2000-06-06 | Baker; Michelle | Systems and methods for adaptive profiling, fault detection, and alert generation in a changing environment which is measurable by at least two different measures of state |
| US6026237A (en) | 1997-11-03 | 2000-02-15 | International Business Machines Corporation | System and method for dynamic modification of class files |
| US6058102A (en) | 1997-11-07 | 2000-05-02 | Visual Networks Technologies, Inc. | Method and apparatus for performing service level analysis of communications network performance metrics |
| US6216119B1 (en) | 1997-11-19 | 2001-04-10 | Netuitive, Inc. | Multi-kernel neural network concurrent learning, monitoring, and forecasting system |
| US6118940A (en) | 1997-11-25 | 2000-09-12 | International Business Machines Corp. | Method and apparatus for benchmarking byte code sequences |
| US6061518A (en) | 1997-11-25 | 2000-05-09 | International Business Machines Corporation | Data processing system and method for debugging a JavaScript program |
| US6044335A (en) | 1997-12-23 | 2000-03-28 | At&T Corp. | Productivity metrics for application software systems |
| US6182022B1 (en) | 1998-01-26 | 2001-01-30 | Hewlett-Packard Company | Automated adaptive baselining and thresholding method and system |
| US6108800A (en) | 1998-02-10 | 2000-08-22 | Hewlett-Packard Company | Method and apparatus for analyzing the performance of an information system |
| US6138122A (en) | 1998-03-02 | 2000-10-24 | Agilent Technologies | Modeling of internet services |
| US6106572A (en) | 1998-03-25 | 2000-08-22 | Origins Software Company | Forward and reverse hierarchical page level debugger |
| US6108658A (en)* | 1998-03-30 | 2000-08-22 | International Business Machines Corporation | Single pass space efficent system and method for generating approximate quantiles satisfying an apriori user-defined approximation error |
| US6327677B1 (en) | 1998-04-27 | 2001-12-04 | Proactive Networks | Method and apparatus for monitoring a network environment |
| US20010052087A1 (en) | 1998-04-27 | 2001-12-13 | Atul R. Garg | Method and apparatus for monitoring a network environment |
| US6119074A (en) | 1998-05-20 | 2000-09-12 | Caterpillar Inc. | Method and apparatus of predicting a fault condition |
| US6327550B1 (en) | 1998-05-26 | 2001-12-04 | Computer Associates Think, Inc. | Method and apparatus for system state monitoring using pattern recognition and neural networks |
| US20020054169A1 (en) | 1998-05-29 | 2002-05-09 | Richardson David E. | Method and apparatus for dynamically drilling-down through a health monitoring map to determine the health status and cause of health problems associated with network objects of a managed network environment |
| US6359976B1 (en) | 1998-06-08 | 2002-03-19 | Inet Technologies, Inc. | System and method for monitoring service quality in a communications network |
| US6381306B1 (en) | 1998-06-08 | 2002-04-30 | Inet Technologies, Inc. | System and method for monitoring service quality in a communications network |
| US6119247A (en) | 1998-06-22 | 2000-09-12 | International Business Machines Corporation | Remote debugging of internet applications |
| US6453346B1 (en) | 1998-07-17 | 2002-09-17 | Proactivenet, Inc. | Method and apparatus for intelligent storage and reduction of network information |
| US6263298B1 (en) | 1998-08-13 | 2001-07-17 | Precise Software Solutions Ltd. | Method for analyzing system performance |
| US6269401B1 (en) | 1998-08-28 | 2001-07-31 | 3Com Corporation | Integrated computer system and network performance monitoring |
| US6553366B1 (en)* | 1998-10-02 | 2003-04-22 | Ncr Corporation | Analytic logical data model |
| US6466929B1 (en) | 1998-11-13 | 2002-10-15 | University Of Delaware | System for discovering implicit relationships in data and a method of using the same |
| US20020012011A1 (en) | 1998-12-04 | 2002-01-31 | Michael Roytman | Alarm manager system for distributed network management system |
| US6505246B1 (en) | 1998-12-30 | 2003-01-07 | Candle Distributed Solutions, Inc. | User interface for system management applications |
| US6405250B1 (en) | 1999-01-25 | 2002-06-11 | Lucent Technologies Inc. | Network management system based on passive monitoring and proactive management for formulation behavior state transition models |
| US20020133757A1 (en) | 1999-02-23 | 2002-09-19 | Randal Lee Bertram | System and method for predicting computer system performance and for making recommendations for improving its performance |
| US6470464B2 (en) | 1999-02-23 | 2002-10-22 | International Business Machines Corporation | System and method for predicting computer system performance and for making recommendations for improving its performance |
| US6513065B1 (en) | 1999-03-04 | 2003-01-28 | Bmc Software, Inc. | Enterprise management system and method which includes summarization having a plurality of levels of varying granularity |
| US6343288B1 (en)* | 1999-03-12 | 2002-01-29 | International Business Machines Corporation | Single pass space efficient system and method for generating an approximate quantile in a data set having an unknown size |
| US6446058B1 (en) | 1999-04-26 | 2002-09-03 | At&T Corp. | Computer platform alarm and control system |
| US6377907B1 (en) | 1999-11-17 | 2002-04-23 | Mci Worldcom, Inc. | System and method for collating UNIX performance metrics |
| US20020152305A1 (en) | 2000-03-03 | 2002-10-17 | Jackson Gregory J. | Systems and methods for resource utilization analysis in information management environments |
| US20020049838A1 (en) | 2000-06-21 | 2002-04-25 | Sylor Mark W. | Liveexception system |
| US20020019870A1 (en) | 2000-06-29 | 2002-02-14 | International Business Machines Corporation | Proactive on-line diagnostics in a manageable network |
| US20020111755A1 (en) | 2000-10-19 | 2002-08-15 | Tti-Team Telecom International Ltd. | Topology-based reasoning apparatus for root-cause analysis of network faults |
| US20020152304A1 (en) | 2000-10-26 | 2002-10-17 | Metilinx | Aggregate system resource analysis including correlation matrix and metric-based analysis |
| US20020123865A1 (en) | 2001-01-02 | 2002-09-05 | Whitney Paul D. | Method for generating analyses of categorical data |
| US20020152185A1 (en) | 2001-01-03 | 2002-10-17 | Sasken Communication Technologies Limited | Method of network modeling and predictive event-correlation in a communication system by the use of contextual fuzzy cognitive maps |
| US20020090134A1 (en) | 2001-01-10 | 2002-07-11 | Koninklijke Philips Electronics N.V. | System and method for providing a scalable objective metric for automatic video quality evaluation employing interdependent objective metrics |
| US20030014692A1 (en) | 2001-03-08 | 2003-01-16 | California Institute Of Technology | Exception analysis for multimissions |
| US20020158918A1 (en) | 2001-03-28 | 2002-10-31 | Sarnoff Corporation | Method and apparatus for visualizing correlations among and between objects and events |
| US20020184065A1 (en) | 2001-03-30 | 2002-12-05 | Cody Menard | System and method for correlating and diagnosing system component performance data |
| US20020173997A1 (en) | 2001-03-30 | 2002-11-21 | Cody Menard | System and method for business systems transactions and infrastructure management |
| US20030023712A1 (en) | 2001-03-30 | 2003-01-30 | Zhao Ling Z. | Site monitor |
| US20020174174A1 (en) | 2001-04-13 | 2002-11-21 | Anupriya Ramraj | System and method for monitoring execution time of a transaction |
| US20020184615A1 (en) | 2001-04-25 | 2002-12-05 | Sumner William Earl | System and method for selectively and automatically modifying the source code of a computer program |
| US20020159386A1 (en) | 2001-04-30 | 2002-10-31 | Gilbert Grosdidier | Method for dynamical identification of network congestion characteristics |
| US20020165892A1 (en) | 2001-05-03 | 2002-11-07 | Doug Grumann | Method and apparatus to extract the health of a service from a host machine |
| US20020198985A1 (en) | 2001-05-09 | 2002-12-26 | Noam Fraenkel | Post-deployment monitoring and analysis of server performance |
| US20020169870A1 (en) | 2001-05-10 | 2002-11-14 | Frank Vosseler | Method, system and computer program product for monitoring objects in an it network |
| US20020198879A1 (en) | 2001-05-11 | 2002-12-26 | Schwarcz Lawrence R. | Method of formatting values in a fixed number of spaces using the java programming language |
| US6865295B2 (en)* | 2001-05-11 | 2005-03-08 | Koninklijke Philips Electronics N.V. | Palette-based histogram matching with recursive histogram vector generation |
| US20020183972A1 (en) | 2001-06-01 | 2002-12-05 | Enck Brent A. | Adaptive performance data measurement and collections |
| US20030018494A1 (en) | 2001-06-14 | 2003-01-23 | Alexandre Bronstein | Assessing health of a subsystem or service within a networked system |
| US20030009507A1 (en) | 2001-06-29 | 2003-01-09 | Annie Shum | System and method for application performance management |
| US20030005362A1 (en) | 2001-06-29 | 2003-01-02 | Miller Jennifer J. | System and method of automatic information collection and problem solution generation for computer storage devices |
| US20030018241A1 (en) | 2001-07-19 | 2003-01-23 | Nellcor Puritan Bennett Inc. | Nuisance alarm reductions in a physiological monitor |
| US20030028631A1 (en) | 2001-07-31 | 2003-02-06 | Rhodes N. Lee | Network usage analysis system and method for updating statistical models |
| US20030033404A1 (en) | 2001-08-09 | 2003-02-13 | Richardson David E. | Method for automatically monitoring a network |
Non-Patent Citations (32)
| Title |
|---|
| "Jikes Bytecode Toolkit," IBM Internet Web-site, May 2000, pp. 1-2. |
| Buzen, et al., "MASF-Multivariate Adaptive Statistical Filtering," BGS Systems, Inc. |
| Chen et al., 'Quantile and Histogram Estimation', 2001, Winter Simulation Conference, pp. 451-459.* |
| Chou, et al., "Transforming Non-Normal Data to Normality in Statistical Process Control," Journal of Quality Technology, 1998, vol. 30, No. 2. |
| Cuéllar, J, "Statistical Process Control for Nonnormally Distributed Variables Through the Use of Transformations," Advanced Semiconductor Manufacturing Conference and Workshop, 1991. ASMC 91 Proceedings. IEEE/SEMI 1991 Boston, MA, USA; Oct. 21-23, 1991, New York, NY, USA, IEEE, US, Oct. 21, 1991, pp. 143-148. |
| DataMyte Handbook, "Control Charts," Chapter 2; "Constants for Calculating Control Limits," Appendix-Table A-1, DataMyte Business, Allen-Bradley Company, Inc., 1987. |
| DataMyte Handbook, "Non-Normal Distributions, Johnson Transformations," DataMyte Business, Allen-Bradley Company, Inc., Chapter 6, 1995. |
| Engineering Statistical Handbook, Online, "Chi Square Goodness-of-Fit Test," Jun. 25, 2001, pp. 1-5. |
| Engineering Statistical Handbook, Online, "What are Moving Average or Smoothing Techniques?," Jul. 13, 2001, pp. 1-4. |
| Enigineering Statistical Handbook, Online, "Anderson-Darling Test," Apr. 17, 2001, pp. 1-5. |
| Epstein et al., "Educator's Symposium-Introducing Object-orientedness into a Breadth-first Introductory Curriculum," OOPSLA 1992, Addendum to the Proceedings, Vancouver, British Columbia, Canada, Oct. 5-10, 1992, pp. 293-298. |
| Evans, et al., "Statistical Distributions," Third Edition, chapter 19- Gamma Distribution, p. 98-105, 2000. |
| Gilchrist, Warren G., "Statistical Modeling With Quantile Functions," chapter 1-An Overview, p. 1-17; chapter 2- Describing a Sample, p. 43-50, 2000. |
| Grummitt, Adam, "Automated Performance Management Advice Using Computational Intelligence," Metron Technology Limited. |
| Gunther, Neil J., "The Practical Perofrmance Analyst-Performance-By-Design Techniques for Distributed Systems," 1998, p. 12-15. |
| Han Bok Lee, "BIT: A Tool for Instrumenting Java Bytecodes," Department of Colorado Science, Aug. 1997, pp. 73-82. |
| Han, et al., "Datat Mining Concepts and Techniques," chapter 8- Cluster Analysis, p. -, 2001. |
| Hellerstein, et al., "Characterizing Normal Operation of a Web Server: Application to Workload Forecasting and Problem Detection," Proceedings of the Computer Measurement Group, 1998. |
| Lee, J.L., "Application of Statistical Process Control Methods to the Establishment of Process Alarms in a Distributed Process Control System," ISA Transactions, Instrument Society of America. Pittsburgh, US, vol. 30, No. 1, 1991, pp. 59-64. |
| Papoulis, Athanssios, "Probability, Random Variables, and Stochastic Processes," chapter 5-Functions of One Random Variable, p. 116-127, 1965. |
| Parthasarathy, et al., "NetProf: Network-based High-level Profiling of Java Bytecode," The University of Rochester Computer Science Department, May 1996, pp. 1-15. |
| Peterson, et al., "Fractal Patterns in DASD I/O Traffic." |
| Press, et al., "Numerical Recipes in C," Second Edition, chapter 6- Special Functions, p. 212-222; chapter 14- Statistical Description of Data-Nonparametric or Rank Correlation, p. 639-642, 1992. |
| Puzicha et al., 'Histogram Clustering for Unsupervised Segmentation and Image Retrieval', Jun. 1999, Elsevier Publication, pp. 1-15.* |
| Rosenberg et al., 'A Heuristic Framework for Source Policing in ATM Networks', Aug. 1994, IEEE Publicaiton, vol. 2, No. 4, pp. 387-397.* |
| Rundensteiner, E.A., "Design Tool Integration Using Object-Oriented Database Views," IEEE, 1993, pp. 104-107. |
| Shapiro, Samuel S., "How to Test Normality and Other distrubitonal Assumptions," American Society for Quality Control, Statistics Division, 1990. |
| Studer, 'Stochastic Taylor Expansions and Saddlepoint Approximation for Risk Management', Thesis Dissertation, Feb. 2001, pp. 1-155.* |
| Thottan, et al., "Adaptive Thresholding for Proactive Network Problem Detection," Rensselaer Polytechnic Institute, Department of Electrical , Computer, and Systems Engineering. |
| Walpole, et al., "Probability and Statistics for Engineers and Scientists," 1998, p. 213-215, 340-343. |
| Wheeler D.J. et al., "Understanding Statistical Process Control," Chapters 3-4, 1986, Statistical Process Controls, Inc., Knoxville, Tennessee, USA, pp. 41-97. |
| Wheeler, Robert, E., "Quantile Estimators of Johnson Curve Parameters," E.I. du Pont de Nemours & Co. |
Cited By (56)
| Publication number | Priority date | Publication date | Assignee | Title |
|---|---|---|---|---|
| US8823958B2 (en) | 2002-02-18 | 2014-09-02 | Canon Kabushiki Kaisha | Image processing apparatus, information processing apparatus, and information output method |
| US8159691B2 (en) | 2002-02-18 | 2012-04-17 | Canon Kabushiki Kaisha | Image processing apparatus, information processing apparatus, and information output method |
| US7965399B2 (en)* | 2002-02-18 | 2011-06-21 | Canon Kabushiki Kaisha | Image processing apparatus, information processing apparatus, and information output method |
| US20040246512A1 (en)* | 2002-02-18 | 2004-12-09 | Ryosuke Miyamoto | Image processing apparatus, information processing apparatus, and information output method |
| US20110194134A1 (en)* | 2002-02-18 | 2011-08-11 | Canon Kabushiki Kaisha | Image processing apparatus, information processing apparatus, and information output method |
| US20080016412A1 (en)* | 2002-07-01 | 2008-01-17 | Opnet Technologies, Inc. | Performance metric collection and automated analysis |
| US7444263B2 (en) | 2002-07-01 | 2008-10-28 | Opnet Technologies, Inc. | Performance metric collection and automated analysis |
| US7388998B2 (en)* | 2003-07-04 | 2008-06-17 | Ed-Tech Co., Ltd. | Apparatus and method for controlling brightness of moving image signals in real time |
| US20050002565A1 (en)* | 2003-07-04 | 2005-01-06 | Ed-Tech Co., Ltd. | Apparatus and method for controlling brightness of moving image signals in real time |
| US20100053313A1 (en)* | 2003-10-02 | 2010-03-04 | Eli Horn | System and method for presentation of data streams |
| US8144152B2 (en)* | 2003-10-02 | 2012-03-27 | Given Imaging, Ltd. | System and method for presentation of data streams |
| US20050289232A1 (en)* | 2004-06-07 | 2005-12-29 | Rudiger Ebert | Method, apparatus, and system for monitoring performance remotely from a user |
| US8290962B1 (en)* | 2005-09-28 | 2012-10-16 | Google Inc. | Determining the relationship between source code bases |
| US20070156479A1 (en)* | 2005-11-02 | 2007-07-05 | Long Erik T | Multivariate statistical forecasting system, method and software |
| US20100030517A1 (en)* | 2006-11-28 | 2010-02-04 | Rohde & Schwarz Gmbh & Co. Kg | Method and device for the determination of a statistical measurement value |
| US8630818B2 (en)* | 2006-11-28 | 2014-01-14 | Rohde & Schwarz GmgH & Co. KG | Method and device for the determination of a statistical measurement value |
| US20100174540A1 (en)* | 2007-07-13 | 2010-07-08 | Dolby Laboratories Licensing Corporation | Time-Varying Audio-Signal Level Using a Time-Varying Estimated Probability Density of the Level |
| US9698743B2 (en)* | 2007-07-13 | 2017-07-04 | Dolby Laboratories Licensing Corporation | Time-varying audio-signal level using a time-varying estimated probability density of the level |
| US20090138238A1 (en)* | 2007-11-28 | 2009-05-28 | Yury Bakshi | Sequential fixed-point quantile estimation |
| US8000929B2 (en) | 2007-11-28 | 2011-08-16 | At&T Intellectual Property I, L.P. | Sequential fixed-point quantile estimation |
| US7979406B2 (en) | 2008-06-16 | 2011-07-12 | International Business Machines Corporation | Compress transaction data using serial micro-trends |
| US9538937B2 (en) | 2008-06-18 | 2017-01-10 | Covidien Lp | System and method of evaluating a subject with an ingestible capsule |
| US20100292995A1 (en)* | 2009-05-18 | 2010-11-18 | Tian Bu | Method and apparatus for incremental quantile estimation |
| US8768938B2 (en)* | 2009-06-25 | 2014-07-01 | Hewlett-Packard Development Company, L.P. | Histogram processing by trend and pattern removal |
| US20100332494A1 (en)* | 2009-06-25 | 2010-12-30 | Goetz Graefe | Histogram processing by trend and pattern removal |
| US20110010337A1 (en)* | 2009-07-10 | 2011-01-13 | Tian Bu | Method and apparatus for incremental quantile tracking of multiple record types |
| US8666946B2 (en) | 2009-07-10 | 2014-03-04 | Alcatel Lucent | Incremental quantile tracking of multiple record types |
| US8589329B2 (en)* | 2009-07-10 | 2013-11-19 | Alcatel Lucent | Method and apparatus for incremental tracking of multiple quantiles |
| US20110010327A1 (en)* | 2009-07-10 | 2011-01-13 | Tian Bu | Method and apparatus for incremental tracking of multiple quantiles |
| US20110153603A1 (en)* | 2009-12-17 | 2011-06-23 | Yahoo! Inc. | Time series storage for large-scale monitoring system |
| US20110154340A1 (en)* | 2009-12-18 | 2011-06-23 | Fujitsu Limited | Recording medium storing operation management program, operation management apparatus and method |
| US8850435B2 (en)* | 2009-12-18 | 2014-09-30 | Fujitsu Limited | Detecting bottleneck condition based on frequency distribution of sampled counts of processing requests |
| US20110179360A1 (en)* | 2010-01-19 | 2011-07-21 | Livevol Inc. | System and method for presenting option data using animated 3-dimensional graphical display |
| US8799783B2 (en)* | 2010-01-19 | 2014-08-05 | Livevol, Inc. | System and method for presenting option data using animated 3-dimensional graphical display |
| US20110218978A1 (en)* | 2010-02-22 | 2011-09-08 | Vertica Systems, Inc. | Operating on time sequences of data |
| US8873816B1 (en) | 2011-04-06 | 2014-10-28 | Given Imaging Ltd. | Method and system for identification of red colored pathologies in vivo |
| US10223817B2 (en) | 2011-07-11 | 2019-03-05 | International Business Machines Corporation | Displaying computer dashboard information |
| US20130019197A1 (en)* | 2011-07-11 | 2013-01-17 | International Business Machines Corporation | Displaying computer dashboard information |
| US9218676B2 (en)* | 2011-07-11 | 2015-12-22 | International Business Machines Corporation | Displaying computer dashboard information |
| US8600915B2 (en) | 2011-12-19 | 2013-12-03 | Go Daddy Operating Company, LLC | Systems for monitoring computer resources |
| US8719196B2 (en) | 2011-12-19 | 2014-05-06 | Go Daddy Operating Company, LLC | Methods for monitoring computer resources using a first and second matrix, and a feature relationship tree |
| US9545192B2 (en) | 2012-05-04 | 2017-01-17 | Given Imaging Ltd. | System and method for automatic navigation of a capsule based on image stream captured in-vivo |
| US20130325825A1 (en)* | 2012-05-29 | 2013-12-05 | Scott Pope | Systems And Methods For Quantile Estimation In A Distributed Data System |
| US9507833B2 (en) | 2012-05-29 | 2016-11-29 | Sas Institute Inc. | Systems and methods for quantile determination in a distributed data system |
| US9268796B2 (en)* | 2012-05-29 | 2016-02-23 | Sas Institute Inc. | Systems and methods for quantile estimation in a distributed data system |
| US9703852B2 (en) | 2012-05-29 | 2017-07-11 | Sas Institute Inc. | Systems and methods for quantile determination in a distributed data system using sampling |
| US10405734B2 (en) | 2012-06-29 | 2019-09-10 | Given Imaging Ltd. | System and method for displaying an image stream |
| US9324145B1 (en) | 2013-08-08 | 2016-04-26 | Given Imaging Ltd. | System and method for detection of transitions in an image stream of the gastrointestinal tract |
| US9747642B1 (en)* | 2013-08-12 | 2017-08-29 | Financial Realizer, LLC | Automated method of identifying stock indexes which are historically high or low relative to a plurality of macroeconomic indicators |
| US10055460B2 (en)* | 2013-09-04 | 2018-08-21 | Arm Limited | Analysis of parallel processing systems |
| US20160203188A1 (en)* | 2013-09-04 | 2016-07-14 | Allinea Software Limited | Analysis of Parallel Processing Systems |
| US20160078654A1 (en)* | 2014-09-17 | 2016-03-17 | Circonus, Inc. | Efficient time-series histograms |
| US10282874B2 (en)* | 2014-09-17 | 2019-05-07 | Circonus, Inc. | Efficient time-series histograms |
| US10839042B1 (en)* | 2016-06-22 | 2020-11-17 | EMC IP Holding Company LLC | Summarizing and querying data generated from multiple scenarios of a data-intensive simulation |
| US10127192B1 (en) | 2017-09-26 | 2018-11-13 | Sas Institute Inc. | Analytic system for fast quantile computation |
| US11176109B2 (en) | 2019-07-15 | 2021-11-16 | Microsoft Technology Licensing, Llc | Time-series data condensation and graphical signature analysis |
Also Published As
| Publication number | Publication date |
|---|---|
| US20030088542A1 (en) | 2003-05-08 |
Similar Documents
| Publication | Publication Date | Title |
|---|---|---|
| US7219034B2 (en) | System and methods for display of time-series data distribution | |
| EP1695192A2 (en) | Automatic monitoring and statistical analysis of dynamic process metrics to expose meaningful changes | |
| US8583649B2 (en) | Method and system for clustering data points | |
| US7826663B2 (en) | Real time analytics using hybrid histograms | |
| US20140280880A1 (en) | Fast OLAP for Real User Measurement of Website Performance | |
| US6108658A (en) | Single pass space efficent system and method for generating approximate quantiles satisfying an apriori user-defined approximation error | |
| US8694427B2 (en) | Time-efficient and deterministic adaptive score calibration techniques for maintaining a predefined score distribution | |
| US9507833B2 (en) | Systems and methods for quantile determination in a distributed data system | |
| US7353218B2 (en) | Methods and apparatus for clustering evolving data streams through online and offline components | |
| US20100257092A1 (en) | System and method for predicting a measure of anomalousness and similarity of records in relation to a set of reference records | |
| US20030214504A1 (en) | Method for visualizing graphical data sets having a non-uniform graphical density for display | |
| US20100082469A1 (en) | Constrained Optimized Binning For Scorecards | |
| US7031884B1 (en) | System and method for analyzing data streams | |
| US20070096959A1 (en) | Method and system for determining an optimal or near optimal set of contexts by constructing a multi-directional context tree | |
| CN119576505B (en) | Multi-task monitoring and scheduling method and system | |
| CN113128875A (en) | Root cause positioning method and device for index abnormity of multi-dimensional data set | |
| CN107273234A (en) | A kind of time series data rejecting outliers and bearing calibration based on EEMD | |
| CA2374298A1 (en) | Computation of frequent data values | |
| CN113610629A (en) | Method and device for screening client data features from large-scale feature set | |
| CN111858600A (en) | Data wide table construction method, device, equipment and storage medium | |
| CN116579729A (en) | Service data processing method and device | |
| US6434570B1 (en) | Method and apparatus for estimating a percentile for a value | |
| Dorfman | A numerical Bayesian test for cointegration of AR processes | |
| EP1195694A2 (en) | Automatic determination of OLAP Cube dimensions | |
| US20060116945A1 (en) | Apparatus of quantifying operational risk, and method therefor |
Legal Events
| Date | Code | Title | Description |
|---|---|---|---|
| AS | Assignment | Owner name:ALTAWORKS CORPORATION, NEW HAMPSHIRE Free format text:ASSIGNMENT OF ASSIGNORS INTEREST;ASSIGNORS:MCGEE, JOHN J.;COURTEMANCHE, MICHEAL B.;BECK, RALPH L.;REEL/FRAME:013443/0031;SIGNING DATES FROM 20020923 TO 20021016 | |
| AS | Assignment | Owner name:OPNET TECHNOLOGIES, INC., MARYLAND Free format text:MERGER;ASSIGNOR:ALTAWORKS CORPORATION;REEL/FRAME:017057/0816 Effective date:20041227 | |
| STCF | Information on status: patent grant | Free format text:PATENTED CASE | |
| FPAY | Fee payment | Year of fee payment:4 | |
| FEPP | Fee payment procedure | Free format text:PAYOR NUMBER ASSIGNED (ORIGINAL EVENT CODE: ASPN); ENTITY STATUS OF PATENT OWNER: LARGE ENTITY | |
| AS | Assignment | Owner name:MORGAN STANLEY & CO. LLC, MARYLAND Free format text:SECURITY AGREEMENT;ASSIGNORS:RIVERBED TECHNOLOGY, INC.;OPNET TECHNOLOGIES, INC.;REEL/FRAME:029646/0060 Effective date:20121218 | |
| AS | Assignment | Owner name:OPNET TECHNOLOGIES LLC, MARYLAND Free format text:CHANGE OF NAME;ASSIGNOR:OPNET TECHNOLOGIES, INC.;REEL/FRAME:030411/0234 Effective date:20130401 | |
| AS | Assignment | Owner name:RIVERBED TECHNOLOGY, INC., CALIFORNIA Free format text:ASSIGNMENT OF ASSIGNORS INTEREST;ASSIGNOR:OPNET TECHNOLOGIES LLC;REEL/FRAME:030462/0135 Effective date:20130401 | |
| AS | Assignment | Owner name:RIVERBED TECHNOLOGY, INC., CALIFORNIA Free format text:RELEASE OF PATENT SECURITY INTEREST;ASSIGNOR:MORGAN STANLEY & CO. LLC, AS COLLATERAL AGENT;REEL/FRAME:032113/0425 Effective date:20131220 | |
| AS | Assignment | Owner name:JPMORGAN CHASE BANK, N.A., AS ADMINISTRATIVE AGENT, NEW YORK Free format text:PATENT SECURITY AGREEMENT;ASSIGNOR:RIVERBED TECHNOLOGY, INC.;REEL/FRAME:032421/0162 Effective date:20131220 Owner name:JPMORGAN CHASE BANK, N.A., AS ADMINISTRATIVE AGENT Free format text:PATENT SECURITY AGREEMENT;ASSIGNOR:RIVERBED TECHNOLOGY, INC.;REEL/FRAME:032421/0162 Effective date:20131220 | |
| FPAY | Fee payment | Year of fee payment:8 | |
| AS | Assignment | Owner name:RIVERBED TECHNOLOGY, INC., CALIFORNIA Free format text:RELEASE OF SECURITY INTEREST IN PATENTS;ASSIGNOR:BARCLAYS BANK PLC;REEL/FRAME:035521/0069 Effective date:20150424 | |
| AS | Assignment | Owner name:MORGAN STANLEY SENIOR FUNDING, INC., AS COLLATERAL AGENT, NEW YORK Free format text:SECURITY INTEREST;ASSIGNOR:RIVERBED TECHNOLOGY, INC.;REEL/FRAME:035561/0363 Effective date:20150424 Owner name:MORGAN STANLEY SENIOR FUNDING, INC., AS COLLATERAL Free format text:SECURITY INTEREST;ASSIGNOR:RIVERBED TECHNOLOGY, INC.;REEL/FRAME:035561/0363 Effective date:20150424 | |
| AS | Assignment | Owner name:RIVERBED TECHNOLOGY, INC., CALIFORNIA Free format text:CORRECTIVE ASSIGNMENT TO CORRECT THE CONVEYING PARTY NAME PREVIOUSLY RECORDED ON REEL 035521 FRAME 0069. ASSIGNOR(S) HEREBY CONFIRMS THE RELEASE OF SECURITY INTEREST IN PATENTS;ASSIGNOR:JPMORGAN CHASE BANK, N.A.;REEL/FRAME:035807/0680 Effective date:20150424 | |
| MAFP | Maintenance fee payment | Free format text:PAYMENT OF MAINTENANCE FEE, 12TH YEAR, LARGE ENTITY (ORIGINAL EVENT CODE: M1553); ENTITY STATUS OF PATENT OWNER: LARGE ENTITY Year of fee payment:12 | |
| AS | Assignment | Owner name:ATERNITY LLC, MASSACHUSETTS Free format text:ASSIGNMENT OF ASSIGNORS INTEREST;ASSIGNOR:RIVERBED TECHNOLOGY, INC.;REEL/FRAME:054778/0540 Effective date:20200101 | |
| AS | Assignment | Owner name:MACQUARIE CAPITAL FUNDING LLC, NEW YORK Free format text:SECURITY INTEREST;ASSIGNORS:RIVERBED HOLDINGS, INC.;RIVERBED TECHNOLOGY, INC.;ATERNITY LLC;REEL/FRAME:056397/0750 Effective date:20210420 | |
| AS | Assignment | Owner name:ATERNITY LLC, CALIFORNIA Free format text:RELEASE OF SECURITY INTEREST IN PATENTS RECORED AT REEL 056397, FRAME 0750;ASSIGNOR:MACQUARIE CAPITAL FUNDING LLC;REEL/FRAME:057983/0356 Effective date:20211012 Owner name:RIVERBED TECHNOLOGY, INC., CALIFORNIA Free format text:RELEASE OF SECURITY INTEREST IN PATENTS RECORED AT REEL 056397, FRAME 0750;ASSIGNOR:MACQUARIE CAPITAL FUNDING LLC;REEL/FRAME:057983/0356 Effective date:20211012 Owner name:RIVERBED HOLDINGS, INC., CALIFORNIA Free format text:RELEASE OF SECURITY INTEREST IN PATENTS RECORED AT REEL 056397, FRAME 0750;ASSIGNOR:MACQUARIE CAPITAL FUNDING LLC;REEL/FRAME:057983/0356 Effective date:20211012 | |
| AS | Assignment | Owner name:ALTER DOMUS (US) LLC, AS COLLATERAL AGENT, ILLINOIS Free format text:PATENT SECURITY AGREEMENT SUPPLEMENT - SECOND LIEN;ASSIGNORS:RIVERBED HOLDINGS, INC.;RIVERBED TECHNOLOGY, INC.;ATERNITY LLC;REEL/FRAME:057810/0559 Effective date:20211013 Owner name:MORGAN STANLEY SENIOR FUNDING, INC., AS COLLATERAL AGENT, MARYLAND Free format text:PATENT SECURITY AGREEMENT SUPPLEMENT - FIRST LIEN;ASSIGNORS:RIVERBED HOLDINGS, INC.;RIVERBED TECHNOLOGY, INC.;ATERNITY LLC;REEL/FRAME:057810/0502 Effective date:20211013 | |
| AS | Assignment | Owner name:WILMINGTON TRUST, NATIONAL ASSOCIATION, MINNESOTA Free format text:PATENT SECURITY AGREEMENT;ASSIGNORS:RIVERBED TECHNOLOGY, INC.;ATERNITY LLC;REEL/FRAME:057943/0386 Effective date:20211013 | |
| AS | Assignment | Owner name:WILMINGTON TRUST, NATIONAL ASSOCIATION, AS U.S. COLLATERAL AGENT, MINNESOTA Free format text:SECURITY INTEREST;ASSIGNORS:RIVERBED TECHNOLOGY LLC (FORMERLY RIVERBED TECHNOLOGY, INC.);ATERNITY LLC;REEL/FRAME:058486/0216 Effective date:20211207 | |
| AS | Assignment | Owner name:ATERNITY LLC, MASSACHUSETTS Free format text:TERMINATION AND RELEASE OF SECURITY INTEREST IN PATENTS;ASSIGNOR:WILMINGTON TRUST, NATIONAL ASSOCIATION, AS U.S. COLLATERAL AGENT;REEL/FRAME:058593/0169 Effective date:20211207 Owner name:RIVERBED TECHNOLOGY, INC., CALIFORNIA Free format text:TERMINATION AND RELEASE OF SECURITY INTEREST IN PATENTS;ASSIGNOR:WILMINGTON TRUST, NATIONAL ASSOCIATION, AS U.S. COLLATERAL AGENT;REEL/FRAME:058593/0169 Effective date:20211207 Owner name:ATERNITY LLC, MASSACHUSETTS Free format text:TERMINATION AND RELEASE OF SECURITY INTEREST IN PATENTS;ASSIGNOR:ALTER DOMUS (US) LLC, AS COLLATERAL AGENT;REEL/FRAME:058593/0108 Effective date:20211207 Owner name:RIVERBED TECHNOLOGY, INC., CALIFORNIA Free format text:TERMINATION AND RELEASE OF SECURITY INTEREST IN PATENTS;ASSIGNOR:ALTER DOMUS (US) LLC, AS COLLATERAL AGENT;REEL/FRAME:058593/0108 Effective date:20211207 Owner name:ATERNITY LLC, MASSACHUSETTS Free format text:TERMINATION AND RELEASE OF SECURITY INTEREST IN PATENTS;ASSIGNOR:MORGAN STANLEY SENIOR FUNDING, INC., AS COLLATERAL AGENT;REEL/FRAME:058593/0046 Effective date:20211207 Owner name:RIVERBED TECHNOLOGY, INC., CALIFORNIA Free format text:TERMINATION AND RELEASE OF SECURITY INTEREST IN PATENTS;ASSIGNOR:MORGAN STANLEY SENIOR FUNDING, INC., AS COLLATERAL AGENT;REEL/FRAME:058593/0046 Effective date:20211207 | |
| AS | Assignment | Owner name:RIVERBED TECHNOLOGY LLC, CALIFORNIA Free format text:CHANGE OF NAME;ASSIGNOR:RIVERBED TECHNOLOGY, INC.;REEL/FRAME:059009/0906 Effective date:20211207 | |
| AS | Assignment | Owner name:RIVERBED HOLDINGS, INC., CALIFORNIA Free format text:RELEASE BY SECURED PARTY;ASSIGNOR:ALTER DOMUS (US) LLC, AS COLLATERAL AGENT;REEL/FRAME:064673/0739 Effective date:20211207 Owner name:ATERNITY LLC, MASSACHUSETTS Free format text:RELEASE BY SECURED PARTY;ASSIGNOR:ALTER DOMUS (US) LLC, AS COLLATERAL AGENT;REEL/FRAME:064673/0739 Effective date:20211207 Owner name:RIVERBED TECHNOLOGY, INC., CALIFORNIA Free format text:RELEASE BY SECURED PARTY;ASSIGNOR:ALTER DOMUS (US) LLC, AS COLLATERAL AGENT;REEL/FRAME:064673/0739 Effective date:20211207 |